 XiaoSheng Li1†
 Zongning Chen2†Hexian Jiao2†
 BinYang Wang1Hui Yin1LuJia Chen1Hongling Shi3*Yong Yin1*
 Dongdong Qin4*
- 1Department of Rehabilitation Medicine, The Affiliated Hospital of Yunnan University, Kunming, China
- 2Department of Research and Teaching, Lijiang People’s Hospital, Lijiang, China
- 3Department of Rehabilitation Medicine, The Third People’s Hospital of Yunnan Province, Kunming, China
- 4Key Laboratory of Traditional Chinese Medicine for Prevention and Treatment of Neuropsychiatric Diseases, Yunnan University of Chinese Medicine, Kunming, China
Objective: Cognitive impairment is a detrimental complication of stroke that compromises the quality of life of the patients and poses a huge burden on society. Due to the lack of effective early prediction tools in clinical practice, many researchers have introduced machine learning (ML) into the prediction of post-stroke cognitive impairment (PSCI). However, the mathematical models for ML are diverse, and their accuracy remains highly contentious. Therefore, this study aimed to examine the efficiency of ML in the prediction of PSCI.
Methods: Relevant articles were retrieved from Cochrane, Embase, PubMed, and Web of Science from the inception of each database to 5 December 2022. Study quality was evaluated by PROBAST, and c-index, sensitivity, specificity, and overall accuracy of the prediction models were meta-analyzed.
Results: A total of 21 articles involving 7,822 stroke patients (2,876 with PSCI) were included. The main modeling variables comprised age, gender, education level, stroke history, stroke severity, lesion volume, lesion site, stroke subtype, white matter hyperintensity (WMH), and vascular risk factors. The prediction models used were prediction nomograms constructed based on logistic regression. The pooled c-index, sensitivity, and specificity were 0.82 (95% CI 0.77–0.87), 0.77 (95% CI 0.72–0.80), and 0.80 (95% CI 0.71–0.86) in the training set, and 0.82 (95% CI 0.77–0.87), 0.82 (95% CI 0.70–0.90), and 0.80 (95% CI 0.68–0.82) in the validation set, respectively.
Conclusion: ML is a potential tool for predicting PSCI and may be used to develop simple clinical scoring scales for subsequent clinical use.
Systematic Review Registration: https://www.crd.york.ac.uk/prospero/display_record.php?RecordID=383476.
1. Introduction
Stroke is a serious condition and a leading cause of death and long-term disability, which places a huge burden worldwide (1). Post-stroke cognitive impairment (PSCI) is a prevalent prognosis and cause of death following a stroke. Stroke patients have a higher incidence of 1-year cognitive impairment than non-stroke populations (2, 3). As society and economy progress, more emphasis is placed on disease and health, especially cognitive impairment. Early identification and diagnosis of PSCI, as well as early prophylaxis and treatment, can help improve stroke patient’s prognosis and reduce social and economic burdens.
Clinical tools for early PSCI diagnosis in stroke patients are currently lacking. Researchers have tried to apply existing cognitive impairment risk prediction models constructed based on the general population to the prediction of PSCI, but their predictive performance was not ideal in stroke patients (4). As a result, researchers have shifted their focus to machine learning (ML) in the hopes of developing more accurate PSCI prediction models. ML is an emerging field in medicine that utilizes computer science and statistics to solve healthcare problems (5). In recent years, ML has been increasingly applied to stroke research, and it was shown that ML-based stroke image prediction can outperform existing prediction tools (6). However, the diversity in mathematical modeling and sensitivity of ML algorithms to factors such as patient sampling, missing data and sample size continue to fuel debates over the accuracy of these models in disease prediction.
The performance of existing stroke prediction models has been inconsistent due to the use of different types of ML (e.g., logistic regression or other alternative) and modeling variables. In these predictive models, there are differences in the types of machine learning utilized, with most researchers using logistic regression while some may consider it lacking and opt for alternative models. Furthermore, we note discrepancies in the selection of modeling variables, which ultimately contributes to the uncertainty of their results. Unfortunately, evidence-based studies investigating the efficiency of ML in the prediction of PSCI are still lacking. As a result, the aim of this study is to examine the predictive accuracy of ML in PSCI and comprehensively summarize the modeling variables included in this prediction model in order to provide a useful reference for the subsequent development of simple clinical prediction tools.
2. Materials and methods
This study was conducted following the Preferred Reporting Items for Systematic Reviews and Meta-Analyses guidelines (Supplementary material) (7).
This study has been registered in PROSPERO (CRD42022383476).
2.1. Eligibility criteria
2.1.1. Inclusion criteria
1. Patients diagnosed with ischemic stroke or hemorrhagic stroke.
2. Randomized-controlled trials (RCTs), case–control studies, cohort studies, and case-cohort studies.
3. Complete construction of a ML prediction model for PSCI.
4. Studies without external validation are also included.
5. Different studies published using the same data set.
6. Studies reported in English.
2.1.2. Exclusion criteria
1. Meta-analysis, review, guidelines, and expert opinions.
2. Only risk factor analysis was performed and lacks a complete ML model.
3. Missing outcome measures (ROC, c-statistic, c-index, sensitivity, specificity, accuracy, recovery rate, accuracy rate, confusion matrix, diagnosis table, F1 score, and calibration curve).
4. Validation of the maturity scale only.
5. Study on the accuracy of single-factor prediction models.
2.2. Search strategy
Relevant articles were systematically searched in Cochrane, Embase, PubMed, and Web of Science from the inception of each database to 5 December 2022 using MeSH and entry terms without restriction on language or region. The detailed retrieval process is outlined in Supplementary material.
2.3. Literature screening and data extraction
Retrieved articles were imported into Endnote for management, and duplications were deleted. The titles and abstracts were screened to exclude irrelevant studies, and the full texts of the remaining records were downloaded and checked for eligibility. Data were collected from the included studies using a customized data extraction form. The collected data comprised title, first author, year of publication, author country, type of study, source of patient, type of stroke, diagnostic criteria for cognitive impairment, length of follow-up, number of PSCI cases, total subject number, training set, validation set, type of model used, imputation method for missing value, variable screening, and modeling variables. Two independent researchers (YY and HY) performed the literature screening and data extraction, and subsequently cross-checked their results. Any disagreement was resolved by a third researcher (XSL).
2.4. Risk of bias assessment
The Prediction model Risk Of Bias Assessment Tool (PROBAST) was employed to evaluate the quality of the included studies. The PROBAST consists of four domains, namely participants, predictors, outcome, and analysis (8). The four domains contain 2, 3, 6, and 9 specific questions, respectively. Each question has three options: yes/probably yes (Y/PY), no/probably no (N/PN), and no information (NI). If a domain has at least one N/PN, it is rated as high risk. To be graded as low risk, a given domain must have Y/PY for all questions. When all domains are at low risk, the overall risk of bias is low; alternatively, when at least one domain is assessed as high risk, the overall risk of bias is high (9). Two researchers (XSL and DDY) independently evaluated the risk of bias in the included studies and subsequently cross-checked their results. Any disagreement was resolved by a third researcher (BYW).
2.5. Outcome measures
The primary outcome was the C-index, which can be used to reflect the overall accuracy of ML models. However, this indicator alone may not fully reflect the predictive accuracy of ML models in PSCI because the percentage of PSCI patients and non-PSCI patients in the included literature is severely unbalanced. Therefore, sensitivity and specificity were included as complementary outcome measures to evaluate the predictive accuracy of ML in PSCI.
2.6. Data synthesis and statistical analysis
The c-index and accuracy of ML models were meta-analyzed. If a 95% confidence interval (CI) and standard error were missing for the c-index, they were estimated using the methods by Debray (10). Given the differences in modeling variables and parameters, the c-index was pooled using a random effects model while sensitivity and specificity were pooled by a bivariate mixed effects model. In systematic reviews based on machine learning, heterogeneity is difficult to avoid. According to the Cochrane tool, percentages of around 25% (I2 = 25), 50% (I2 = 50), and 75% (I2 = 75) are deemed to represent low, medium, and high levels of heterogeneity, respectively (11). The sensitivity and robustness of the results were evaluated using the leave-one-out method. Publication bias was qualitatively assessed using a funnel plot and quantitatively assessed by Egger’s regression test (value of p). All meta-analyses were conducted in R4.2.0 (R development Core Team, Vienna, http://www.R-project.org). A p < 0.05 was considered statistically significant.
3. Results
3.1. Study selection
The literature screening process is illustrated in Figure 1. We identified a total of 5, 053 unique records. After reviewing the full texts of 41 reports, 21 studies were ultimately included (12–32).
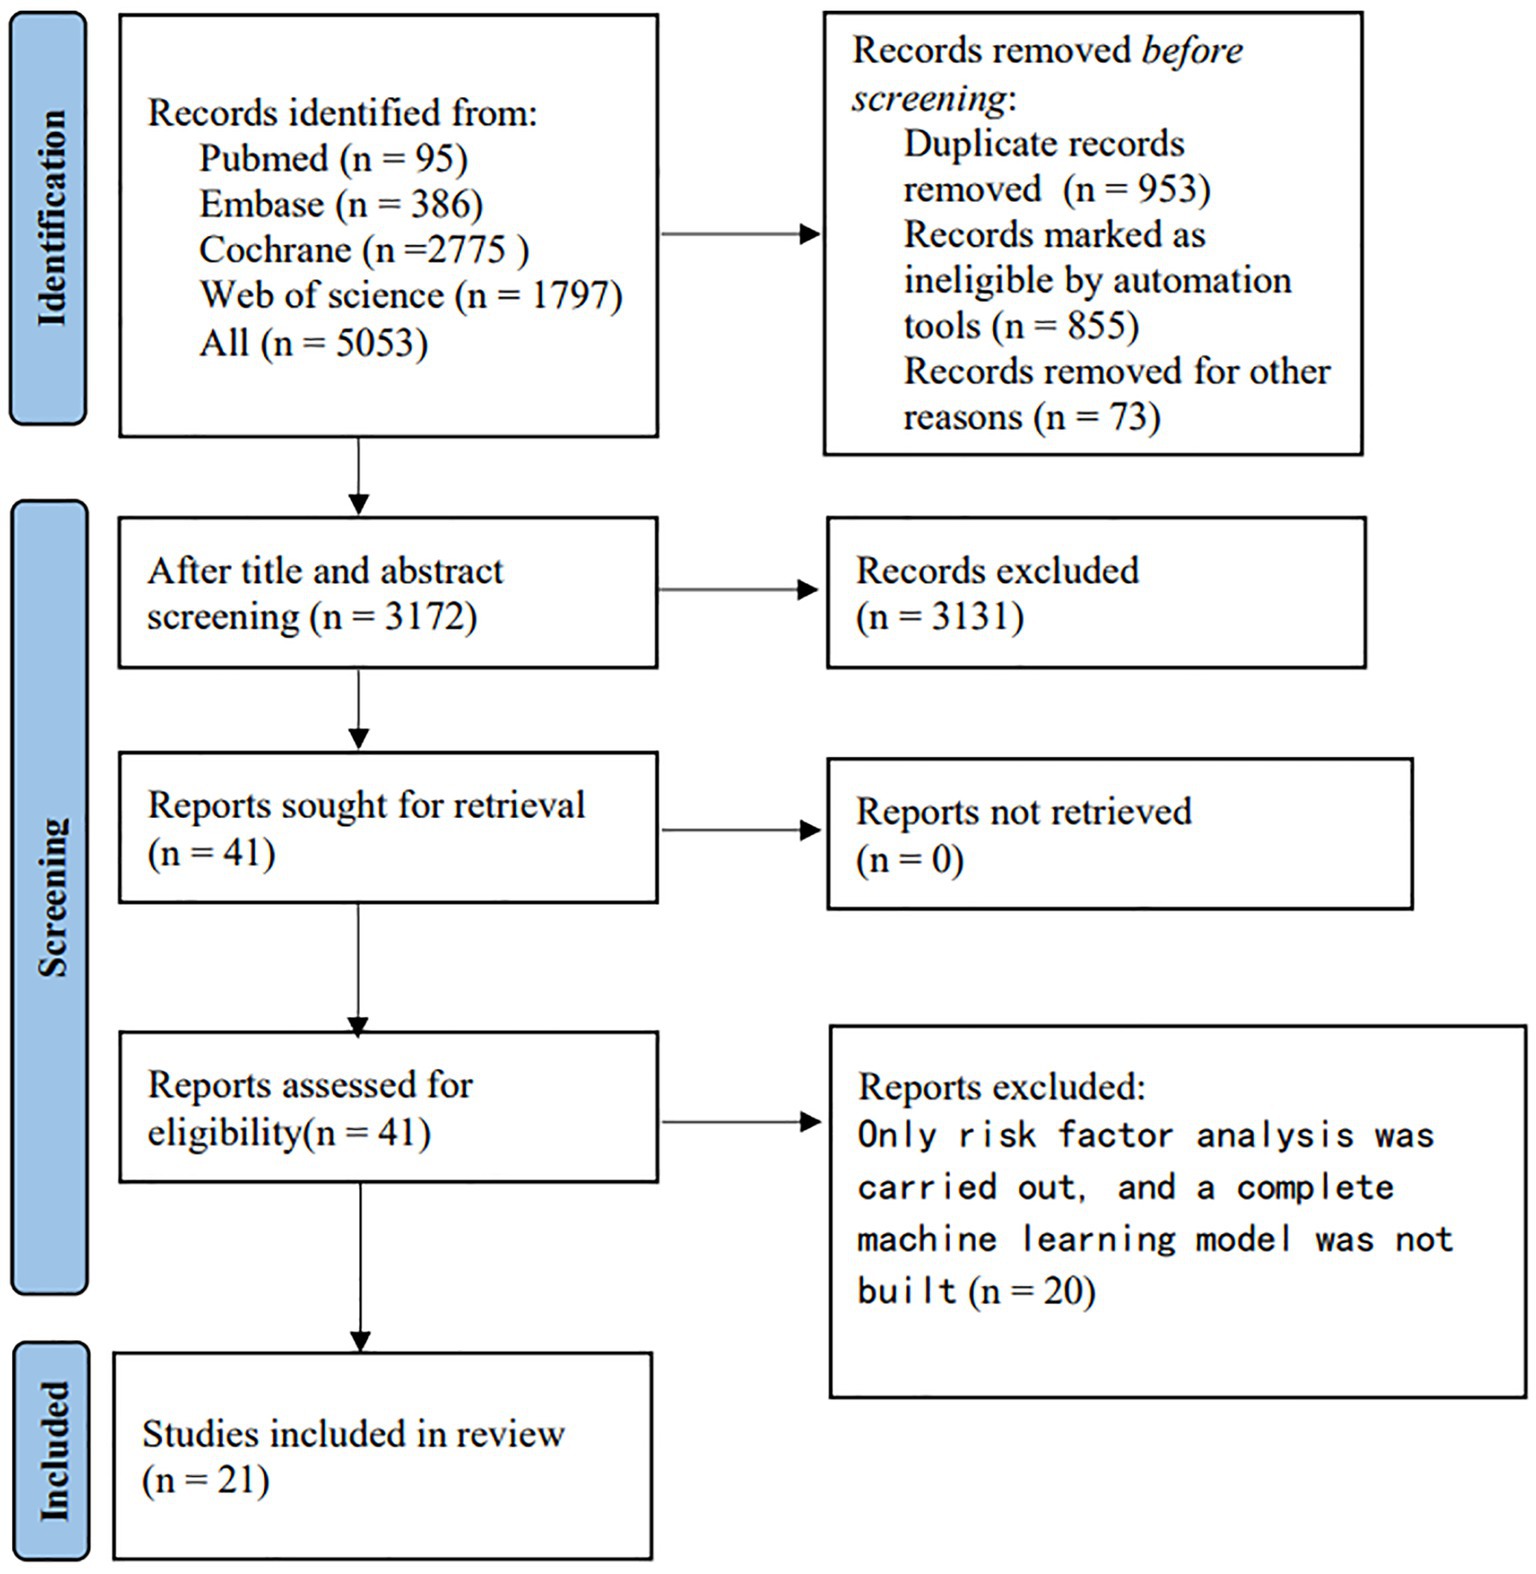
Figure 1. Flowchart of study selection.
3.2. Characteristics of included studies
Of the 21 eligible studies, 10 were conducted in China (12, 13, 17, 19, 21, 25, 26, 28, 29, 32), 2 in Norway (14, 27), 1 in Australia (20), 2 in German (15, 16), 2 in the Republic of Korea (18, 30), 1 in the Netherlands (14), 1 in France (23), 1 in the UK (24), and 1 in Singapore (31). These studies were published between 2015 and 2023, predominantly in 2021–2023 (n = 17) (12–27, 32).
Of the 7,822 subjects in the included studies, 2,876 developed PSCI. The subject cohort size ranged from 72 to 22,950. The diagnostic criteria used in the included studies were Mini-Mental State Examination (MMSE) (33), Montreal Cognitive Assessment (MoCA) (34) (n = 5) (20, 21, 28, 29, 31), MMSE (n = 6) (12–14, 18, 24, 32), MoCA (n = 6) (17, 19, 22, 25–27), Center of Cancelation (CoC) (35) (n = 1) (15), Global Deterioration Scale (GDS) (36) (n = 1) (16), Informant Questionnaire on Cognitive Decline in the Elderly (IQCODE) (37) (n = 1) (23), and vascular dementia criteria of the AHA/ASA scientific statement (38) (n = 1) (30). The duration of follow-up was predominantly 3 to 12 months, and was 36 years in only one study (23). The incidence of PSCI during follow-up was 12.5%–66.1%.
3.3. Characteristics of included prediction models
There were 31 models in the included studies, which were constructed based on logistic regression (LR) nomogram (n = 18) (12, 14–16, 18, 19, 22, 25, 26, 29–32), random forest (n = 1) (20), ridge regression (n = 1) (23), LASSO regression (n = 1) (21), mixed effects model (n = 3) (24), support vector machine (SVM) classifier (n = 3) (27), and decision trees (n = 3) (28) (Table 1). Modeling variables were selected using a multivariate approach. In the training set, 15 models reported c-index and 13 models reported sensitivity and specificity. In the validation set, 10 models reported c-index and 7 models reported sensitivity and specificity. The main modeling variables used in the included studies were age, gender, education level, stroke history, stroke severity, lesion volume, lesion site, stroke subtype, and vascular risk factors (Table 2).
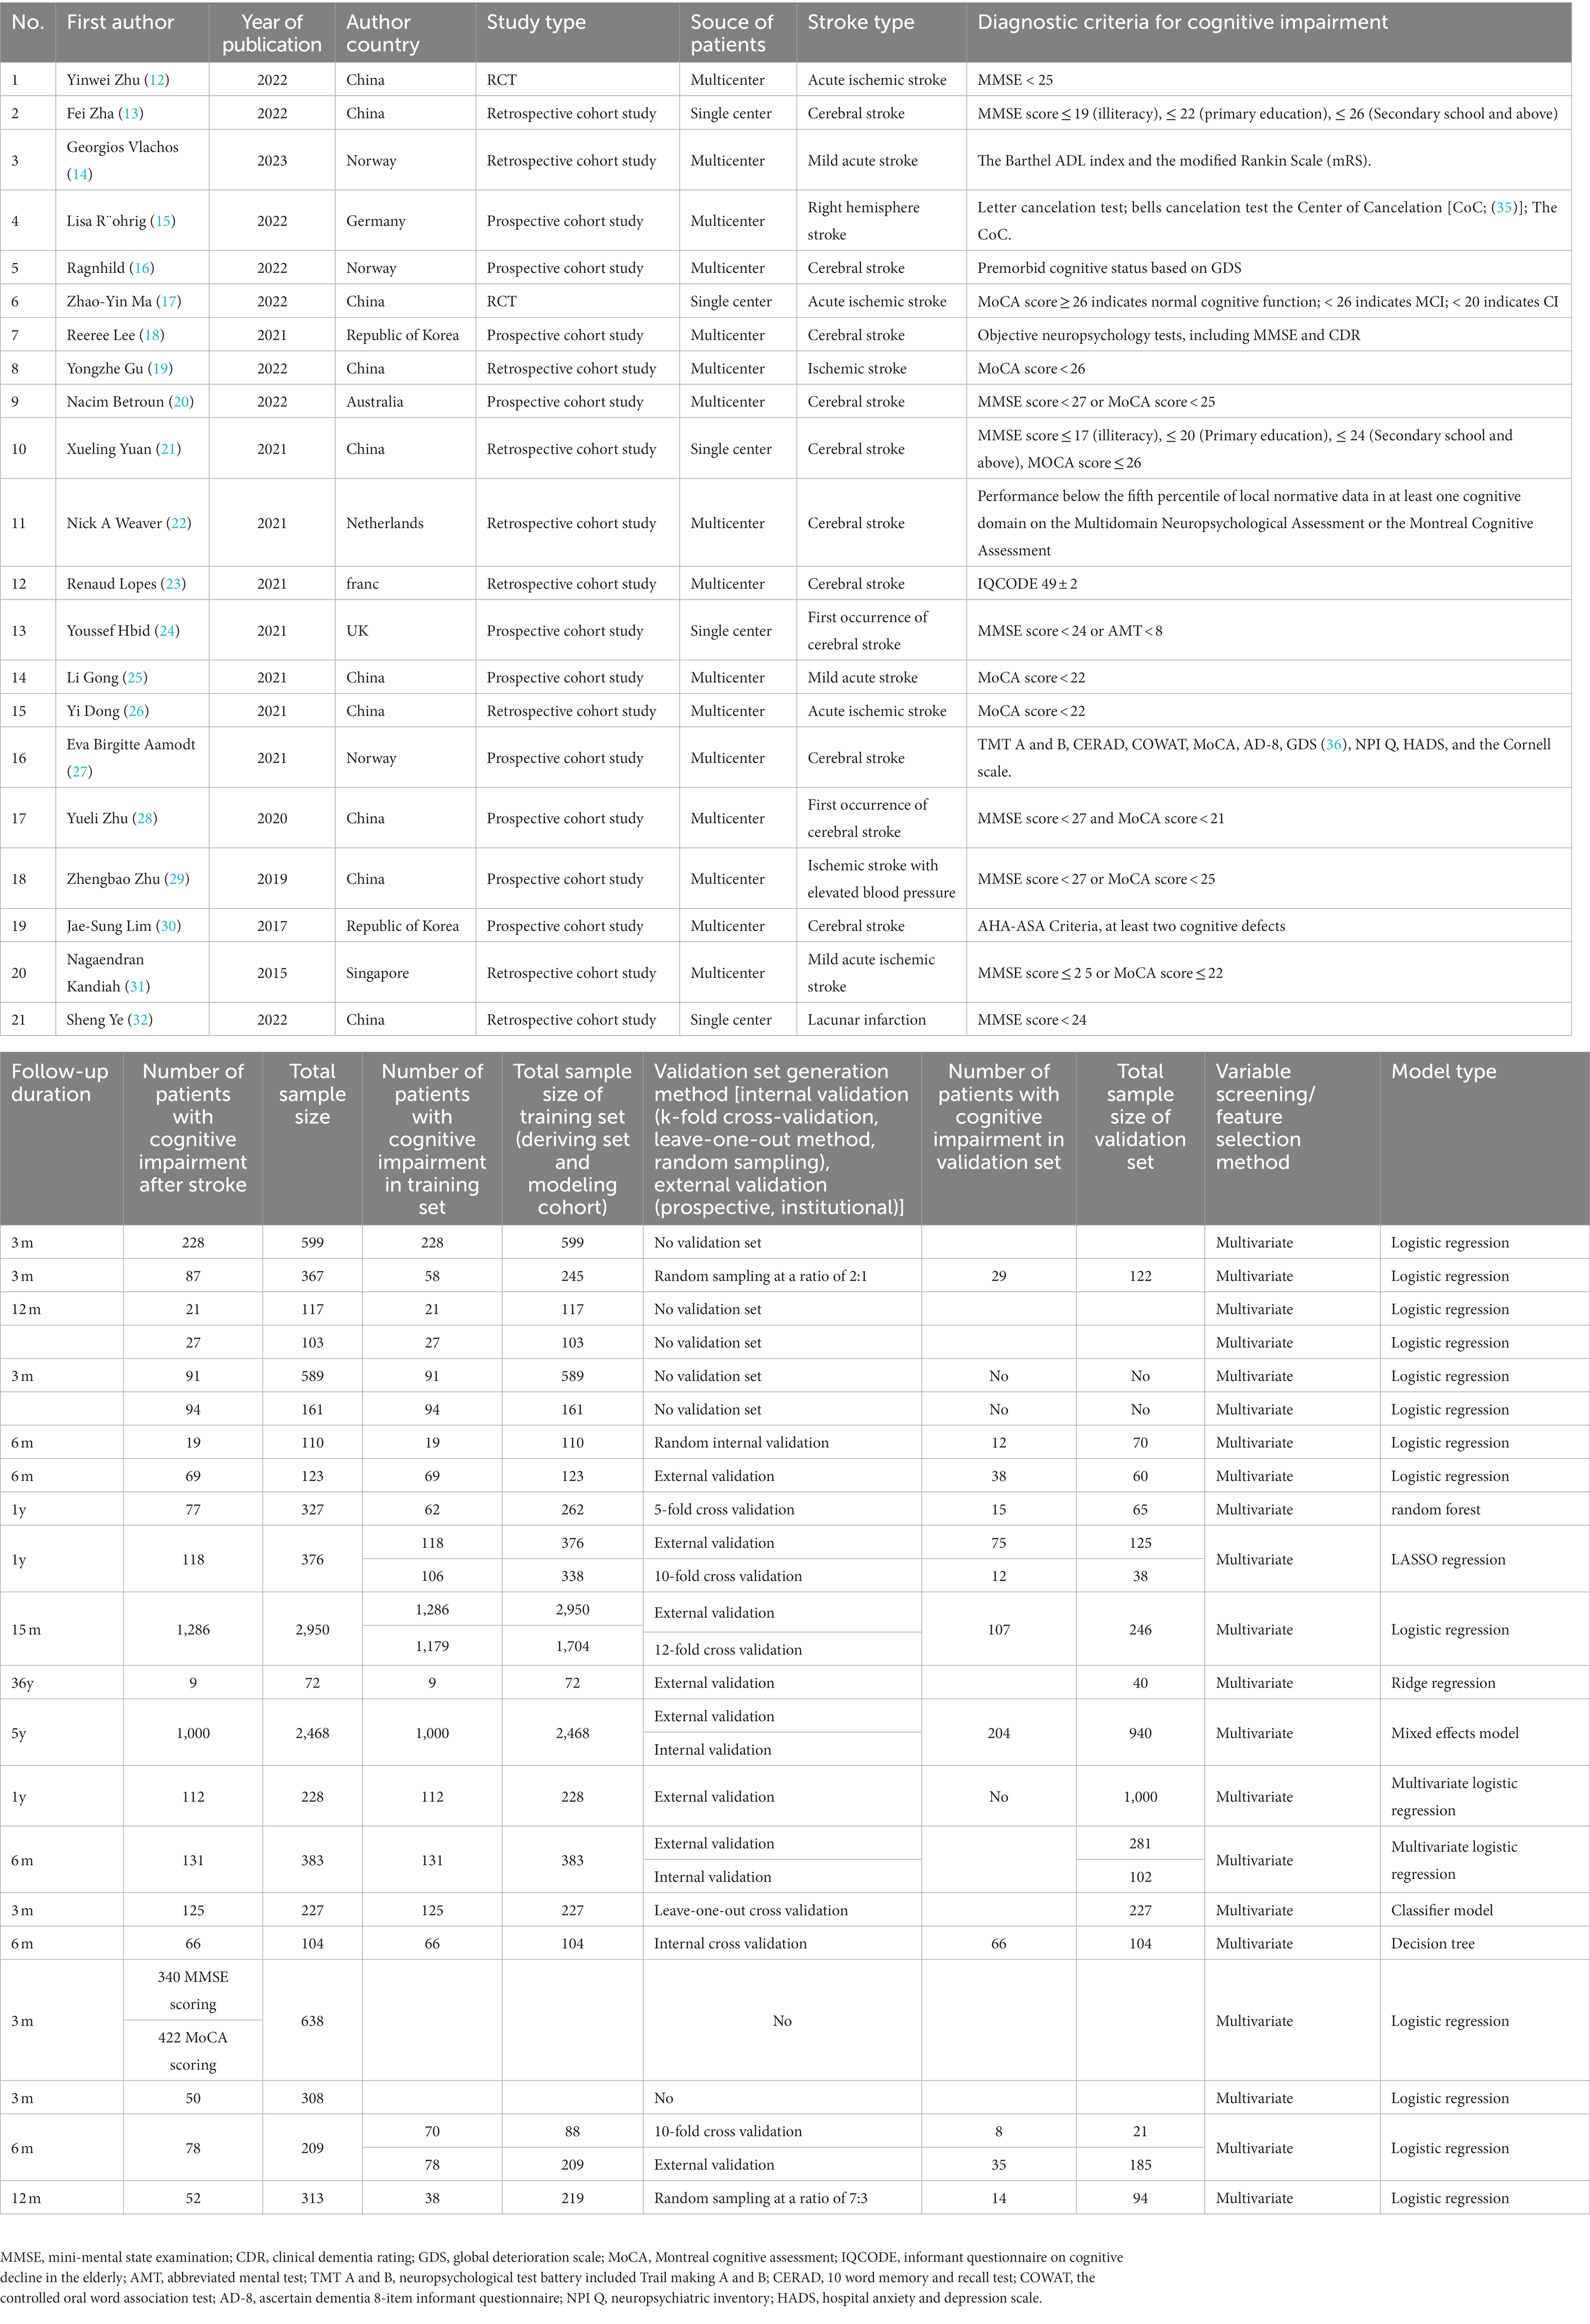
Table 1. General characteristics of included studies.

Table 2. Modeling variables in the included studies.
3.4. Risk of bias assessment
The high risk of bias in the included studies was attributed to the limited sample size, retrospective cohort study, and lack of validation set. Therefore, these attributes should be improved in subsequent model construction. The results of the risk of bias assessment are summarized in Figure 2.
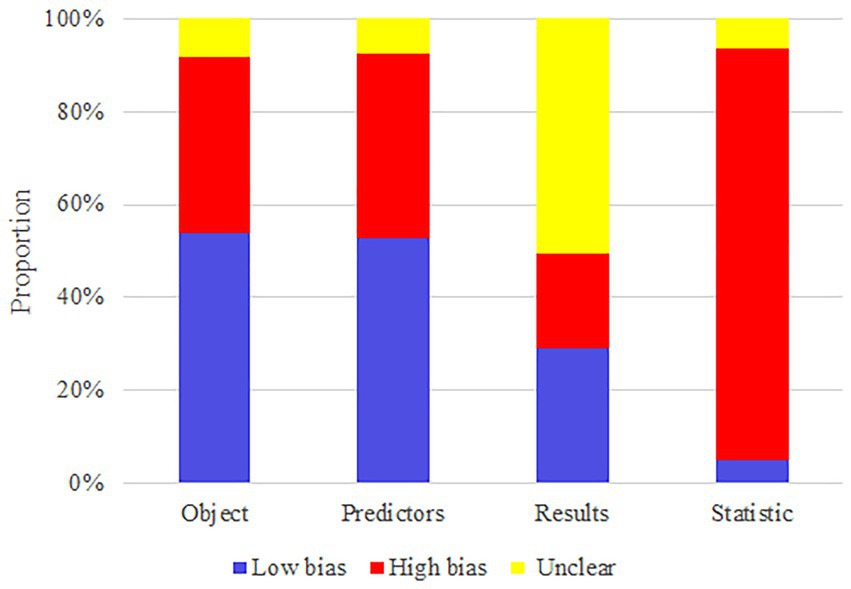
Figure 2. Risk of bias assessment.
3.5. Meta-analysis
Meta-analysis showed that the training set had a c-index of 0.82 (95% CI 0.77–0.87, n = 15), sensitivity of 0.77 (95% CI 0.72–0.80, n = 13), and specificity of 0.80 (95% CI 0.71–0.86, n = 13). Subgroup analysis of the training set showed that the c-index was 0.81 for LR (95%CI 0.74–0.88, n = 12), 0.80 for mixed effects model (95%CI 0.76–0.81 n = 1), 0.88 for SVM classifier (95%CI 0.84–0.92 n = 1), and 0.84 for decision trees (95%CI 0.77–0.92 n = 1; Figures 3, 4).
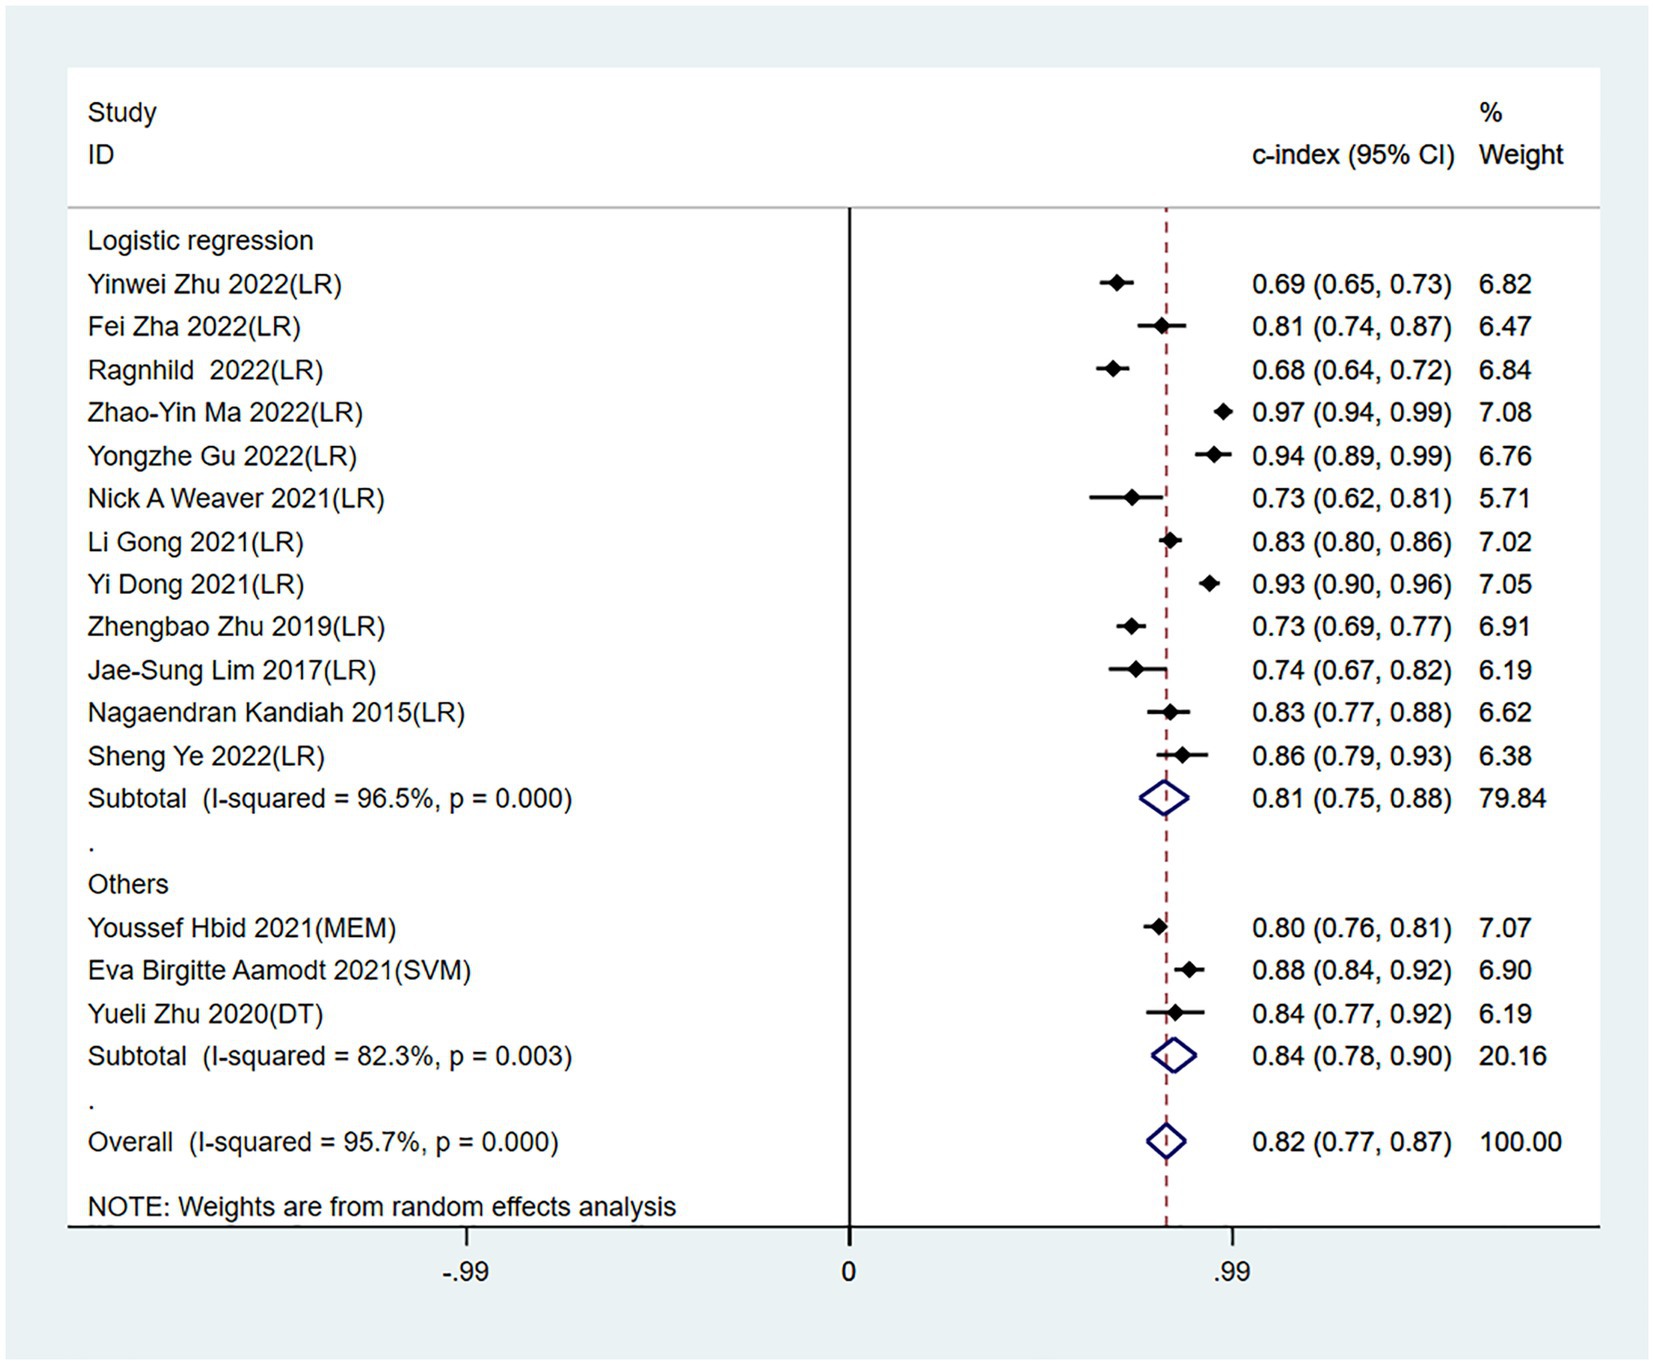
Figure 3. Forest plot of c-index in the training set. LR, logistic regression; SVM, Support Vector Machines; DT, decision trees; MEM, mixed effects model.
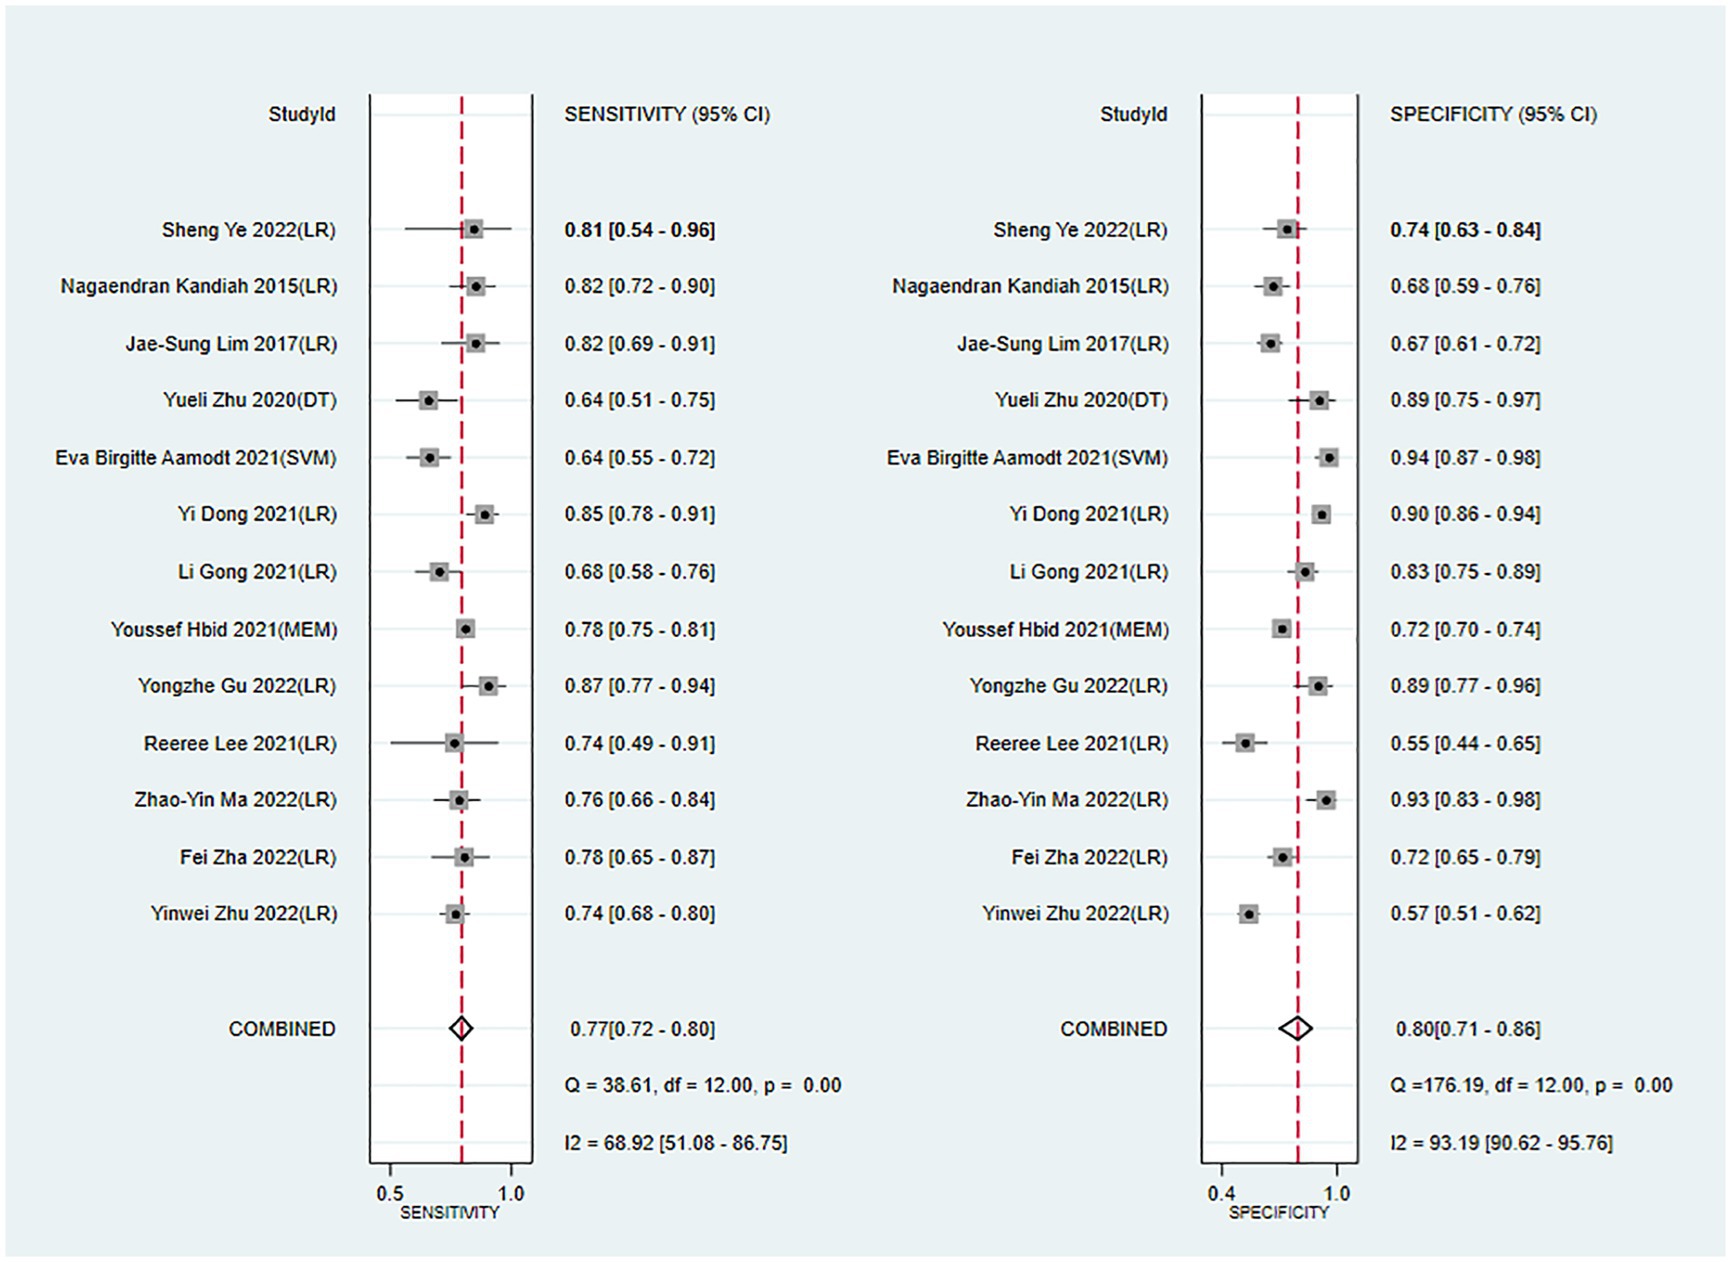
Figure 4. Forest plot of sensitivity and specificity in the training set. LR, logistic regression; SVM, Support Vector Machines; DT, decision trees; MEM, mixed effects model.
The c-index, sensitivity, and specificity of the validation set were 0.82 (95% CI 0.77–0.87, n = 10), 0.82 (95% CI 0.70–0.90, n = 7), and 0.76 (95% CI 0.68–0.82, n = 7), respectively. Subgroup analysis of the validation set showed that the c-index was 0.80 for LR (95%CI 0.75–0.85, n = 8) and 0.89 for LASSO regression (95%CI 0.84–0.93 n = 2; Figures 5, 6).
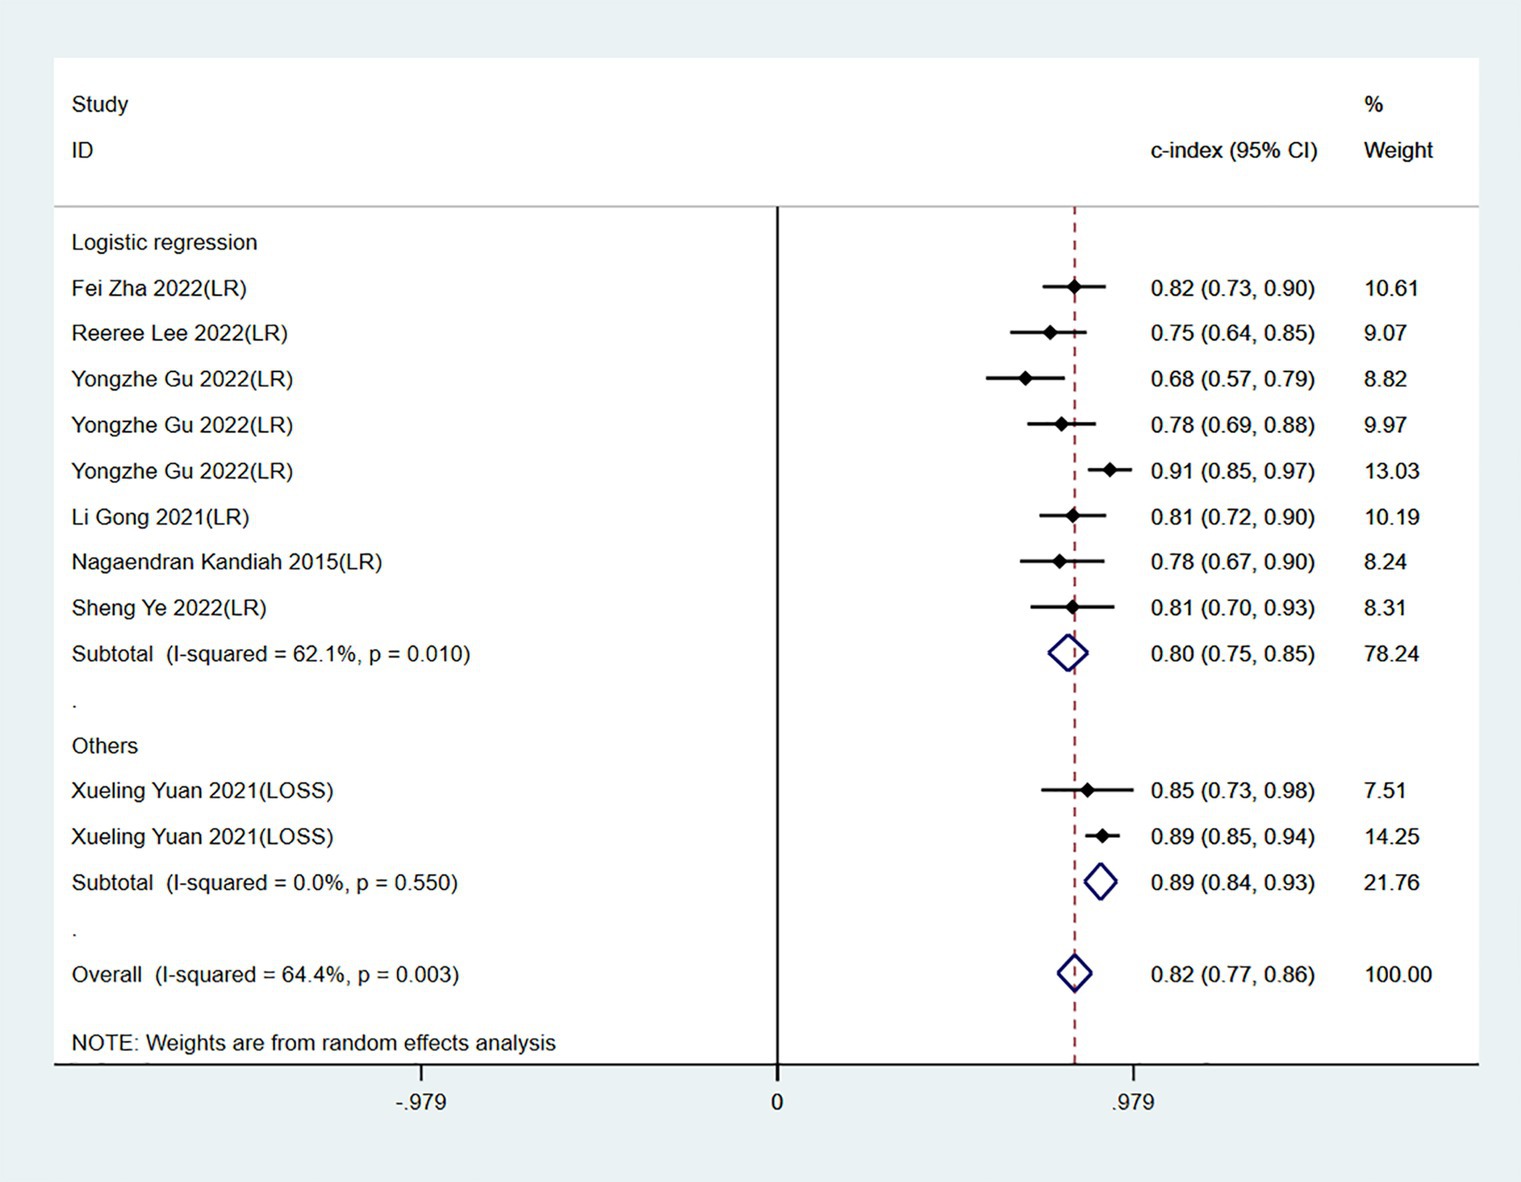
Figure 5. Forest plot of c-index in the validation set. LR, logistic regression; LASSO, least absolute shrinkage and selection operator.
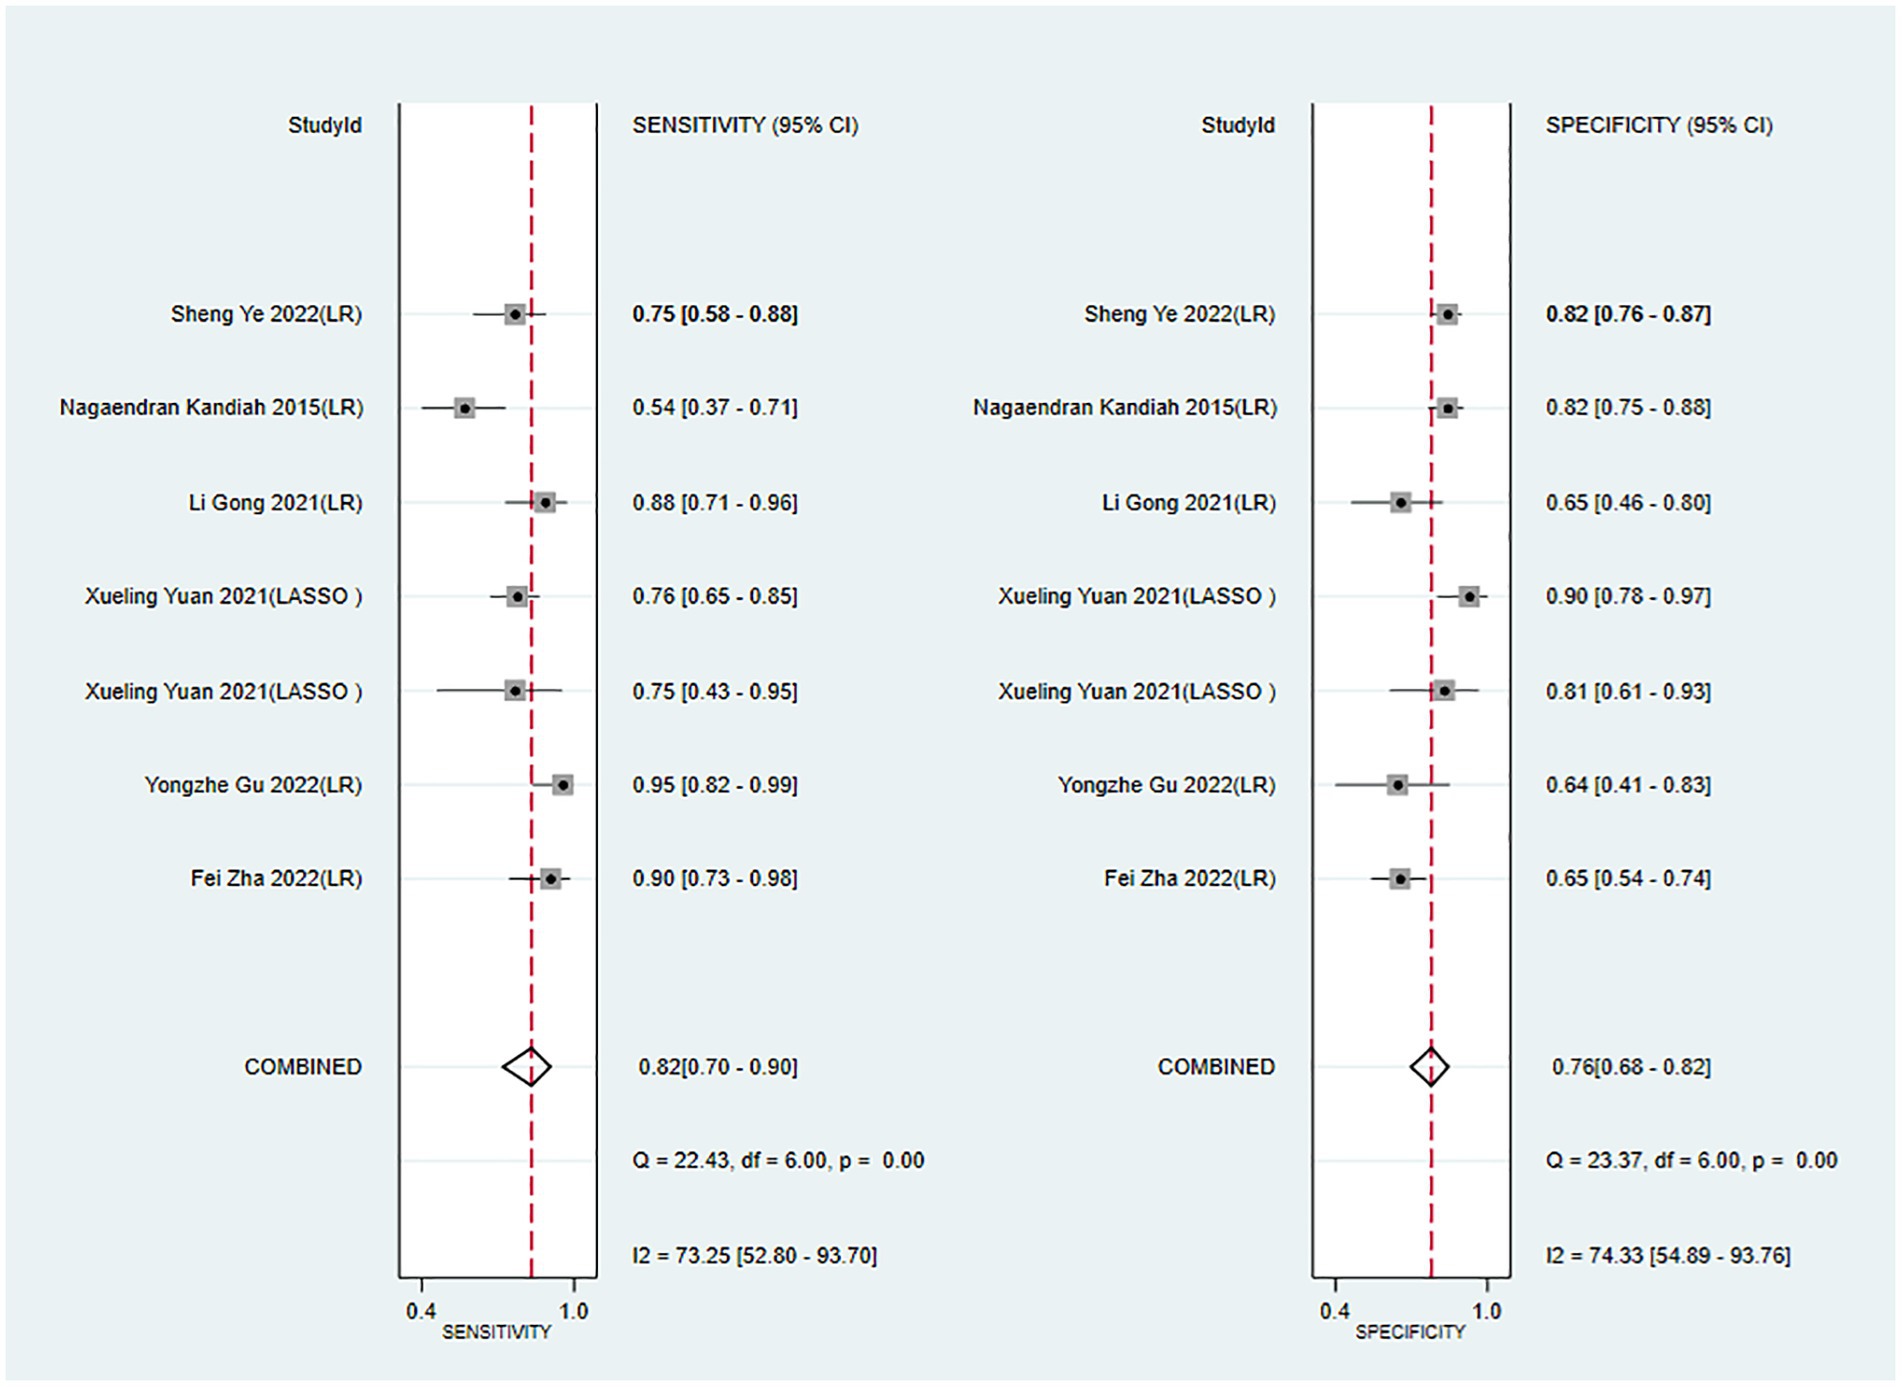
Figure 6. Forest plot of sensitivity and specificity in the validation set. LR, logistic regression; LASSO, least absolute shrinkage and selection operator.
The follow-up period or the meta-regression based on study design showed that there were no significant differences in the c-index between the training and validation sets, even considering the variations due to different study designs or changes in follow-up time (Figures 7–10; Tables 3, 4).
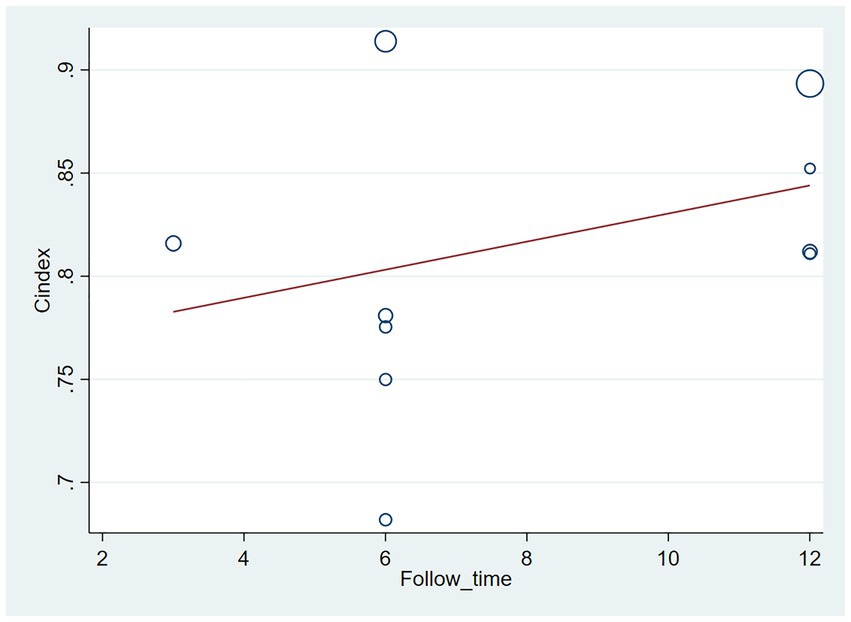
Figure 7. Meta-regression bubble plot of follow-up time in the training set (circles represent weights, with larger circle indicating greater weight and smaller confidence interval).
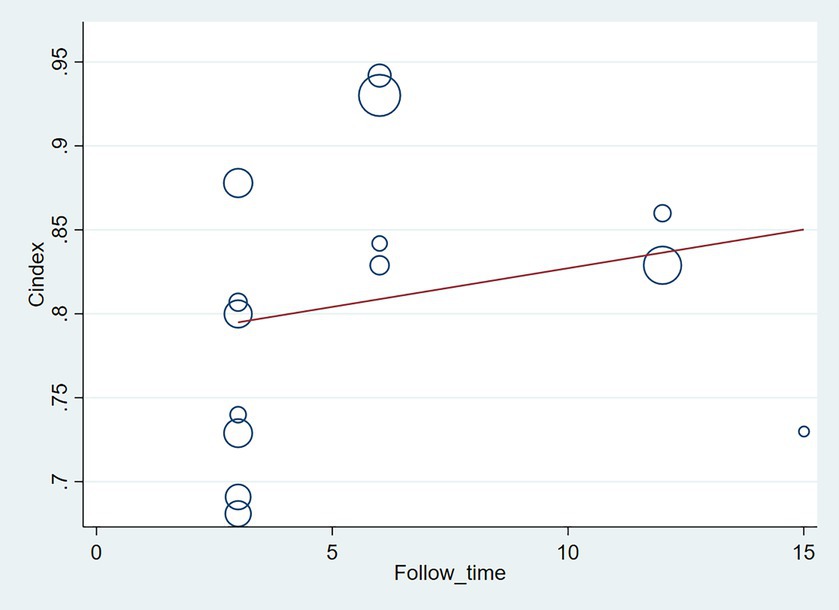
Figure 8. Meta-regression bubble plot of follow-up time in the validation set (circles represent weights, with larger circle indicating greater weight and smaller confidence interval). (1) Randomized controlled trial; (2) Prospective cohort study. (3) Retrospective cohort study.
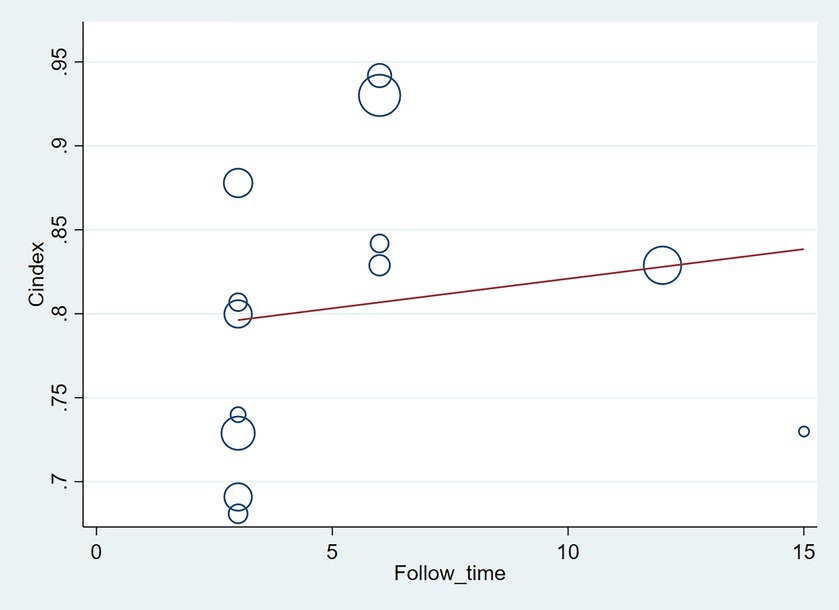
Figure 9. Meta-regression bubble plot of design in the training set (circles represent weights, with larger circle indicating greater weight and smaller confidence interval. (1) Randomized controlled trial; (2) Prospective cohort study; (3) Retrospective cohort study).
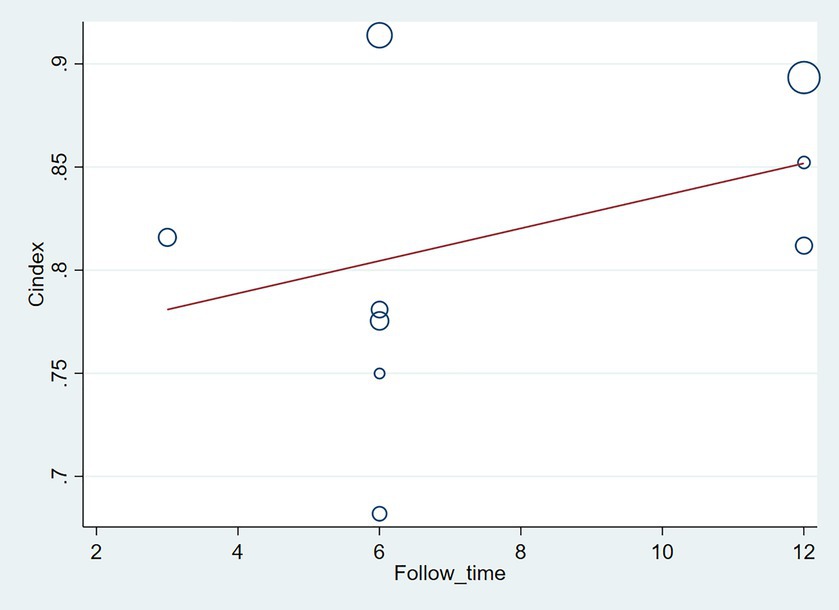
Figure 10. Meta-regression bubble plot of design in the validation set (circles represent weights, with larger circle indicating greater weight and smaller confidence interval).
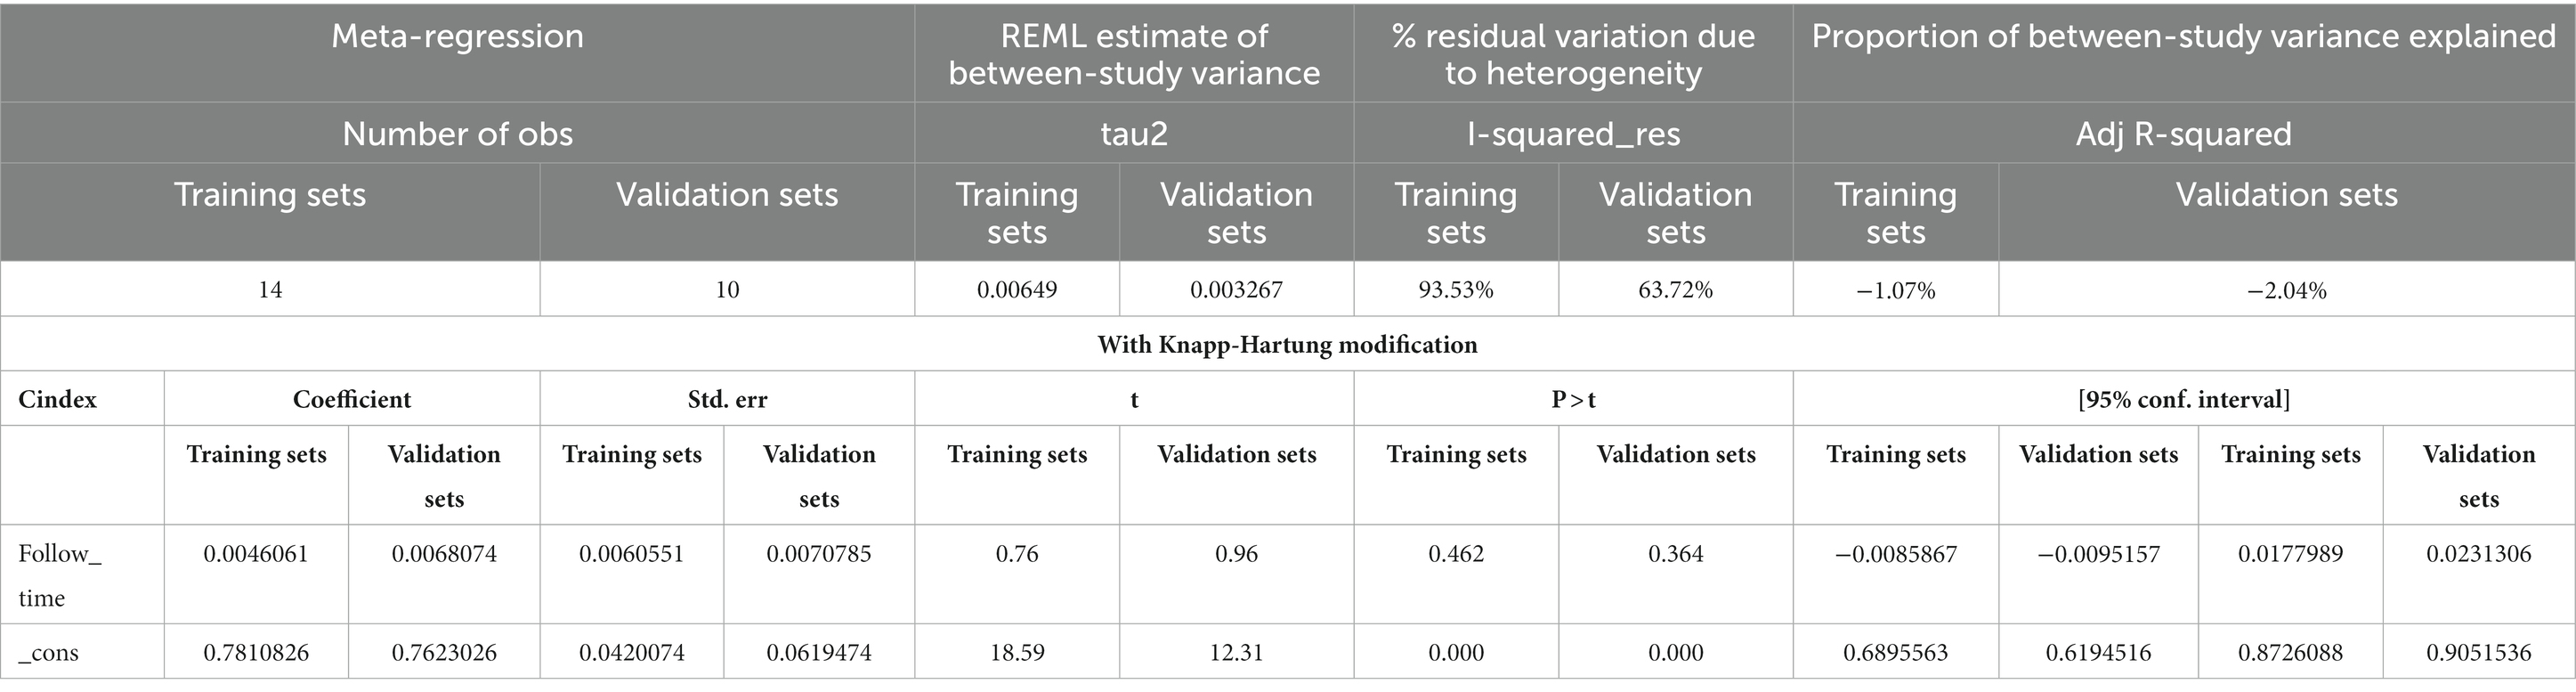
Table 3. Meta-regression results (follow-up time) in the training and validation sets.
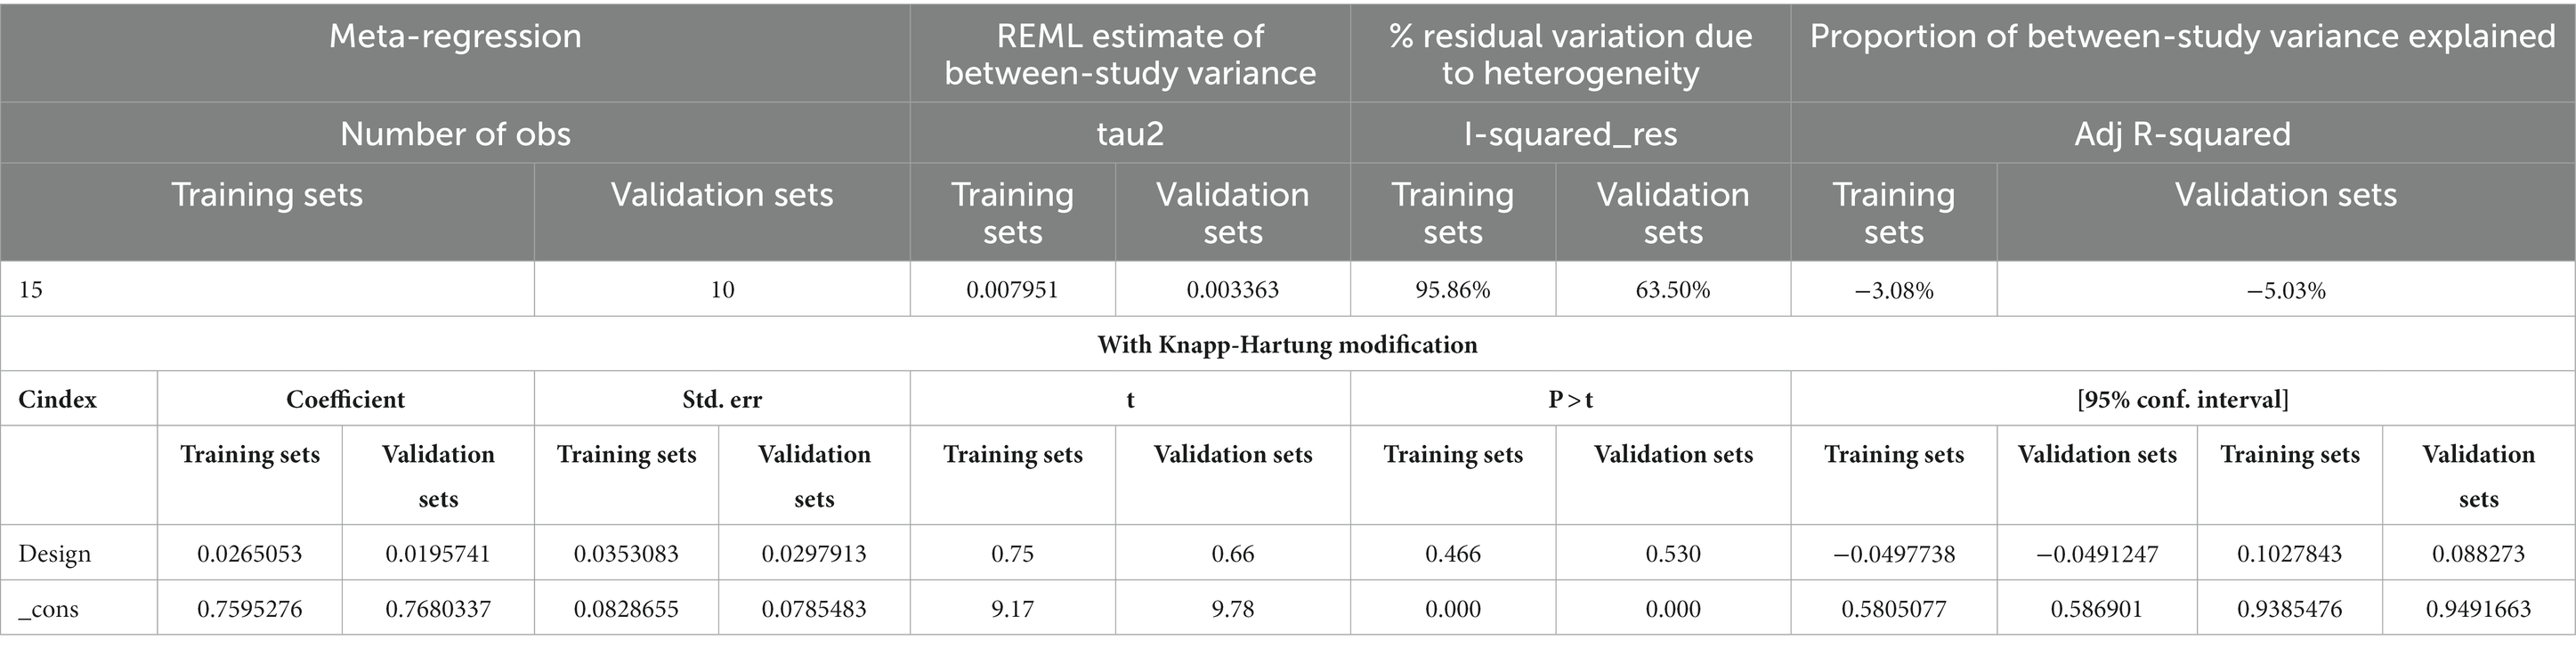
Table 4. Meta-regression results (study design) in the training and validation sets.
3.6. Sensitivity analysis and publication bias
Sensitivity analysis indicated that the results of both the training and validation sets were robust (Supplementary Figures S1, S2). However, the asymmetry in the funnel plot and the results of Egger’s regression test suggest that publication bias may be present in the training set (p = 0.056 for Egger’s regression test), and publication bias is clearly present in the validation set (p = 0.005 for Egger’s regression test; Supplementary Figures S3–S6). There were fewer independent validation cohorts in the included literature, and the presence of multiple independent validation cohorts in the same study may have contributed to publication bias.
4. Discussion
Our meta-analysis of 21 original studies demonstrated that ML may be an ideal tool for predicting PSCI. The training set had a c-index of 0.82 (95% CI 0.77–0.87) and sensitivity and specificity of >70%, indicating considerable predictive accuracy in PSCI. Furthermore, the accuracy of the validation set was not significantly lower than that of the training set, indicating that the ML model has good applicability. Currently, LR is the preferred model in clinical practice because it is simple for generating highly accessible nomograms, such as the nomogram on lymph node metastasis developed by the Sloan-Kettering Cancer Center (39–41). In our study, LR was also the preferred model among researchers as it exhibited comparable c-index performance to other ml algorithms while achieving higher sensitivity and specificity. As a result, we conclude that LR demonstrates satisfactory predictive ability for PSCI in this study.
We found that LR is the primary type of model utilized for predicting stroke. LR is a classification algorithm that aims to establish the relationship between features and probability of specific outcomes (42). ML is commonly used to address issues encountered in clinical practice, with supervised learning and unsupervised learning being the most common approaches. Supervised learning primarily focuses on diagnosing and predicting disease prognosis or progression, which involves the process of training, validation, and testing. The training process involves inserting predictive factors into the model and using the model’s inherent parameter calculation rules (e.g., maximum likelihood estimation, iteration) to estimate the optimal model parameters. Selection of modeling variables (feature selection methods) is crucial for the training process and has been a subject of ongoing debate due to their diversification. Furthermore, validation and testing are crucial for a completed model as they reflect the model’s robustness. Unfortunately, in actual research, most studies lacked effective external validation. The original studies included in our analysis predominantly utilized a supervised ML process with single-factor + multi-factor LR model selection method and performed internal validation through random sampling (43–45).
In our study, the c-index of LR did not significantly lag behind other types of ML models, which demonstrates relatively high sensitivity and specificity. Hence, we believe that LR exhibits promising predictive potential for PSCI.
In addition, we found that the major modeling variables for the ML-based PSCI prediction models were age, gender, education level, white matter hyperintensity (WMH), stroke history, stroke severity, lesion volume, lesion site, stroke subtype, and vascular risk factors. These modeling variables were still mainly based on past identified risk factors (race, age, gender, education level, vascular risk factor, stroke severity, and stroke lesion site and volume) (46), and very few or no newly identified risk factors were used for modeling, such as blood proteins [homocysteine (Hcy), C-reactive protein (CRP), low-density lipoprotein cholesterol (LDL-C), total cholesterol (TC)] that have been recognized as effective biomarkers for PSCI (47), cognitive reserve (CR) (48), activity and participation of stroke survivors (49), and intestinal dysbiosis (50). Therefore, the newly identified risk factors should be prioritized for further validation as their efficacy as modeling variables remains uncertain.
It was reported that common cognitive screening tools have similar predictive accuracy in PSCI. Although the MoCA has significantly better sensitivity in PSCI prediction than other cognitive screening tools, its specificity is less than desirable (51, 52). This demonstrates that there is a lack of effective prediction models for the early screening of PSCI. However, our findings showed that ML has considerably high predictive accuracy (c-index, sensitivity, and specificity) in PSCI and is a promising tool for predicting PSCI.
A recent systematic review indicated that although PSCI has unique risk factors (e.g., Vascular risk factors, lifestyle, overweight, and obesity), it is currently unclear whether the intervention of these risk factors can effectively reduce the incidence of PSCI. Most approaches for lowering PSCI incidence are still dependent on effective prophylaxis for stroke (46). Therefore, effective prediction tools for the early identification and diagnosis of PSCI are urgently needed. Despite the uncertainty in the intervention measures for post-stroke cognitive functions, some researchers found that physical activity intervention and noninvasive brain stimulation can improve post-stroke cognitive functions compared with conventional care (53). Though, the ≥2-year improvement in PSCI after intervention was small (54). Moreover, patients with cognitive impairment have significantly increased risks of subsequent ischemic and fatal stroke (55, 56). Hence, early identification of appropriate treatment and rehabilitation measures are critical for improving the health and life expectancy of PSCI patients. Our study demonstrated the feasibility of ML in the development of PSCI prediction tools and that ML is also an important means for PSCI prediction.
Given the low number of PSCI prediction models for hemorrhagic stroke included in this study (n = 3) (19), the predictive accuracy of ML vs. common cognitive screening tools in PSCI in hemorrhagic stroke patients remains unclear and warrants further investigation.
ML plays an important role in the clinical management of stroke and improvement of the accuracy and efficiency of stroke prediction, diagnosis, personalized treatment, and prognosis assessment (57). For prediction of stroke risk, ML algorithms can be trained using patient data to establish predictive models and estimate the risk of stroke based on individual patient information, clinical indicators, and biomarkers. As for stroke diagnosis, ML can learn and identify radiological features of stroke and assist physicians with early and accurate diagnosis. In addition, ML can predict the efficacy and safety of different treatment options based on the patient’s personal information, medical history, and clinical manifestations, enabling physicians to develop personalized treatment strategies. Furthermore, ML algorithms can predict post-stroke recovery and long-term prognosis based on patients’ clinical and biomarker data. ML has been extensively used in stroke diagnosis, particularly in brain imaging, with SVM being the optimal model for stroke imaging (6, 44, 57). However, in our study, SVM exhibited inferior sensitivity to LR despite higher c-index, and the model size was limited (n = 1). Therefore, further exploration and development of SVM in predicting PSCI are warranted. We can attempt to optimize the accuracy of PSCI prediction by using different SVM models and parameter settings. SVM has various variants, such as non-linear SVM, multi-kernel SVM, and support vector regression, which are selected based on specific circumstances. Additionally, the combination of SVM with other ML methods can be explored for PSCI prediction. For instance, integrating SVM with deep learning techniques can improve the accuracy and robustness of predictions when analyzing images or text data. Moreover, extensive clinical validation studies are required to assess the actual effectiveness of SVM in PSCI prediction. The application value of SVM in PSCI prediction can be comprehensively assessed by collecting more data from PSCI patients and evaluating the models on independent validation sets. In conclusion, SVM, as a widely used ML method, has untapped potential in PSCI prediction. Continuous learning and research efforts can further refine and optimize the application of SVM in PSCI prediction, providing more accurate diagnostic and treatment decision support for clinical practitioners.
For this systematic review, the literature search was performed up until December 2022 and additional studies on this topic may become available subsequently. Hence, a regular review of the literature is recommended to obtain the most updated progress on this research topic.
4.1. Strengths and limitations
This systematic review is the first to demonstrate the feasibility of ML in PSCI prediction. The included models were highly consistent and were predominantly logistic regression nomograms, which minimized heterogeneity.
Despite a comprehensive literature search, the number of included studies and models was still relatively low, and bias may be present in model construction.
5. Conclusion
ML has considerable predictive accuracy and is a promising prediction tool for PSCI. Therefore, future studies should concentrate on constructing ML models based on multi-racial, multi-center, and large-cohort samples and transforming them into simple clinical scoring tools with wide application. This will undoubtedly help with the development of follow-up strategies or rehabilitation measures for stroke patients to reduce their risk of developing cognitive impairment.
Data availability statement
The original contributions presented in the study are included in the article/Supplementary material, further inquiries can be directed to the corresponding authors.
Author contributions
All authors listed have made a substantial, direct, and intellectual contribution to the work and approved it for publication.
Funding
This study was supported by the National Natural Science Foundation of China (31960178 and 82160923), Applied Basic Research Programs of Science and Technology Commission Foundation of Yunnan Province (2019FA007), Key Laboratory of Traditional Chinese Medicine for Prevention and Treatment of Neuropsychiatric Diseases, Yunnan Provincial Department of Education, Scientific Research Projects for High-level Talents of Yunnan University of Chinese Medicine (2019YZG01), Young Top-Notch Talent in 10,000 Talent Program of Yunnan Province (YNWR-QNBJ-2019-235), National Science and Technology Innovation 2030 Major Program (2021ZD0200900), Yunnan Key Research and Development Program (202103AC100005), and Yunnan Province Fabao Gao Expert Workstation Construction Project (202105AF150037).
Conflict of interest
The authors declare that the research was conducted in the absence of any commercial or financial relationships that could be construed as a potential conflict of interest.
Publisher’s note
All claims expressed in this article are solely those of the authors and do not necessarily represent those of their affiliated organizations, or those of the publisher, the editors and the reviewers. Any product that may be evaluated in this article, or claim that may be made by its manufacturer, is not guaranteed or endorsed by the publisher.
Supplementary material
The Supplementary material for this article can be found online at: https://www.frontiersin.org/articles/10.3389/fneur.2023.1211733/full#supplementary-material
References
1. Roth, GA, Mensah, GA, Johnson, CO, Addolorato, G, Ammirati, E, Baddour, LM, et al. Global burden of cardiovascular diseases and risk factors, 1990-2019: update from the GBD 2019 study. J Am Coll Cardiol. (2020) 76:2982–3021. doi: 10.1016/j.jacc.2020.11.010
2. Pendlebury, ST, and Rothwell, PM. Incidence and prevalence of dementia associated with transient ischaemic attack and stroke: analysis of the population-based Oxford vascular study. Lancet Neurol. (2019) 18:248–58. doi: 10.1016/S1474-4422(18)30442-3
3. Lo, JW, Crawford, JD, Desmond, DW, Bae, HJ, Lim, JS, Godefroy, O, et al. Long-term cognitive decline after stroke: an individual participant data meta-analysis. Stroke. (2022) 53:1318–27. doi: 10.1161/STROKEAHA.121.035796
4. Tang, EYH, Price, CI, Robinson, L, Exley, C, Köhler, S, Staals, J, et al. Assessing the predictive validity of simple dementia risk models in harmonized stroke cohorts. Stroke. (2020) 2095:102. doi: 10.1161/STROKEAHA.120.027473
5. Deo, RC. Machine learning in medicine. Circulation. (2015) 132:1920–30. doi: 10.1161/CIRCULATIONAHA.115.001593
6. Mouridsen, K, Thurner, P, and Zaharchuk, G. Artificial intelligence applications in stroke. Stroke. (2020) 51:2573–9. doi: 10.1161/STROKEAHA.119.027479
7. Page, MJ, McKenzie, JE, Bossuyt, PM, Boutron, I, Hoffmann, TC, Mulrow, CD, et al. The PRISMA 2020 statement: an updated guideline for reporting systematic reviews. BMJ. (2021) 372:n71. doi: 10.1136/bmj.n71
8. Wolff, RF, Moons, KGM, Riley, RD, Whiting, PF, Westwood, M, Collins, GS, et al. PROBAST: a tool to assess the risk of bias and applicability of prediction model studies. Ann Intern Med. (2019) 170:51–8. doi: 10.7326/M18-1376
9. Bellou, V, Belbasis, L, Konstantinidis, AK, Tzoulaki, I, and Evangelou, E. Prognostic models for outcome prediction in patients with chronic obstructive pulmonary disease: systematic review and critical appraisal. BMJ. (2019) 367:l5358. doi: 10.1136/bmj.l5358
10. Debray, TP, Damen, JA, Riley, RD, Snell, K, Reitsma, JB, Hooft, L, et al. A framework for meta-analysis of prediction model studies with binary and time-to-event outcomes. Stat Methods Med Res. (2019) 28:2768–86. doi: 10.1177/0962280218785504
11. Huedo-Medina, TB, Sánchez-Meca, J, Marín-Martínez, F, and Botella, J. Assessing heterogeneity in meta-analysis: Q statistic or I2 index? Psychol Methods. (2006) 11:193–206. doi: 10.1037/1082-989X.11.2.193
12. Zhu, YW, Zhao, Y, Lu, YL, Fang, CQ, Zhang, Q, Zhang, JT, et al. The association between plasma soluble triggering receptor expressed on myeloid cells 2 and cognitive impairment after acute ischemic stroke. J Affect Disord. (2022) 299:287–93. doi: 10.1016/j.jad.2021.12.011
13. Zha, F, Zhao, JJ, Chen, C, Ji, XQ, Li, M, Wu, YY, et al. A high neutrophil-to-lymphocyte ratio predicts higher risk of poststroke cognitive impairment: development and validation of a clinical prediction model. Front Neurol. (2022) 12:5011. doi: 10.3389/fneur.2021.755011
14. Vlachos, G, Ihle-Hansen, H, Wyller, TB, Brækhus, A, Mangset, M, Hamre, C, et al. Predictors of cognitive and emotional symptoms 12 months after first-ever mild stroke. Neuropsychol Rehabil. (2023) 33:662–79. doi: 10.1080/09602011.2022.2038211
15. Röhrig, L, Sperber, C, Bonilha, L, Rorden, C, and Karnath, HO. Right hemispheric white matter hyperintensities improve the prediction of spatial neglect severity in acute stroke. NeuroImage Clin. (2022):36. doi: 10.1016/j.nicl.2022.103265
16. Munthe-Kaas, R, Aam, S, Saltvedt, I, Wyller, TB, Pendlebury, ST, Lydersen, S, et al. Is frailty index a better predictor than pre-stroke modified Rankin scale for neurocognitive outcomes 3-months post-stroke? BMC Geriatr. (2022) 22:139. doi: 10.1186/s12877-022-02840-y
17. Ma, ZY, Wu, YY, Cui, HYL, Yao, GY, and Bian, H. Factors influencing post-stroke cognitive impairment in patients with type 2 diabetes mellitus. Clin Interv Aging. (2022) 17:653–64. doi: 10.2147/CIA.S355242
18. Lee, R, Choi, H, Park, KY, Kim, JM, and Seok, JW. Prediction of post-stroke cognitive impairment using brain FDG PET: deep learning-based approach. Eur J Nucl Med Mol Imaging. (2022) 49:1254–62. doi: 10.1007/s00259-021-05556-0
19. Gu, YZ, Wang, F, Gong, L, Fang, M, and Liu, XY. A nomogram incorporating red blood cell indices to predict post-stroke cognitive impairment in the intracerebral hemorrhage population. Front Aging Neurosci. (2022):14. doi: 10.3389/fnagi.2022.985386
20. Betrouni, N, Jiang, JY, Duering, M, Georgakis, MK, Oestreich, L, Sachdev, PS, et al. Texture features of magnetic resonance images predict poststroke cognitive impairment: validation in a Multicenter study. Stroke. (2022) 53:3446–54. doi: 10.1161/STROKEAHA.122.039732
21. Yuan, XL, Zhang, L, Sui, RB, and Wang, Z. A risk prediction model of post-stroke cognitive impairment based on magnetic resonance spectroscopy imaging. Neurol Res. (2021) 43:642–52. doi: 10.1080/01616412.2021.1908659
22. Weaver, NA, Kuijf, HJ, Aben, HP, Abrigo, J, Bae, HJ, Barbay, M, et al. Strategic infarct locations for post-stroke cognitive impairment: a pooled analysis of individual patient data from 12 acute ischaemic stroke cohorts. Lancet Neurol. (2021) 20:448–59. doi: 10.1016/S1474-4422(21)00060-0
23. Lopes, R, Bournonville, C, Kuchcinski, G, Dondaine, T, Mendyk, AM, Viard, R, et al. Prediction of long-term cognitive functions after minor stroke, using functional connectivity. Neurology. (2021). doi: 10.1186/s12883-021-02350-1
24. Hbid, Y, Fahey, M, Wolfe, CDA, Obaid, M, and Douiri, A. Risk prediction of cognitive decline after stroke. J Stroke Cerebrovasc Dis. (2021) 30:105849. doi: 10.1016/j.jstrokecerebrovasdis.2021.105849
25. Gong, L, Wang, H, Zhu, X, Dong, Q, Yu, Q, Mao, B, et al. Nomogram to predict cognitive dysfunction after a minor ischemic stroke in hospitalized-population. Front Aging Neurosci. (2021) 13:637363. doi: 10.3389/fnagi.2021.637363
26. Dong, Y, Ding, M, Cui, M, Fang, M, Gong, L, Xu, Z, et al. Development and validation of a clinical model (DREAM-LDL) for post-stroke cognitive impairment at 6 months. Aging. (2021) 13:21628–41. doi: 10.18632/aging.203507
27. Aamodt, EB, Schellhorn, T, Stage, E, Sanjay, AB, Logan, PE, Svaldi, DO, et al. Predicting the emergence of major neurocognitive disorder within three months after a stroke. Front Aging Neurosci. (2021) 13:705889. doi: 10.3389/fnagi.2021.705889
28. Zhu, Y, Zhao, S, Fan, Z, Li, Z, He, F, Lin, C, et al. Evaluation of the mini-mental state examination and the Montreal cognitive assessment for predicting post-stroke cognitive impairment during the acute phase in Chinese minor stroke patients. Front Aging Neurosci. (2020) 12:236. doi: 10.3389/fnagi.2020.00236
29. Zhu, Z, Zhong, C, Guo, D, Bu, X, Xu, T, Guo, L, et al. Multiple biomarkers covering several pathways improve predictive ability for cognitive impairment among ischemic stroke patients with elevated blood pressure. Atherosclerosis. (2019) 287:30–7. doi: 10.1016/j.atherosclerosis.2019.05.028
30. Lim, JS, Oh, MS, Lee, JH, Jung, S, Kim, C, Jang, MU, et al. Prediction of post-stroke dementia using NINDS-CSN 5-minute neuropsychology protocol in acute stroke. Int Psychogeriatr. (2017) 29:1–8. doi: 10.1017/S1041610216002520
31. Kandiah, N, Chander, RJ, Lin, X, Ng, A, Poh, YY, Cheong, CY, et al. Cognitive impairment after mild stroke: development and validation of the SIGNAL2 risk score. J Alzheimers Dis. (2015) 49:1169–77. doi: 10.3233/JAD-150736
32. Ye, S, Pan, HQ, Li, WJ, Wang, B, Xing, JJ, and Xu, L. High serum amyloid a predicts risk of cognitive impairment after lacunar infarction: development and validation of a nomogram. Front Neurol. (2022) 13:972771. doi: 10.3389/fneur.2022.972771
33. Folstein, MF, Folstein, SE, and McHugh, PR. "mini-mental state". A practical method for grading the cognitive state of patients for the clinician. J Psychiatr Res. (1975) 12:189–98. doi: 10.1016/0022-3956(75)90026-6
34. Chan, E, Altendorff, S, Healy, C, Werring, DJ, and Cipolotti, L. The test accuracy of the Montreal cognitive assessment (MoCA) by stroke lateralisation. J Neurol Sci. (2017) 373:100–4. doi: 10.1016/j.jns.2016.12.028
35. Rorden, C, and Karnath, HO. A simple measure of neglect severity. Neuropsychologia. (2010) 48:2758–63. doi: 10.1016/j.neuropsychologia.2010.04.018
36. Reisberg, B, Ferris, SH, de Leon, MJ, and Crook, T. The global deterioration scale for assessment of primary degenerative dementia. Am J Psychiatry. (1982) 139:1136–9. doi: 10.1176/ajp.139.9.1136
37. Jorm, AF. A short form of the informant questionnaire on cognitive decline in the elderly (IQCODE): development and cross-validation. Psychol Med. (1994) 24:145–53. doi: 10.1017/S003329170002691X
38. Gorelick, PB, Scuteri, A, Black, SE, Decarli, C, Greenberg, SM, Iadecola, C, et al. Vascular contributions to cognitive impairment and dementia: a statement for healthcare professionals from the american heart association/american stroke association. Stroke. (2011) 42:2672–713. doi: 10.1161/STR.0b013e3182299496
39. Kuo, YL, Chen, WC, Yao, WJ, Cheng, L, Hsu, HP, Lai, HW, et al. Validation of Memorial Sloan-Kettering Cancer Center nomogram for prediction of non-sentinel lymph node metastasis in sentinel lymph node positive breast cancer patients an international comparison. Int J Surg. (2013) 11:538–43. doi: 10.1016/j.ijsu.2013.05.005
40. Vieni, S, Graceffa, G, La Mendola, R, Latteri, S, Cordova, A, Latteri, MA, et al. Application of a predictive model of axillary lymph node status in patients with sentinel node metastasis from breast cancer. A retrospective cohort study. Int J Surg. (2016) 35:58–63. doi: 10.1016/j.ijsu.2016.09.015
41. Cagiannos, I, Karakiewicz, P, Eastham, JA, Ohori, M, Rabbani, F, Gerigk, C, et al. A preoperative nomogram identifying decreased risk of positive pelvic lymph nodes in patients with prostate cancer. J Urol. (2003) 170:1798–803. doi: 10.1097/01.ju.0000091805.98960.13
42. Landwehr, N, Hall, M, and Frank, E. Logistic model trees. Mach Learn. (2005) 59:161–205. doi: 10.1007/s10994-005-0466-3
43. Choi, RY, Coyner, AS, Kalpathy-Cramer, J, Chiang, MF, and Campbell, JP. Introduction to machine learning, neural networks, and deep learning. Transl Vis Sci Technol. (2020) 9:14. doi: 10.1167/tvst.9.2.14
44. Jiang, F, Jiang, Y, Zhi, H, Dong, Y, Li, H, Ma, S, et al. Artificial intelligence in healthcare: past, present and future. Stroke Vasc Neurol. (2017) 2:230–43. doi: 10.1136/svn-2017-000101
45. Handelman, GS, Kok, HK, Chandra, RV, Razavi, AH, Lee, MJ, and Asadi, H. eDoctor: machine learning and the future of medicine. J Intern Med. (2018) 284:603–19. doi: 10.1111/joim.12822
46. Rost, NS, Brodtmann, A, Pase, MP, van Veluw, SJ, Biffi, A, Duering, M, et al. Post-stroke cognitive impairment and dementia. Circ Res. (2022) 130:1252–71. doi: 10.1161/CIRCRESAHA.122.319951
47. Kim, KY, Shin, KY, and Chang, KA. Potential biomarkers for post-stroke cognitive impairment: a systematic review and meta-analysis. Int J Mol Sci. (2022) 23:602. doi: 10.3390/ijms23020602
48. Contador, I, Alzola, P, Stern, Y, de la Torre-Luque, A, Bermejo-Pareja, F, and Fernández-Calvo, B. Is cognitive reserve associated with the prevention of cognitive decline after stroke? A systematic review and meta-analysis. Ageing Res Rev. (2023) 84:101814. doi: 10.1016/j.arr.2022.101814
49. Stolwyk, RJ, Mihaljcic, T, Wong, DK, Chapman, JE, and Rogers, JM. Poststroke cognitive impairment negatively impacts activity and participation outcomes: a systematic review and meta-analysis. Stroke. (2021) 52:748–60. doi: 10.1161/STROKEAHA.120.032215
50. Koszewicz, M, Jaroch, J, Brzecka, A, Ejma, M, Budrewicz, S, Mikhaleva, LM, et al. Dysbiosis is one of the risk factor for stroke and cognitive impairment and potential target for treatment. Pharmacol Res. (2021) 164:105277. doi: 10.1016/j.phrs.2020.105277
51. Shi, D, Chen, X, and Li, Z. Diagnostic test accuracy of the Montreal cognitive assessment in the detection of post-stroke cognitive impairment under different stages and cutoffs: a systematic review and meta-analysis. Neurol Sci. (2018) 39:705–16. doi: 10.1007/s10072-018-3254-0
52. Lees, R, Selvarajah, J, Fenton, C, Pendlebury, ST, Langhorne, P, Stott, DJ, et al. Test accuracy of cognitive screening tests for diagnosis of dementia and multidomain cognitive impairment in stroke. Stroke. (2014) 45:3008–18. doi: 10.1161/STROKEAHA.114.005842
53. O'Donoghue, M, Leahy, S, Boland, P, Galvin, R, McManus, J, and Hayes, S. Rehabilitation of cognitive deficits poststroke: systematic review and meta-analysis of randomized controlled trials. Stroke. (2022) 53:1700–10. doi: 10.1161/STROKEAHA.121.034218
54. Saa, JP, Tse, T, Baum, CM, Cumming, T, Josman, N, Rose, M, et al. Cognitive recovery after stroke: a meta-analysis and Metaregression of intervention and cohort studies. Neurorehabil Neural Repair. (2021) 35:585–600. doi: 10.1177/15459683211017501
55. Lee, M, Saver, JL, Hong, KS, Wu, YL, Liu, HC, Rao, NM, et al. Cognitive impairment and risk of future stroke: a systematic review and meta-analysis. CMAJ Can Med Assoc J. (2014) 186:E536–46. doi: 10.1503/cmaj.140147
56. Kwon, HS, Lee, D, Lee, MH, Yu, S, Lim, JS, Yu, KH, et al. Post-stroke cognitive impairment as an independent predictor of ischemic stroke recurrence: PICASSO sub-study. J Neurol. (2020) 267:688–93. doi: 10.1007/s00415-019-09630-4
Keywords: cognitive impairment, prediction, machine learning, stroke, meta-analysis
Citation: Li X, Chen Z, Jiao H, Wang B, Yin H, Chen L, Shi H, Yin Y and Qin D (2023) Machine learning in the prediction of post-stroke cognitive impairment: a systematic review and meta-analysis. Front. Neurol. 14:1211733. doi: 10.3389/fneur.2023.1211733
Edited by:
Giulia Abate, University of Brescia, ItalyReviewed by:
Lei Wang, The Ohio State University, United StatesShubham Misra, Yale University, United States
Copyright © 2023 Li, Chen, Jiao, Wang, Yin, Chen, Shi, Yin and Qin. This is an open-access article distributed under the terms of the Creative Commons Attribution License (CC BY). The use, distribution or reproduction in other forums is permitted, provided the original author(s) and the copyright owner(s) are credited and that the original publication in this journal is cited, in accordance with accepted academic practice. No use, distribution or reproduction is permitted which does not comply with these terms.
*Correspondence: Hongling Shi, a21zaGwxQDEyNi5jb20=; Yong Yin, eXlpbnBtckB5bnUuZWR1LmNu; Dongdong Qin, cWluZG9uZzEwOEAxNjMuY29t
†These authors have contributed equally to this work