 Dan Li1
 Mingrong Xia
 Jiewen Zhang
 Weizhou Zang
- 1Department of Neurology, Henan Provincial People's Hospital, People's Hospital of Zhengzhou University, People's Hospital of Henan University, Zhengzhou, China
- 2Department of Neurosurgery, Henan Provincial People's Hospital, People's Hospital of Zhengzhou University, People's Hospital of Henan University, Zhengzhou, China
Aim: Red blood cell distribution width-to-albumin ratio (RAR) is a combined new indicator reflecting immunology and has been reported to predict the prognosis of inflammation-related diseases and brain diseases. However, the association and predictive value of RAR in the prognosis of patients with autoimmune encephalitis (AE) has not been reported.
Methods: This was a retrospective cohort study, and data were collected from the Henan Provincial People’s Hospital. RAR was categorized according to quartile. The prognosis was assessed using the modified Rankin Scale (mRS), and an mRS score of ≥3 was defined as a poor prognosis. The logistical regression model was used to explore the association between RAR and the prognosis, with results reported as odds ratio (OR) and 95% confidence interval (CI). The predictive value of RAR was evaluated by calculating the area under the receiving operating curve (AUC), sensitivity, specificity, and accuracy.
Results: A total of 175 eligible patients were included for analysis, and 51 patients were identified as having poor prognosis. After adjusting age, cancer, other diseases, histological subtype, antiepileptic therapy, anti-tumor treatment, ICU treatment, and length of stay, RAR in the highest quartile (Q4) was found to be significantly associated with the high odds of poor prognosis (OR = 5.63, 95%CI: 1.98–16.02) compared to RAR in the lowest quartile (Q1). In addition, RAR was identified as a predictor for the prognosis of AE patients (AUC = 0.660, 95%CI: 0.574–0.746).
Conclusion: This study found the close association and predictive value of RAR for the prognosis of AE patients, indicating that RAR might help clinicians identify high-risk populations.
Introduction
Autoimmune encephalitis (AE) is a severe inflammatory disorder of the brain, which is mediated by autoimmune mechanisms and characterized by prominent neuropsychiatric symptoms (1). AE is considered to be related to antibodies against neuronal cell surface proteins, ion channels, or receptors, and accounts for approximately 20% of all adult encephalitis cases (1, 2). As a heterogeneous disease, AE is characterized by complex clinical manifestations and frequent complications (3, 4). Although approximately 80% of AE patients recover well after immunotherapy, there are still some patients not responding to the treatments (3, 4). Therefore, exploring biomarkers related to the prognosis of AE patients is of great clinical significance.
Immunity and inflammation are important mechanisms for the onset and progression of AE (5, 6). Red blood cell distribution width (RDW) is a biomarker reflecting the variation in red blood cell size, and a high value of RDW is related to inflammation (7). Increasing RDW value has been reported to be associated with the development and prognosis of many inflammation-related diseases including autoimmune diseases, such as acute kidney injury, autoimmune liver diseases, and autoimmune gastritis (8–10). However, the prognostic role of RDW has not been reported in AE.
Albumin (ALB) is also a biomarker reflecting inflammatory response and nutritional states, and the level of ALB is decreased in the inflammatory state (11). A study has shown that low concentration of serum ALB is significantly associated with the short-term and long-term adverse prognosis in AE patients (12). Existing studies believed that the ratio of RDW to ALB (RAR) was a combined new indicator that can reflect immunology and nutrition and predict the prognosis of inflammation-related diseases and brain diseases (13, 14). Previous studies have reported the association between regular inflammation indicators, such as neutrophil-to-lymphocyte ratio (NLR) and the prognosis of AE (1, 15). However, the association between RAR and the prognosis of AE patients has not been reported.
In this study, we aimed to explore the association between RDW or RAR and the prognosis of AE patients. For the purpose of identifying the optimal biomarker, we attempted to compare the predictive value of RDW and RAR with other regular inflammation indicators [NLR and platelet to lymphocyte (PLR) ratio] in the prognosis of AE patients.
Methods
Study design
Patients with AE diagnosed in the Henan Provincial People’s Hospital from January 2017 to February 2022 were enrolled in this study. This retrospective cohort study has been reviewed and approved by the Ethics Committee of the Henan Provincial People’s Hospital (Number: 2022-1-233). The need for written informed consent was waived by the Ethics Committee of the Henan Provincial People’s Hospital due to the retrospective nature of the study.
Study population
Patients who met the following criteria were included: (1) those aged ≥16 years; (2) those with a positive serum and/or cerebrospinal fluid (CSF) antibody test for neuronal cell surface antibodies; and (3) those with completely preserved clinical data. Patients who met one of the following criteria were excluded: (1) those receiving immunotherapy before laboratory examination; (2) those with other autoimmune diseases; (3) those with respiratory tract infection, urinary system infection, or other infectious diseases at the time of admission; (4) those with a modified Rankin Scale (mRS) score of ≥2 points before the onset of AE; (5) those with infectious encephalitis, epidemic encephalitis, unexplained encephalitis, central nervous system tumors, demyelinating diseases, and other neurological diseases; (6) those not detecting RDW; (7) those not detecting albumin; and (8) those lost to follow-up. The follow-up period was 1 year after admission, and the follow-up was ended if patients died.
Data collection and definition
Data were collected based on demographic characteristics, living habits, history of diseases, laboratory examination, cerebrospinal fluid examination, imaging examination, disease characteristics, treatment-related information, factors for poor prognosis in the prediction model reported by another study (reported model), and Clinical Assessment Scale in Autoimmune Encephalitis (CASE) score.
Demographic characteristics include age, sex, and body mass index (BMI). BMI was calculated as weight (kg)/height (m)2 and divided into underweight (< 18.5 kg/m2), normal weight (18.5 kg/m2 ≤ BMI < 24 kg/m2), overweight (24 kg/m2 ≤ BMI < 28 kg/m2), and obesity (≥ 28 kg/m2) (16).
Living habits contained drinking (no/yes) and smoking (no/yes).
History of diseases contained cancer and other diseases. Other diseases included diabetes, hypertension, cardiovascular diseases, hyperlipidemia, hyperthyroidism, viral myocarditis, peripheral facial paralysis, lower limb vein thrombosis, asthma, kidney stone disease, brain injury, hepatitis B, duodenal ulcer, myocardial ischemia, and erosive gastritis.
Laboratory examination included the routine blood test, liver function test, and renal function test. Routine blood indicators contained hemoglobin, red blood cells (RBC), white blood cells (WBC), platelets, neutrophils, lymphocytes, monocytes, and mean platelet volume (MPV). Liver function indicators contained alanine transaminase (ALT), aspartate aminotransferase (AST), gamma-glutamyltransferase (GGT), alkaline phosphatase (ALP), albumin, and globulin. Renal function indicators contained blood urea nitrogen (BUN), creatinine, and uric acid.
Cerebrospinal fluid examination contained increased cerebrospinal fluid pressure (no/yes), increased cerebrospinal fluid protein (no/yes), and increased cerebrospinal fluid WBC (no/yes).
Imaging examination contained the results of magnetic resonance imaging (MRI) and divided into normal and abnormal.
Disease characteristics contained Glasgow coma score (GCS), clinical features (mental and behavioral abnormalities, limb numbness and weakness, autonomic dysfunction, epileptic seizure, and others), and histological subtype [N-methyl-D-aspartic acid receptor antibody (anti-NMDAR), paraneoplastic, and others]. The GCS was used to assess the degree of coma and calculated based on the sum of the scores for the functions of eye opening, verbal response, and motor response, with a lower score indicating a higher degree of coma (17).
Treatment-related information contained immunotherapy regimen (first-line agent, first-line combined second-line agents, second-line agent, and none), antiepileptic therapy (no/yes), antipsychotic therapy (no/yes), anti-tumor treatment (no/yes), intensive care unit (ICU) treatment (no/yes), and length of stay.
Factors in the reported model included viral prodrome (no/yes), memory dysfunction (no/yes), consciousness impairment (no/yes), and autonomic dysfunction (no/yes) (4).
The CASE score included nine items: seizure, memory dysfunction, psychiatric symptoms, consciousness, language problems, dyskinesia/dystonia, gait instability and ataxia, brainstem dysfunction, and muscle weakness (18). In this study, one point was assigned for the occurrence of one item.
Exposures
Exposures were RDW, RAR, PLR, and NLR, which were divided according to quartile. RDW was divided into Q1 (RDW < 41 fL), Q2 (41 fL ≤ RDW < 43 fL), Q3 (43 fL ≤ RDW < 45 fL), and Q4 (RDW ≥ 45 fL). RAR was divided into Q1 (< 1.00), Q2 (1.00–1.09), Q3 (1.09–1.22), and Q4 (≥ 1.22). PLR was divided into Q1 (< 108.40), Q2 (108.40–134.33), Q3 (134.33–177.52), and Q4 (≥ 177.52). NLR was divided into Q1 (< 1.85), Q2 (1.85–2.69), Q3 (2.69–4.20), and Q4 (≥ 4.20).
Outcome
The outcome was 1-year mRS. The mRS score contained six categories: no disability (mRS = 0); with no significant functional impairment and could complete all daily duties and activities despite some symptoms (mRS 1 point); with a mild disability that is unable to complete all previous activities but could look after one’s own affairs without assistance (mRS 2 points); with a moderate disability that required some assistance in daily life but could walk independently (mRS 3 points); with a moderate–severe disability that required others to take care of them and could not walk independently (mRS 4 points); a severe disability that required intensive care (mRS 5 points); and death (mRS 6 points) (19). Patients with an mRS score of 0–2 were defined as good prognosis, and patients with an mRS score of 3–6 were defined as poor prognosis (19).
Statistical analysis
The continuous data in normal distribution were expressed as mean ± standard deviation (Mean ± SD), and the t-test was used to compare the differences between the two groups. The continuous data in skew distribution were expressed as median and quartile [M (Q1, Q3)], and the Wilcoxon rank sum test was used to compare the differences between the two groups. The categorized data were expressed as number and percentage [n (%)], and the chi-squared test or Fisher’s exact test was used to compare the difference between the two groups. The missing data were processed using random forest imputation.
Univariate and multivariate logistical regression models were used to explore the association between RDW, RAR, PLR, NLR, and the prognosis (mRS), and results were shown as odds ratio (OR) with 95% confidence interval (CI). The potential covariables were selected using the univariate logistical regression model. Restricted cubic spline (RCS) was used to assess the association between RAR and the odds of poor prognosis. The predictive value of RAR in the prognosis of AE patients was assessed by calculating the area under the receiving operating curve (AUC), sensitivity, specificity, and accuracy. A visual calibration plot was used to evaluate calibration.
To further assess the predictive value of RAR, we assessed the predictive performance of model based on CASE, CASE + RAR, reported model, and reported model + RAR. The net reclassification improvement (NRI) and integrated discrimination improvement (IDI) were computed to assess the performance improvement of the CASE + RAR-based or reported model + RAR-based models over the CASE-based or reported model-based models (20). Positive values of IDI indicated better performance in the new model than in the reference model. The statistical analysis was performed using Python 3.9.12 (Python Software Foundation, Delaware, United States) and SAS 9.4 (SAS Institute Inc., Cary, NC, United States). A p-value of <0.05 was considered to be statistically significant.
Results
Selection and characteristics of the study population
A total of 355 patients aged ≥16 years old with a positive serum and/or cerebrospinal fluid antibody test were included in this study. Of these, 180 patients were excluded due to receiving immunotherapy before laboratory examination (n = 33), with other autoimmune diseases (n = 27), with respiratory tract infection, urinary system infection, or other infectious diseases at the time of admission (n = 6), with mRS ≥ 2 points before the onset of AE (n = 1), with infectious encephalitis, epidemic encephalitis, unexplained encephalitis, central nervous system tumors, demyelinating diseases, and other neurological diseases (n = 56), not detecting RDW (n = 46), not detecting albumin (n = 7), and lost to follow-up (n = 4). Finally, 175 eligible patients were included, with 124 patients in the favorable prognosis group and 51 patients in the poor prognosis (Figure 1). Sensitivity analysis showed that there was no statistical significance between before imputation and after imputation (Supplementary Table S1).
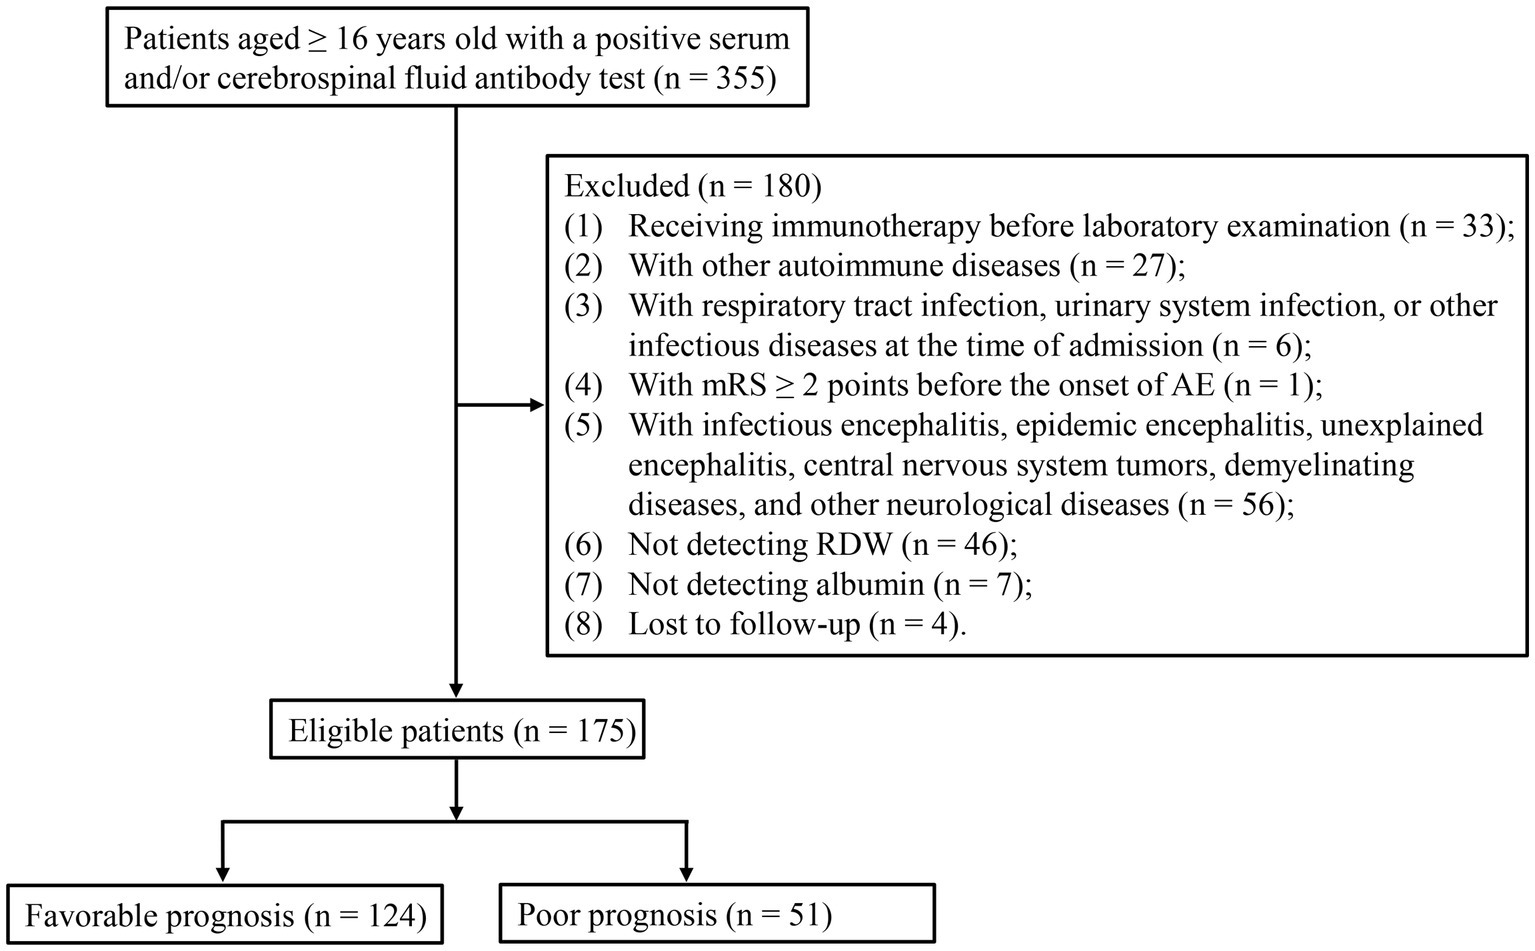
Figure 1. Flowchart for the selection of participants.
The baseline information of 175 patients is shown in Table 1. This study consisted of 96 male (54.86%) and 79 female (45.14%) subjects with a median age of 54 (31, 65) years. There was statistical significance in age, cancer, other diseases, ALT, clinical features, histological subtype, antiepileptic therapy, anti-tumor treatment, ICU treatment, follow-up time, and RAR between the favorable prognosis group and the poor prognosis group.
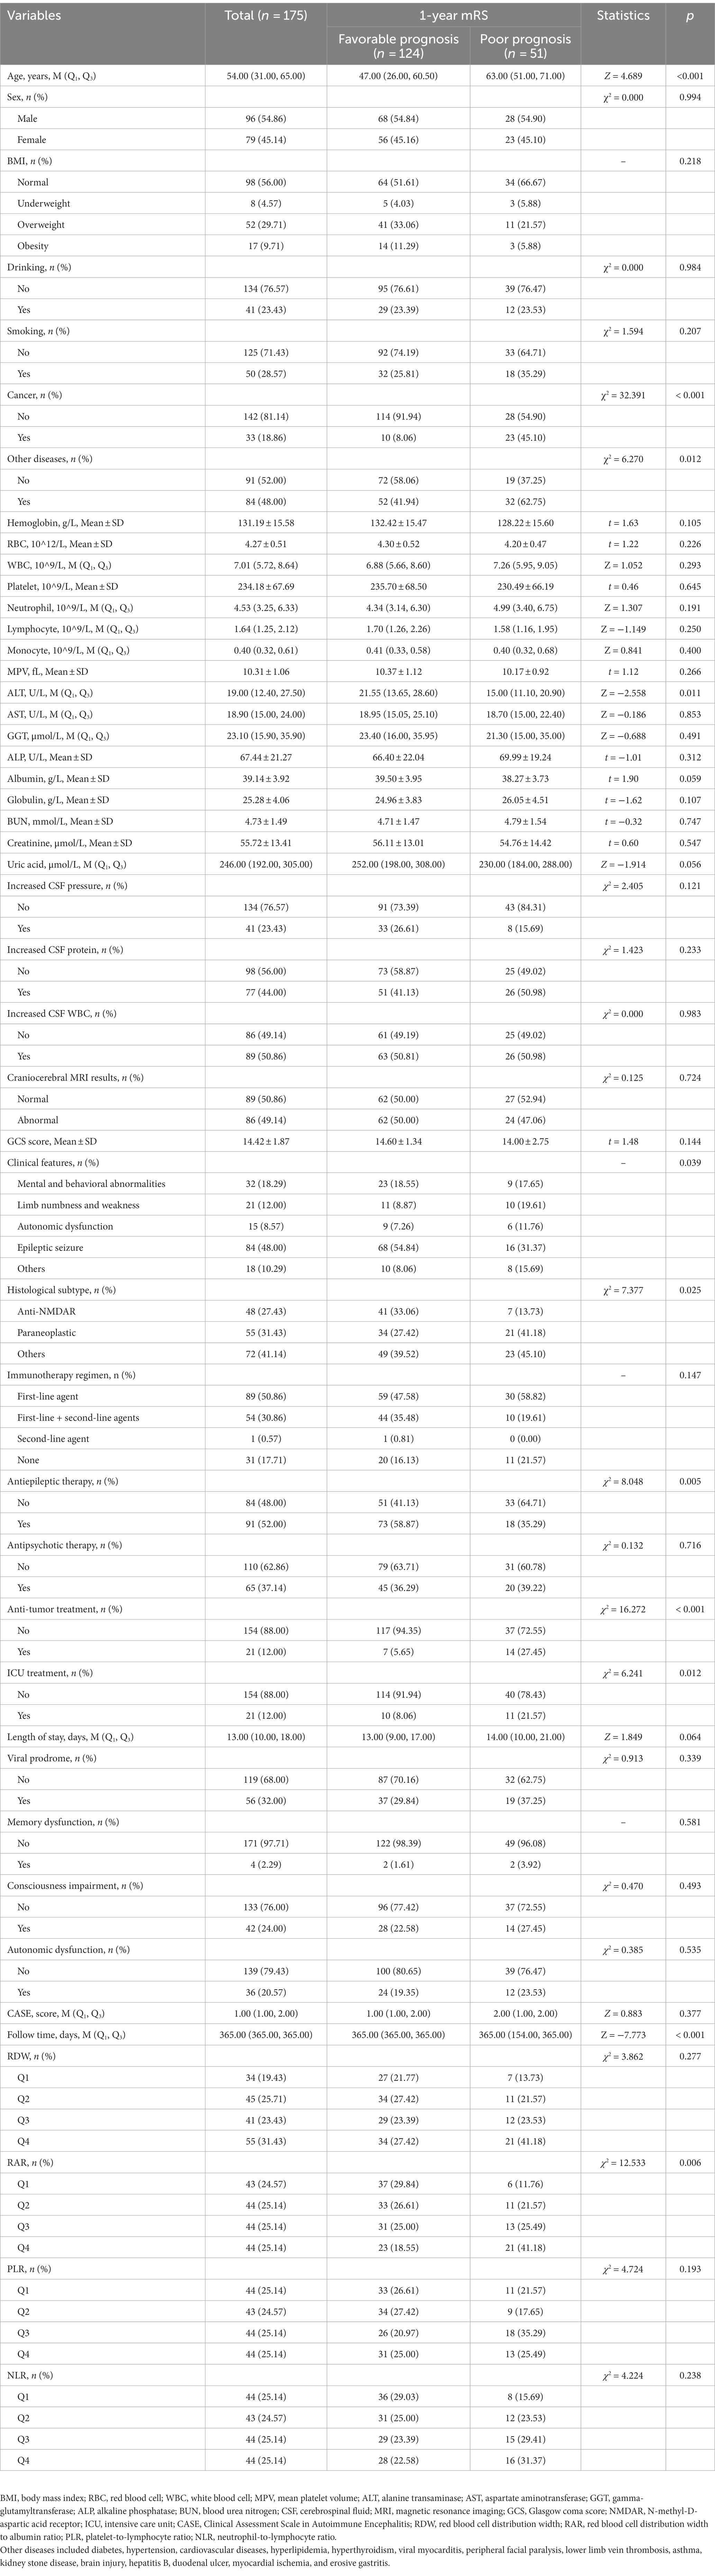
Table 1. Characteristics of the favorable prognosis group and poor prognosis group.
Association between RDW, RAR, PLR, NLR, and the prognosis of AE patients
Supplementary Table S2 shows that age (OR = 1.05, 95% CI: 1.03–1.07), cancer (OR = 9.36, 95%CI: 4.00–21.90), other diseases (OR = 2.33, 95% CI: 1.19–4.56), histological subtype (paraneoplastic: OR = 3.62, 95% CI: 1.37–9.53; others: OR = 2.75, 95% CI: 1.07–7.05), antiepileptic therapy (OR = 0.38, 95% CI: 0.19–0.75), anti-tumor treatment (OR = 6.32, 95% CI: 2.37–16.85), ICU treatment (OR = 3.13, 95% CI: 1.24–7.94), and length of stay (OR = 1.04, 95% CI: 1.01–1.07) were identified as the covariables.
Table 2 displays that the highest quartile (Q4) of RAR was significantly associated with the higher odds of poor prognosis (OR = 5.63, 95% CI: 1.98–16.02) compared to the lowest quartile (Q1) of RAR. After adjusting age, cancer, other disease, histological subtype, antiepileptic therapy, anti-tumor treatment, ICU treatment, and length of stay, we also found a positive association between RAR in the Q4 and the poor prognosis (OR = 3.38, 95% CI: 1.01–11.37). The RCS curve showed that the odds of poor prognosis in AE patients increased with the increase of RAR (Figure 2). There was no difference between RDW, PLR, NLR, and the prognosis of AE patients (all p > 0.05).
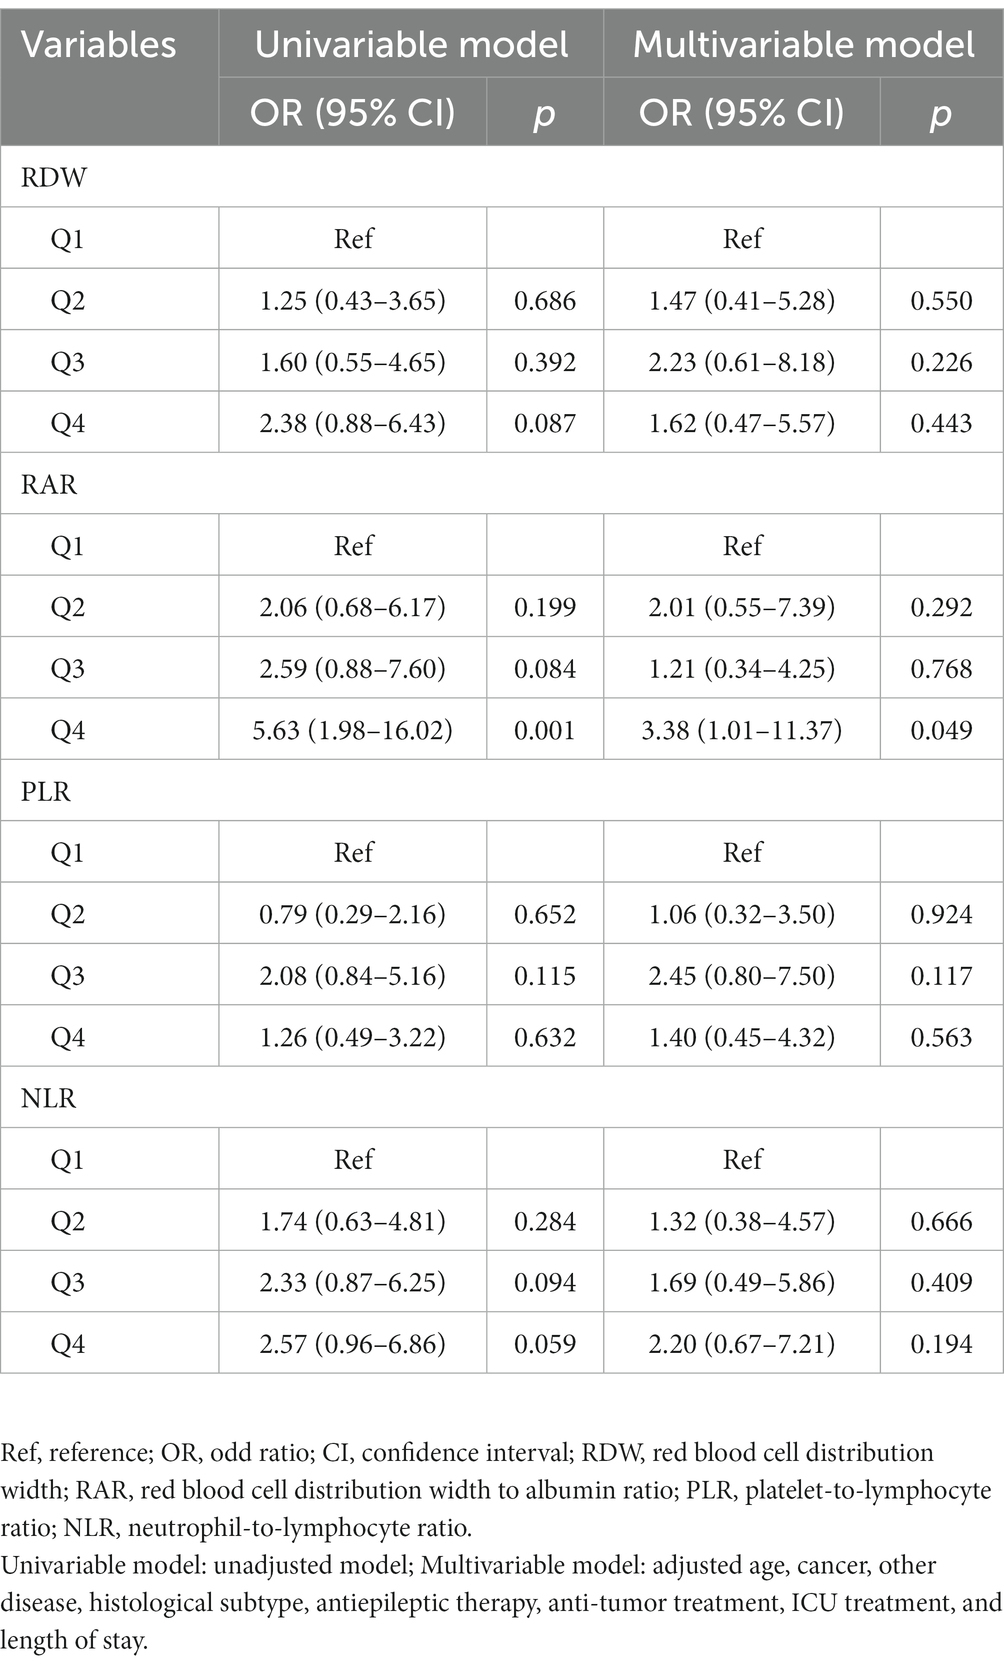
Table 2. Association between RDW, RAR, PLR, NLR, and 1-year mRS score.
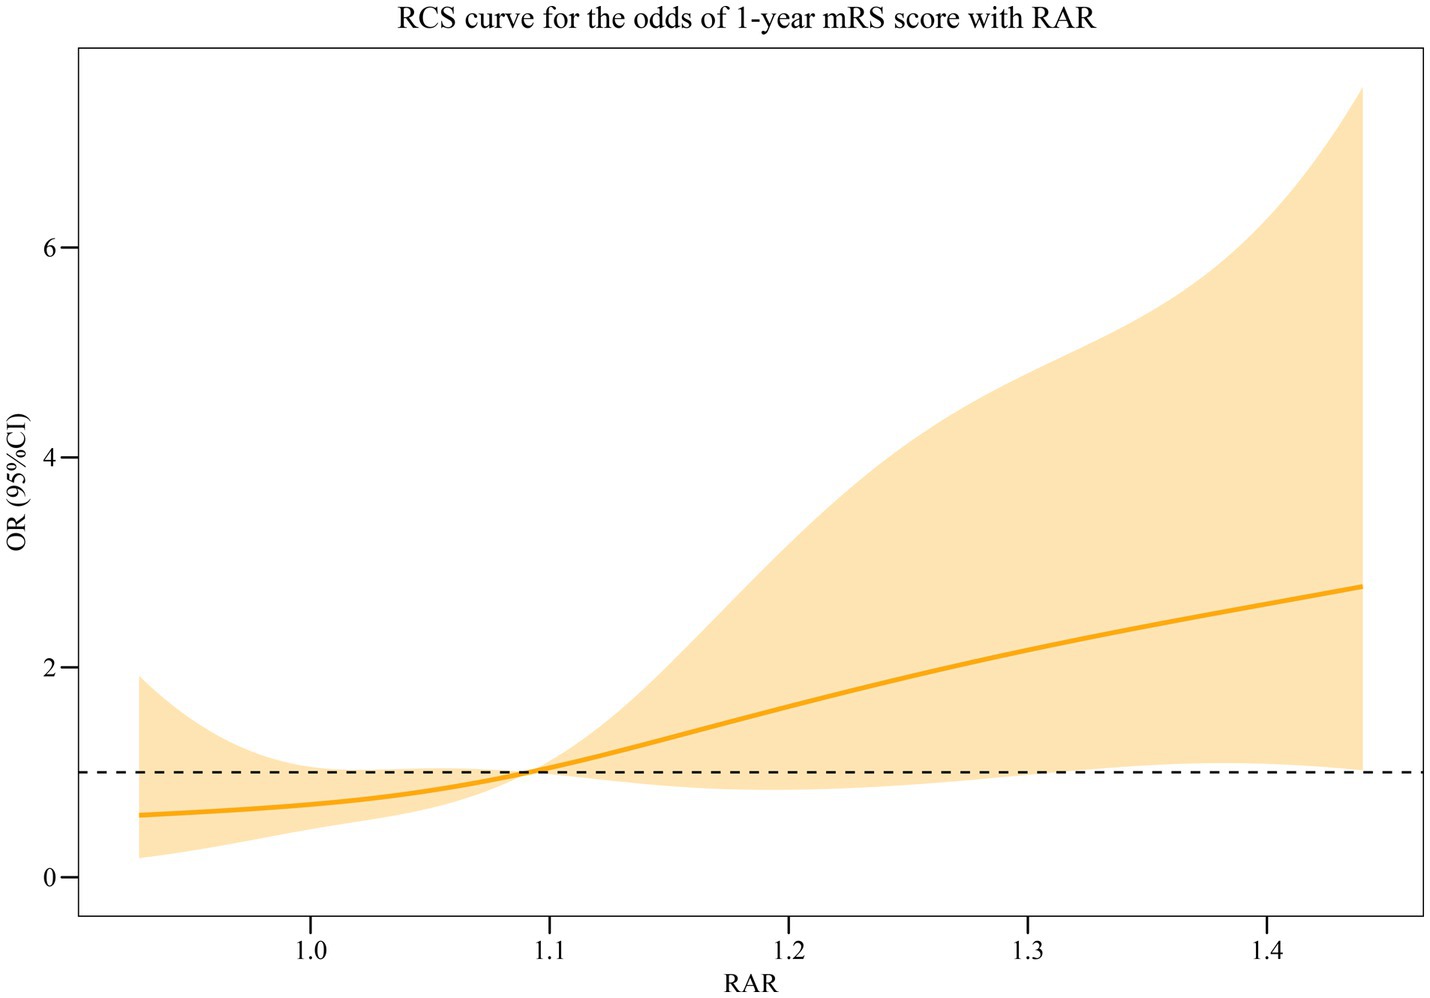
Figure 2. RCS curve for the association between RAR and the odds of poor prognosis in AE patients.
Predictive value of RAR in the prognosis of AE patients
Table 3 shows that the RAR was found as a predictor for the prognosis of AE patients, with an AUC of 0.660 (95% CI: 0.574–0.746) (Figure 3A) and an optimal cutoff value of 0.25 (sensitivity 66.7% and specificity 56.5%). Figure 3B demonstrates that the predicted probability of the poor prognosis fits well with the actual probability. For the multivariable model, the AUC was 0.840 (95% CI: 0.776–0.905) (Figure 4A), and the optimal cutoff value was 0.35 (sensitivity 74.5% and specificity 82.3%). The calibration plot demonstrated the good calibration of the multivariable model (Figure 4B).
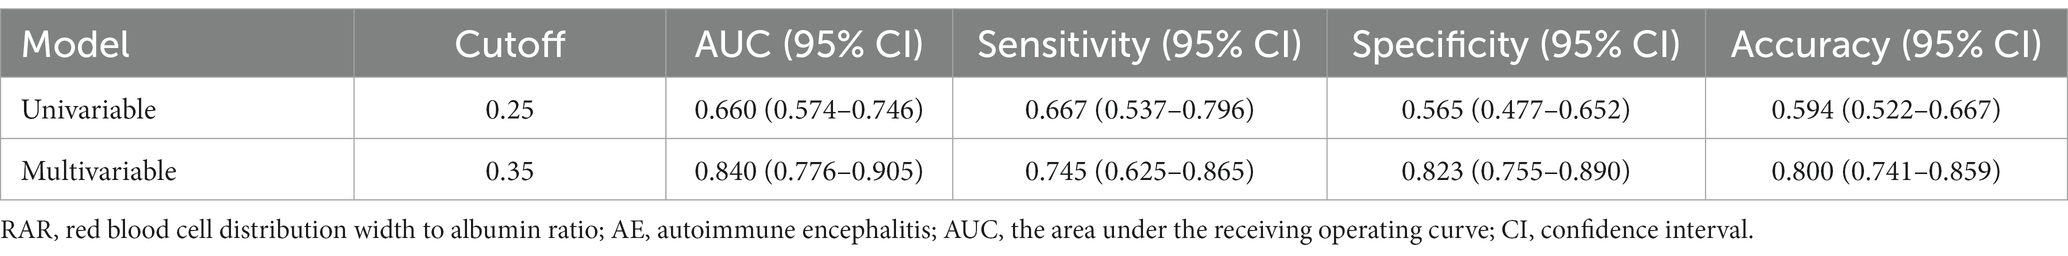
Table 3. Predictive value of RAR in the prognosis of AE patients.
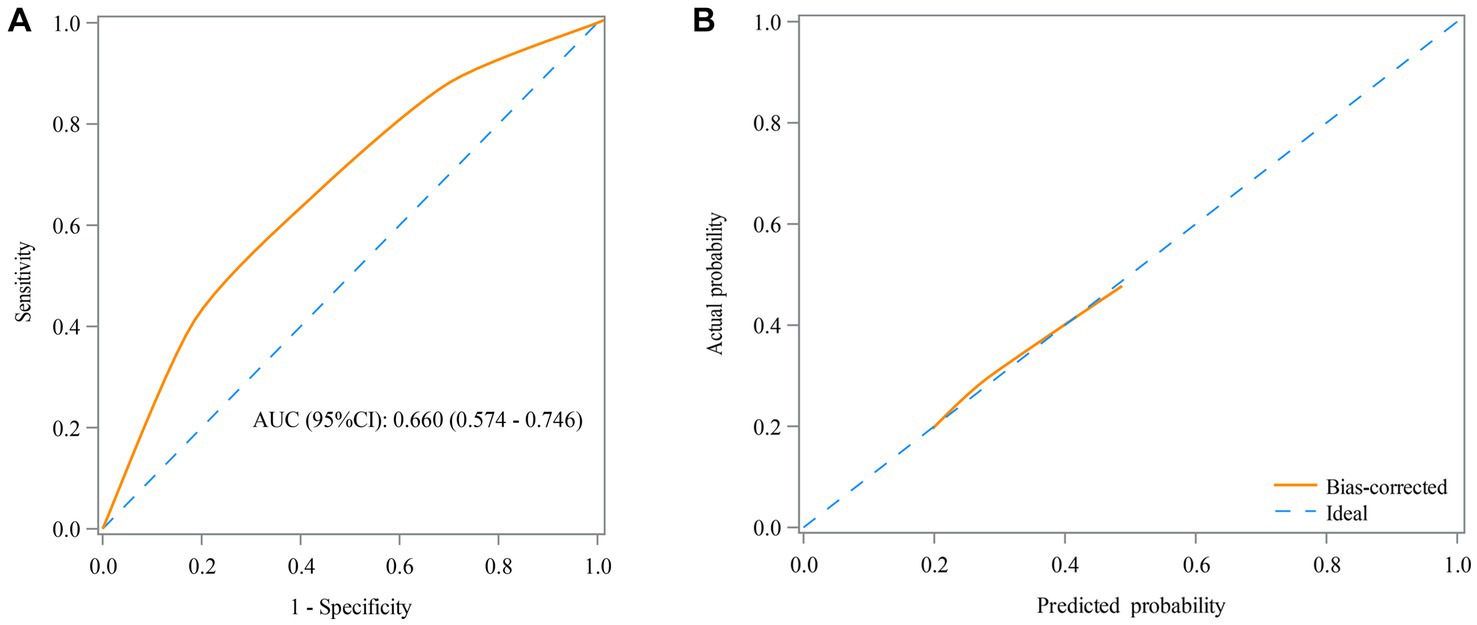
Figure 3. Receiver operating characteristic (ROC) curve (A) and calibration curve (B) for the predictive value of RAR in the prognosis of AE patients in the univariable model.
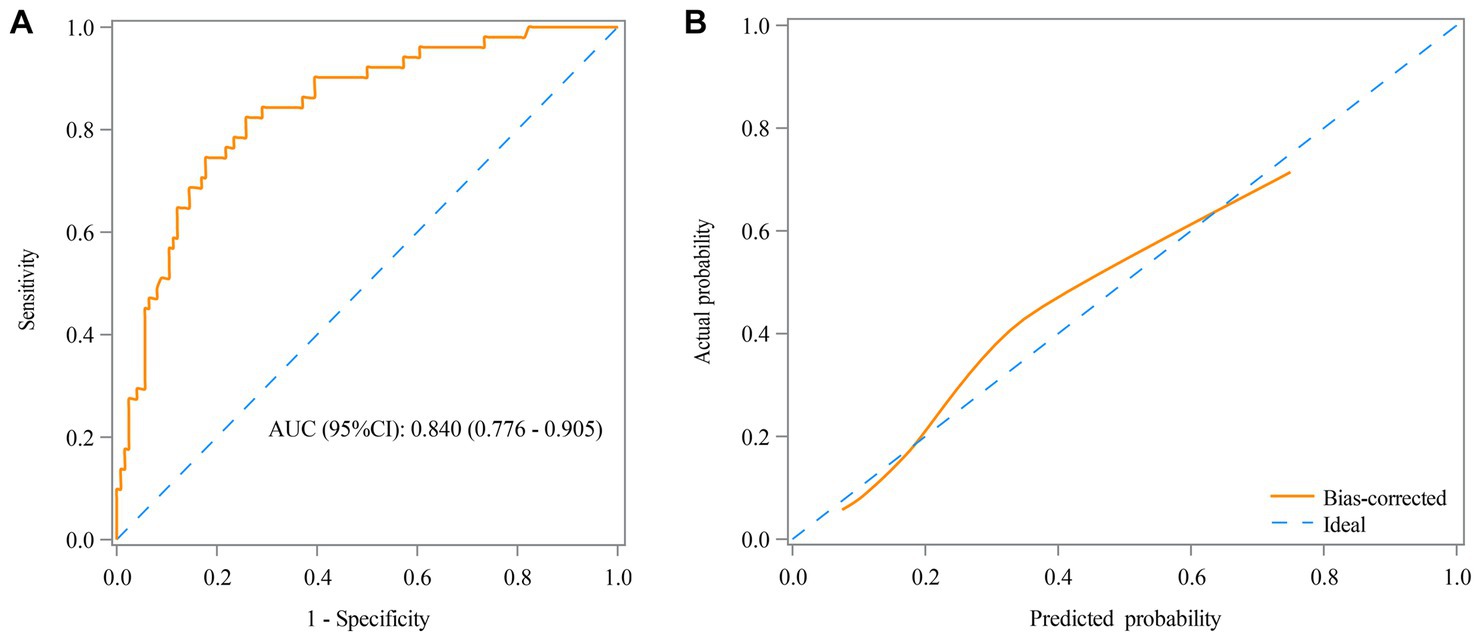
Figure 4. Receiver operating characteristic (ROC) curve (A) and calibration curve (B) for the predictive value of RAR in the prognosis of AE patients in the multivariable model.
Supplementary Table S3 lists the predictive performances of the risk prediction models based on CASE, CASE + RAR, reported model, reported model + RAR in terms of prognosis of AE patients. The CASE and CASE + RAR model for the poor prognosis of AE patients had an AUC of 0.540 (95% CI: 0.450–0.630) and 0.674 (95% CI: 0.586–0.761), respectively. When we compared the two models, the CASE + RAR model had a significantly better reclassification performance (NRI: 0.524, p = 0.001) and integrated discrimination (IDI = 0.076, p < 0.001) than the CASE model. The reported model and reported model + RAR model for the poor prognosis of AE patients had an AUC of 0.674 (95% CI: 0.592–0.757) and 0.725 (95% CI: 0.647–0.803), respectively. When we compared the two models, the reported model + RAR model had a significantly better reclassification performance (NRI: 0.453, p = 0.003) and integrated discrimination (IDI = 0.062, p = 0.002) than the reported model. These findings indicated that RAR significantly improved the predictive performance of CASE score and reported model.
Discussion
Autoimmune encephalitis (AE) is an autoimmune inflammatory disease that targets the surface of neuronal cell or synaptic proteins in the central nervous system (1). RAR was a combined indicator reflecting immunology and nutrition and has been reported to predict the prognosis of several inflammation-related diseases and brain diseases (13, 14). Some regular inflammation indicators have been found to be associated with the prognosis of AE (1, 15). In this study, we retrospectively explored the association between RAR and the prognosis of AE patients. The results displayed that the high level of RAR was associated with the high odds of poor prognosis in AE patients. The AUC of RAR for the poor prognosis in AE patients was 0.660. The combination of the RAR with the CASE score and reported model significantly improved their prognostic predictive performance.
RDW increases in response to inflammatory stimuli (21). It has been reported that the increase of RDW is associated with poor prognosis of many inflammatory diseases, such as sepsis, pneumonia, and acute respiratory distress syndrome (22–24). In addition, RDW was found to be associated with autoimmune diseases (25–27). The potential mechanism was that inflammation activity inhibited iron metabolism and erythropoietin production, and more immature cells were released into the bloodstream, which led to an increase in the RDW level (27). Another potential explanation was that the inflammatory cytokines may inhibit the maturation of erythrocytes and accelerate the entry of immature and larger volume reticulocytes into the peripheral circulation, therefore leading to the increase of RDW (27). ALB was a kind of multifunctional non-glycosylated plasma protein, which could downregulate the expression and transport of inflammatory factors and decrease the inflammatory cascade reactions (28). The microvascular permeability and ALB escape were increased in an inflammatory state, which enlarged the interstitial space and increased the distribution volume of ALB (29). Moreover, the half-life of ALB was shortened in an inflammatory state, which reduced the total mass of ALB (29). The ALB level was found to be significantly lower in AE patients than in healthy controls (30). Jang et al. have reported that ALB may be a prognostic indicator in AE patients (12). Low ALB was associated with the higher severity of AE patients, and mRS in the low ALB group improved more slowly than in the high ALB group (12). RAR combined both RDW and ALB and reflected the state of the systemic immune response and inflammatory response (12). In this study, we found that high RAR was associated with higher odds of poor prognosis in AE patients.
Our study also explored the predictive performance of RAR in the prognosis of AE patients. RDW has been reported to independently predict the progression, disease activity, and prognosis of several autoimmune diseases, such as systemic lupus erythematosus, rheumatoid arthritis, and autoimmune hepatitis (25–27). ALB was also reported to independently predict the prognosis of patients with inflammation-induced diseases (31). The existing study has reported the predictive performance of RAR in the prognosis of patients with autoimmune diseases (32). Yin et al. have found that the predictive performance of RAR (AUC = 0.643) was very close to the acute physiology and chronic health evaluation (APACHE) II score (AUC = 0.699) and sequential organ failure assessment (SOFA) score (AUC = 0.691) for the prediction of the prognosis in patients with rheumatic diseases (32). In this study, we found that the AUC of RAR for the poor prognosis of AE patients was 0.660. In the multivariable model that RAR combined with some potential covariates (age, cancer, other diseases, histological subtype, antiepileptic therapy, anti-tumor treatment, ICU treatment, and length of stay), the AUC reached up to 0.840. The CASE score was designed to assess the severity of AE (18). A previous study also developed a model with good performance to predict the prognosis in AE (reported model) (4). Furthermore, when RAR was combined with the CASE score and reported model, the predictive performance of the CASE score and reported model was significantly improved. The findings revealed that the combination of the RAR with the two models enhanced their prognostic predictive power. Our study indicated that RAR might be a practical predictor to monitor the odds of poor prognosis in AE patients.
This study explores the association between RAR and the prognosis of AE patients and further explores the predictive value of RAR, which provides a reference for the selection of AE prognostic markers. However, there are several limitations. First, this is a retrospective cohort study performed in a single center, which has inevitable selection bias and recall bias. Multicenter studies are needed to further verify our findings. Second, we find the association between RAR and the prognosis of AE patients, while the causal relationship cannot be determined (33). In future, more studies are needed to explore the causality. Third, data after discharge, such as changes in treatment methods, are not collected, which may affect results. Fourth, RAR is calculated before the treatment. Whether dynamic RAR might better predict results, the poor prognosis of AE patients needs to be further explored. Fifth, the included patients are all from China, and the generality of our results in the other populations outside of China is unclear. Future studies performed in other countries are needed.
Conclusion
In conclusion, our study found that high levels of RAR were significantly associated with high odds of poor prognosis in AE patients, and RAR was identified as a predictor for the prognosis of AE patients. Our findings indicated that RAR might be a practical biomarker to predict the odds of poor prognosis for AE patients, which may help clinicians identify high-risk populations.
Data availability statement
The raw data supporting the conclusions of this article will be made available by the authors, without undue reservation.
Ethics statement
The studies involving humans were approved by Henan Provincial People’s Hospital (Number: 2022-1-233). The studies were conducted in accordance with the local legislation and institutional requirements. The Ethics Committee/Institutional Review Board waived the requirement of written informed consent for participation from the participants or the participants' legal guardians/next of kin because retrospective nature of the study.
Author contributions
DL: Conceptualization, Supervision, Writing – original draft, Writing – review & editing. AY: Data curation, Formal analysis, Funding acquisition, Investigation, Methodology, Writing – review & editing. MX: Data curation, Formal analysis, Investigation, Methodology, Writing – review & editing. KM: Data curation, Formal analysis, Investigation, Methodology, Writing – review & editing. JZ: Data curation, Formal analysis, Investigation, Methodology, Writing – review & editing. YG: Conceptualization, Writing – original draft, Writing – review & editing. WZ: Conceptualization, Writing – original draft, Writing – review & editing.
Funding
The author(s) declare financial support was received for the research, authorship, and/or publication of this article. This study was funded by Youth Science Foundation Project (81603414).
Conflict of interest
The authors declare that the research was conducted in the absence of any commercial or financial relationships that could be construed as a potential conflict of interest.
Publisher’s note
All claims expressed in this article are solely those of the authors and do not necessarily represent those of their affiliated organizations, or those of the publisher, the editors and the reviewers. Any product that may be evaluated in this article, or claim that may be made by its manufacturer, is not guaranteed or endorsed by the publisher.
Supplementary material
The Supplementary material for this article can be found online at: https://www.frontiersin.org/articles/10.3389/fneur.2023.1276026/full#supplementary-material
References
1. Qiu, X, Zhang, H, Li, D, Wang, J, Jiang, Z, Zhou, Y, et al. Analysis of clinical characteristics and poor prognostic predictors in patients with an initial diagnosis of autoimmune encephalitis. Front Immunol. (2019) 10:1286. doi: 10.3389/fimmu.2019.01286
2. Harutyunyan, G, Hauer, L, Dünser, MW, Moser, T, Pikija, S, Leitinger, M, et al. Risk factors for intensive care unit admission in patients with autoimmune encephalitis. Front Immunol. (2017) 8:835. doi: 10.3389/fimmu.2017.00835
3. Abboud, H, Probasco, JC, Irani, S, Ances, B, Benavides, DR, Bradshaw, M, et al. Autoimmune encephalitis: proposed best practice recommendations for diagnosis and acute management. J Neurol Neurosurg Psychiatry. (2021) 92:757–68. doi: 10.1136/jnnp-2020-325300
4. Sun, Y, Ren, G, Ren, J, Shan, W, Han, X, Lian, Y, et al. A validated nomogram that predicts prognosis of autoimmune encephalitis: a Multicenter study in China. Front Neurol. (2021) 12:612569. doi: 10.3389/fneur.2021.612569
5. Wesselingh, R, Butzkueven, H, Buzzard, K, Tarlinton, D, O'Brien, TJ, and Monif, M. Innate immunity in the central nervous system: a missing piece of the autoimmune encephalitis puzzle? Front Immunol. (2019) 10:2066. doi: 10.3389/fimmu.2019.02066
6. Liu, Z, Li, Y, Wang, Y, Zhang, H, Lian, Y, and Cheng, X. The neutrophil-to-lymphocyte and monocyte-to-lymphocyte ratios are independently associated with the severity of autoimmune encephalitis. Front Immunol. (2022) 13:911779. doi: 10.3389/fimmu.2022.911779
7. Aslam, H, Oza, F, Ahmed, K, Kopel, J, Aloysius, MM, Ali, A, et al. The role of red cell distribution width as a prognostic marker in chronic liver disease: a literature review. Int J Mol Sci. (2023) 24:3487. doi: 10.3390/ijms24043487
8. Ustaoglu, M, Aktas, G, Avcioglu, U, Bas, B, and Bahceci, BK. Elevated platelet distribution width and red cell distribution width are associated with autoimmune liver diseases. Eur J Gastroenterol Hepatol. (2021) 33:e905–8. doi: 10.1097/meg.0000000000002296
9. Tüzün, A, Keskin, O, Yakut, M, Kalkan, C, and Soykan, I. The predictive value of mean platelet volume, Plateletcrit and red cell distribution width in the differentiation of autoimmune gastritis patients with and without type I gastric carcinoid Tumors. Platelets. (2014) 25:363–6. doi: 10.3109/09537104.2013.821607
10. Zhu, J, Zeng, C, Zhang, L, Shu, S, Liu, Y, Chen, G, et al. Red blood cell distribution width and neutrophil-to-lymphocyte ratio in predicting adverse outcomes of acute kidney injury in hospitalized patients. Kidney diseases (Basel, Switzerland). (2020) 6:371–81. doi: 10.1159/000507859
11. Artigas, A, Wernerman, J, Arroyo, V, Vincent, JL, and Levy, M. Role of albumin in diseases associated with severe systemic inflammation: pathophysiologic and clinical evidence in sepsis and in decompensated cirrhosis. J Crit Care. (2016) 33:62–70. doi: 10.1016/j.jcrc.2015.12.019
12. Jang, Y, Lee, ST, Kim, TJ, Jun, JS, Moon, J, Jung, KH, et al. High albumin level is a predictor of Favorable response to immunotherapy in autoimmune encephalitis. Sci Rep. (2018) 8:1012. doi: 10.1038/s41598-018-19490-z
13. Gao, C, and Peng, L. Association and prediction of red blood cell distribution width to albumin ratio in all-cause mortality of acute kidney injury in critically ill patients. Front Med. (2023) 10:1047933. doi: 10.3389/fmed.2023.1047933
14. Liu, P, Luo, S, Duan, XJ, Chen, X, Zhou, Q, Jiang, Y, et al. Rdw-to-Alb ratio is an independent predictor for 30-day all-cause mortality in patients with acute ischemic stroke: a retrospective analysis from the mimic-iv database. Behav Neurol. (2022) 2022:3979213. doi: 10.1155/2022/3979213
15. Broadley, J, Wesselingh, R, Seneviratne, U, Kyndt, C, Beech, P, Buzzard, K, et al. Peripheral immune cell ratios and clinical outcomes in seropositive autoimmune encephalitis: a study by the Australian autoimmune encephalitis consortium. Front Immunol. (2020) 11:597858. doi: 10.3389/fimmu.2020.597858
16. Ao, H, Wang, X, Xu, F, Zheng, Z, Chen, M, Li, L, et al. The impact of body mass index on short- and long-term outcomes in patients undergoing coronary artery graft bypass. PLoS One. (2014) 9:e95223. doi: 10.1371/journal.pone.0095223
17. Salottolo, K, Panchal, R, Dhakal, L, Madayag, R, Banton, K, Tanner, A, et al. Recalibrating the Glasgow coma score as an age-adjusted risk metric for neurosurgical intervention. J Surg Res. (2021) 268:696–704. doi: 10.1016/j.jss.2021.08.002
18. Zhang, Y, Tu, E, Yao, C, Liu, J, Lei, Q, and Lu, W. Validation of the clinical assessment scale in autoimmune encephalitis in Chinese patients. Front Immunol. (2021) 12:796965. doi: 10.3389/fimmu.2021.796965
19. Balu, R, McCracken, L, Lancaster, E, Graus, F, Dalmau, J, and Titulaer, MJ. A score that predicts 1-year functional status in patients with anti-Nmda receptor encephalitis. Neurology. (2019) 92:e244–52. doi: 10.1212/wnl.0000000000006783
20. Sasagawa, Y, Inoue, Y, Futagami, K, Nakamura, T, Maeda, K, Aoki, T, et al. Application of deep neural survival networks to the development of risk prediction models for diabetes mellitus, hypertension, and dyslipidemia. J Hypertens. (2023). doi: 10.1097/HJH.0000000000003626
21. Salvagno, GL, Sanchis-Gomar, F, Picanza, A, and Lippi, G. Red blood cell distribution width: a simple parameter with multiple clinical applications. Crit Rev Clin Lab Sci. (2015) 52:86–105. doi: 10.3109/10408363.2014.992064
22. Hu, ZD, Lippi, G, and Montagnana, M. Diagnostic and prognostic value of red blood cell distribution width in sepsis: a narrative review. Clin Biochem. (2020) 77:1–6. doi: 10.1016/j.clinbiochem.2020.01.001
23. Ren, Q, Liu, H, Wang, Y, Dai, D, Tian, Z, Jiao, G, et al. The role of red blood cell distribution width in the severity and prognosis of community-acquired pneumonia. Can Respir J. (2021) 2021:8024024–9. doi: 10.1155/2021/8024024
24. Wang, B, Gong, Y, Ying, B, and Cheng, B. Relation between red cell distribution width and mortality in critically ill patients with acute respiratory distress syndrome. Biomed Res Int. (2019) 2019:1942078–8. doi: 10.1155/2019/1942078
25. Zheng, CS, Qin, XJ, Ni, H, Chen, RY, Liu, JL, and Wang, WH. Evaluation of disease activity of systemic lupus erythematosus by D-dimer combined with red blood cell distribution width. Clin Lab. (2021) 67:7. doi: 10.7754/Clin.Lab.2021.210118
26. Rodríguez-Carrio, J, Alperi-López, M, López, P, Alonso-Castro, S, Ballina-García, FJ, and Suárez, A. Red cell distribution width is associated with cardiovascular risk and disease parameters in rheumatoid arthritis. Rheumatology (Oxford). (2015) 54:641–6. doi: 10.1093/rheumatology/keu345
27. Wang, H, Wang, J, Huang, R, Xia, J, Zuo, L, Yan, X, et al. Red blood cell distribution width for predicting significant liver inflammation in patients with autoimmune hepatitis. Eur J Gastroenterol Hepatol. (2019) 31:1527–32. doi: 10.1097/meg.0000000000001447
28. Utariani, A, Rahardjo, E, and Perdanakusuma, DS. Effects of albumin infusion on serum levels of albumin, proinflammatory cytokines (Tnf-Α, Il-1, and Il-6), Crp, and Mmp-8; tissue expression of Egrf, Erk1, Erk2, Tgf-Β, collagen, and Mmp-8; and wound healing in Sprague Dawley rats. Int J Inflamm. (2020) 2020:3254017. doi: 10.1155/2020/3254017
29. Soeters, PB, Wolfe, RR, and Shenkin, A. Hypoalbuminemia: pathogenesis and clinical significance. JPEN J Parenter Enteral Nutr. (2019) 43:181–93. doi: 10.1002/jpen.1451
30. Shu, Y, Xu, Y, Chen, C, Li, J, Li, R, Wu, H, et al. Serum bilirubin and albumin in anti-N-methyl-D-aspartate receptor encephalitis. Neuroimmunomodulation. (2018) 25:206–14. doi: 10.1159/000494801
31. Eckart, A, Struja, T, Kutz, A, Baumgartner, A, Baumgartner, T, Zurfluh, S, et al. Relationship of nutritional status, inflammation, and serum albumin levels during acute illness: a prospective study. Am J Med. (2020) 133:713–22.e7. doi: 10.1016/j.amjmed.2019.10.031
32. Yin, L, Min, J, Zhong, L, and Shen, Q. The correlation between red cell distribution width to albumin ratio and all-cause mortality in critically ill patients with rheumatic diseases: a population-based retrospective study. Front Med. (2023) 10:1199861. doi: 10.3389/fmed.2023.1199861
Keywords: RAR, autoimmune encephalitis, modified Rankin Scale, red blood cell distribution width, albumin
Citation: Li D, Yang A, Xia M, Ma K, Zhang J, Guo Y and Zang W (2024) Association between red blood cell distribution width-to-albumin ratio and the prognosis in patients with autoimmune encephalitis: a retrospective cohort study. Front. Neurol. 14:1276026. doi: 10.3389/fneur.2023.1276026
Edited by:
Honghao Wang, Guangzhou First People's Hospital, ChinaReviewed by:
Zhongheng Zhang, Sir Run Run Shaw Hospital, ChinaRobb Wesselingh, Monash University, Australia
Copyright © 2024 Li, Yang, Xia, Ma, Zhang, Guo and Zang. This is an open-access article distributed under the terms of the Creative Commons Attribution License (CC BY). The use, distribution or reproduction in other forums is permitted, provided the original author(s) and the copyright owner(s) are credited and that the original publication in this journal is cited, in accordance with accepted academic practice. No use, distribution or reproduction is permitted which does not comply with these terms.
*Correspondence: Yang Guo, Z3VveWFuZ2RvY3RvckB6enUuZWR1LmNu; Weizhou Zang, emFuZ3dlaXpob3Vkb2N0b3JAMTYzLmNvbQ==