 Hanlin Yu
 Zhen Wang
 Shuya Cai3†
 Yingle Zhang
 Xiangzhe Liu
- 1Department of Encephalology, The First Affiliated Hospital of Henan University of Chinese Medicine, Zhengzhou, Henan, China
- 2Department of General Surgery, The First Affiliated Hospital, Dalian Medical University, Dalian, Liaoning, China
- 3The Second Affiliated Hospital, Dalian Medical University, Dalian, Liaoning, China
Background and objectives: Sleep disorders (SD) and stroke have long been health concerns. Sleep disorders are known to be a risk factor for stroke, and in recent years it has also been shown that the prevalence of sleep disorders is increased in stroke patients. We inferred that there is some inevitable connection between the two. This study aims to identify common molecular biomarkers and pathways connecting SD and stroke by integrating bioinformatics and machine learning approaches.
Methods: We analyzed transcriptome data from the GEO dataset to identify differentially expressed genes (DEGs). Key biological processes, as well as metabolic pathways, were highlighted by GO and KGEE enrichment analyses. Co-expression modules were then identified in the SD and stroke datasets by weighted gene co-expression network analysis (WGCNA), respectively, and machine learning algorithms (RandomForest, LASSO, and XGBoost) were performed to identify ARL2 as a key diagnostic biomarker with high predictive value (AUC = 0.91). This was finally complemented by animal experiments to verify that ARL2 was upregulated in the experimental group.
Results: In GO and KEGG enrichment analyses, key biological processes such as ‘response to external stimuli’ and ‘organic metabolic processes’ as well as metabolic pathways such as ‘propionate metabolism’ and ‘oxidative phosphorylation’ were significantly enriched, suggesting their potential roles in the pathogenesis of the two disorders. With WGCNA and machine-learning algorithms analyses, we found that ARL2 is an important common marker for both diseases.
Discussion: This study provides insights into the common molecular mechanisms of SD and stroke, highlighting the potential of ARL2 as a diagnostic marker and therapeutic target. Unlike previous studies, we used circulating markers rather than tissue markers, improving the clinical translation in terms of non-invasive, rapid identification of patients at risk for sleep disorders. We need to further investigate the functional role of these genes and their potential in developing targeted therapies for SD and stroke patients.
1 Introduction
Sleep disorders (SD) are chronic, recurrent disorders characterized by disturbances in the sleep cycle. According to ICSD-3, SD is classified into seven categories: insomnia, sleep-related breathing disorders, central sleepiness disorders, circadian rhythm sleep–wake disorders, sleep abnormalities, sleep-related movement disorders, and other sleep disorders (1). The most common clinical manifestations of sleep disorders include difficulty falling asleep, incomplete sleep, and excessive daytime sleepiness (2). At the same time, sleep disorders not only reduce quality of life and productivity, but also increase medical and psychiatric problems (3). It is considered a risk factor for many diseases, including cardiovascular events, hypertension (4) and type 2 diabetes mellitus (5). Currently, SD is mainly considered to be a combination of mental disorders (6), environmental factors (7), and circadian rhythm disorders (8) that lead to functional abnormalities in areas of the brain such as the anterior cingulate cortex, the amygdala, and the thalamus (9), but the exact pathogenesis remains unclear. In this study, we focused on common circulating diagnostic markers between insomnia and stroke.
Stroke is a clinical syndrome presenting as an acute, focal neurological deficit, usually caused by vascular injury (e.g., infarction or hemorrhage) to the central nervous system, and is divided into two main categories: ischaemic stroke and haemorrhagic stroke (10). Stroke begins at age 35, with an increased incidence of overall stroke, is common in older adults, and can lead to long-term disability or death (11). Risk factors for stroke include modifiable risk factors such as high blood pressure, atherosclerosis, and arrhythmia, and non-modifiable risk factors such as age, gender, race-ethnicity, and genetics (12). The pathogenesis of stroke is complex, involving excitotoxic mechanisms, inflammatory pathways, oxidative damage, ionic imbalances, apoptosis, angiogenesis and neuroprotection. The end result of the ischaemic cascade triggered by acute stroke is neuronal death and irreversible loss of neuronal function (13). Strokes may occur alone or in conjunction with SD (14).
A systematic review and meta-analysis found that insomnia after stroke is extremely common, with approximately 38.2% of stroke survivors suffering from insomnia or insomnia symptoms, and the prevalence is significantly higher than that of the general population (15). In a prospective cohort, insomnia symptoms were associated with a 1.6-fold increased risk of stroke, and short sleep duration (<6 h) further amplified the risk (16). This suggests that insomnia and stroke may share a common pathological mechanism. Although neurological and cerebrovascular disorders are recognized as distinct entities, their overlapping pathophysiology suggests shared pathways and therapeutic strategies. Patients with both SD and stroke have been shown to exhibit altered inflammatory markers, impaired autonomic regulation and disruptions in circadian rhythms (17–19). Research into the relationship between insomnia and stroke is the most common, with the risk of stroke doubling in people with insomnia. In addition to this, other types of sleep disorders have progressively been shown to be risk factors for stroke (20), and they are also consequences of stroke, according to a meta-analysis of sleep quality after stroke, which showed that poor sleep quality affects 53 per cent of stroke patients (21). There is a close and bidirectional interaction between sleep and blood glucose regulation, a relationship regulated by both sleep–wake homeostasis and circadian rhythms. Insufficient sleep interferes with insulin signaling through multiple pathways, including activation of the sympathetic nervous system, elevated nocturnal cortisol and growth hormone levels, and promotion of lipolysis and free fatty acid release. This is not limited to insufficient sleep; the “chronic hyperarousal” state characteristic of insomnia also exerts independent adverse effects on blood glucose metabolism through persistent activation of the hypothalamic–pituitary–adrenal axis and the sympathetic nervous system (22). In addition, insomnia is commonly associated with metabolic syndrome (23). We found that both metabolic syndrome and type 2 diabetes are risk factors for stroke. Among the 2097 subjects in the Framingham Offspring study, a higher incidence of stroke was obtained in patients with metabolic syndrome than in those with diabetes (24). The hypothalamic–pituitary–adrenal (HPA) axis is a key component of the body’s stress response system. Research consistently demonstrates a bidirectional relationship between HPA axis dysregulation and insomnia: chronic stress activates the HPA axis, leading to hyperarousal and disrupting sleep, while insufficient sleep, in turn, exacerbates HPA hyperactivity. A review of 20 studies revealed that patients with insomnia had moderately elevated cortisol levels, and that there was a positive, but non-significant, correlation between the degree of objective sleep deprivation and group differences in cortisol levels (25). A meta-analysis of 23 prospective cohort studies systematically evaluated the bidirectional association between hypertension and insomnia. The results showed a significant bidirectional positive correlation between the two: insomnia increased the risk of hypertension by 11% (OR = 1.11), while hypertension also increased the risk of insomnia by 20% (OR = 1.20) (26). Hypertension is also a risk factor for stroke (27). We hypothesize that there may be a metabolic association between sleep disorders and stroke. Identifying new diagnostic markers and therapeutic targets for these conditions is crucial to improving patient outcomes. Machine learning to recognize GEO large expression profiles is an advanced and reliable method (28). In this study, we used circulating markers rather than tissue markers, which facilitates ease and speed of testing, clinical translatability, and rapid identification of patients at risk for sleep disorders.
2 Methods
2.1 Bulk transcriptome data preprocessing
Based on the selection strategy of previous literature, we retrieved SD-related datasets and their corresponding transcriptome profiles of control and IS patients from the Gene Expression Omnibus (GEO) database,1 which contains messenger RNA (mRNA) expression profiles and clinical information. Four relatively large transcriptome datasets were identified: GSE208668, GSE16561, GSE22255 and GSE98566. For sleep disorders, we obtained RNA expression data from 17 SD patients and 25 healthy controls from the GSE208668 dataset on the GPL10904 platform (29). For stroke, we obtained 39 control samples and 24 ischemic stroke patients from the GSE16561 dataset as a training set. As each analysis is confined to a single dataset, the issue of inter-dataset batch effects is circumvented. For the transcriptome data mentioned above, we performed gene symbol mapping according to the respective platforms (30). Finally, GSE22255 (31) and GSE98566 (32) were used as independent datasets as retrospective validation, respectively. In case of multiple matches, we took the median and the final expression matrix was obtained by normalization using the log2(X + 1) method. During preprocessing, after an initial quality control check, quantile normalization is performed using the “normalizeBetweenArrays” function in the “limma” package. This method adjusts the expression values so that each sample has the same empirical distribution of expression values, effectively reducing the technical differences between sample.
2.2 Preselection of diagnostic biomarkers
The limma package was utilized for differential gene expression (DEG) analysis on the GSE208668 and GSE16561 datasets, following the guidelines for RNA sequencing and microarray studies. DEGs were identified using a stringent cutoff criterion of an adjusted p-value (Benjamini-Hochberg false discovery rate, FDR) < 0.05 and an absolute log2 fold change (|LogFC|) > 0.5. To identify common signals across datasets, the final list of common DEGs was defined as the intersection of the DEGs from both GSE208668 and GSE16561.
2.3 GO and KEGG enrichment analysis
Gene Ontology (GO) and Kyoto Encyclopedia of Genes and Genomes (KEGG) enrichment analyses were conducted for common driver genes using the clusterProfiler package, an R tool for comparing biological themes across gene clusters. GO analysis was employed to annotate the biological processes, molecular functions, and cellular components associated with the genes, while KEGG was used to annotate the gene pathways. Statistical significance for the enrichment analyses was defined as p < 0.05.
2.4 WGCNA
Weighted gene co-expression network analysis (WGCNA) was further applied to identify gene modules co-expressed in SD and stroke, revealing their possible shared mechanisms in biological processes such as inflammation, oxidative stress and circadian regulation. Within this analysis, gene significance (GS) was defined as the absolute value of the correlation between an individual gene and the trait of interest. Module membership (MM) was defined as the correlation between the gene expression profile and the module eigengene. To identify highly connected and biologically relevant hub genes, we applied thresholds of GS > 0.2 and |MM| > 0.8. The final list of high-confidence candidate genes was obtained by extracting the intersection of common DEGs (from differential expression analysis) and hub genes (from WGCNA analysis). This multi-step filtering approach ensured that the selected genes were both statistically significant and biologically relevant to the trait under study.and then this genes are subjected to machine learning analysis. We will then analyze these genes by machine learning.
2.5 Machine learning selection of diagnostic biomarkers
RandomForest, LASSO and Xgboost were utilized as machine learning methods to identify core genes. RandomForest is an integrated learning method that performs classification and regression analysis by constructing multiple decision trees. It can efficiently process high-dimensional data (e.g., gene expression data) and perform feature selection (33). By calculating the feature importance of 37 genes, it can identify those genes that contribute the most to disease correlation. LASSO is a linear regression model that achieves variable selection and model compression by applying L1 regularization to the regression coefficients. LASSO can simplify the model by penalizing unimportant features (by making their coefficients zero) when dealing with a large number of features, and retaining those genes that are most influential genes (34). XGBoost can accurately model gene expression data to identify key genes associated with diseases and construct accurate prediction models based on these genes (35).
2.6 Establishment of animal models
We used a controlled experimental setup. We divided 24 rats randomly (n = 4) into four groups (n = 6 for each group): normal control group (group 1), sleep disorder group (group 2), stroke group (group 3), and group with both sleep disorder and stroke (group 4). All groups were modeled on 10-month-old male rats. The triggers for sleep disorders in Group 2 and Group 4 mice were sleep deprivation, chronic mild stress, or placing the animals in a disturbed light/dark cycle. Sleep deprivation is achieved primarily by a mild stimulus such as a standardized process of hitting the cage, slightly shaking the cage, or disrupting the sleeping nest when this is not enough to keep the animal awake (36). Middle cerebral artery occlusion (MCAO) was performed on Group 3 and Group 4 rats to simulate stroke. The occlusion model of the middle cerebral artery strictly adopts a permanent MCAO model, induced by intraluminal filament method, i.e., anesthetized rats with chloral hydrous (400 mg/kg, ip) and 3–0 nylon sutures, whose tip is heated near the flame that advances from the external carotid artery to the internal carotid artery, making its tip round until it blocks the origin of the middle cerebral artery (MCA) and leaves the surgical filaments in situ 24 mice. Transcranial laser Doppler blood flow method (PeriFlux 5,000; Perimed AB). Blood flow drops to 80% of baseline, indicating successful occlusion of the middle cerebral artery (37). No sleep disturbance or stroke was induced in the control mice. Meanwhile, the feeding and living environments of the 4 groups of rats should be consistent. 4 groups of rats were placed in a comfortable environment with a 12-h light–dark cycle and unrestricted access to water and food. All rats were fed a standard pellet diet, and the amount of food consumed per day was consistent across all groups (38). This experiment passed the ethical review of animal experiments in the First Affiliated Hospital of Henan University of Traditional Chinese Medicine (YFYDW2019035).
2.7 RT-qPCR
Total RNA was extracted from the cortex of four groups of mice using the TransZol Up Plus RNA kit (TransGEN, Beijing, China) (38). RNA concentration and quality were then assessed using a nanodrop spectrophotometer (Termo Scientifc, Waltham, MA, USA). Subsequently, reverse transcription was performed using TransScript®OneStep gDNA Removal and cDNA Synthesis SuperMix (AT311, TransGEN, Beijing, China). Amplification was monitored using ChamQ Universal SYBR qPCR Master Mix (Novozymes Q711) and QuantStudio™5 Real-Time PCR System (Thermo Fisher Scientific). Prior to the start of the experiment, we evaluated the expression stability of the candidate internal reference gene β-actin in different treatment groups (control, SD, Stroke, SD + Stroke) using the geNorm algorithm. geNorm analysis identifies the most stable internal reference gene by calculating the gene expression stability metric value, M. A lower M value indicates a more stable gene expression. The results of the analysis showed that β-actin, with an M value of less than 0.5 (0.335), exhibited a high degree of stability under all experimental conditions and was therefore selected as the data-normalized endogenous gene for this study. Relative gene expression was then determined using the 2^(–ΔΔCT) method. We assessed the statistical significance of the differences in ARL2 expression between the four experimental groups (Control, SD, Stroke, SD + Stroke) using one-way ANOVA analysis. And Tukey’s HSD (Honest Significant Difference) post hoc test was used for two-by-two comparison of means between groups. Raw Ct values for each group with their mean, standard deviation (SD) and more specific information are detailed in Supplementary Table 2. Detailed primer sequences are shown in Table 1.
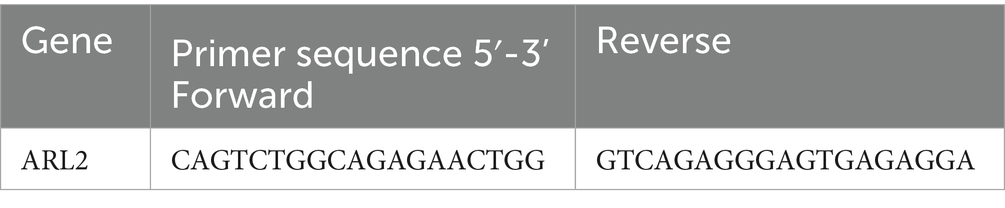
Table 1. Primer sequences used for RT-qPCR.
2.8 Independent clinical validation cohort
2.8.1 Data source and study participants
To confirm the clinical relevance of our findings, we conducted an independent retrospective cohort study, which was approved by the Ethics Committee of The First Affiliated Hospital of Henan University of Chinese Medicine (Approval No. 2025HL-389).
We retrospectively enrolled 72 participants admitted between 2024 and 2025, dividing them into four groups of 18 each. The Control group included healthy individuals with no history of stroke or sleep disorders, confirmed by a Pittsburgh Sleep Quality Index (PSQI) score below 5. The Stroke group comprised patients diagnosed with acute ischemic stroke through neuroimaging (CT or MRI), without significant sleep disorder (PSQI score < 7). The Sleep Disorder (SD) group consisted of individuals without a diagnosis of stroke but with significant sleep disturbances, as defined by a PSQI global score greater than 10. Lastly, the SD + Stroke group included patients who met the criteria for both conditions. The Chinese version of the PSQI has been validated and shown to have good reliability and validity in the Chinese population (39).
All participants provided written informed consent upon admission for biospecimen banking, allowing the use of their anonymized clinical data and residual samples for future research. Personal identifiers were removed to protect privacy.
Inclusion criteria for patients were: (1) age ≥ 40 years; (2) hospital admission and collection of baseline blood samples within 24 h of stroke onset or initial clinical assessment; and (3) availability of complete PSQI assessment data. Exclusion criteria were: (1) severe aphasia, impaired consciousness, or cognitive dysfunction (MMSE score < 10); (2) comorbid severe hepatic or renal insufficiency or advanced malignant tumors; and (3) incomplete clinical or biospecimen data.
2.8.2 Experimental procedures: RNA extraction, qRT-PCR and statistical analysis
Peripheral blood samples were collected from all participants using PAXgene Blood RNA tubes. Total RNA was extracted using the PAXgene Blood RNA Kit (Qiagen, Germany) according to the manufacturer’s instructions. RNA concentration and purity were assessed using a NanoDrop spectrophotometer. GAPDH was chosen as the reference gene due to its well-documented stability in human blood transcriptomics studies (geNorm analysis yielded an M-value of less than 0.5 (0.330)). Its stable expression across all groups was confirmed by one-way ANOVA, which showed no significant differences in Cq values (p > 0.05). Reverse transcription was performed using the PrimeScript RT Reagent Kit (TaKaRa, Japan). The relative expression levels of ARL2 mRNA were quantified by qRT-PCR using the SYBR Green Premix Pro Taq HS qPCR Kit (Accurate Biology, China), with GAPDH as the internal control. Relative expression was calculated using the 2^(−ΔΔCt) method.
Statistical comparisons of ARL2 expression levels among the four groups were performed using one-way analysis of variance (ANOVA), followed by Tukey’s post hoc test for pairwise comparisons. Data are presented as mean ± standard deviation. A *p*-value < 0.05 was considered statistically significant.
3 Results
3.1 An integrative workflow for identifying common circulatory biomarkers
To identify circulating biomarkers common to both sleep disorders and ischemic stroke (IS), we implemented a multi-stage discovery and validation pipeline, summarized in Figure 1. Our strategy was predicated on the hypothesis that shared pathological mechanisms between SD and IS would be reflected by common alterations in gene expression. We first defined distinct gene signatures from SD (GSE208668) and IS (GSE16561) transcriptomic datasets independently through differential expression analysis and weighted gene co-expression network analysis (WGCNA). We then integrated these signatures using a consensus approach, prioritizing genes at their intersection. This candidate set was further refined using machine learning feature selection, which converged on ARL2. Subsequently, the diagnostic relevance and specificity of ARL2 were further evaluated through experimental validation of animal models and independent validation datasets (GSE2225, GSE98566).
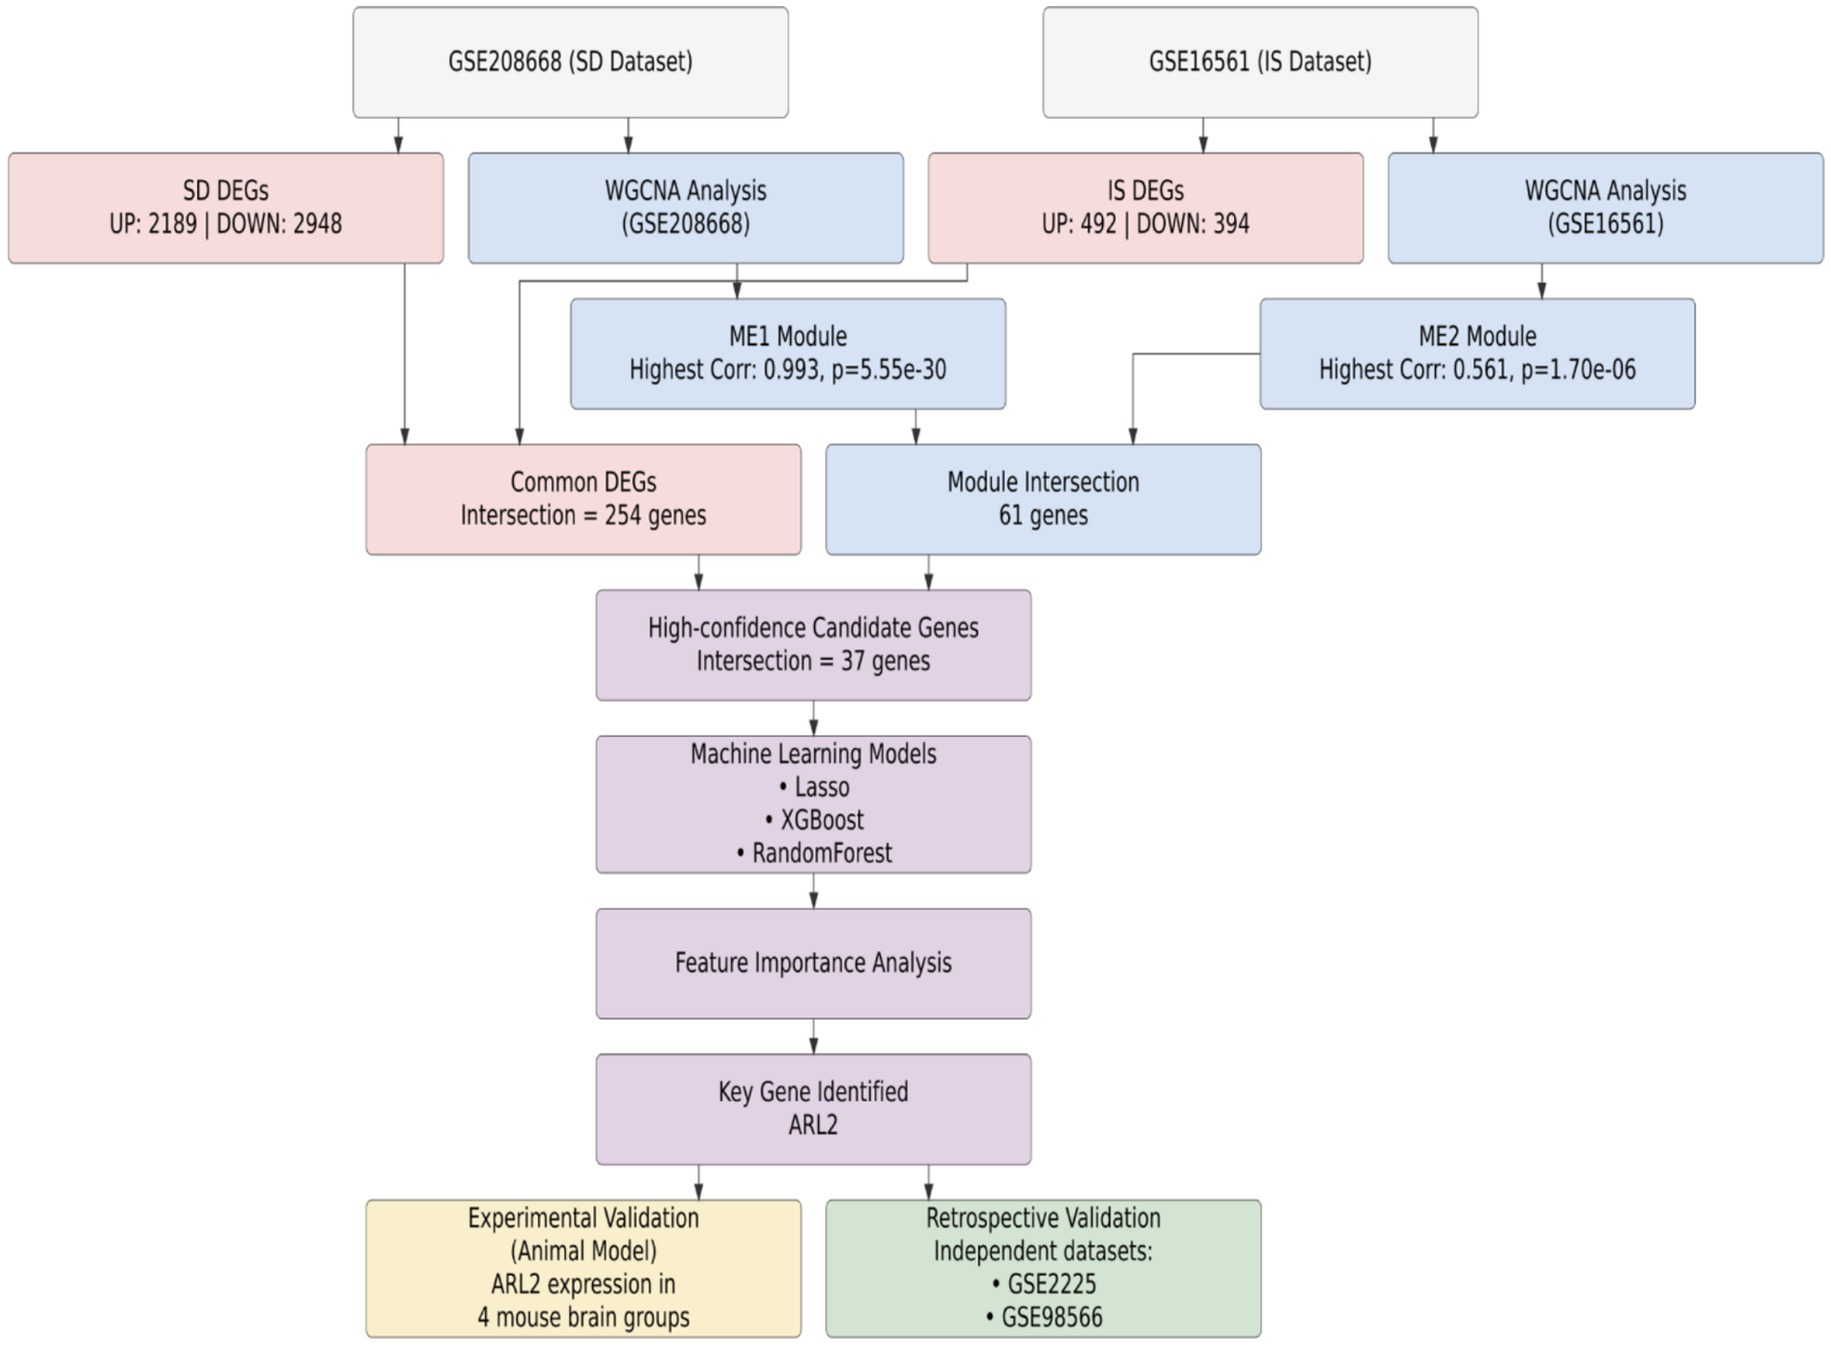
Figure 1. Workflow for the identification and validation of ARL2 as a common diagnostic biomarker. Schematic overview of the multi-step process, integrating transcriptomic data from sleep disorder (GSE208668) and ischemic stroke (GSE16561) datasets, machine learning, and in vivo and clinical validation to nominate ARL2 as a shared circulatory biomarker.
3.2 Identification of differentially expressed genes in SD and stroke
Based on the SD dataset (GSE208668), a total of 5,137 differential genes were identified, and the volcano plot showed that the identified differential genes included 2,948 down-regulated and 2,189 up-regulated genes. In addition, based on the stroke dataset (GSE16561), a total of 886 differential genes were identified, including a total of 394 down-regulated and 492 up-regulated genes. The heat map showed the top 50 most significantly up- and down-regulated genes (Figures 1A,B). Finally, a total of 254 overlapping deg. were created in the SD and stroke datasets.
3.3 GO and KEGG enrichment analysis of genes
The SD and stroke modules share 121 overlapping genes, while the DEG module contains 254 shared genes. Given that the modules identified through WGCNA represent groups of genes with similar expression patterns, they may not encompass the full spectrum of DEG genes. In fact, these DEG genes may even diverge significantly from those critical for disease progression. To prevent potential omissions, we integrated DEG genes with the module genes for a more comprehensive analysis (Figure 2).
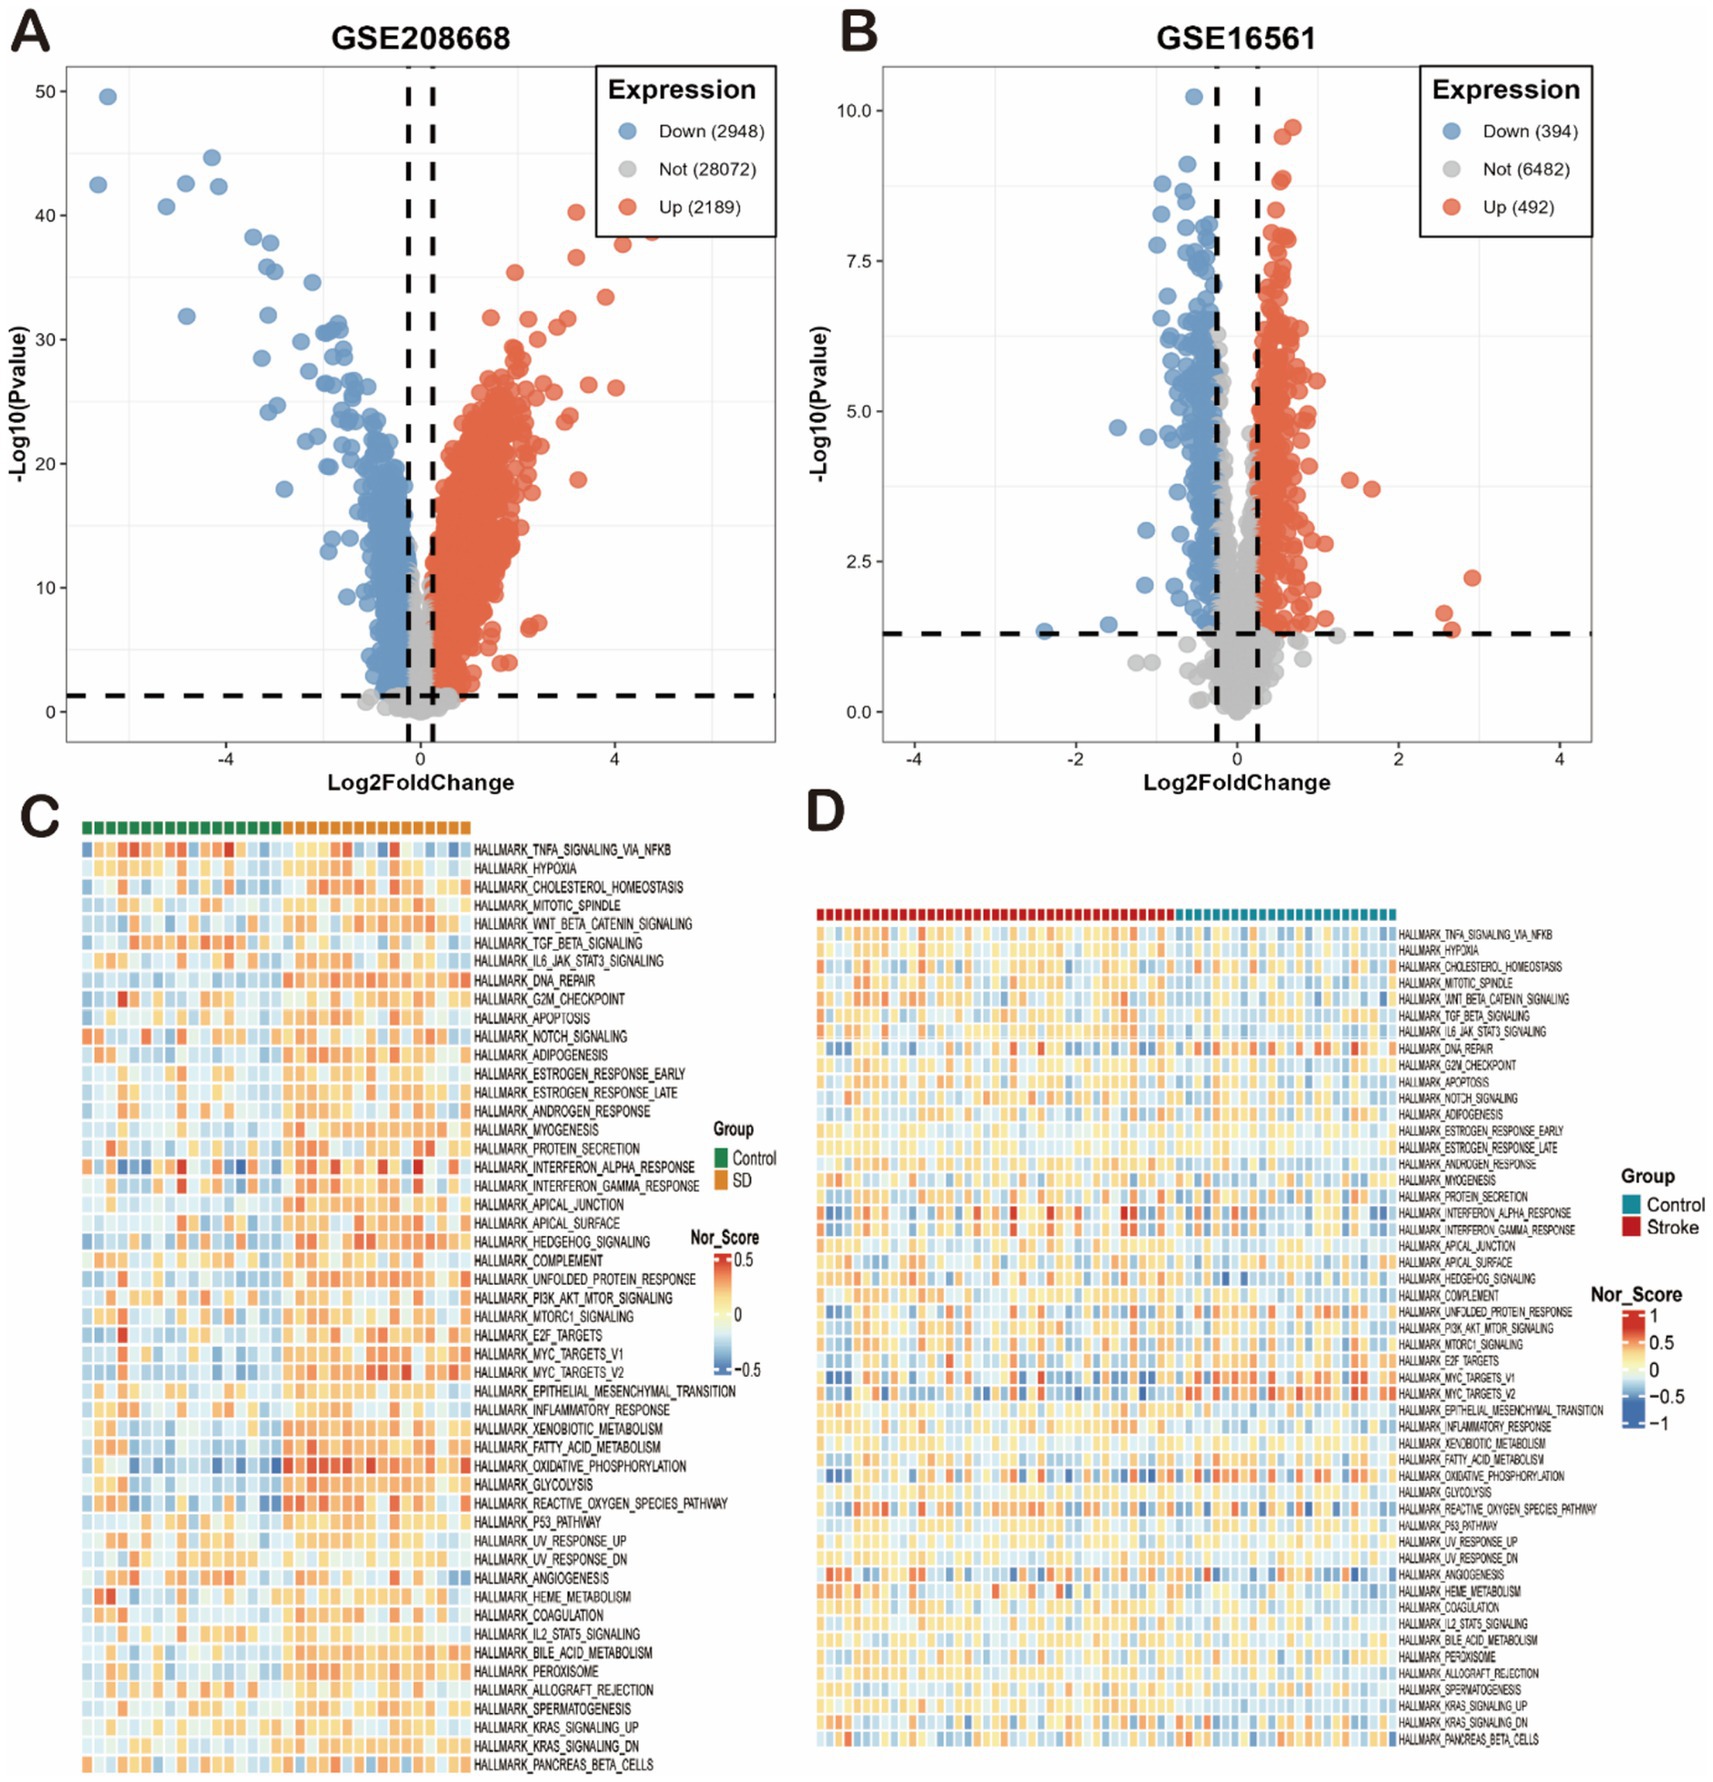
Figure 2. Differential gene expression and pathway enrichment overview in SD and IS models. (A,B) Volcano plots of differentially expressed genes (DEGs) from the (A) GSE208668 (SD) and (B) GSE16561 (IS) datasets. Significantly up-regulated (red) and down-regulated (blue) genes are shown (thresholds: |log2FC| > 0.5, p < 0.05). (C,D) Heatmaps of enriched Hallmark pathways for the (C) GSE208668 (SD) and (D) GSE16561 (IS) datasets. Each row represents a gene set, and each column represents a sample or group. Color intensity reflects the normalized enrichment score (NES) or activity of the pathway (red: activated; blue: suppressed).
We first analyzed these genes for GO and KEGG enrichment. First, The most significantly enriched DEGs in the SD dataset were organitrogen compound metabolic process and oxidative phosphorylation (Figures 3A,B). Secondly, the most significantly enriched DEGs in the IS dataset were organitrogen compound metabolic process, oxidative phosphorylation, neutrophil extracellular trap formation, xidative phosphorylation, defense response, osteoclast differentiation, and leukocyte transendothelial migration (Figures 3C,D). Both diseases had high enrichment of DEGs in the propionate metabolism and redox pathways, so we inferred that the two diseases may be linked in the propionate metabolism and redox pathways. We then performed enrichment analysis on 254 common co-driver genes between SD and IS. We again found that propanoate metabolism and cellular respiration were highly significantly enriched, further validating our hypothesis (Figures 3E,F).
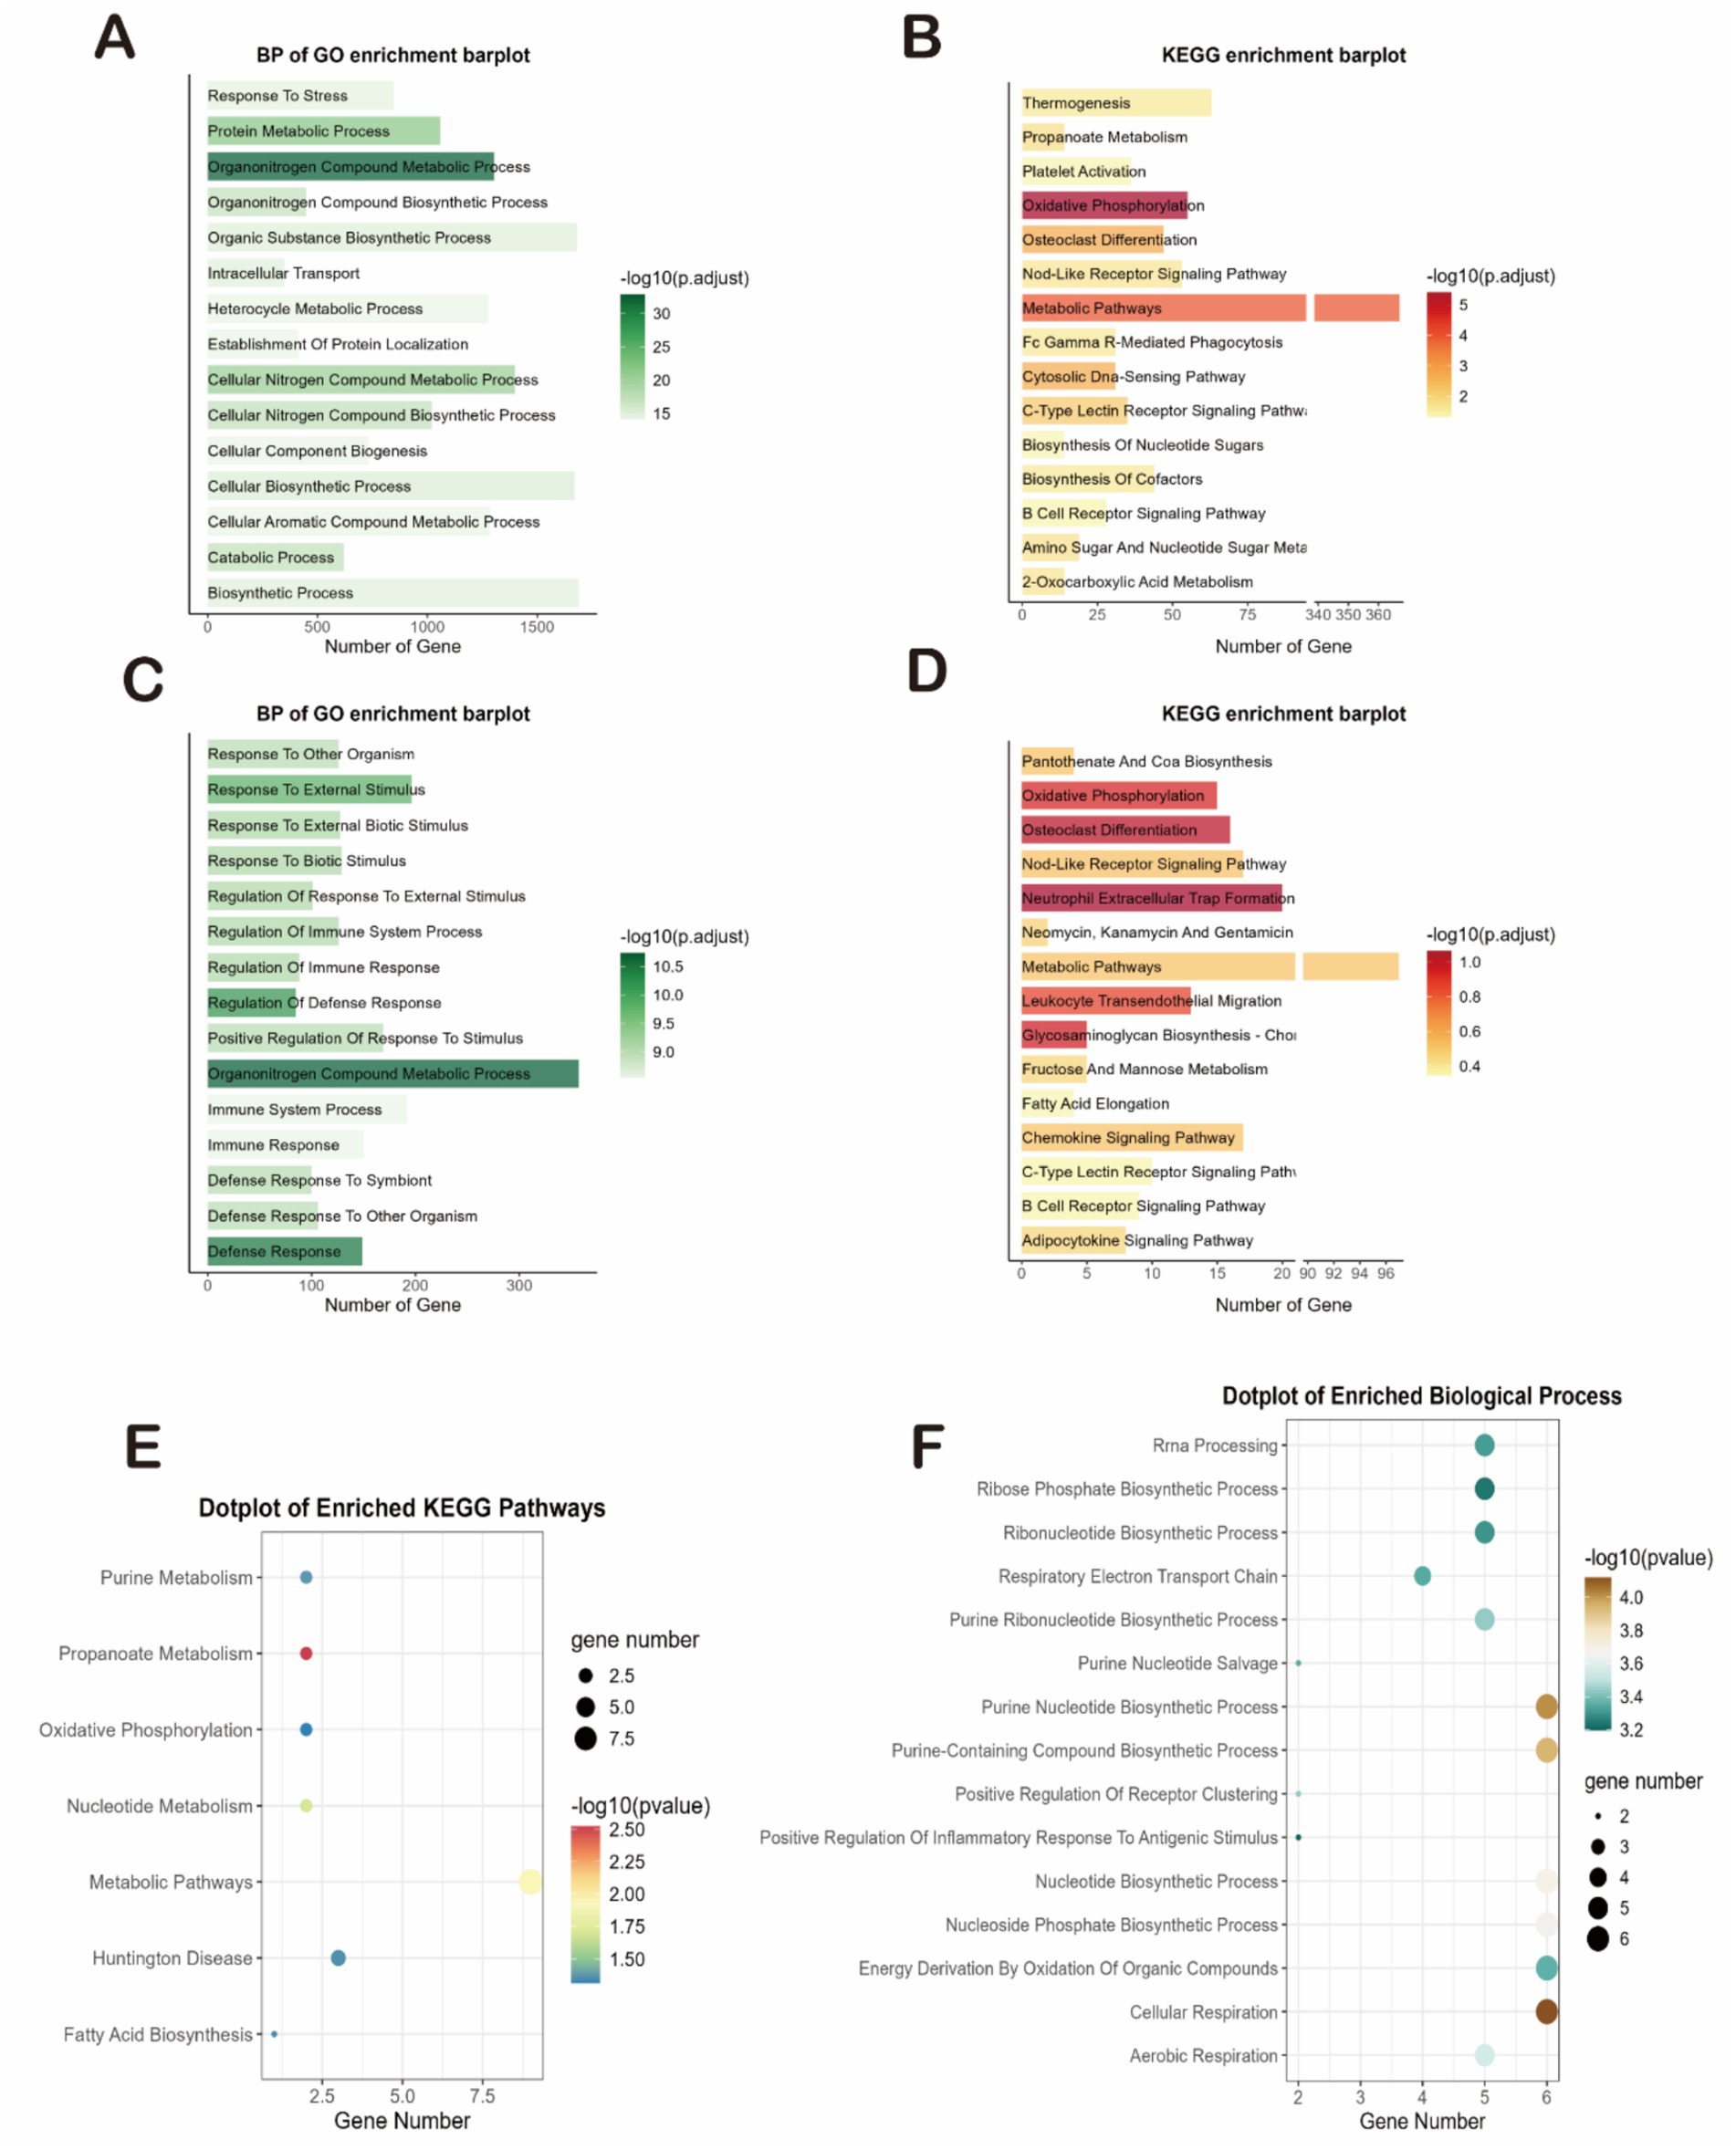
Figure 3. Functional characterization and coregulated pathway analysis. (A–D) Bar plots showing the top significantly enriched terms for the DEGs of each dataset. (A,B) GO biological processes (A) and KEGG pathways (B) for the SD dataset. (C,D) GO biological processes (C) and KEGG pathways (D) for the IS datasets. (E,F) Enrichment analysis of the 254 common co-driver genes between SD and IS. (E) Enriched KEGG pathways. (F) Enriched GO biological processes.
3.4 Weighted gene coexpression network analysis of SD and stroke
We conducted Weighted Gene Co-expression Network Analysis (WGCNA) on two datasets: GSE208668 for SD and GSE16561 for stroke, aiming to investigate the relationship between clinical characteristics and gene expression. After clustering modules based on their similarity, we identified 6 modules in the SD dataset and 11 in the stroke dataset (Figures 4A,D). Correlations between the modules and clinical traits were calculated, revealing that the red module exhibited the strongest positive correlation with SD (r = 0.99) (Figure 4C), while the brown module showed the highest correlation with stroke (r = 0.56) (Figure 4F). Additionally, gene significance (GS) within the modules was strongly correlated with module membership (MM), with correlations of 0.99 for SD and 0.43 for stroke. This further supports the significant relationship between the module genes and the respective diseases. In total, we identified 61 overlapping genes that may play a pivotal role in the pathogenesis of SD and stroke, as determined by WGCNA. Subsequently, we further took the intersection of these 61 intersecting genes with the 254 common differentially expressed genes obtained previously, and finally identified these 37 high-confidence candidate genes (Figure 5B).
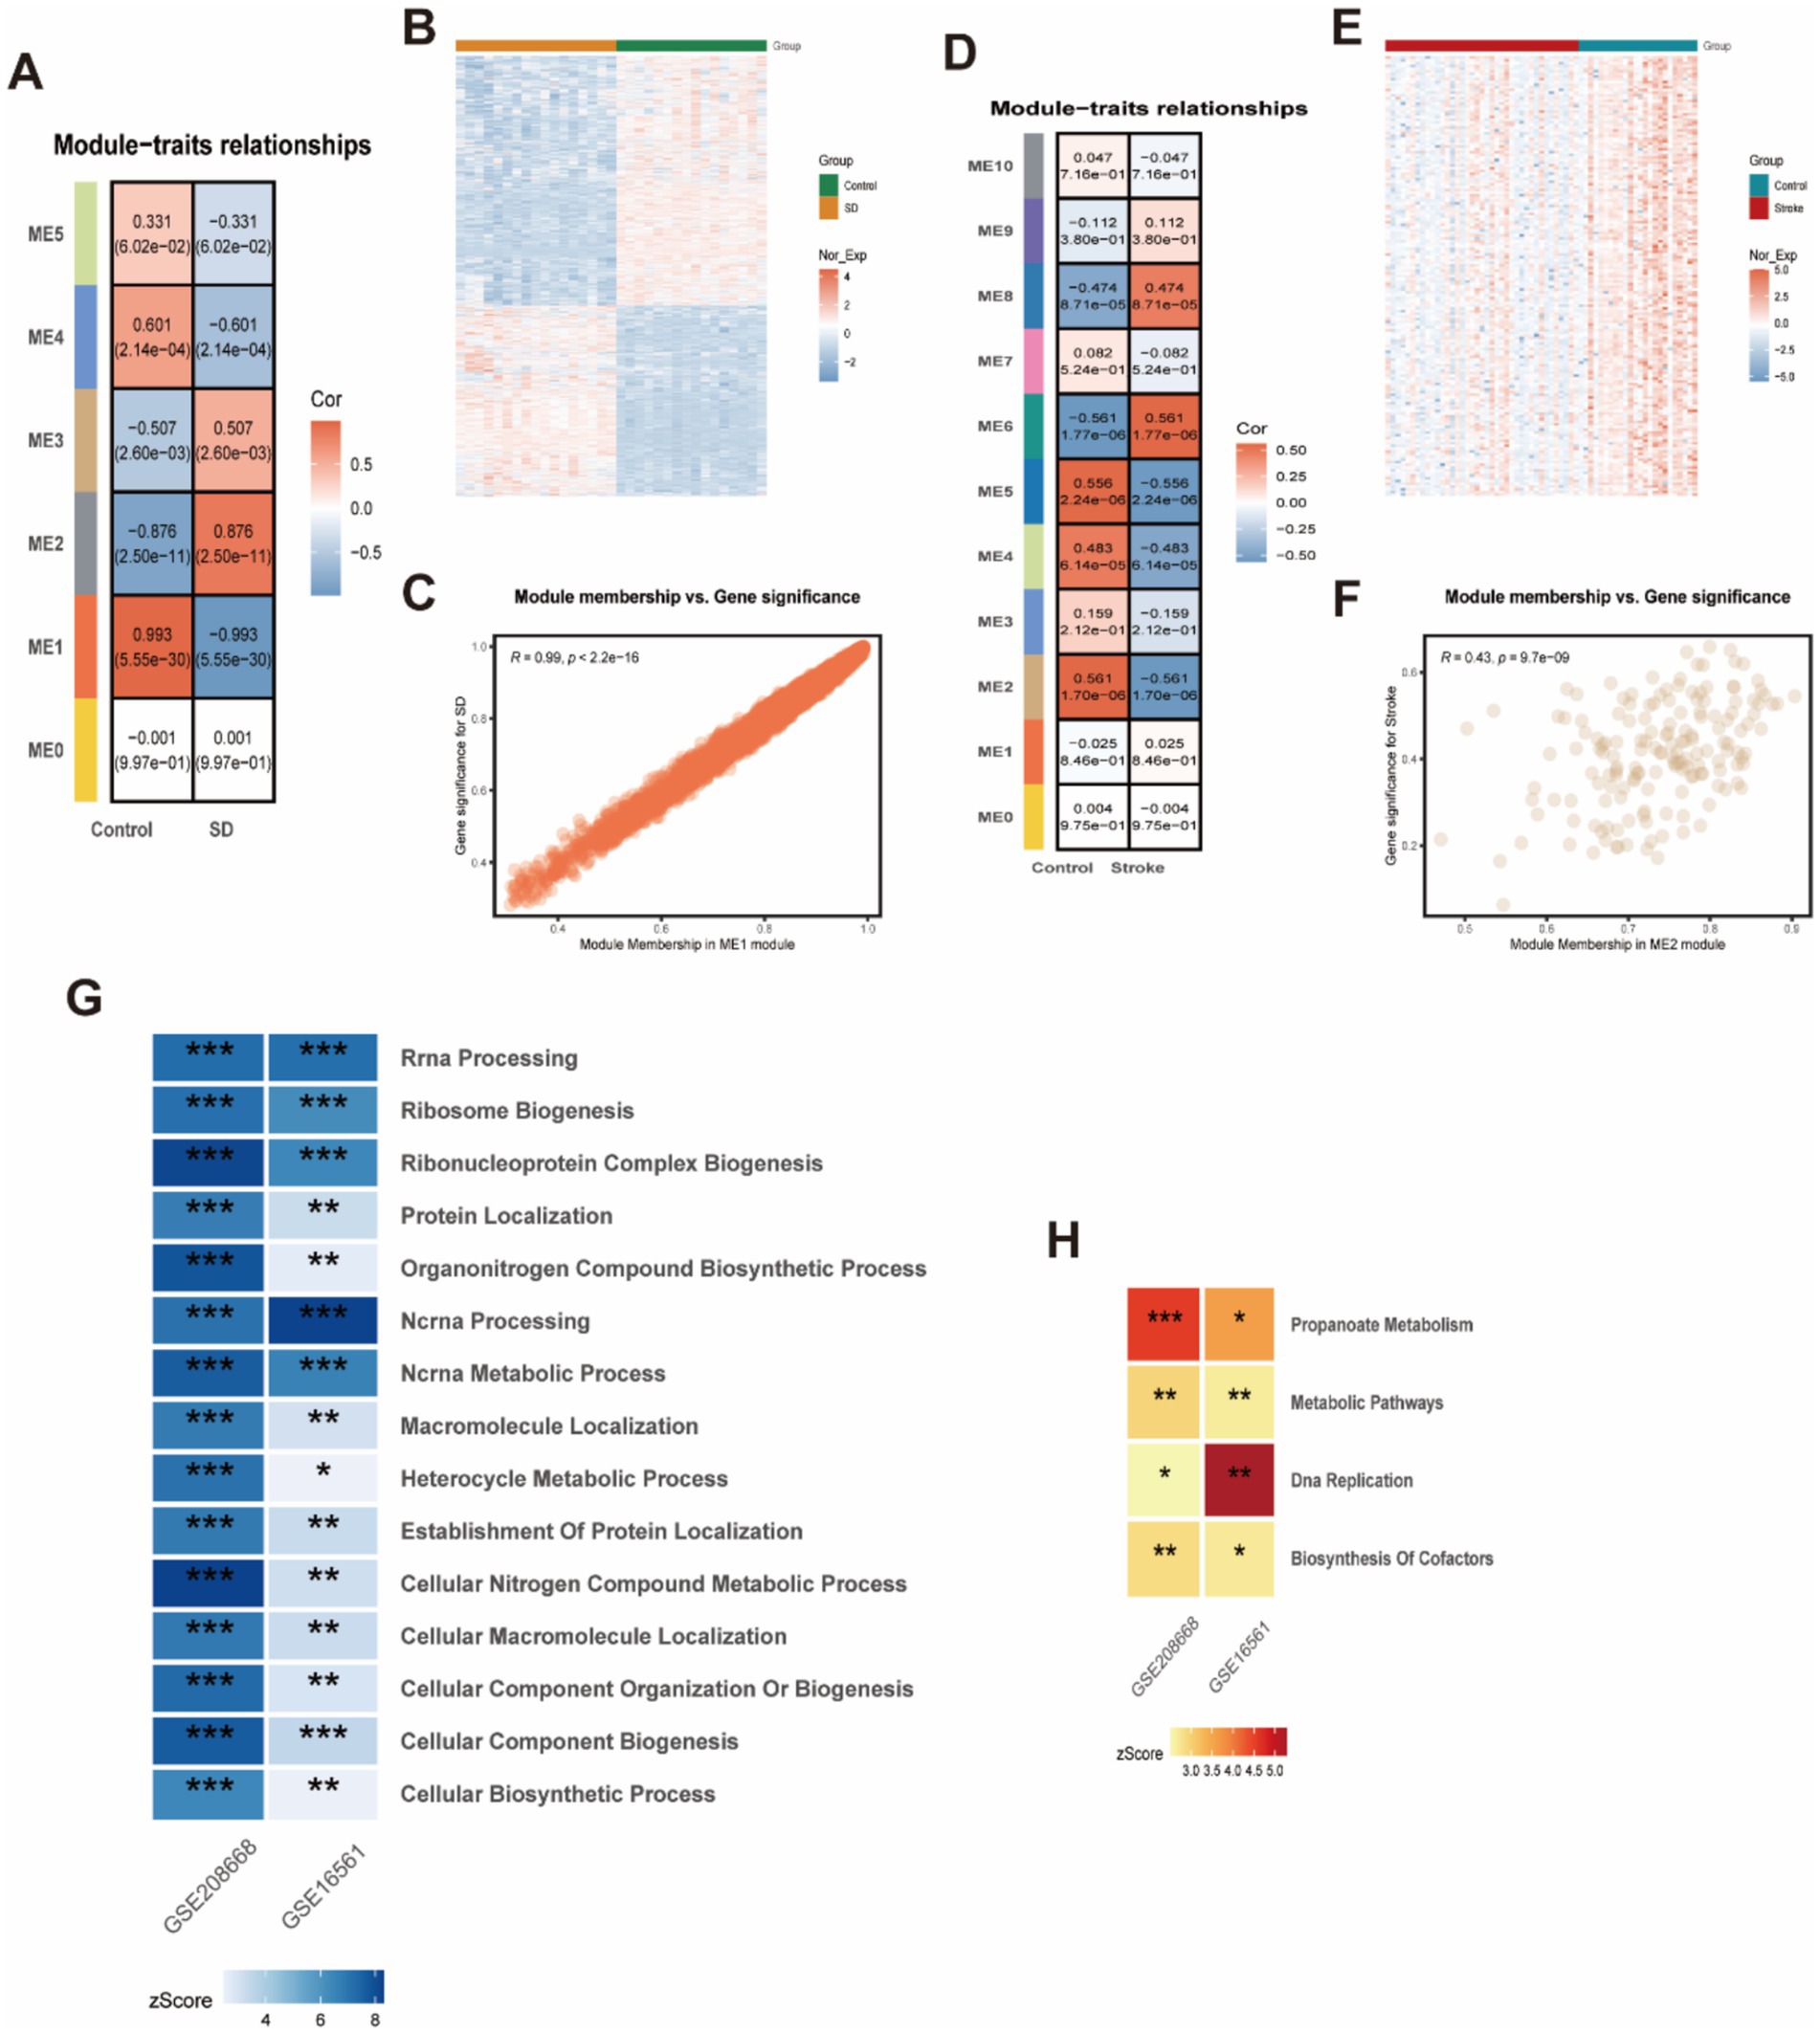
Figure 4. WCGNA analysis of stroke and sleep disorders. (A,C,D,F) Heatmap of correlation analysis between genes characterizing the module and clinical phenotypes in patients with stroke and sleep disorders. Red color indicates positive correlation and blue color indicates negative correlation. (B,E) Heatmap of Stroke and Sleep Disorder Genes. (G) GO enrichment analysis for stroke and sleep disorders. (H) KEGG enrichment analysis for stroke and sleep disorders.
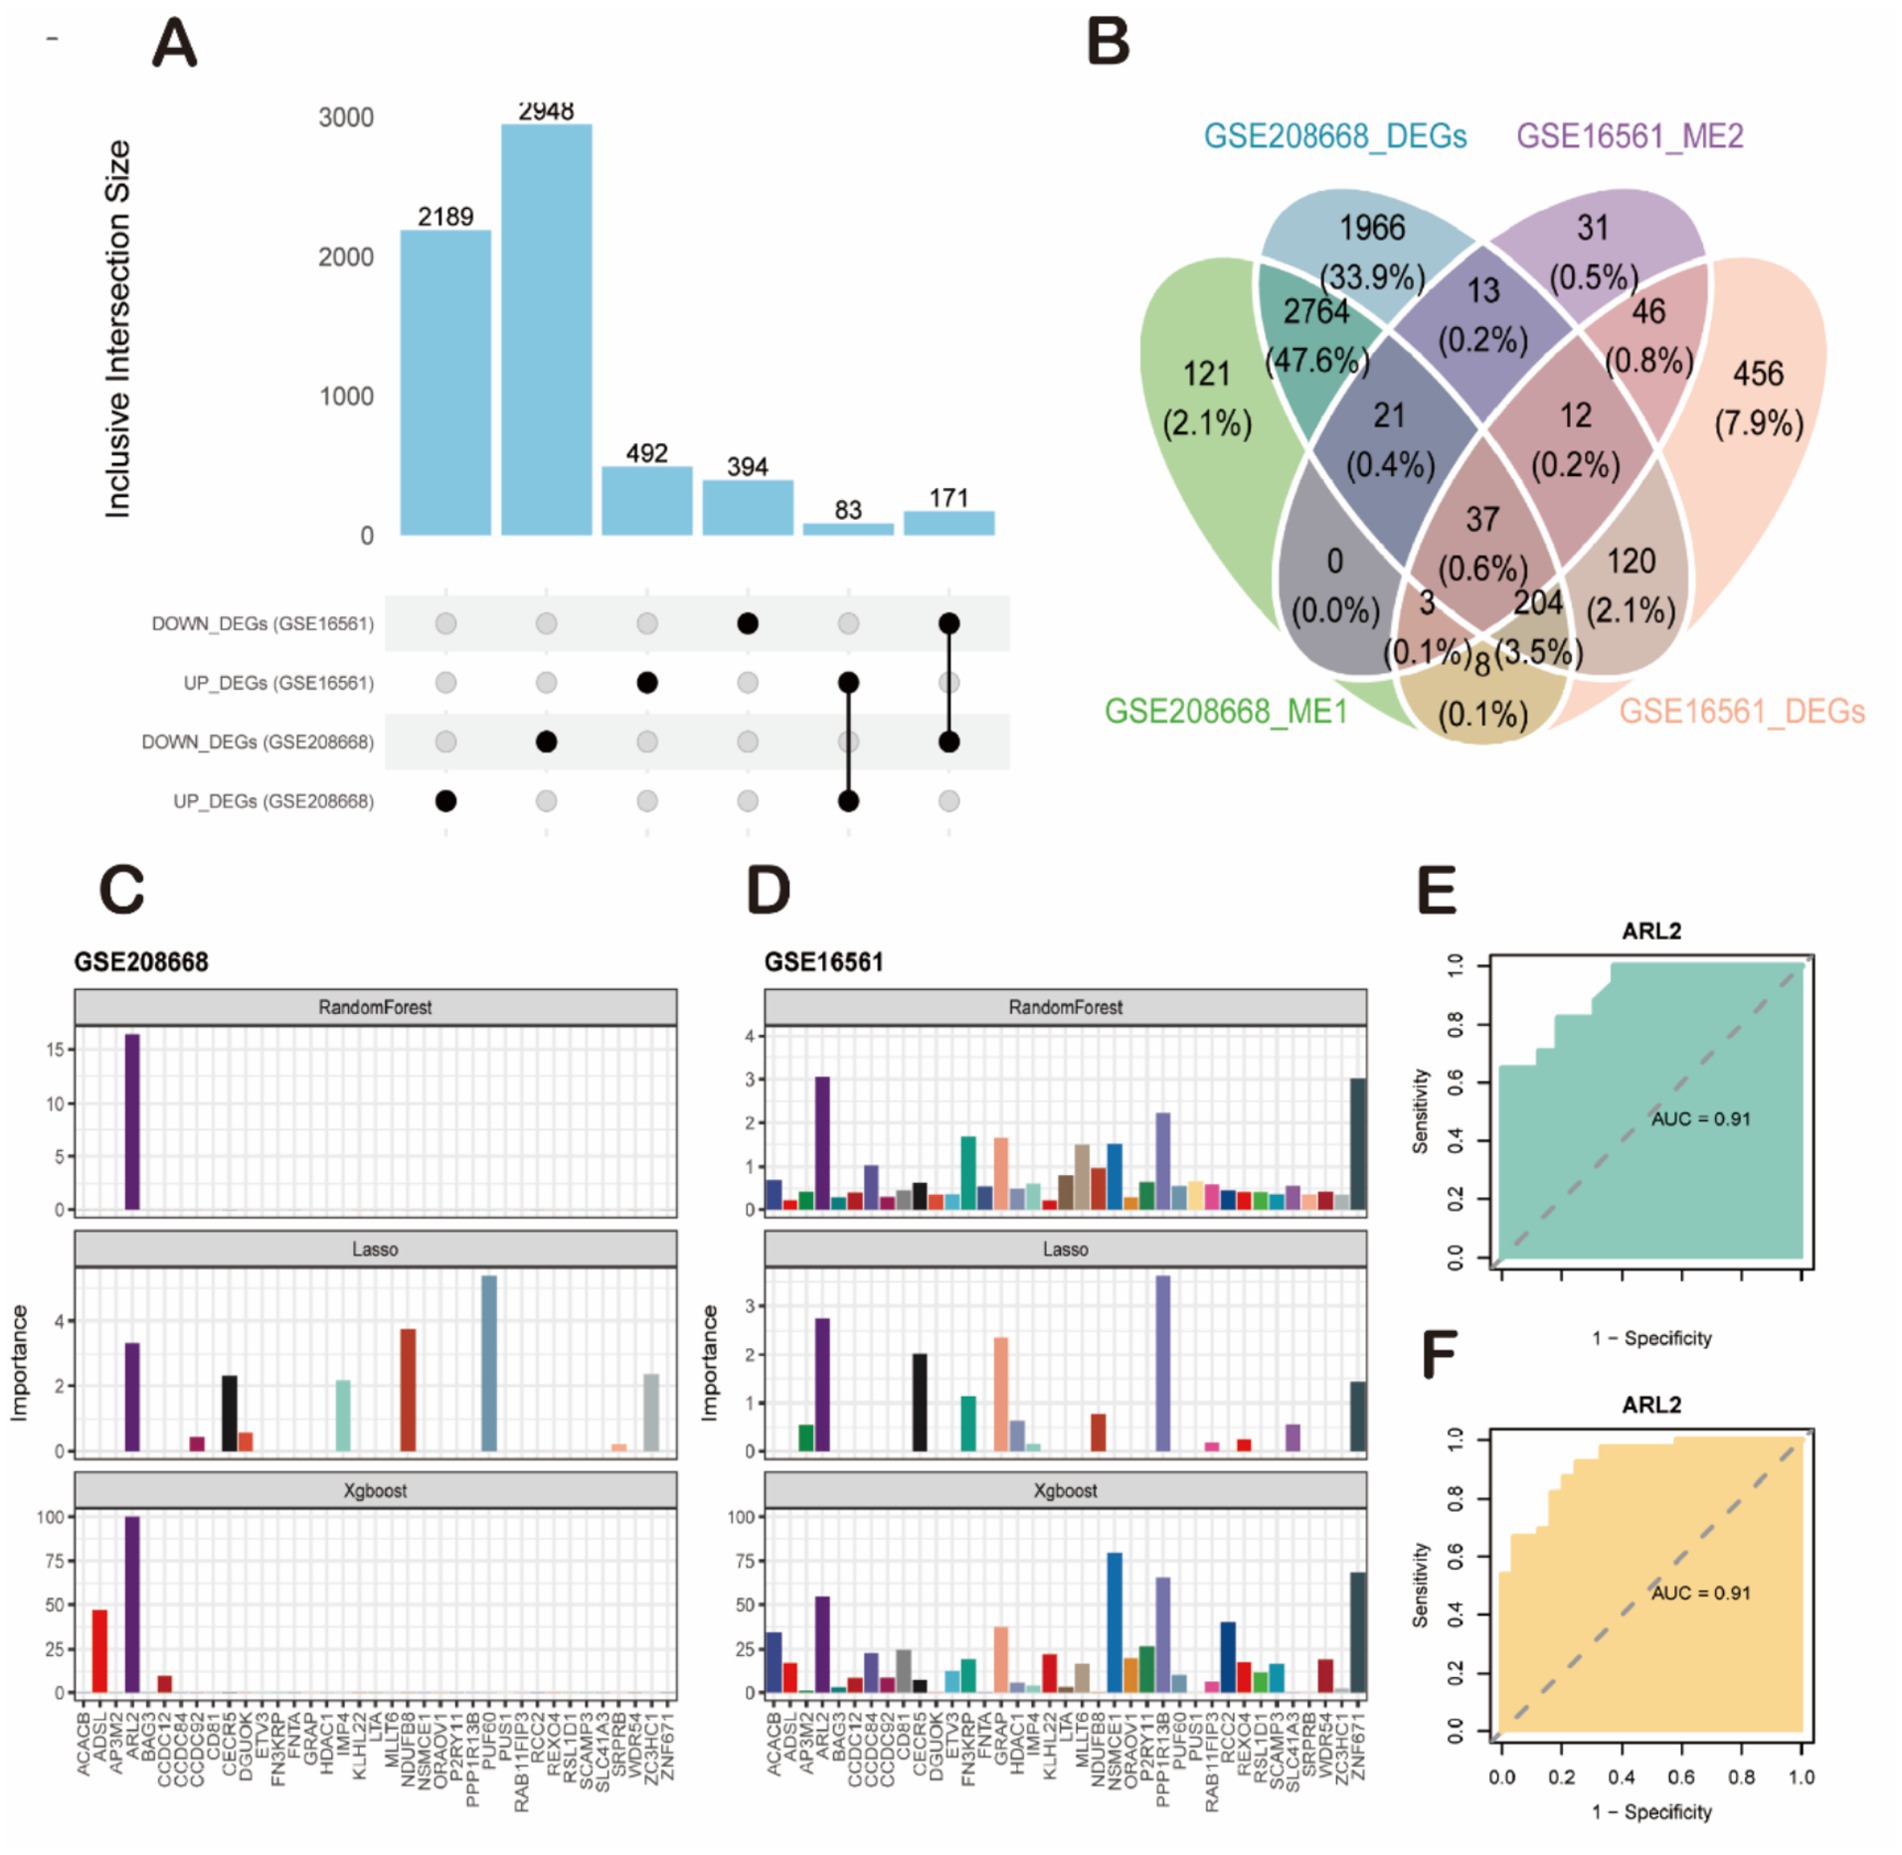
Figure 5. Screening of key candidate genes and validation of their diagnostic efficacy. (A) Bar plot showing the number of differentially expressed genes (DEGs) identified from the sleep disorder (SD, GSE208668) and ischemic stroke (IS, GSE16561) datasets. (B) Venn diagram illustrating the intersection of four gene sets: GSE208668-DEGs, GSE16561-DEGs, GSE208668_ME1 genes, and GSE16561_ME2 genes, yielding 37 high-confidence candidate genes. (C,D) Feature importance analysis of candidate genes using machine learning algorithms. (C) Results from the SD dataset (GSE208668). (D) Results from the IS dataset (GSE16561). The ARL2 gene was consistently identified as the top-ranked feature by all three algorithms (RandomForest, LASSO, and XGBoost). (E,F) Validation of the diagnostic performance of ARL2 using ROC curve analysis. (E) ROC curve for ARL2 in classifying SD samples from controls in the GSE208668 cohort (AUC = 0.91, 95% CI: 0.8166–1). (F) ROC curve for ARL2 in classifying IS samples from controls in the GSE16561 cohort (AUC = 0.91, 95% CI: 0.8467–0.9824).
3.5 Identification and validation of ARL2 as a key diagnostic gene for SD and stroke using machine learning
To further identify key genes with maximal diagnostic utility, we performed sequential feature selection using three distinct machine learning algorithms: Lasso regression, XGBoost, and Random Forest (Figures 5C,D). This tri-modal approach was applied to the 37 candidate genes, with the Benjamini-Hochberg false discovery rate (FDR) correction implemented during screening to control for multiplicity across all candidate features. The analyses were conducted on two datasets: GSE208668 and GSE16561. Each dataset presents the importance of different genes using the three machine learning models (RandomForest, Lasso, and XGBoost). Lasso regression, which tends to shrink less important feature coefficients to zero, identified a more specific set of genes compared to RandomForest. It provided a more focused list of relevant genes, showing that only a few variables (such as ARL2 and others in both datasets) were significant, with most genes showing low importance. XGBoost also pointed to ARL2 as a key gene, but unlike Lasso, it integrated both linear and non-linear relationships between features, thus identifying additional genes with varying importance, some showing moderate influence in both datasets. For both datasets, RandomForest clearly identified a few top genes as most important, with a strong emphasis on ARL2, as seen in the dataset importance plots. This method highlighted several genes with varying levels of importance, with some showing high relevance to the prediction of sleep disorders or stroke. The AUC (Area Under the Curve) values for ARL2 were reported to be 0.91 in both datasets. This suggests that ARL2 is a highly predictive gene for the conditions studied, with a strong balance between sensitivity (true positive rate) and specificity (true negative rate) based on the ROC curve analyses. To prospectively validate its clinical utility, we performed external validation in two independent cohorts. In the GSE22255 cohort (Control vs. IS), ARL2 achieved an AUC of 0.80 (95% CI: 0.647–0.956; DeLong method). Replication in the GSE98566 cohort (Control vs. SD) yielded stronger discrimination with an AUC of 0.92 (95% CI: 0.8009–1; DeLong method). These results demonstrate the robust and generalizable diagnostic utility of ARL2 across diverse populations (Figures 5E,F).
3.6 Expected results of animal experimental models
First, we confirmed that the expression of the internal reference gene β-actin was stable (M < 0.5) in all experimental groups by geNorm analysis, as detailed in the Methods section. The relative quantitative results calculated using the 2^(-ΔΔCt) method are shown in Figure 6D. The expression level of 1 gene in the tissue was detected by RT-qPCR. The mRNA expression of ARL2 gene in groups 2, 3 and 4 was significantly higher than that in the normal group. Group 1 (control): baseline expression of ARL2 gene. Group 2 (sleep disorder): ARL2 gene expression was significantly higher than the normal group (Figure 6B). Group 3 (Stroke): Increased expression of the ARL2 gene (Figure 6A). Group 4 (SD + IS): ARL2 expression was increased compared to both groups 2 and 3 (Figure 6D). This may be due to the combined effect of the two conditions. In this case, Group 1 and Group 2, Group 1 and Group 4, and Group 2 and Group 4 were all more significant, while Group 1 and Group 3, and Group 3 and Group 4 were less significant than the former. The brain changes of the four groups of mice are shown in Figure 6C.
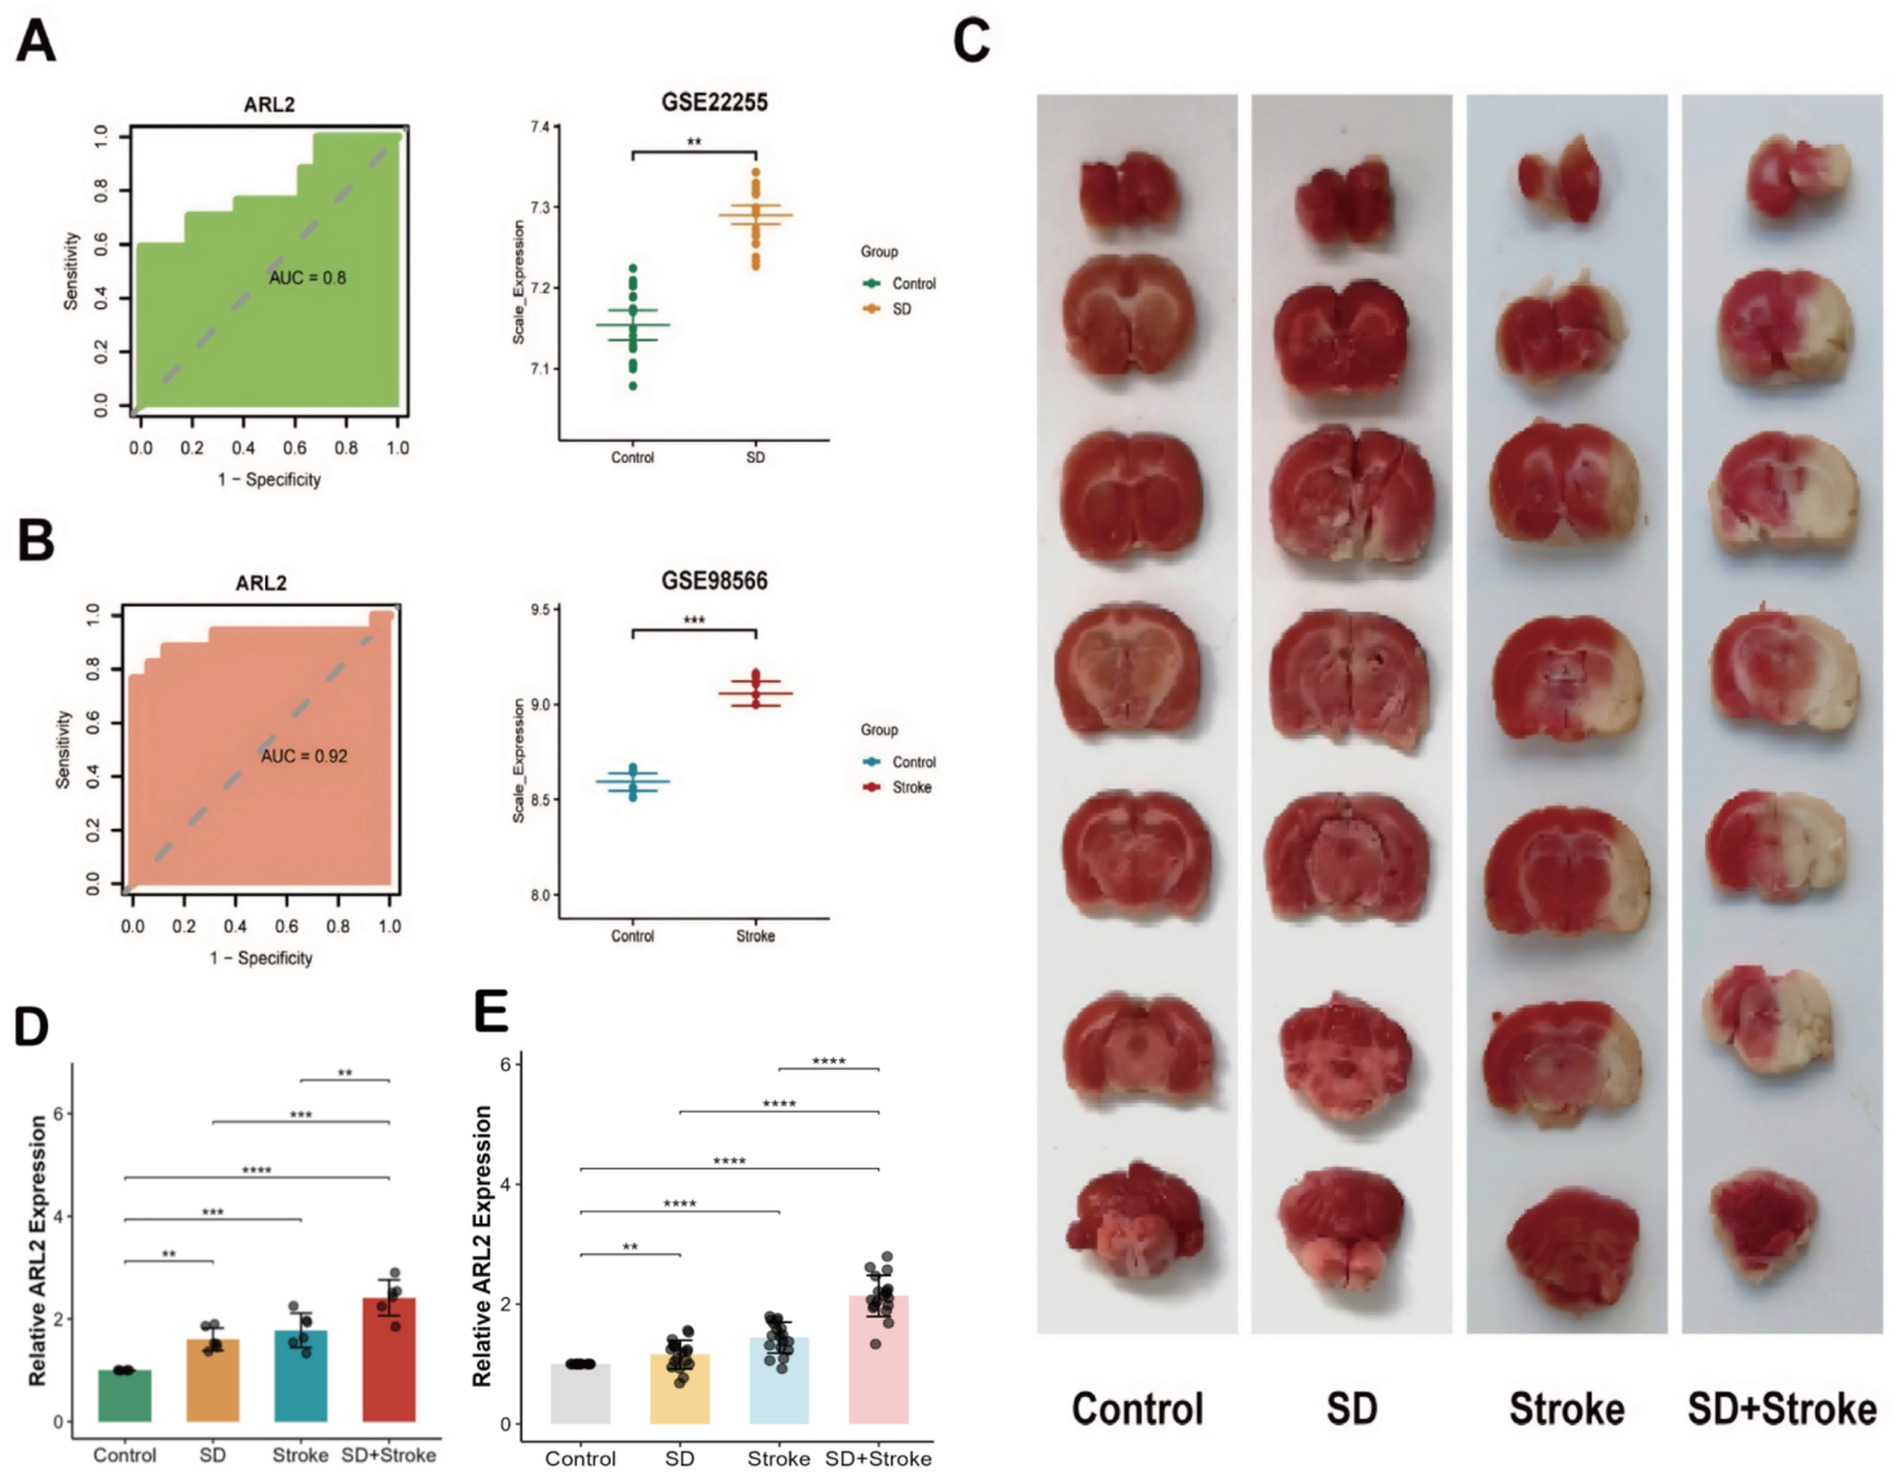
Figure 6. (A) ROC curve analysis of ARL2 gene in dataset GSE22255 and expression in control and stroke groups [AUC = 0.80, 95% CI: 0.647–0.956 (DeLong)]. (B) ROC curve analysis of ARL2 gene expression in dataset GSE98566 and in control and SD groups [AUC = 0.92, 95% CI: 0.8009–1 (DeLong)]. (C) Brain tissue changes in mice in 4 groups. (D) Expression of ARL2 gene in mouse brain tissue in group 4. Data are presented as mean ± SD (Standard Deviation). (E) Relative expression of ARL2 in peripheral blood from Control, Stroke, SD, and SD + Stroke groups (n = 18 per group). Data are expressed as mean ± SD. p < 0.05, **p < 0.01, ***p < 0.001 versus the Control group; ###p < 0.001 compared to all other groups (one-way ANOVA followed by Tukey’s post hoc test).
3.7 Validation of ARL2 expression in an independent human cohort
To advance the translational potential of our findings, we validated the diagnostic value of ARL2 as a circulating biomarker in an independent retrospective human cohort. As shown in Figure 6E, qRT-PCR analysis revealed that the relative expression levels of ARL2 were significantly up-regulated in the Stroke group and the SD group compared to the Control group (p = 0.0000198 and p = 0.00121, respectively). Most importantly, the expression level of ARL2 in the SD + Stroke group exhibited the most pronounced increase, showing statistically significant differences compared to all other three groups (all p < 0.001). These results not only successfully validate our core findings from animal models in human patient samples but also strongly suggest that circulating ARL2 levels could serve as a novel, non-invasive blood-based diagnostic biomarker for distinguishing these disease states.
3.8 Exploratory analysis of ARL2-related pathways
To further assess the biological plausibility of ARL2 as a circulating diagnostic biomarker and to explore its potential functional significance in the comorbidity of SD and IS, we performed exploratory co-expression analyses. We investigated the correlation between ARL2 expression and genes comprising two of the important KEGG-shared pathways previously identified (propionate metabolism and oxidative phosphorylation). Interestingly, in the SD dataset GSE208668, we found that ARL2 expression was significantly correlated (FDR < 0.05) with a significant proportion of genes in both pathways, with ARL2 being significantly correlated with 43.8% (28 of 64 genes) in the propionate metabolism pathway, while in the oxidative phosphorylation pathway, it was significantly correlated with 42% (116 of 276 genes) (see Supplementary Table 3 for details). This not only strengthens the credibility of ARL2 as a circulating diagnostic biomarker, but also suggests that its role in SD-IS comorbidities may be functionally linked to dysregulation of these key metabolic processes.
4 Discussion
Sleep disturbances are frequently observed in stroke patients and may contribute to an increased risk of stroke, suggesting a bidirectional relationship. Sleep disorders are generally recognized as an independent risk factor for stroke (40). This suggests that one disease may co-exist with another. Shared biomarkers and genetic susceptibility may be a common pathogenic mechanism for haemorrhagic stroke and sleep disorders. Reductions in the risk alleles for sleep disorders PER1 and NR1D1 were found to have a significant impact on the risk of haemorrhagic stroke in one study (41). Our study adds to this body of evidence by identifying common molecular pathways. In addition, the differential diagnosis of sleep disorders combined with idiopathic haemorrhagic stroke is challenging because the clinical manifestations of the two disorders intersect. Patients with haemorrhagic stroke are often associated with severe malaise, excessive daytime sleepiness, and sleep disorders, which may be due to the coexistence of sleep disorders in the patient; However, it is necessary to exclude brainstem injury due to haemorrhagic stroke, sleep apnoea or central nervous system depression (42). Neurocognitive symptoms are also commonly associated with sleep disorders, such as memory loss and attention deficits, which can complicate the clinical differential diagnosis. Therefore, identifying common biomarkers and pathogenic mechanisms is essential for the diagnosis and treatment of these disorders.
Firstly, 254 overlapping differentially expressed genes (DEGs) were identified between the SD and IS datasets, highlighting common genetic factors that may influence both diseases. This set of genes highlights the importance of exploring common molecular pathways to better understand the pathogenesis of SD and IS. By applying WGCNA, six co-expression modules were identified in the SD dataset and 11 co-expression modules in the IS dataset, some of which were strongly correlated with clinical features. The overlapping genes identified in the two datasets are particularly interesting as they suggest a possible common molecular basis between SD and IS. These genes deserve further investigation as potential biomarkers or therapeutic targets for the complications of both diseases. We then put GSE208668 DEGs, GSE208668 ME2, GSE16561 DEGs and GSE16561 ME2 together in a series of machine learning to obtain their common genes, demonstrating how these genes are not only common markers for both sleep disorders and stroke, but may also have a role in both diseases (Figure 3D).
Enrichment analyses revealed several key biological processes and metabolic pathways involved in the common pathogenesis of SD and IS. The enrichment of biological processes such as ‘response to external stimuli’ and ‘organic metabolic processes’ emphasized the impact of external factors, including stress, environmental factors and circadian rhythm disruption, on SD and IS. In addition, metabolic pathways, particularly ‘propionate metabolism’ and ‘oxidative phosphorylation’, were also significantly enriched, suggesting that they may be involved in regulating the sleep–wake cycle and cerebral haemodynamics. In addition, in terms of metabolic pathways and cellular behavior, especially “propionate metabolism” and “oxidative phosphorylation,” suggesting that they may be involved in regulating sleep–wake cycles and cerebral hemodynamics. These findings suggest that metabolic abnormalities and cellular energy dysregulation may be key contributors to both conditions, providing potential avenues for therapeutic intervention. Statistics show that about 50% of IS patients may face gastrointestinal complications (43). Recent studies have shown that ischemic brain injury is related to systemic stress responses associated with activation of ANS sympathetic branches, leading to the release of catecholamines, and long-term stress responses may lead to problems such as gastrointestinal dyskinesia (44). In addition, the microbiota in the intestinal tract of patients with ischemic brain injury has also undergone tremendous changes (45). The study found that the intestinal microorganisms phosphatidylcholine and L-carnitine were converted to trimethylamine, which was further converted into trimethylamine-N-oxide (TAMO) that promotes atherosclerosis by promoting the formation of foam cells by macrophages (46, 47). Intestinal microorganisms produce a series of metabolites including short-chain fatty acids (butyrate, propionate), where propionate is produced mainly by Bacteroidetes, Firmicutes and Ackermanns are produced through the propylene glycol pathway and the acrylate pathway (48, 49). Strokes can lead to homeostasis of intestinal flora and altered short-chain fatty acid metabolism (50). We found that upregulating microbiota diversity and intestinal probiotic abundance, accelerating short-chain fatty acid metabolism, regulating amino acid and energy metabolism, thereby significantly inhibiting the inflammatory cascade and alleviating ischemic brain damage (51). Studies have shown that the increased concentration of short-chain fatty acids (SCFAs) in the feces of elderly patients with insomnia mainly reflects intestinal absorption dysfunction rather than simply increased production. These unabsorbed SCFAs worsen sleep through multiple pathways along the gut-brain axis: First, propionate and other substances activate FFAR3 receptors in the portal vein system, promoting the release of norepinephrine, directly exacerbating physiological hyperarousal and leading to difficulty falling asleep; second, malabsorption leads to insufficient energy in colon cells, damages the intestinal barrier, and triggers systemic low-grade inflammation, which in turn interferes with the sleep center; third, SCFAs further disrupt the sleep–wake rhythm by affecting serotonin synthesis and GABA/glutamate balance. At the same time, a higher BMI, malabsorption of SCFAs, and chronic inflammation form a vicious cycle, which together explain the worse sleep continuity in the short-sleep insomnia phenotype (52). Moreover, people with insomnia tend to have lower gut microbial diversity, a higher ratio of Firmicutes to Bacteroidetes, and lower levels of bacteria that produce short-chain fatty acids (SCFAs) (53). In addition to the gut flora, propionate is also associated with inflammation and oxidative stress, which has anti-inflammatory properties that may reduce the risk of stroke by reducing vascular inflammation. A report pointed out that short-chain fatty acids, including propionate, may regulate recovery after stroke by affecting microglia activation and neuroplasticity (54). Furthermore, studies have found that stroke and insomnia can be linked through the brain-gut axis. Due to brain damage to areas that control circadian rhythms, stroke disrupts sleep regulation, leading to insomnia, which affects up to 40% of stroke survivors. In turn, insomnia exacerbates stroke recovery by increasing inflammation and impairing neuroplasticity. The brain-gut axis plays a crucial role, as stroke-induced dysbiosis in the gut microbiome alters the production of neurotransmitters, such as serotonin, which regulate sleep and mood, further exacerbating insomnia. Conversely, sleep deprivation disrupts the composition of the gut microbiome, increasing systemic inflammation and potentially worsening stroke outcomes, highlighting a vicious cycle in which each condition amplifies the other through neuroinflammatory and microbial pathways (55). Cell respiration is the process by which cells generate energy through mitochondrial oxidation and phosphorylation. During ischemic stroke, reduced blood flow limits oxygen availability, impairs mitochondrial function and turns cells to anaerobic respiration. This produces lactic acid, leading to acidosis and further cellular damage. Reperfusion paradoxically increases the production of reactive oxygen species (ROS), leading to mitochondrial dysfunction and neuronal apoptosis. Studies have shown that excessive ROS caused by impaired cellular respiration can lead to damage to the blood–brain barrier and worsen stroke results (56). Insomnia, characterized by difficulty falling or staying asleep, is associated with disruptions in oxidative phosphorylation, a cellular process in mitochondria that produces ATP. Research has shown that sleep deprivation caused by insomnia impairs mitochondrial function, reduces oxidative phosphorylation efficiency, and leads to reduced ATP production. This disruption increases oxidative stress due to the accumulation of reactive oxygen species (ROS), which damages cellular components and exacerbates sleep disturbances, creating a vicious cycle. Conversely, inefficient oxidative phosphorylation, commonly seen in conditions such as chronic fatigue syndrome and neurodegenerative diseases, may alter energy metabolism in brain regions that regulate sleep, leading to insomnia. Therefore, the interplay between insomnia and oxidative phosphorylation highlights a bidirectional relationship in which sleep diorders and mitochondrial dysfunction reinforce each other, impacting overall health (57, 58).
In our study, we analyzed these DEG genes by GO and KEGG enrichment with modular genes. We found that propionate metabolism and metabolic pathways featured prominently in the analysis of common drivers of sleep disorders and stroke, with ‘propionate metabolism’ being significantly enriched. Then through machine learning we identified ARL2 as a prominent gene with high diagnostic value, and its robustness as a predictive biomarker further emphasizes its role in the pathophysiology of SD and IS. By integrating single-cell transcriptomic data, a more nuanced understanding of how specific neuronal subtypes and immune cells contribute to the shared pathophysiology of SD and IS is possible. This is particularly important as it highlights the importance of cellular stress responses, inflammation and circadian rhythms, which are common in both diseases.
ARL2 is a member of the ARF family and the RAS superfamily of regulatory GTPases (59), which are highly conserved and commonly expressed in eukaryotes (60). It plays a role in the regulation of microtubule protein folding and microtubule disruption (61, 62) and is present in cytoplasmic lysates tightly bound to the microtubule protein-specific co-chaperone cofactor D, which shares these activities. Numerous studies have shown that cerebral ischemia leads to mitochondrial dysfunction, ATP depletion, cytoskeletal destruction, and ultimately necrosis or apoptosis (63). Whereas, Arl2 is implicated in mitochondrial function, such as mitochondrial morphology, motility, and maintenance of ATP levels (64). And in a similar study of cardiomyocytes, miR-15b downregulates and regulates cellular ATP levels via Arl2 (65). In the prevention of cerebral ischemia–reperfusion injury, miR-15b has also been shown to inhibit the expression of ADP ribosylation factor-like 2 and reduce the level of adenosine triphosphate in mice treated with mild hypothermia in mice with middle cerebral artery occlusion (66). These findings underscore an association between ARL2 and stroke. Because ARL2 regulates mitochondrial morphology, motility, and ATP levels, it can indirectly affect metabolic pathways occurring in mitochondria, such as propionate metabolism. We infer that disruption of mitochondrial integrity may affect the efficiency of enzymes involved in propionate metabolism. On the other hand, the related protein ADP-ribosylation factor-associated protein 1 (ARFRP1) is involved in lipid droplet (LD) growth and lipolysis, and is associated with lipid metabolism during the transmission of hepatitis C virus. Although ARFRP1 and ARL2 are different, their shared membership in the ARF family suggests that ARL2 may also interact with lipid-related pathways, and propionate is a short-chain fatty acid (67). We further infer that ARL2 is associated with propionate metabolism. The circadian rhythm has a complex bidirectional relationship with mitochondrial function. The chromatin immunoprecipitation (ChIP) sequencing data set of Bmal1, Clock and Cry shows that various functions of mitochondria are under the control of circadian rhythm (68, 69). In addition, post-transcriptional mechanisms (e.g., protein acetylation) are also involved in the circadian rhythm of mitochondria (70). The clock controls the expression/activity of fission proteins (such as Drp1, Fis1) and autophagy-related proteins (such as Bnip3, Pink1), driving the diurnal cycle of mitochondrial fusion and cleavage. Deletion of clock genes can also disrupt morphological rhythms and functions. Mitochondrial feedback also regulates the circadian rhythm through the NAD + -SIRT pathway and the AMPK energy sensing pathway. Clock-driven NAD + oscillation not only affects mitochondria (SIRT3), but also affects the activity of SIRT1 in the nuclear nucleus. SIRT1 rhythmically binds to the CLOCK: BMAL1 complex, deacetylation and promotes PER2 degradation, and enhances clock gene transcription amplitude. SIRT1 also acts as a histone deacetylase, interacts with CLOCK to participate in chromatin remodeling and regulates clock gene expression (71). In addition, the ATP rhythm generated by Drp1-mediated changes in mitochondrial morphology itself can directly feedback affecting the core clock oscillator (72). In this study, we quantified ARL2 mRNA expression using RT-qPCR. Results revealed that the expression of these genes was significantly altered in the experimental group compared to the control group. Specifically, genes associated with inflammatory responses and cellular stress, such as ARL2, showed increased expression in the SD, IS, and SD + IS groups, with the most pronounced changes in the SD + IS group. This suggests that the combination of sleep disorders and ischaemic stroke may have a superimposed or synergistic effect on gene expression, especially genes associated with inflammation, oxidative stress and neuronal damage. ARL2 was significantly upregulated in all cases, especially in the SD + IS group, suggesting that ARL2 may be a potential biomarker for SD and IS. These findings support the hypothesis that common molecular pathways, including inflammation and metabolism, underlie both conditions, thus providing insights into their common pathophysiology.
Furthermore, we validated the differential expression of ARL2 in an independent retrospective human cohort. The consistent upregulation of ARL2 in the blood of patients with stroke, sleep disorder, and most notably in those with both conditions, strongly corroborates our pre-clinical findings and underscores the translational relevance of ARL2 as a peripheral biomarker. Notably, this clinical validation aligns with the previously discussed involvement of ARL2 in mitochondrial function and neuroinflammatory pathways, providing a mechanistic basis for its upregulation under conditions of hypoxic and inflammatory stress, such as those characterizing OSA and stroke comorbidity. Although the comprehensive assessment and diagnosis of clinical sleep disorders typically involve a multi-faceted approach, our study utilized the well-validated Pittsburgh Sleep Quality Index (PSQI, provided in Supplementary Table 5) to define sleep disorder, thereby ensuring standardized and reproducible cohort criteria.
While this study provides compelling evidence, future prospective studies with larger sample sizes and more detailed clinical profiles are warranted to further establish the diagnostic and prognostic utility of ARL2. Nevertheless, our data identify circulating ARL2 as a promising and readily measurable biomarker that could facilitate risk stratification and early detection of stroke, especially among individuals with pre-existing sleep disturbances. The RT-qPCR results reinforce the concept that SD and IS share overlapping molecular mechanisms, particularly in the regulation of inflammation and stress-response genes. These insights may guide future therapeutic strategies targeting common pathways to concurrently treat both conditions. Additional studies are needed to validate these findings and explore the functional roles of these genes in disease progression.
Building upon these clinical findings, it is important to understand the molecular context of ARL2. From the above, we know that ARL2 is part of the broader ADP-ribosylation factor (ARF) family, which acts as a cofactor in the ADP-ribosylation process. ADP-ribosylation, catalyzed by enzymes such as PARP1 and tankyrases, regulates inflammatory responses through pathways involved in tumor necrosis factor (TNF)-induced cell death and immune signaling (73). While Aβ peptides of 39–42 amino acids are the primary component of protein aggregates found in senile plaques of Alzheimer’s disease and impaired mitochondrial electron transport along with exposure to metal ions can lead to Aβ aggregation and subsequent activation of PARP1, which is closely linked to several neurological diseases (74), our focus remains on ARL2’s potential influence on neuroinflammatory processes in brain regions such as the cerebral cortex and hippocampus in the context of sleep disorders and stroke.
In summary, this study explored and identified for the first time the pivotal genes of sleep disorders and stroke, and analyzed the possible pathogenesis. Unlike many studies that focus on tissue-specific biomarkers or single pathological pathways, we purposely utilized circulating transcriptome data as well as an integrated computational biology approach combining WGCNA and multiple machine learning algorithms. Through this strategy, we identified ARL2 as a novel circulating biomarker for the detection of the comorbidity of SD and IS, which gives our study a significant clinical advantage for non-invasive, rapid screening, identification of people at high risk for sleep disorders, and prevention of stroke. Besides, going beyond single-disease inflammatory biomarker studies, our data-driven approach uniquely reveals the relationship between ARL2 and dysregulation of mitochondrial metabolic pathways (propionate metabolism and oxidative phosphorylation) in both SD and IS, which reveals a previously underappreciated pathogenic axis and opens up the possibility of new treatments beyond common anti-inflammatory and antioxidant strategies. However, this paper also has some limitations. Further functional studies are needed to validate the specific role of the ARL2 gene in SD and stroke and to explore its functional mechanisms in disease progression.
Despite the encouraging findings, this study has several limitations. First, while our integrated bioinformatics and machine learning approach strongly identified ARL2 as a common diagnostic biomarker, the precise causal relationship between ARL2 dysregulation and the pathogenesis of sleep disorders (SD) and ischemic stroke (IS) remains to be fully elucidated. The observed association, while strong, does not confirm causality. Second, our analysis relied primarily on publicly available transcriptomic datasets and a single validation cohort. The relatively small sample size, particularly in the SD dataset, and the retrospective nature of the clinical validation warrant confirmation in larger, prospective, multicenter studies to increase the generalizability of our findings. Finally, while we validated ARL2 expression in animal models and human blood samples, the underlying functional role of ARL2 in the coexisting mechanisms of SD and IS has not been experimentally validated. Future studies employing gene knockout or overexpression in relevant animal models will be crucial to uncover the underlying molecular pathways.
Data availability statement
The original contributions presented in the study are included in the article/Supplementary material, further inquiries can be directed to the corresponding author/s.
Ethics statement
The studies involving humans were approved by Ethics Committee of The First Affiliated Hospital of Henan University of Chinese Medicine (Approval no. 2025HL-389). The studies were conducted in accordance with the local legislation and institutional requirements. The participants provided their written informed consent to participate in this study. The animal study was approved by First Affiliated Hospital of Henan University of Traditional Chinese Medicine (YFYDW2019035). The study was conducted in accordance with the local legislation and institutional requirements.
Author contributions
HY: Writing – original draft. ZW: Writing – original draft. SC: Writing – original draft. YZ: Writing – original draft. XL: Writing – review & editing, Project administration, Writing – original draft, Resources.
Funding
The author(s) declare that financial support was received for the research and/or publication of this article. This research project was supported by grants 242102311277, “Exploring the Effective Components and Mechanisms of the Jianpi Bushen Huoxue Recipe for the Treatment of Ischemic Stroke Based on the PI3K/Akt/HIF-1α Signaling Pathway”; 2024ZXZX1017, “Exploring the key substances and mechanisms of action of the Jianpi Bushen Huoxue prescription in the treatment of ischemic stroke based on liquid chromatography-mass spectrometry and transcriptome sequencing”; and Henan Province Traditional Chinese Medicine Inheritance and Innovation Talent Project (Zhongjing Project), Leading Talent in Traditional Chinese Medicine [Yuwei Zhongyi Letter (2021) No. 8].
Conflict of interest
The authors declare that the research was conducted in the absence of any commercial or financial relationships that could be construed as a potential conflict of interest.
Generative AI statement
The authors declare that no Gen AI was used in the creation of this manuscript.
Any alternative text (alt text) provided alongside figures in this article has been generated by Frontiers with the support of artificial intelligence and reasonable efforts have been made to ensure accuracy, including review by the authors wherever possible. If you identify any issues, please contact us.
Publisher’s note
All claims expressed in this article are solely those of the authors and do not necessarily represent those of their affiliated organizations, or those of the publisher, the editors and the reviewers. Any product that may be evaluated in this article, or claim that may be made by its manufacturer, is not guaranteed or endorsed by the publisher.
Supplementary material
The Supplementary material for this article can be found online at: https://www.frontiersin.org/articles/10.3389/fneur.2025.1599135/full#supplementary-material
Footnotes
References
1. Sateia, MJ. International classification of sleep disorders-third edition. Chest. (2014) 146:1387–94. doi: 10.1378/chest.14-0970
2. Rémi, J, Pollmächer, T, Spiegelhalder, K, Trenkwalder, C, and Young, P. Sleep-related disorders in neurology and psychiatry. Deutsch Ärztebl Int. (2019) 116:681–8. doi: 10.3238/arztebl.2019.0681
3. Léger, D, and Bayon, V. Societal costs of insomnia. Sleep Med Rev. (2010) 14:379–89. doi: 10.1016/j.smrv.2010.01.003
4. Gangwisch, JE. A review of evidence for the link between sleep duration and hypertension. Am J Hypertens. (2014) 27:1235–42. doi: 10.1093/ajh/hpu071
5. Antza, C, Kostopoulos, G, Mostafa, S, Nirantharakumar, K, and Tahrani, A. The links between sleep duration, obesity and type 2 diabetes mellitus. J Endocrinol. (2022) 252:125–41. doi: 10.1530/JOE-21-0155
6. Chance Nicholson, W, and Pfeiffer, K. Sleep disorders and mood, anxiety, and post-traumatic stress disorders. Nurs Clin North Am. (2021) 56:229–47. doi: 10.1016/j.cnur.2021.02.003
7. Billings, ME, Hale, L, and Johnson, DA. Physical and social environment relationship with sleep health and disorders. Chest. (2020) 157:1304–12. doi: 10.1016/j.chest.2019.12.002
8. Sun, S-Y, and Chen, G-H. Treatment of circadian rhythm sleep–wake disorders. Curr Neuropharmacol. (2022) 20:1022–34. doi: 10.2174/1570159X19666210907122933
9. Van Someren, EJW. Brain mechanisms of insomnia: new perspectives on causes and consequences. Physiol Rev. (2021) 101:995–1046. doi: 10.1152/physrev.00046.2019
10. Murphy, SJ, and Werring, DJ. Stroke: causes and clinical features. Medicine. (2020) 48:561–6. doi: 10.1016/j.mpmed.2020.06.002
11. Potter, TBH, Tannous, J, and Vahidy, FS. A contemporary review of epidemiology, risk factors, etiology, and outcomes of premature stroke. Curr Atheroscler Rep. (2022) 24:939–48. doi: 10.1007/s11883-022-01067-x
12. Boehme, AK, Esenwa, C, and Elkind, MSV. Stroke risk factors, genetics, and prevention. Circ Res. (2017) 120:472–95. doi: 10.1161/CIRCRESAHA.116.308398
13. Deb, P, Sharma, S, and Hassan, KM. Pathophysiologic mechanisms of acute ischemic stroke: an overview with emphasis on therapeutic significance beyond thrombolysis. Pathophysiology. (2010) 17:197–218. doi: 10.1016/j.pathophys.2009.12.001
14. Bassetti, CLA. Sleep and stroke: a bidirectional relationship with clinical implications. Sleep Med Rev. (2019) 45:127–8. doi: 10.1016/j.smrv.2019.04.005
15. Baylan, S, Griffiths, S, Grant, N, Broomfield, NM, Evans, JJ, and Gardani, M. Incidence and prevalence of post-stroke insomnia: a systematic review and meta-analysis. Sleep Med Rev. (2020) 49:101222. doi: 10.1016/j.smrv.2019.101222
16. Helbig, AK, Stöckl, D, Heier, M, Ladwig, KH, and Meisinger, C. Symptoms of insomnia and sleep duration and their association with incident strokes: findings from the population-based MONICA/KORA Augsburg cohort study. PLoS One. (2015) 10:e0134480. doi: 10.1371/journal.pone.0134480
17. Saputro, RE, Chou, CC, Lin, YY, Tarumi, T, and Liao, YH. Exercise-mediated modulation of autonomic nervous system and inflammatory response in sleep-deprived individuals: a narrative reviews of implications for cardiovascular health. Auton Neurosci. (2025) 259:103256. doi: 10.1016/j.autneu.2025.103256
18. Alsbrook, DL, di Napoli, M, Bhatia, K, Biller, J, Andalib, S, Hinduja, A, et al. Neuroinflammation in acute ischemic and hemorrhagic stroke. Curr Neurol Neurosci Rep. (2023) 23:407–31. doi: 10.1007/s11910-023-01282-2
19. Hetman, M, Slomnicki, LP, Hodges, ER, Saraswat Ohri, S, and Whittemore, SR. Role of circadian rhythms in pathogenesis of acute CNS injuries: insights from experimental studies. Exp Neurol. (2022) 353:114080. doi: 10.1016/j.expneurol.2022.114080
20. Mayer-Suess, L, Ibrahim, A, Moelgg, K, Cesari, M, Knoflach, M, Högl, B, et al. Sleep disorders as both risk factors for, and a consequence of, stroke: a narrative review. Int J Stroke. (2024) 19:490–8. doi: 10.1177/17474930231212349
21. Luo, Y, Yu, G, Liu, Y, Zhuge, C, and Zhu, Y. Sleep quality after stroke: a systematic review and meta-analysis. Medicine (Baltimore). (2023) 102:e33777. doi: 10.1097/MD.0000000000033777
22. Duan, D, Kim, LJ, Jun, JC, and Polotsky, VY. Connecting insufficient sleep and insomnia with metabolic dysfunction. Ann N Y Acad Sci. (2023) 1519:94–117. doi: 10.1111/nyas.14926
23. Chasens, ER, Imes, CC, Kariuki, JK, Luyster, FS, Morris, JL, DiNardo, MM, et al. Sleep and metabolic syndrome. Nurs Clin North Am. (2021) 56:203–17. doi: 10.1016/j.cnur.2020.10.012
24. Najarian, RM, Sullivan, LM, Kannel, WB, Wilson, PW, D’Agostino, RB, and Wolf, PA. Metabolic syndrome compared with type 2 diabetes mellitus as a risk factor for stroke: the Framingham offspring study. Arch Intern Med. (2006) 166:106–11. doi: 10.1001/archinte.166.1.106
25. Dressle, RJ, Feige, B, Spiegelhalder, K, Schmucker, C, Benz, F, Mey, NC, et al. HPA axis activity in patients with chronic insomnia: a systematic review and meta-analysis of case-control studies. Sleep Med Rev. (2022) 62:101588. doi: 10.1016/j.smrv.2022.101588
26. Liu, D, Yu, C, Huang, K, Thomas, S, Yang, W, Liu, S, et al. The association between hypertension and insomnia: a bidirectional Meta-analysis of prospective cohort studies. Int J Hypertens. (2022) 2022:4476905. doi: 10.1155/2022/4476905
27. Buonacera, A, Stancanelli, B, and Malatino, L. Stroke and hypertension: an appraisal from pathophysiology to clinical practice. Curr Vasc Pharmacol. (2019) 17:72–84. doi: 10.2174/1570161115666171116151051
28. Li, Y, Gao, S, and Meng, Y. Integrated analysis of endoplasmic reticulum stress regulators' expression identifies distinct subtypes of autism spectrum disorder. Front Psych. (2023) 14:1136154. doi: 10.3389/fpsyt.2023.1136154
29. Lin, J, Liu, C, and Hu, E. Elucidating sleep disorders: a comprehensive bioinformatics analysis of functional gene sets and hub genes. Front Immunol. (2024) 15:1765. doi: 10.3389/fimmu.2024.1381765
30. Zhang, H, Sun, J, Zou, P, Huang, Y, Yang, Q, Zhang, Z, et al. Identification of hypoxia- and immune-related biomarkers in patients with ischemic stroke. Heliyon. (2024) 10:e25866. doi: 10.1016/j.heliyon.2024.e25866
31. Krug, T, Gabriel, JP, Taipa, R, Fonseca, BV, Domingues-Montanari, S, Fernandez-Cadenas, I, et al. TTC7B emerges as a novel risk factor for ischemic stroke through the convergence of several genome-wide approaches. J Cereb Blood Flow Metab. (2012) 32:1061–72. doi: 10.1038/jcbfm.2012.24
32. Uyhelji, HA, Kupfer, DM, White, VL, Jackson, ML, van Dongen, HPA, and Burian, DM. Exploring gene expression biomarker candidates for neurobehavioral impairment from total sleep deprivation. BMC Genomics. (2018) 19:341. doi: 10.1186/s12864-018-4664-3
33. Gregory, GA, Robinson, TIG, Linklater, SE, Wang, F, Colagiuri, S, de Beaufort, C, et al. Global incidence, prevalence, and mortality of type 1 diabetes in 2021 with projection to 2040: a modelling study. Lancet Diabetes Endocrinol. (2022) 10:741–60. doi: 10.1016/S2213-8587(22)00218-2
34. Yan, M, Li, W, Wei, R, Li, S, Liu, Y, Huang, Y, et al. Identification of pyroptosis-related genes and potential drugs in diabetic nephropathy. J Transl Med. (2023) 21:490. doi: 10.1186/s12967-023-04350-w
35. Liu, J, Zhang, D, Cao, Y, Zhang, H, Li, J, Xu, J, et al. Screening of crosstalk and pyroptosis-related genes linking periodontitis and osteoporosis based on bioinformatics and machine learning. Front Immunol. (2022) 13:955441. doi: 10.3389/fimmu.2022.955441
36. Hagewoud, R, Havekes, R, Novati, A, Keijser, JN, van der Zee, E, and Meerlo, P. Sleep deprivation impairs spatial working memory and reduces hippocampal AMPA receptor phosphorylation. J Sleep Res. (2010) 19:280–8. doi: 10.1111/j.1365-2869.2009.00799.x
37. Duan, J, Cui, J, Yang, Z, Guo, C, Cao, J, Xi, M, et al. Neuroprotective effect of Apelin 13 on ischemic stroke by activating AMPK/GSK-3β/Nrf2 signaling. J Neuroinflammation. (2019) 16:24. doi: 10.1186/s12974-019-1406-7
38. Zunzunegui, C, Bo, G, Ertugrul, C, Aleksandra, H, and Claudio, LB. Sleep disturbance impairs stroke recovery in the rat. Sleep. (2011) 34:1261–9.
39. Tsai, PS, Wang, SY, Wang, MY, Su, CT, Yang, TT, Huang, CJ, et al. Psychometric evaluation of the Chinese version of the Pittsburgh sleep quality index (CPSQI) in primary insomnia and control subjects. Qual Life Res. (2005) 14:1943–52. doi: 10.1007/s11136-005-4346-x
40. Yaggi, HK, Concato, J, Kernan, WN, Lichtman, JH, Brass, LM, and Mohsenin, V. Obstructive sleep apnea as a risk factor for stroke and death. N Engl J Med. (2005) 353:2034–41. doi: 10.1056/NEJMoa043104
41. Pajediene, E, Paulekas, E, Salteniene, V, Skieceviciene, J, Arstikyte, J, Petrikonis, K, et al. Diurnal variation of clock genes expression and other sleep-wake rhythm biomarkers among acute ischemic stroke patients. Sleep Med. (2022) 99:1–10. doi: 10.1016/j.sleep.2022.06.023
42. Li, J, Wang, D, Tao, W, Dong, W, Zhang, J, Yang, J, et al. Early consciousness disorder in acute ischemic stroke: incidence, risk factors and outcome. BMC Neurol. (2016) 16:140. doi: 10.1186/s12883-016-0666-4
43. Kumar, S, Selim, MH, and Caplan, LR. Medical complications after stroke. Lancet Neurol. (2010) 9:105–18. doi: 10.1016/S1474-4422(09)70266-2
44. Lemke, DM. Riding out the storm: sympathetic storming after traumatic brain injury. J Neurosci Nurs. (2004) 36:4–9. doi: 10.1097/01376517-200402000-00002
45. Hanscom, M, Loane, DJ, and Shea-Donohue, T. Brain-gut axis dysfunction in the pathogenesis of traumatic brain injury. J Clin Invest. (2021) 131:777. doi: 10.1172/JCI143777
46. Tang, WH, Wang, Z, Levison, BS, Koeth, RA, Britt, EB, Fu, X, et al. Intestinal microbial metabolism of phosphatidylcholine and cardiovascular risk. N Engl J Med. (2013) 368:1575–84. doi: 10.1056/NEJMoa1109400
47. Koeth, RA, Wang, Z, Levison, BS, Buffa, JA, Org, E, Sheehy, BT, et al. Intestinal microbiota metabolism of L-carnitine, a nutrient in red meat, promotes atherosclerosis. Nat Med. (2013) 19:576–85. doi: 10.1038/nm.3145
48. Yin, J, Liao, SX, He, Y, Wang, S, Xia, GH, Liu, FT, et al. Dysbiosis of gut microbiota with reduced trimethylamine-N-oxide level in patients with large-artery atherosclerotic stroke or transient ischemic attack. J Am Heart Assoc. (2015) 4:699. doi: 10.1161/JAHA.115.002699
49. Flint, HJ, Duncan, SH, Scott, KP, and Louis, P. Links between diet, gut microbiota composition and gut metabolism. Proc Nutr Soc. (2015) 74:13–22. doi: 10.1017/S0029665114001463
50. Fang, Z, Chen, M, Qian, J, Wang, C, and Zhang, J. The bridge between ischemic stroke and gut microbes: short-chain fatty acids. Cell Mol Neurobiol. (2023) 43:543–59. doi: 10.1007/s10571-022-01209-4
51. Ruan, L, Wang, Z, Zheng, M, Zheng, Q, Qing, Q, Lin, H, et al. Polygoni Multiflori Radix Praeparata polysaccharides enhance gut health and mitigate ischemic stroke by regulating SCFA and amino acid metabolism in gut microbiota. Front Pharmacol. (2025) 16:1580055. doi: 10.3389/fphar.2025.1580055
52. Magzal, F, Even, C, Haimov, I, Agmon, M, Asraf, K, Shochat, T, et al. Associations between fecal short-chain fatty acids and sleep continuity in older adults with insomnia symptoms. Sci Rep. (2021) 11:4052. doi: 10.1038/s41598-021-83389-5
53. Smith, RP, Easson, C, Lyle, SM, Kapoor, R, Donnelly, CP, Davidson, EJ, et al. Gut microbiome diversity is associated with sleep physiology in humans. PLoS One. (2019) 14:e0222394. doi: 10.1371/journal.pone.0222394
54. Colombo, AV, Sadler, RK, Llovera, G, Singh, V, Roth, S, Heindl, S, et al. Microbiota-derived short chain fatty acids modulate microglia and promote aβ plaque deposition. eLife. (2021) 10:10. doi: 10.7554/eLife.59826
55. Wang, Y, Pan, L, and Guan, R. Mechanism of insomnia after stroke based on intestinal Flora. Int J Gen Med. (2024) 17:5493–502. doi: 10.2147/IJGM.S488714
56. Bassetti, CL, and Hermann, DM. Sleep and stroke. Handb Clin Neurol. (2011) 99:1051–72. doi: 10.1016/B978-0-444-52007-4.00021-7
57. Melhuish Beaupre, LM, Brown, GM, Braganza, NA, Kennedy, JL, and Gonçalves, VF. Mitochondria's role in sleep: novel insights from sleep deprivation and restriction studies. World J Biol Psychiatry. (2022) 23:1–13. doi: 10.1080/15622975.2021.1907723
58. Morris, G, Stubbs, B, Köhler, CA, Walder, K, Slyepchenko, A, Berk, M, et al. The putative role of oxidative stress and inflammation in the pathophysiology of sleep dysfunction across neuropsychiatric disorders: focus on chronic fatigue syndrome, bipolar disorder and multiple sclerosis. Sleep Med Rev. (2018) 41:255–65. doi: 10.1016/j.smrv.2018.03.007
59. Newman, LE, Zhou, CJ, Mudigonda, S, Mattheyses, AL, Paradies, E, Marobbio, CM, et al. The ARL2 GTPase is required for mitochondrial morphology, motility, and maintenance of ATP levels. PLoS One. (2014) 9:e99270. doi: 10.1371/journal.pone.0099270
60. Clark, J, Moore, L, Krasinskas, A, Way, J, Battey, J, Tamkun, J, et al. Selective amplification of additional members of the ADP-ribosylation factor (ARF) family: cloning of additional human and Drosophila ARF-like genes. Proc Natl Acad Sci. (1993) 90:8952–6. doi: 10.1073/pnas.90.19.8952
61. Bhamidipati, A, Lewis, SA, and Cowan, NJ. Adp Ribosylation factor-like protein 2 (Arl2) regulates the interaction of tubulin-folding cofactor D with native tubulin. J Cell Biol. (2000) 149:1087–96. doi: 10.1083/jcb.149.5.1087
62. Tian, G, Thomas, S, and Cowan, NJ. Effect of TBCD and its regulatory interactor Arl2 on tubulin and microtubule integrity. Cytoskeleton. (2010) 67:706–14. doi: 10.1002/cm.20480
63. Llorente-Folch, I, Rueda, CB, Pardo, B, Szabadkai, G, Duchen, MR, and Satrustegui, J. The regulation of neuronal mitochondrial metabolism by calcium. J Physiol. (2015) 593:3447–62. doi: 10.1113/JP270254
64. Sharer, JD, Shern, JF, van Valkenburgh, H, Wallace, DC, and Kahn, RA. ARL2 and BART enter mitochondria and bind the adenine nucleotide transporter. Mol Biol Cell. (2002) 13:71–83. doi: 10.1091/mbc.01-05-0245
65. Nishi, H, Ono, K, Iwanaga, Y, Horie, T, Nagao, K, Takemura, G, et al. MicroRNA-15b modulates cellular ATP levels and degenerates mitochondria via Arl2 in neonatal rat cardiac myocytes. J Biol Chem. (2010) 285:4920–30. doi: 10.1074/jbc.M109.082610
66. Ji, X, Wu, D, Wen, S, Zhao, S, Xia, A, Li, F, et al. Mild therapeutic hypothermia protects against cerebral ischemia/reperfusion injury by inhibiting miR-15b expression in rats. Brain Circ. (2017) 3:219–26. doi: 10.4103/bc.bc_15_17
67. Lim, YS, Ngo, HTT, Lee, J, Son, K, Park, EM, and Hwang, SB. ADP-ribosylation factor-related protein 1 interacts with NS5A and regulates hepatitis C virus propagation. Sci Rep. (2016) 6:31211. doi: 10.1038/srep31211
68. Koike, N, Yoo, SH, Huang, HC, Kumar, V, Lee, C, Kim, TK, et al. Transcriptional architecture and chromatin landscape of the core circadian clock in mammals. Science. (2012) 338:349–54. doi: 10.1126/science.1226339
69. Jacobi, D, Liu, S, Burkewitz, K, Kory, N, Knudsen, NH, Alexander, RK, et al. Hepatic Bmal1 regulates rhythmic mitochondrial dynamics and promotes metabolic fitness. Cell Metab. (2015) 22:709–20. doi: 10.1016/j.cmet.2015.08.006
70. Neufeld-Cohen, A, Robles, MS, Aviram, R, Manella, G, Adamovich, Y, Ladeuix, B, et al. Circadian control of oscillations in mitochondrial rate-limiting enzymes and nutrient utilization by PERIOD proteins. Proc Natl Acad Sci U S A. (2016) 113:E1673–82. doi: 10.1073/pnas.1519650113
71. Kim, J, and Sun, W. Circadian coordination: understanding interplay between circadian clock and mitochondria. Anim Cells Syst (Seoul). (2024) 28:228–36. doi: 10.1080/19768354.2024.2347503
72. Schmitt, K, Grimm, A, Dallmann, R, Oettinghaus, B, Restelli, LM, Witzig, M, et al. Circadian control of DRP1 activity regulates mitochondrial dynamics and bioenergetics. Cell Metab. (2018) 27:657–666.e5. doi: 10.1016/j.cmet.2018.01.011
73. Suskiewicz, MJ, Prokhorova, E, Rack, JGM, and Ahel, I. ADP-ribosylation from molecular mechanisms to therapeutic implications. Cell. (2023) 186:4475–95. doi: 10.1016/j.cell.2023.08.030
Keywords: circulating diagnostic biomarkers, sleep disorders, machine learning, stroke, ARL2
Citation: Yu H, Wang Z, Cai S, Zhang Y and Liu X (2025) Exploring common circulating diagnostic biomarkers for sleep disorders and stroke based on machine learning. Front. Neurol. 16:1599135. doi: 10.3389/fneur.2025.1599135
Edited by:
Xiaojia Ni, Guangzhou University of Traditional Chinese Medicine, ChinaReviewed by:
Ivan Šoša, University of Rijeka, CroatiaHuu Hoang Nguyen, University of Medicine and Pharmacy at Ho Chi Minh City, Vietnam
Copyright © 2025 Yu, Wang, Cai, Zhang and Liu. This is an open-access article distributed under the terms of the Creative Commons Attribution License (CC BY). The use, distribution or reproduction in other forums is permitted, provided the original author(s) and the copyright owner(s) are credited and that the original publication in this journal is cited, in accordance with accepted academic practice. No use, distribution or reproduction is permitted which does not comply with these terms.
*Correspondence: Xiangzhe Liu, bGl1eGlhbmd6aGVAMTYzLmNvbQ==
†These authors have contributed equally to this work