 Yi Zhang
 Lan Xu
- The First Affiliated Hospital of Soochow University, Suzhou, China
Objective: To describe the walking performance of patients with stroke and summarize the contextual factors associated with walking performance.
Methods: PubMed, Web of Science, Embase, and the Cochrane Library were searched from the inception to September 4, 2024. Observational studies on the walking performance of people with stroke and their contextual factors were eligible for inclusion. The relationship between contextual factors and walking performance was evaluated using Fisher’s z-value, which was then converted to correlation values (r).
Results: Thirty studies were included. Walking performance measures included step count, time, distance, and bouts; step count was most common, with pooled results showing a mean 4,296 steps/day after stroke. Guided by the contextual factors classification framework, we stratified the contextual factors of walking performance among subjects with stroke into three dimensions: user context, environmental context, and task context. Meta-analysis showed that walking endurance (r = 0.60; 95% CI, 0.46 to 0.71) was strongly correlated with the number of daily steps. Moderate correlations were found between daily step counts and gait speed (r = 0.41; 95% CI, 0.23 to 0.56), quality of life (r = 0.46; 95% CI, 0.34 to 0.56), self-efficacy (r = 0.30; 95% CI, 0.21 to 0.39), cardiorespiratory fitness (r = 0.36; 95% CI, 0.09 to 0.59), balance (r = 0.37; 95% CI, 0.02 to 0.65), and Rivermead Motor Assessment (r = 0.49; 95% CI, 0.26 to 0.65). Furthermore, age (r = −0.10; 95% CI, −0.18 to −0.02) and area deprivation index (r = −0.15; 95% CI, −0.24 to −0.06) were associated with the number of daily steps after stroke, but effect sizes were small.
Conclusion: Daily step counts among individuals with stroke were not guideline-compliant. Contextual factors can inform the design of context-aware interventions aimed at increasing daily step counts.
1 Introduction
Stroke is the second leading cause of death and the third leading cause of disability worldwide (1). Physical activity (PA) is defined as physical movement in which skeletal muscle contraction induces energy expenditure (2). PA has a robust health-promoting effect and improves the prognosis of patients with stroke. Adequate PA can improve cardiovascular health (3) and promote the functional recovery of patients with stroke (4, 5). In addition, PA can decrease negative emotions (depression, anxiety, etc.) after stroke (6, 7). Walking is the most frequent form of physical activity among individuals with stroke. In contrast to walking capacity (capability of a walking task in a clinical setting), walking performance refers to walking activities (i.e., daily steps, walking distance or duration of walking) in real-world settings (8). However, existing studies suggest that the walking performance of patients with stroke is much less than that recommended by the guidelines (9, 10). Therefore, improving walking performance among patients with stroke remains a priority for rehabilitation after stroke. Recently, mobile health (mHealth) has gradually become a research hotspot in the field of walking performance intervention because it fits the spatial and temporal dynamic characteristics of walking activities. Context-aware intervention is an emerging mobile intervention design that dynamically adjusts interventions based on an individual’s contextual information. Its core lies in the real-time optimization of intervention timing or content according to an individual’s contextual factors, which are defined as all information describing the status of entities, to enhance the accuracy, personalization, and effectiveness of the intervention (11, 12). Understanding and accurately obtaining contextual information can optimize intervention decisions. A systematic review indicated that context-aware interventions can effectively support behavioral changes to improve the health behaviors of users (13). However, the key contextual determinants of walking performance after stroke currently remain unclear.
To date, systematic reviews in this field have predominantly focused on physical activity (PA) among post-stroke individuals and its contextual factors, with no emphasis on walking performance as a distinct outcome. For instance, a systematic review by Thilarajah et al. (14) reported that factors such as age, gender, physical function, depression, fatigue, self-efficacy, and quality of life were significantly associated with PA. Although a number of studies included in this review utilized walking performance as an indicator of PA, their conclusions cannot be directly extrapolated to walking performance. This constraint, specifically, stems from the absence of subgroup analyses stratified by PA assessment methods. In addition, the heterogeneity among the existing studies in the selection of walking performance assessment indicators (e.g., frequency, intensity, etc.) and the measurement of the contextual factors has limited the comparison between studies.
To date, no standardized classification method for contextual factors has been established. A comprehensive classification framework was proposed by Chen (15), which categorizes contextual factors into user context, environmental context, and task context based on the requirements of context-aware technology and a user-centered approach. The user context dimension includes user attributes, living habits, and behavioral habits. The environmental context dimension includes the natural physical environment, comprising time, location, sunlight, and social environment (national customs and religious habits). Task context refers to the attributes and states of the behaviors associated with the user’s completion of the current task. The framework may provide a theoretical basis for the integration of multi-source contextual factors. Therefore, this study aimed to synthesize and categorize the contextual factors influencing walking performance in individuals with stroke, drawing on the contextual factor classification framework proposed by Chen (15) and to identify through quantitative synthesis those contextual factors demonstrating significant associations with walking performance. These efforts seek to provide a theoretical foundation for context-aware intervention development. Additionally, the study aimed to describe walking performance in individuals with stroke using real-world data, thereby updating the current status of walking performance among patients with stroke.
2 Methods
2.1 Registration
This review was registered on PROSPERO (CRD420250651772).
2.2 Eligibility criteria
The inclusion criteria were as follows (1): the study population diagnosed with a stroke (either ischemic, hemorrhagic, or a combination of both) (2); studies assessing walking performance in real-world settings (i.e., non-clinical environments excluding hospitals and laboratories) must include at least one of the following objective metrics: daily step count, walking duration, stepping frequency, or walking distance (3); studies that concurrently investigate walking performance and contextual factors and that provide empirical evidence of the correlation between contextual factors and walking performance metrics or the causal effect of contextual factors on walking performance (4); observational study design. The exclusion criteria were as follows (1): duplicate publication of study data (2); conference papers, reviews, protocols, randomized controlled trials or meta-analyses (3); articles without available full text; and (4) non-English articles.
2.3 Information sources
From the inception to September 4, 2024, a systematic search was conducted across 4 databases, including the Cochrane Library, PubMed, Web of Science, and Embase.
2.4 Search strategy
The search keywords were expanded to movement behavior, including physical activity and sedentary behavior, to ensure the comprehensiveness of the literature search. The search terms were tailored to individual databases. Please refer to Supplementary Table 1 for detailed search strategies. Only publications written in English were included. In addition, the reference lists of included articles were screened to identify potential studies.
2.5 Selection process
We imported the identified records into EndNote X9 and deleted duplicate records. Two researchers independently screened the identified articles based on the inclusion and exclusion criteria. Differences were resolved via discussion or consultation with other researchers.
2.6 Data extraction
We extracted and recorded the data using a homemade Excel spreadsheet. We extracted author names, publication date, country of study, study design, sample size, participant characteristics (including age, sex, stroke severity, and time since stroke), walking performance (daily step count, walking duration, walking distance, etc.), measurement tools, the contextual factors investigated, statistical tests employed for analysis, and correlation values. Two researchers independently extracted information and cross-checked the data. Differences in opinion were judged via discussion or via the participation of other researchers. For missing data, we contacted study investigators to obtain unreported data or additional details.
2.7 Risk of bias assessment
Cross-sectional and longitudinal studies were assessed for bias using the 11 evaluation criteria recommended by the Agency for Healthcare Research and Quality (AHRQ) (16). Each of the 11 assessment criteria recommended by the AHRQ received “yes” (1 point), “no” (0 points), or “unclear” (0 points). The total score was 11 points, with 0–3 indicating low quality, 4–7 indicating moderate quality, and 8–11 indicating high quality. The assessment was independently conducted by two researchers, and a third researcher was consulted in cases of uncertainty or disagreement.
2.8 Strategy for data synthesis
Guided by the context-aware classification framework, two researchers independently performed classification on the contextual factors extracted from the original studies. Upon completion of the classification process, a cross-check of their respective work was conducted to identify any discrepancies. All inconsistencies were subjected to thorough deliberation with the aim of reaching mutual agreement; in instances where consensus remained elusive, a third researcher was consulted to render the final decision.
The meta-analysis was conducted using Stata 17.0 software. Quantitative synthesis was conducted when two or more studies reported walking performance outcomes or correlations between walking performance and situational factors. Weighted means (by sample size) and 95% CIs were calculated using Stata 17.0 for each walking performance outcome. Based on the methods proposed by Luo et al. (17) and Wan et al. (18), we transformed medians, ranges, or quartiles into mean ± standard deviation. Regarding contextual factors, the correlation values (r) were used to calculate the effect size (ES). The formula was employed to convert r to Fisher’s z-value with standard error, and finally converted the Fisher’s z-value back to r. For standardized regression coefficients or path coefficient analyses, the formula r = 0.98β + 0.05λ (λ = 1 when β ≥ 0; λ = 0 when β < 0) was utilized to transform the regression coefficients into correlation coefficients (r) before subsequent calculations (19). First, the correlational (r) values were converted to (ES(z) = 1/2loge [(1 + r)/(1 − r)]) (20), and then the pooled effect size was calculated. Statistical heterogeneity was judged based on p-value and I2. I2 ≤ 50% or p ≥ 0.05 indicated acceptable heterogeneity among studies; thus, a fixed-effects model was employed for analysis, otherwise a random-effects model was used for analysis. Subgroup analysis and meta-regression were performed to analyze the source of heterogeneity when heterogeneity was significant. Pooled ES was converted back to r using meta r = ([e(2z) − 1]/[e(2z) + 1]) (20). Correlation coefficient (r) < 0.1 indicated no relationship, r between 0.1 and 0.29 indicated a weak relationship, r between 0.30 and 0.49 indicated a moderate relationship, and r ≥ 0.5 indicated a strong relationship (21). Sensitivity analysis was performed by excluding the included literature one by one to evaluate the stability of the meta-analysis results. When at least 10 studies were included, publication bias was assessed using a funnel plot.
3 Results
3.1 Study selection and characteristics
The database search initially yielded 6,182 potential articles, from which 1,361 duplicates were excluded. After screening the titles and abstracts of the remaining 4,821 articles, we excluded 4,715 irrelevant articles. Full-text reports of 106 studies were assessed for eligibility, of which 26 met the criteria and were included in the synthesis. We reviewed the reference lists of the 26 included studies and identified five additional studies that met the eligibility criteria. In total, 30 studies published between 2005 and 2024 were included in our study. The detailed search process is depicted in Figure 1.
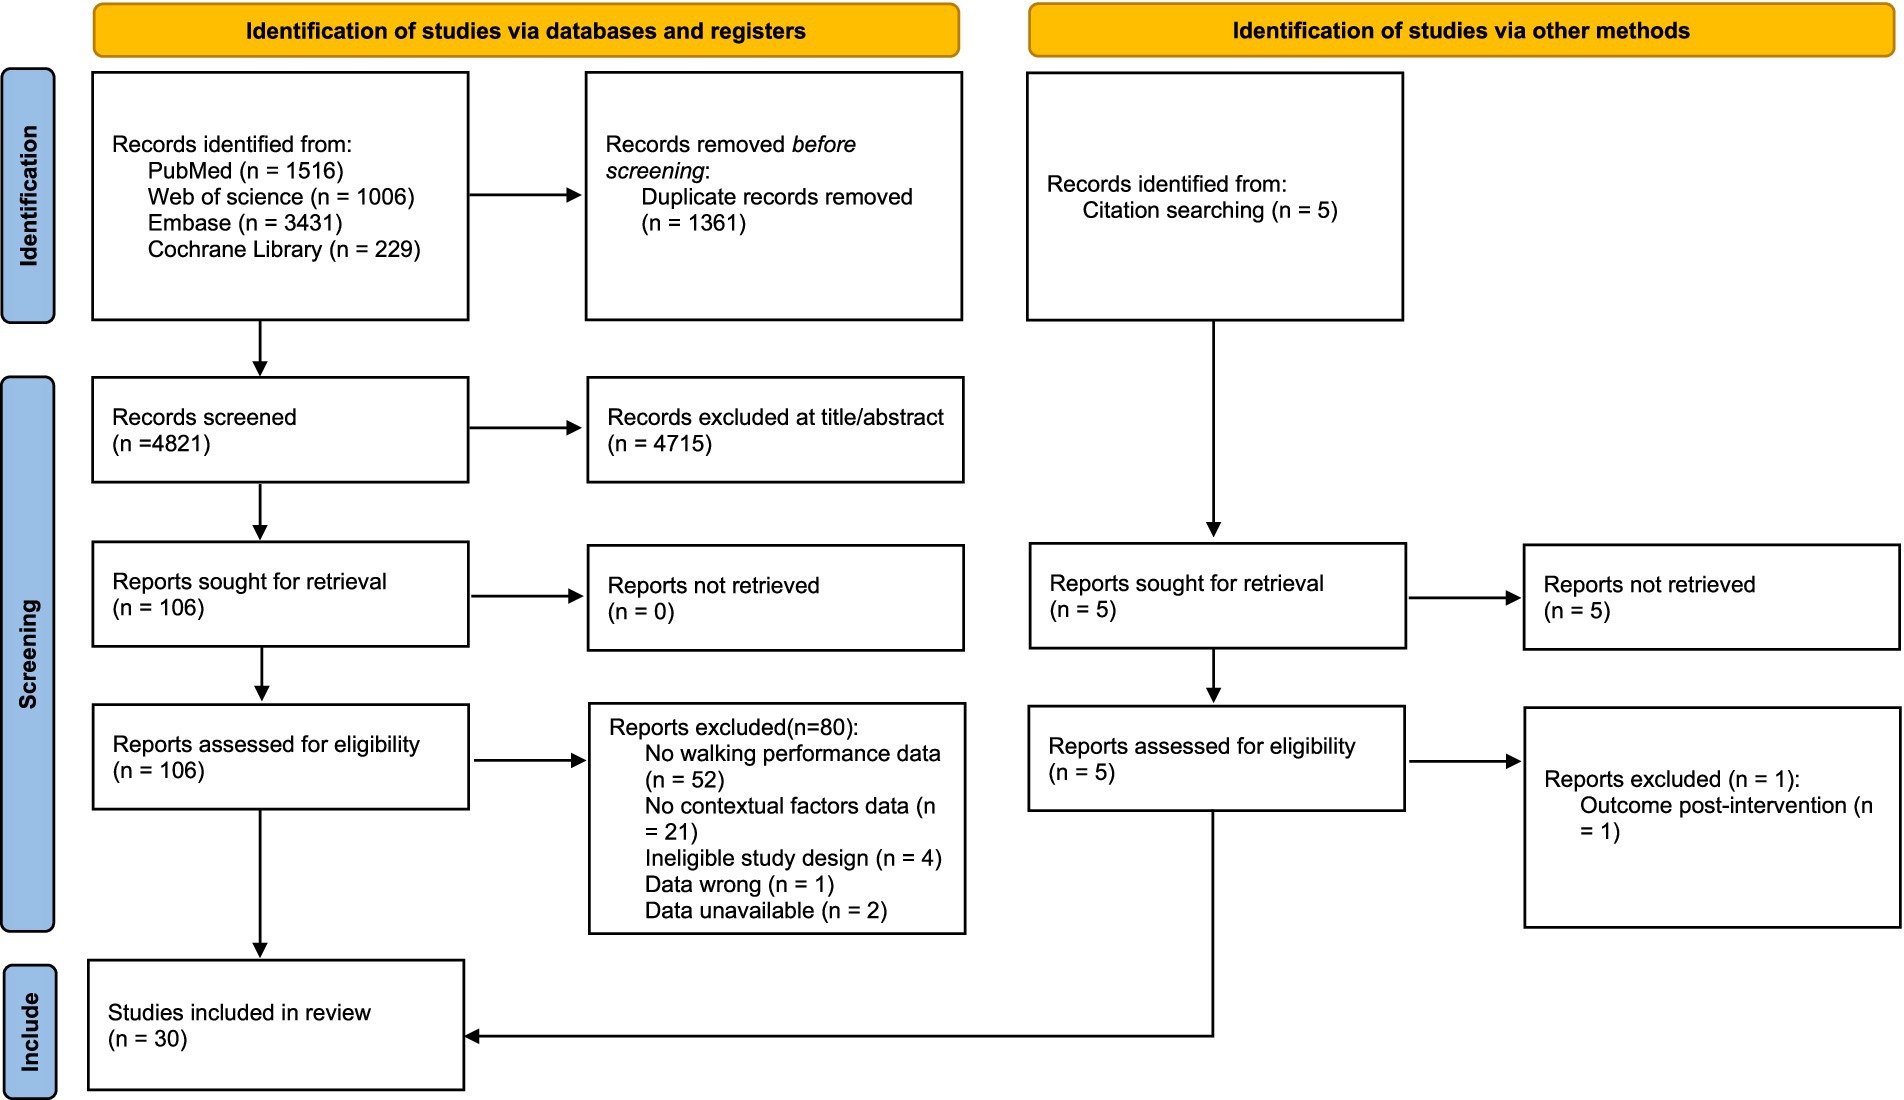
Figure 1. Flow chart of study selection.
The extracted data are summarized in Supplementary Table 2. Most studies had a cross-sectional design, and 4 studies were longitudinal. In total, 2,217 patients with stroke were enrolled in 30 studies, of which 1,283 (57.9%) were male. One study did not report sex. Nine studies reported stroke severity using the National Institutes of Health Stroke Scale, with most patients experiencing stroke with low or moderate severity. Participants ranged from 3 months to 14 years post-stroke. Seven studies did not report time since stroke.
3.2 Risk of bias in studies
Based on the AHRQ items, the quality assessment revealed that 20 studies showed moderate quality and 10 studies exhibited high quality (Supplementary Table 3).
3.3 Measurement tools and indicators of walking performance
Walking performance was measured using Activity Monitor, most commonly the StepWatch Activity Monitor (SAM) (22–28) and Fitbit family (Fitbit One, Fitbit Zip, and Fitbit Charge HR) (29–36). Other devices included activPAL™ (37, 38), activPAL (39, 40), activPAL3 Micro (41), Actigraph (42), Actigraph GT3X (43), tri-axial accelerometer (44), hip accelerometer (45), Yamax SW-200 pedometer (46), VKRFitness Twin Step Pedometer (47), OMRON step Counter (48), SenseWear Armband (49, 50), and SenseWear Pro 3 Armband (51).
Step count was the most commonly applied indicator of walking performance. Other indicators were time in stepping (38, 39, 41, 44), walking distance (48), and walking bouts (40, 44). Seven studies stratified walking performance to intensities (23, 24, 27, 37, 38, 40, 41), and three studies stratified walking performance to time of walking bouts (37, 40, 44). However, there was no consensus on the definition of walking intensity. Two studies defined low-intensity walking as less than 16 steps per minute (23, 27), while one study defined low-intensity walking as less than 30 steps per minute (24). Additionally, two other studies defined low-intensity walking as less than 80 steps per minute (38, 41). Different studies offered different definitions of medium-intensity walking. One study defined medium-intensity walking as ≥16 and <30 steps per minute (27), another defined medium-intensity walking as 16–40 steps per minute (23), and another study defined medium-intensity walking as 80–99 steps per minute (38, 41). Different studies defined high-intensity as ≥30 steps per minute (27), >40 steps/min (23), >60 steps/min (24), >80 steps/min (37), and >100 steps/min (38, 41). In addition, Luzum et al. (40) utilized metabolic equivalent of task (MET) to classify walking intensity.
There were also differences in the definition of walking bouts in different studies. van de Port et al. (44) defined a walking bout as an episode of one or more consecutive gait epochs of 8 s and classified them into short walking bouts (8–24 s) and long walking bouts (>24 s). Mahendran et al. (37) defined a walking bout as any 15-s data interval containing 2 steps and defined long walking bouts as >300 steps. Luzum et al. (40) defined standing and walking events as a minimum length of 3 s. Events lasting from 3 s to less than 10 min were categorized as short-bout PA, while those lasting 10 min or more were classified as long-bout PA.
3.4 Contextual factors model of walking performance in patients with stroke
We extracted contextual factors associated with walking performance from the 30 included studies and categorized them based on the contextual factors classification model (15). Our model (Figure 2) was composed of three essential dimensions: user context, environment context, and task context. The user context involved demographic information, disease-related information, movement capacity, psychological status, and health status of patients with stroke. Environmental contexts included climatic conditions and community environments. Task contexts are other movement behavioral states closely associated with walking activity, including physical activity, sedentary behavior, standing, and sit-to-stand transitions.
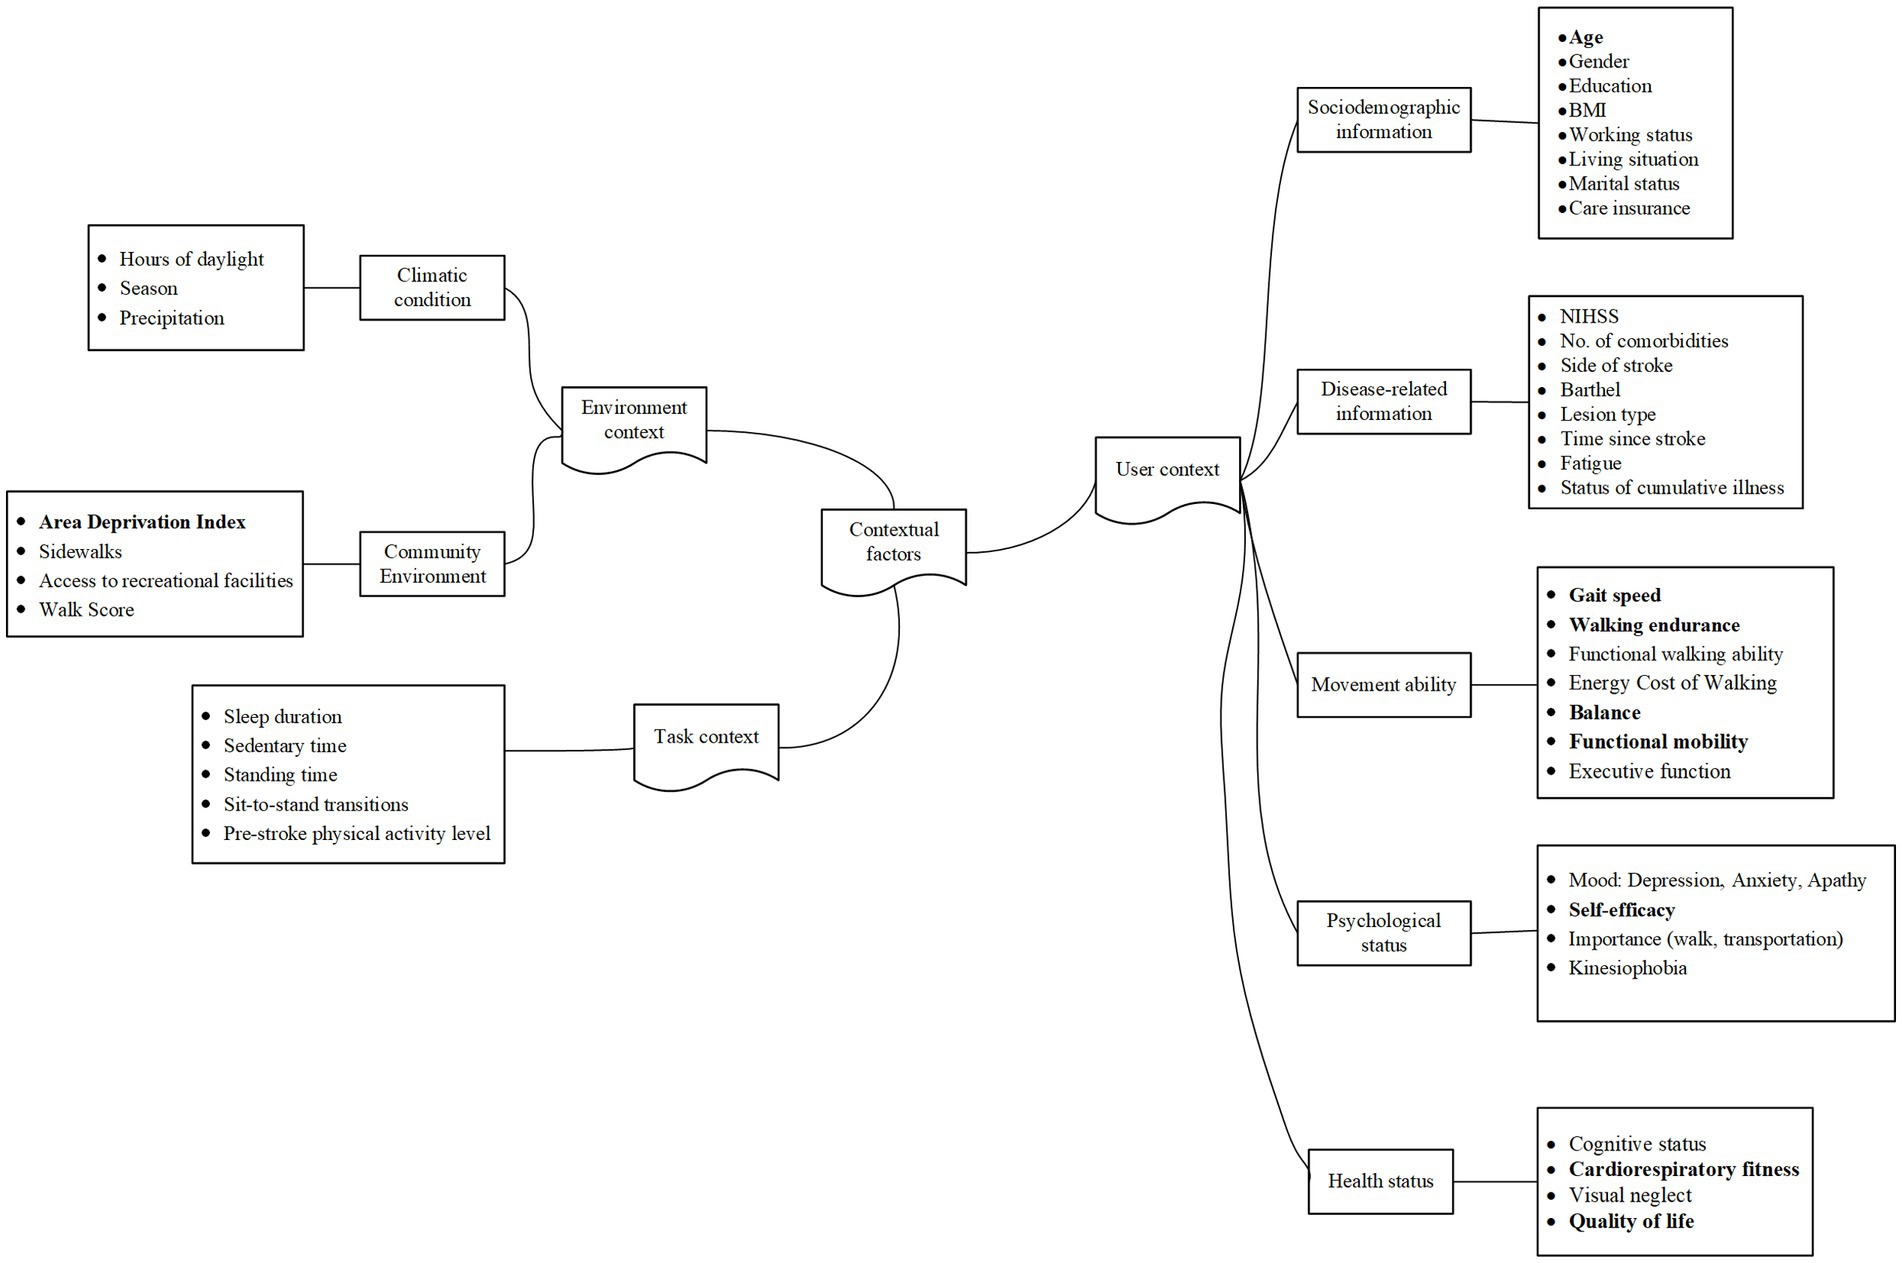
Figure 2. A contextual factor classification model for the walking performance of patients with stroke.
3.5 Synthesis of meta-analysis results
3.5.1 Pooled daily steps
Due to inconsistent reporting of walking performance metrics across studies, daily step count was selected as the indicator for quantitative synthesis, as it was the most consistently reported and standardized metric. Twenty-seven of the included articles reported daily steps as an outcome indicator. Meta-analysis revealed that the number of daily steps of patients with stroke in a free-living environment was 4,269 (95% CI: 3643.80 to 4894.56), with significant heterogeneity among the included studies (I2 = 97.2%, p < 0.001); therefore, the random-effects model was employed (Figure 3).
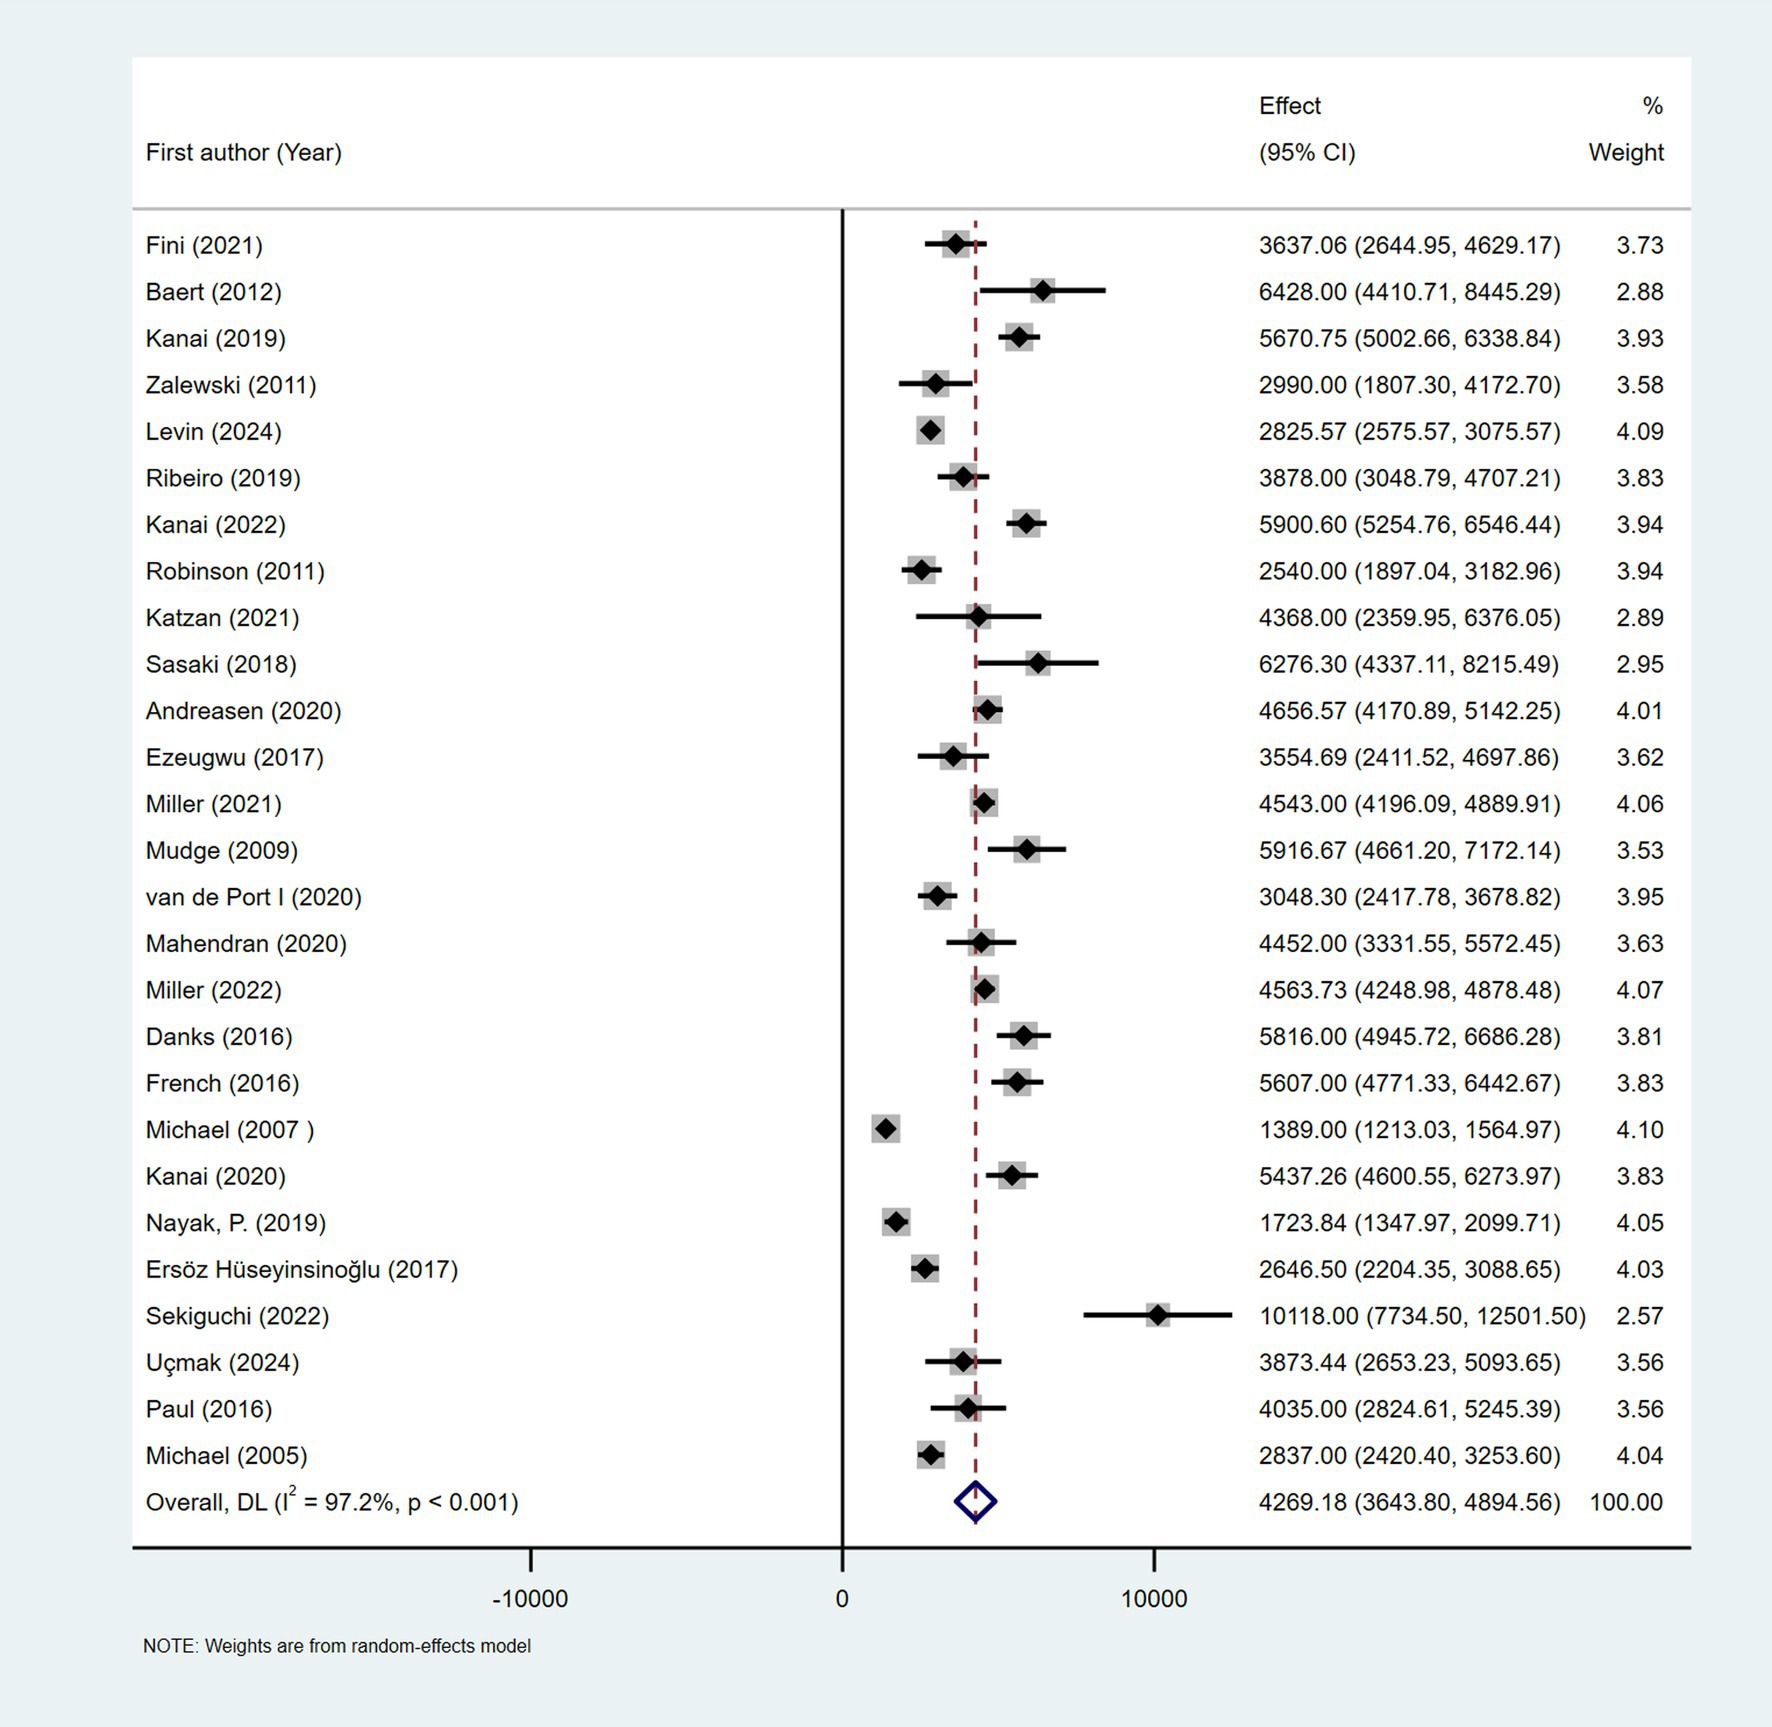
Figure 3. Forest plots of the pooled outcome with corresponding 95% CIs for daily steps of patients with stroke.
3.5.2 Subgroup analysis and meta-regression of pooled daily step counts
The subgroups were grouped based on the year of publication, sample size, time since stroke, region, and measurement instrument. There was significant heterogeneity between the subgroups (I2 > 50% or p < 0.05); thus, they were analyzed using a random-effects model. Except for the subgroups of sample size and measurement tools, there was no significant difference between subgroups (p > 0.05) (Supplementary Table 4).
Subgroup analysis based on the year of publication indicated that the number of steps per day (95% CI) was 3,977 (3135.431–4819.523) for the 2005–2019 subgroup and 4,563 (3871.890–5253.761) for the 2020–2024 subgroup, respectively. The subgroups were categorized based on sample size into three groups: <30, 30–49, and ≥50, and significant differences were observed in the number of steps between the subgroups (p = 0.01). The respective combined daily step counts (95% CI) for these subgroups were 5,211 (3827.281–6596.278), 3,215 (2642.331–3786.923), and 4,538 (3360.859–5714.966), respectively. In subgroup analysis based on region, the daily step count was 4,248 (3062.355–5433.143) in Europe, 4,680 (3565.475–5794.810) in Asia, 3,881 (2848.232–4914.365) in America, and 4,743 (2510.074–6976.063) in Australia. The number of steps taken per day by elderly patients with stroke (aged 65 years and older) was 4,231 (2999.001–5464.547), while the number of steps was 4,251 (3590.427–4912.523) for patients with stroke who were younger than 65 years. The population was divided into three subgroups based on time since stroke, including less than 3 months, 3–6 months, and more than 6 months. Daily steps for these subgroups were 3,217 (1628.817–4805.504), 4,729 (3971.831–5486.925), and 4,196 (3445.838–4946.693), respectively. When studies were divided into 4 subgroups based on the measurement tool, there was a significant difference in the number of daily steps between the groups (p = 0.003). Studies using the Fitbit family as the measurement tool had a combined daily step count of 5,076 (4647.491–5504.303), significantly higher than that in studies using other measurement tools. Meta-regression did not identify significant sources of heterogeneity (see Supplementary Table 5).
3.5.3 Contextual factors associated with daily steps
After a thorough examination of the full-text version of the 30 articles, 4 were excluded due to insufficient information necessary for calculating the correlation coefficients (25, 34, 45, 50). Additionally, three articles investigated the associations between walking time and contextual factors, yet these factors did not overlap with others, leading to their exclusion (38–40). Furthermore, the contextual factors explored in the two articles were not replicated in the broader literature, necessitating their exclusion (23, 42). The remaining studies containing the same contextual factors were pooled (≥2 studies), with the standardized regression coefficients reported in seven of these studies converted to correlation coefficients using the formula (28, 29, 31, 32, 35, 44, 51). Table 1 reveals the pooled r value obtained via z-to-r back transformation.
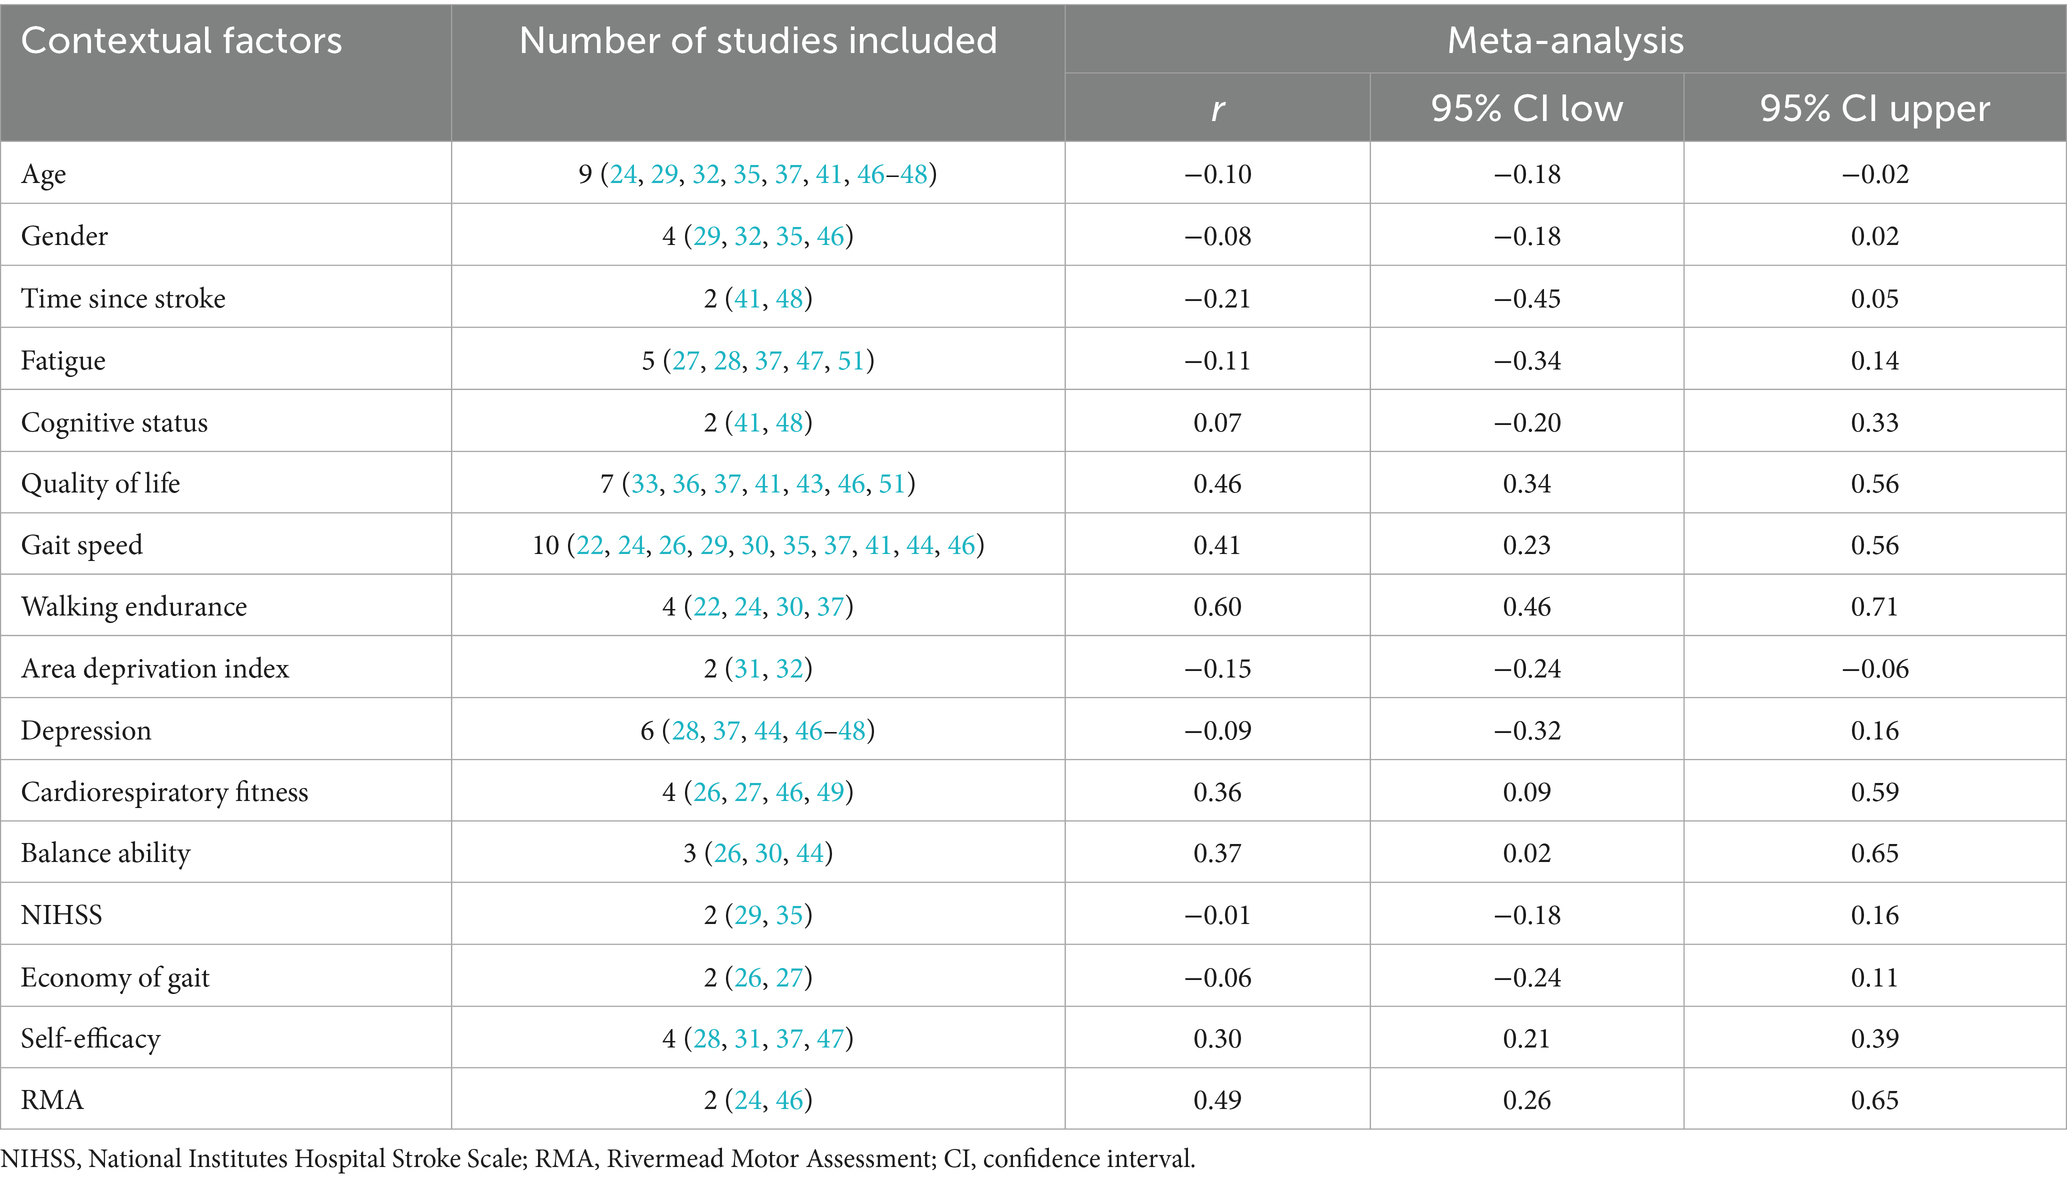
Table 1. Results of meta-analysis for contextual factors of walking performance among individuals with stroke.
3.5.3.1 User context
3.5.3.1.1 Demographic information
Nine studies examined the relationship between age and daily steps (24, 29, 32, 35, 37, 41, 46–48). As shown in Figure 4, meta-analysis revealed a significant but weak relationship between post-stroke daily steps and age (Fisher’s z = −0.1; 95% CI, −0.18 to −0.02; meta r = −0.10; 95% CI, −0.18 to −0.02). Four studies investigated the relationship between gender and daily steps (29, 32, 35, 46). As shown in Figure 5, the meta-meta-analysis revealed no statistically significant association (Fisher’s z = −0.08; 95% CI, −0.18 to 0.02; meta r = −0.08; 95% CI, −0.18 to 0.02).
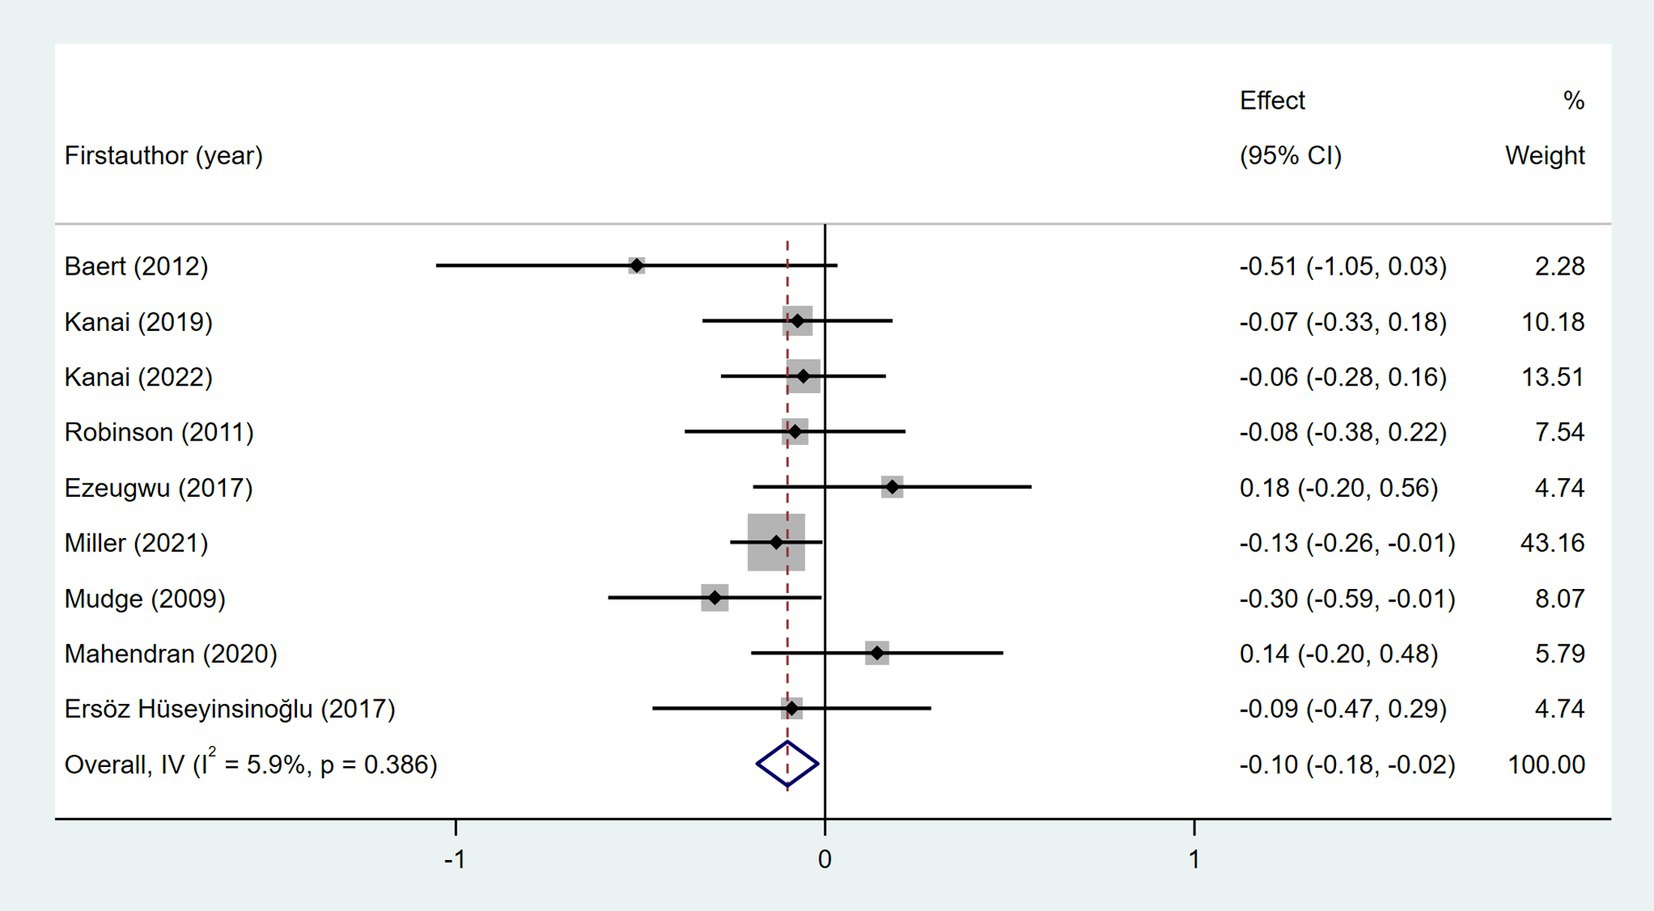
Figure 4. Forest plot for the relationship between age and daily steps.
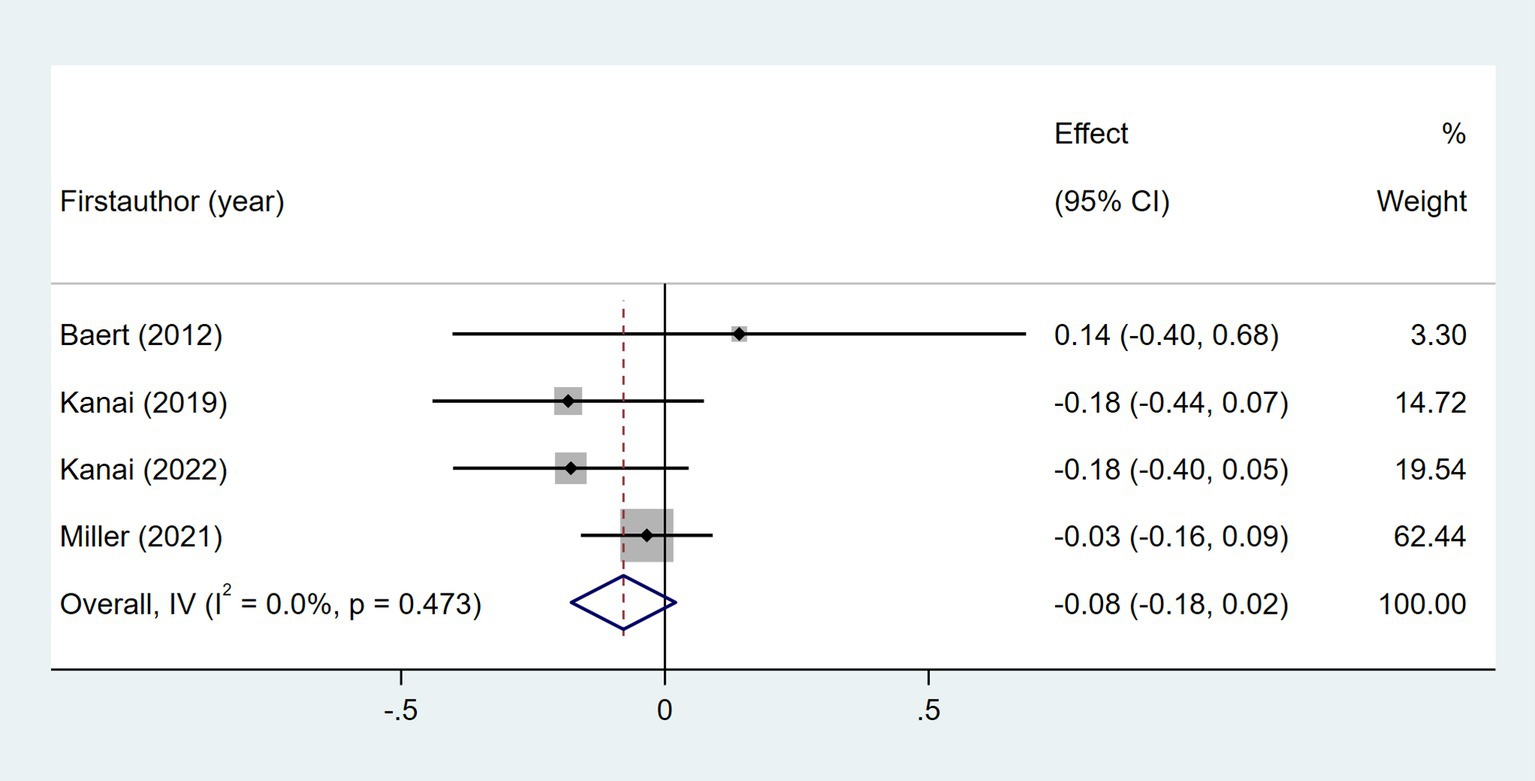
Figure 5. Forest plot for the relationship between gender and daily steps.
3.5.3.1.2 Disease-related information
The relationship between NIHSS score and daily steps was investigated in two studies (29, 35). As shown in Figure 6, the meta-analysis revealed no statistically significant association (Fisher’s z = −0.01; 95% CI, −0.18 to 0.16; meta r = −0.01; 95% CI, −0.18 to 0.16). As shown in Figure 7, the meta-analysis of two studies revealed no significant association between time since stroke and daily step count (Fisher’s z = −0.21; 95% CI, −0.48 to 0.05; meta r = −0.21; 95% CI, −0.45 to 0.05). Five studies explored the association between fatigue and daily step count (27, 28, 37, 47, 51). Fatigue was assessed using validated instruments including the Fatigue Severity Scale (FSS) and the Fatigue Impact Scale (FIS). As shown in Figure 8, the meta-analysis revealed no statistically significant association between fatigue and daily step count (Fisher’s z = −0.11; 95% CI, −0.35 to 0.14; meta r = −0.11; 95% CI, −0.34 to 0.14), but substantial heterogeneity was observed (I2 = 71.1%, p = 0.008). Subgroup analysis demonstrated that measurement tools did not significantly account for the observed heterogeneity across studies (p = 0.589).
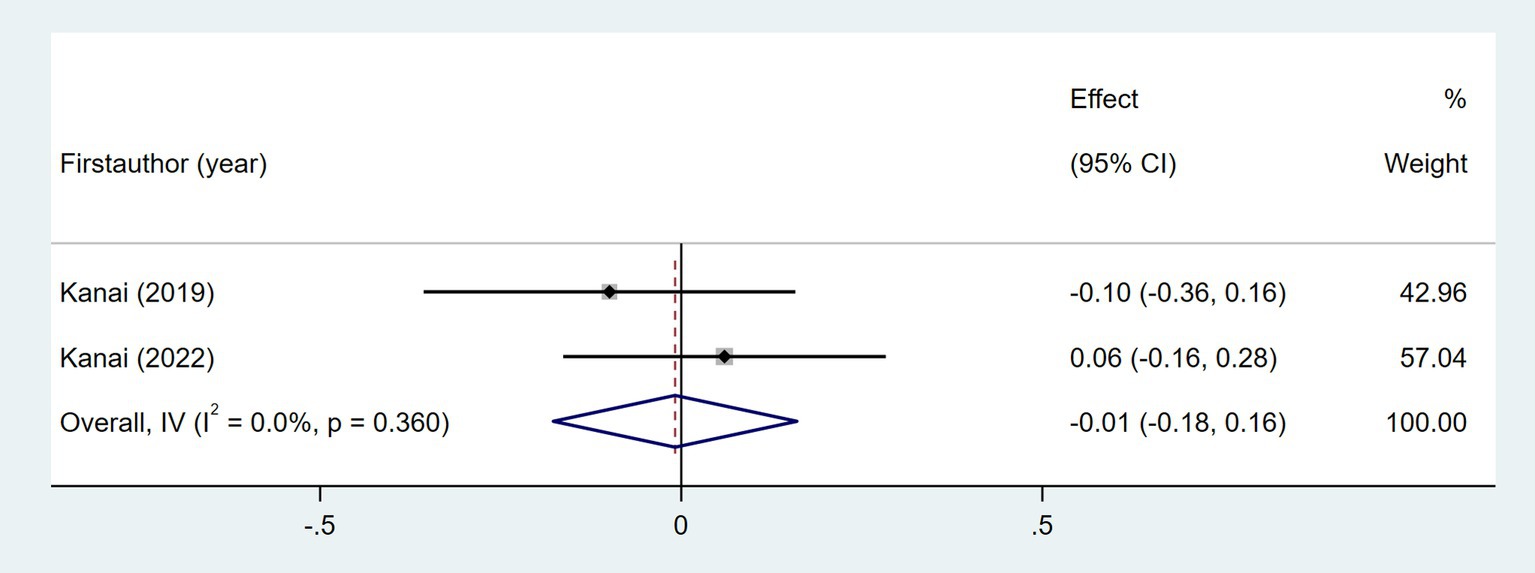
Figure 6. Forest plot for the relationship between NIHSS and daily steps.
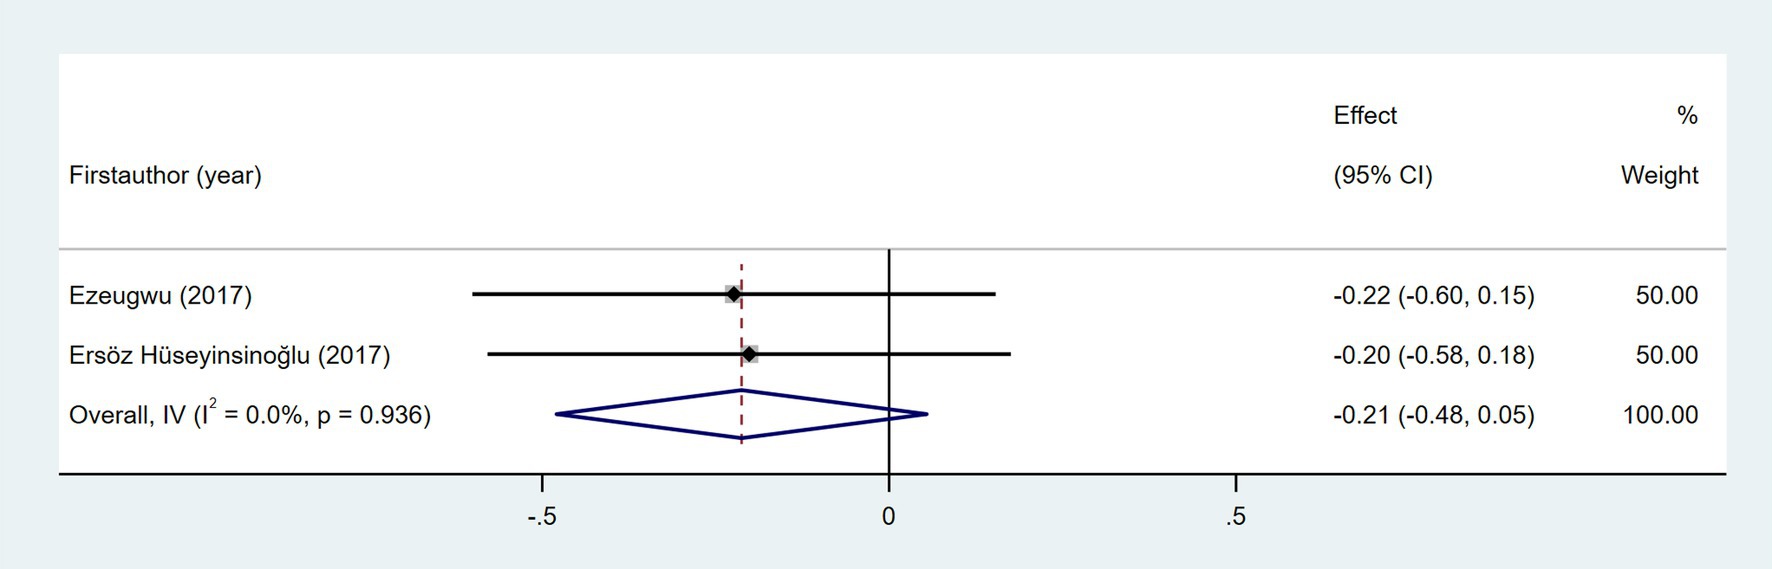
Figure 7. Forest plot for the relationship between time since stroke and daily steps.
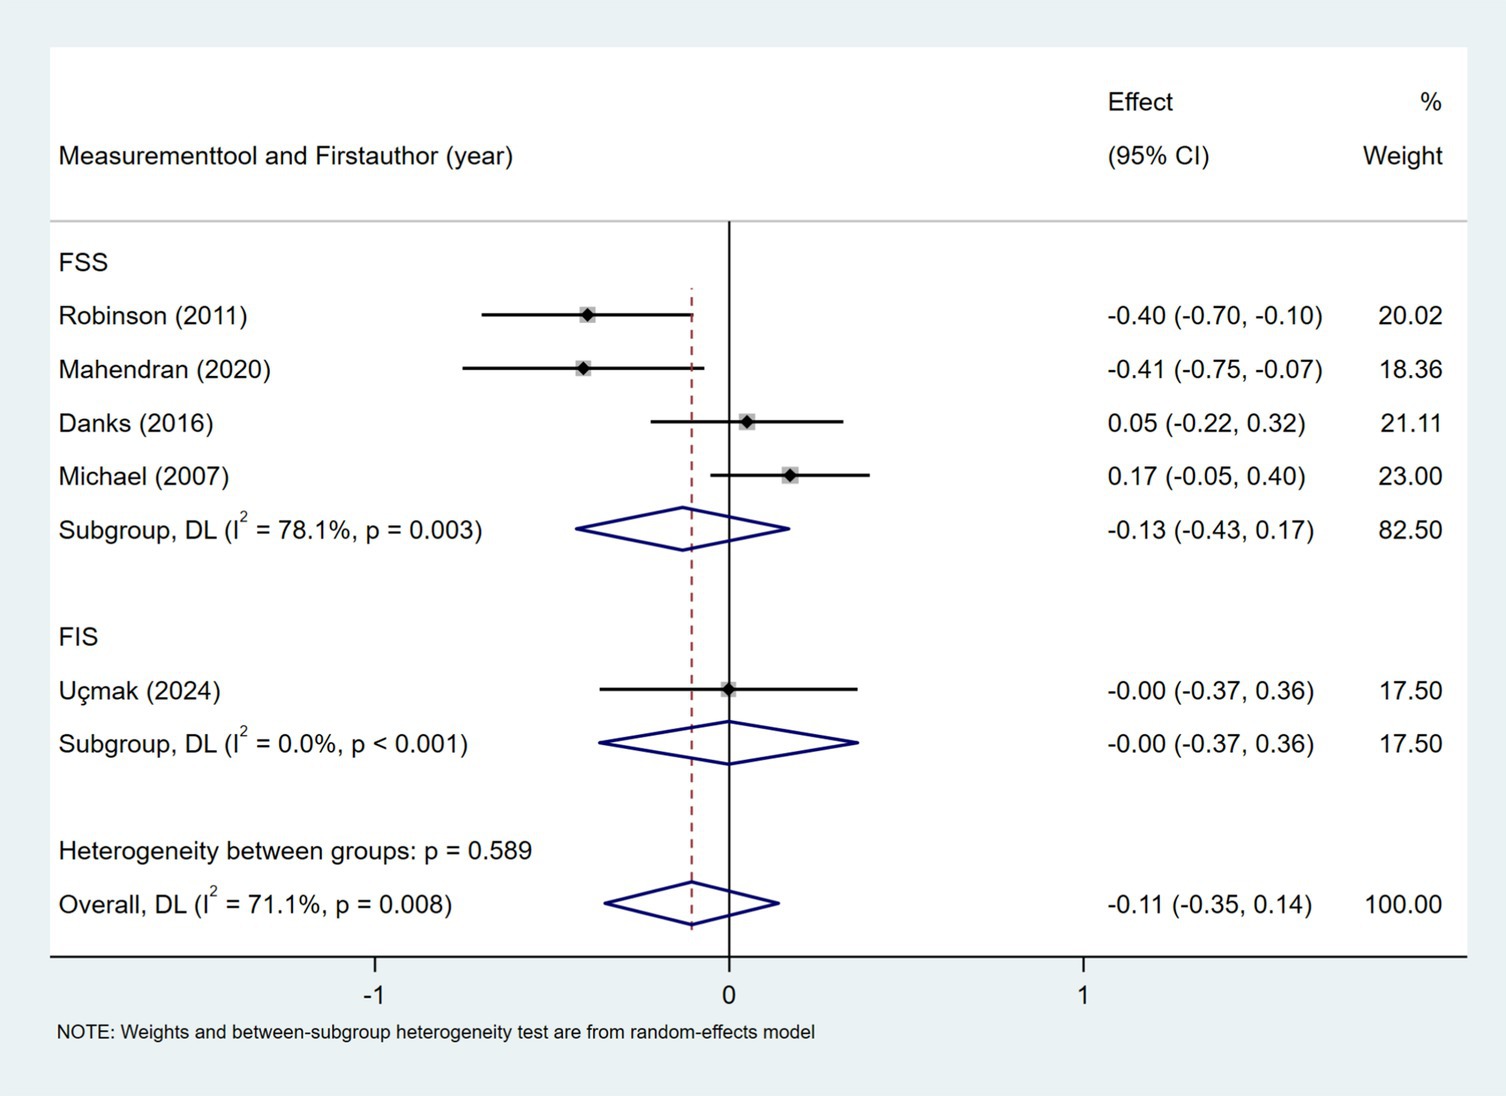
Figure 8. Forest plot for the relationship between fatigue and daily steps. FSS, Fatigue Severity Scale; FIS, Fatigue Impact Scale.
3.5.3.1.3 Movement capacity
Ten studies investigated the relationship between gait speed and daily step count, employing diverse methods to assess gait speed: 10 Meter Walk Test (10MWT) (22, 24, 29, 35, 37, 44, 46), 4 Meter Walk Test (4MWT) (30), 5 Meter Walk Test (5MWT) (41), and self-selected floor walking velocity (26). In Figure 9, the meta-analysis revealed a moderate positive correlation between gait speed and daily step count (Fisher’s z = 0.43; 95% CI, 0.23 to 0.63; meta r = 0.41; 95% CI, 0.23 to 0.56). Moreover, between-study heterogeneity was high (I2 = 70.0%, p < 0.001); between-study heterogeneity was largely attributed to a single study that demonstrated a negative association (44), while measurement tools did not significantly explain the observed heterogeneity (p = 0.257). Four studies investigated the association between walking endurance and daily step count, using the 6-Minute Walk Test (6MWT) (22, 24, 37) and the 2-Minute Walk Test (2MWT) (30). As shown in Figure 10, the meta-analysis demonstrated a strong, statistically significant positive correlation between walking endurance and daily step count in patients with stroke (Fisher’s z = 0.69; 95% CI, 0.50 to 0.88; meta r = 0.60; 95% CI, 0.46 to 0.71). Three studies investigated the association between balance and daily step count in patients with stroke using the Berg Balance Scale (BBS) (26, 44) and the standing balance test (30). As shown in Figure 11, the meta-analysis revealed a moderate correlation (Fisher’s z = 0.39; 95% CI, 0.02 to 0.77; meta r = 0.37; 95% CI, 0.02 to 0.65), with high heterogeneity (I2 = 66.6%, p = 0.05). Balance assessment tools can identify subgroup variations, thereby addressing potential sources of heterogeneity in pooled effect estimates (p = 0.027). The Rivermead Motor Assessment (RMA) is an important measure of mobility in patients with stroke. Two studies evaluated the relationship between the RMA and daily step count (24, 46), with the meta-analysis of these studies confirming a moderate correlation (Fisher’s z = 0.53; 95% CI, 0.27 to 0.78; meta r = 0.49; 95% CI, 0.26 to 0.65) (Figure 12). Two studies investigated the association between economy of gait and daily step count (26, 27). As shown in Figure 13, the meta-analysis revealed no statistically significant correlation (Fisher’s z = −0.06; 95% CI, −0.24 to 0.11; meta r = −0.06; 95% CI, −0.24 to 0.11).
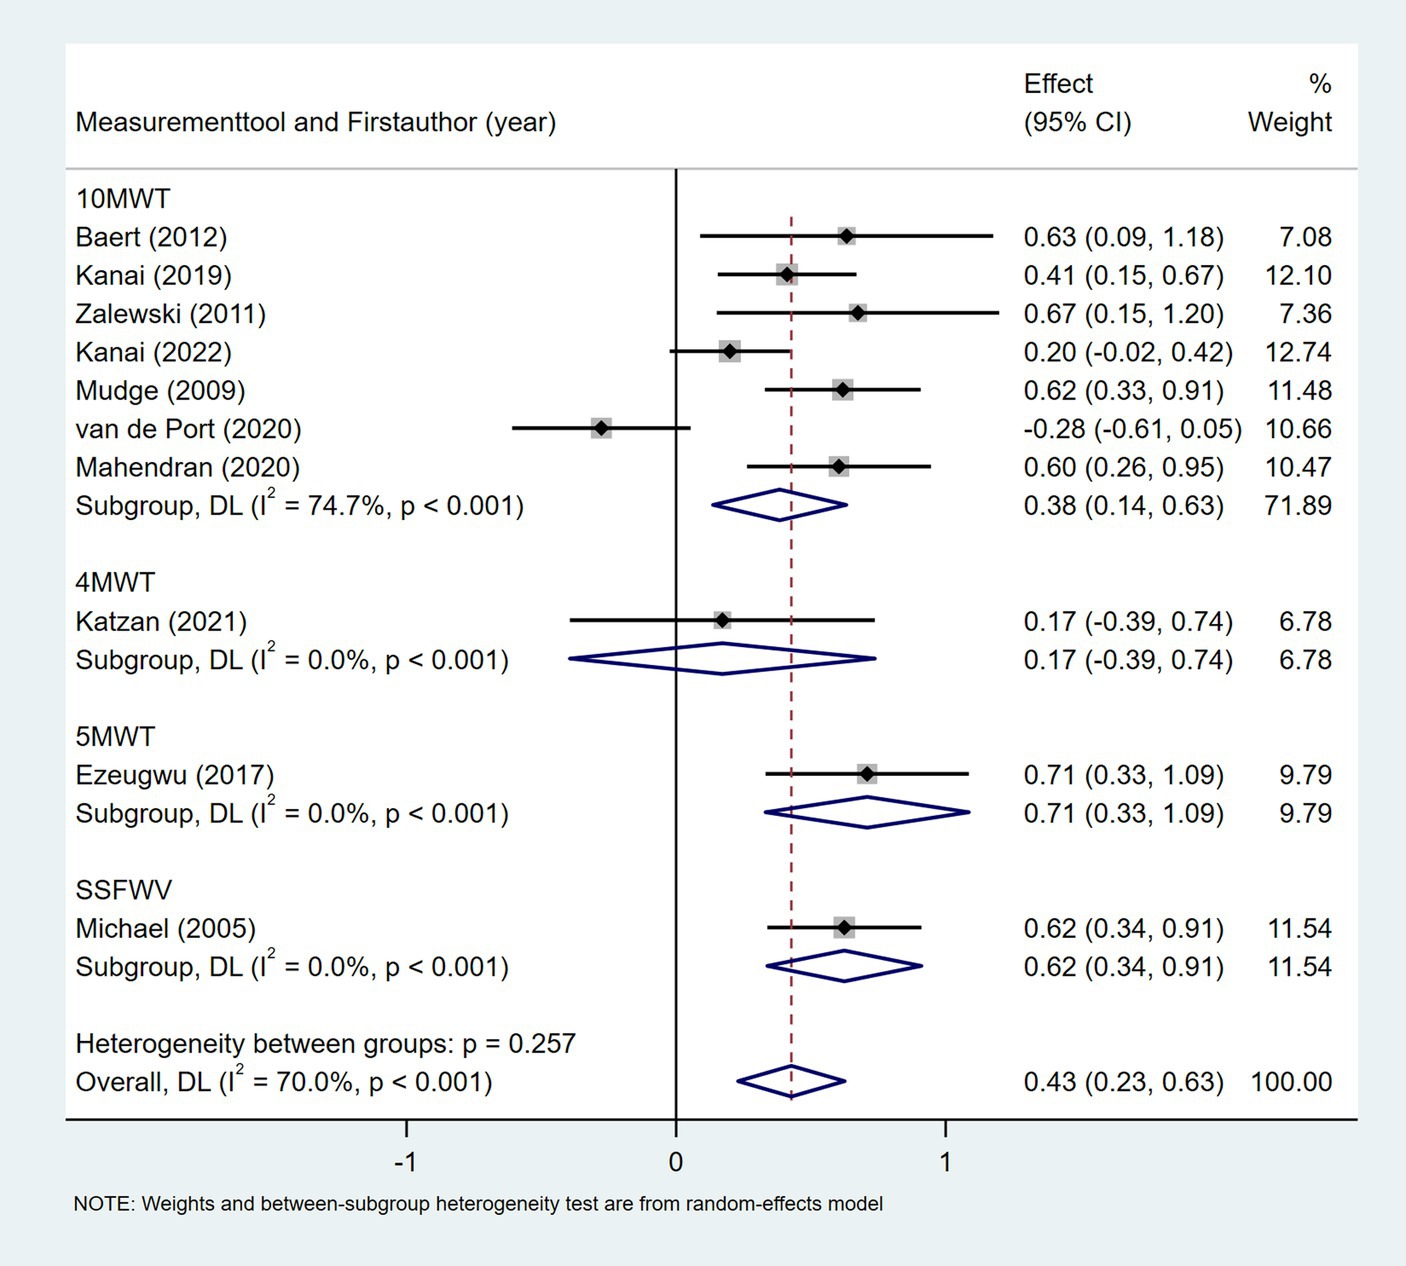
Figure 9. Forest plot for the relationship between gait speed and daily steps. 10MWT, 10 Meter Walk Test; 4MWT, 4 Meter Walk Test; 5MWT, 5 Meter Walk Test; SSFWV, self-selected floor walking velocity.
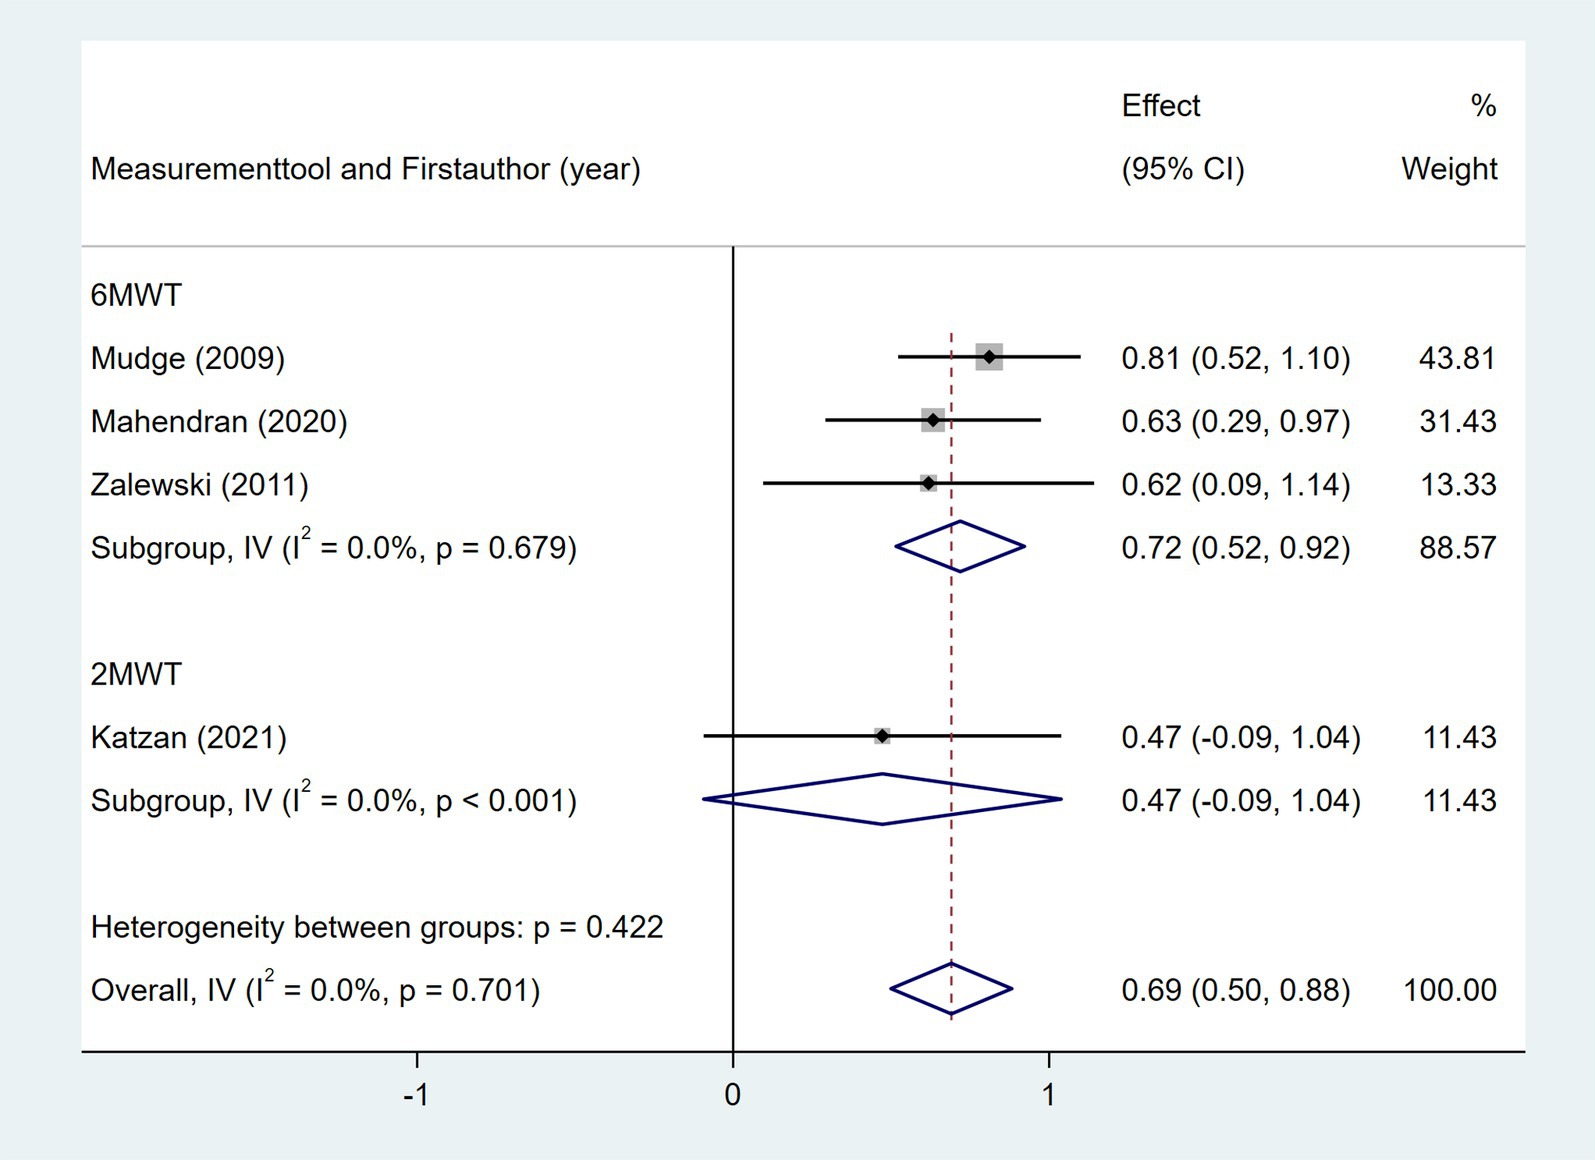
Figure 10. Forest plot for the relationship between walking endurance and daily steps. 6MWT, 6-Minute Walk Test; 2MWT, 2-Minute Walk Test.
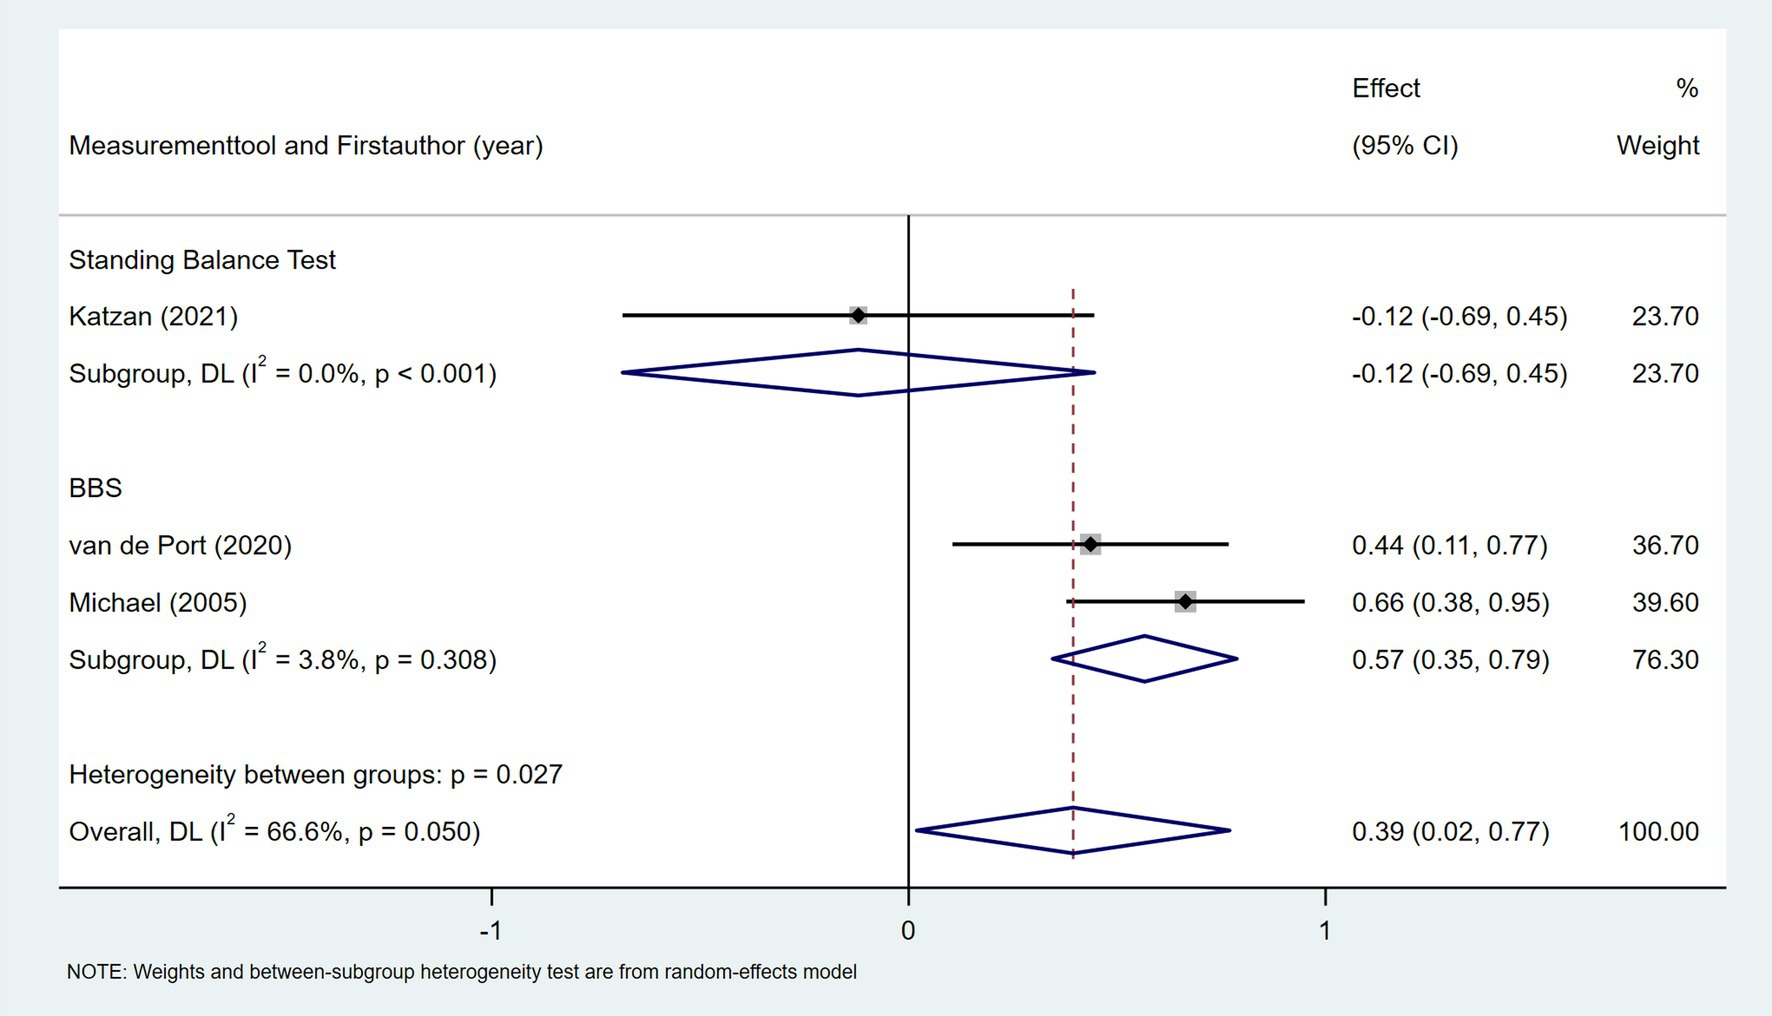
Figure 11. Forest plot for the relationship between balance and daily steps. BBS, Berg Balance Scale.
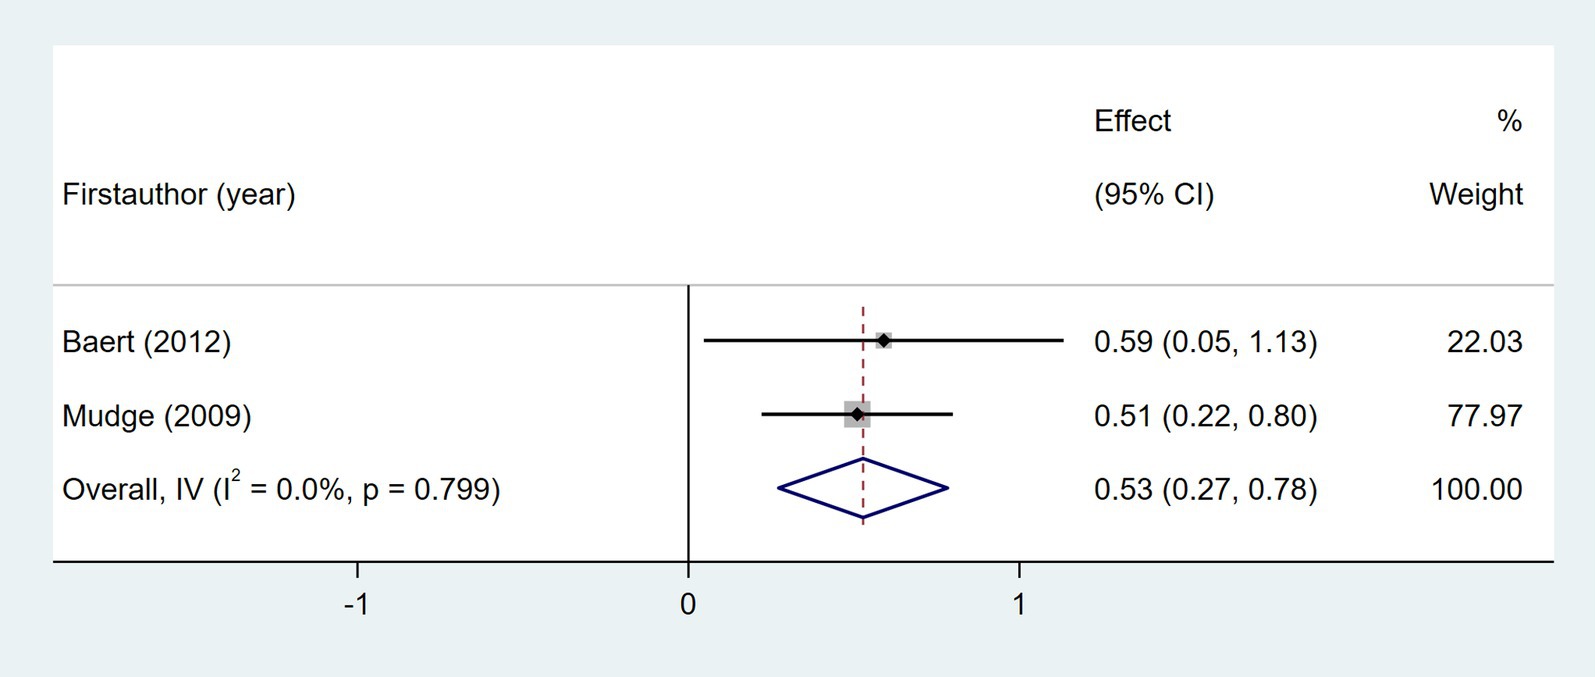
Figure 12. Forest plot for the relationship between RMA and daily steps. RMA, Rivermead Motor Assessment.
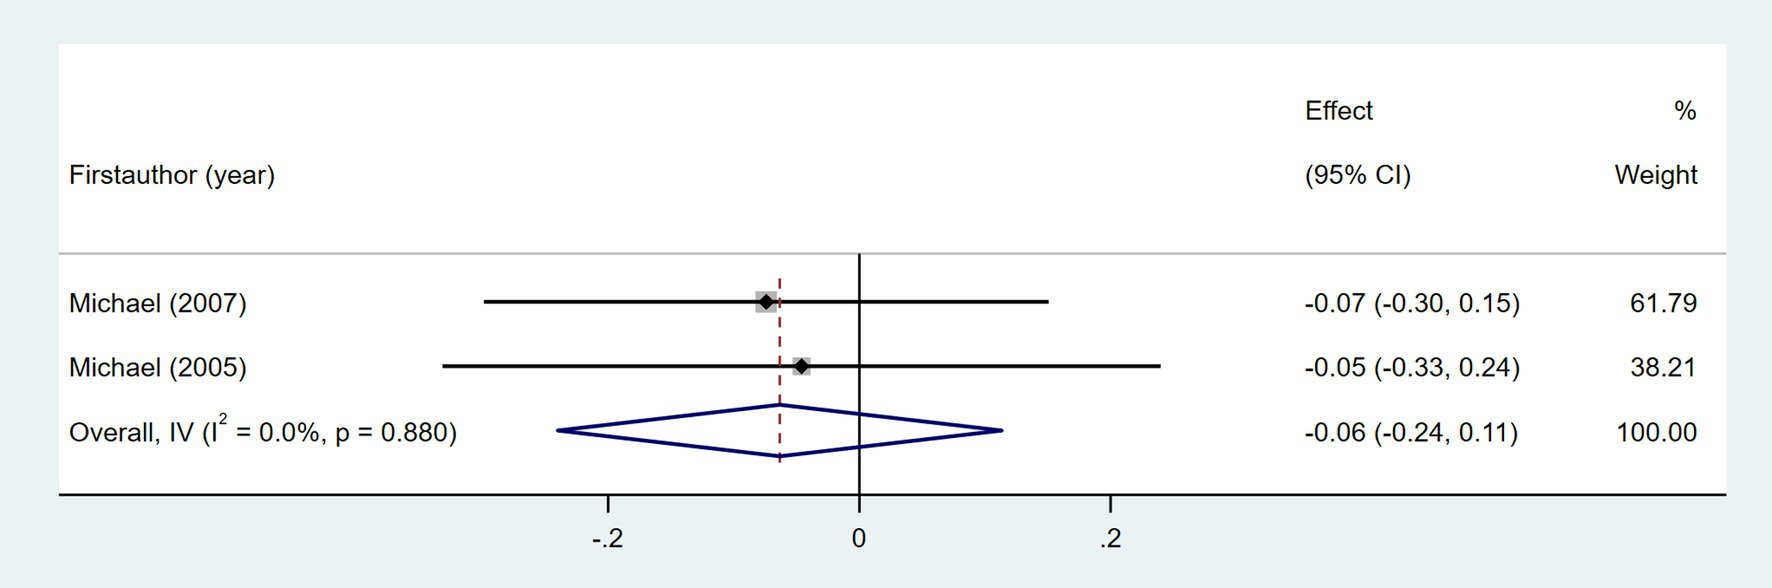
Figure 13. Forest plot for the relationship between economy of gait and daily steps.
3.5.3.1.4 Psychological status
Six studies explored the association between depression and daily step count (28, 37, 44, 46–48), utilizing validated depression scales including the Geriatric Depression Scale (GDS), Beck Depression Inventory-II (BDI-II), Center for Epidemiologic Studies Depression Scale (CES-D), and Depression-Happiness Scale (DHS). As shown in Figure 14, random-effects meta-analysis of six studies demonstrated a non-significant correlation between depression and objectively measured daily steps (Fisher’s z = −0.09; 95% CI, −0.33 to 0.16; meta r = −0.09; 95% CI, −0.32 to 0.16). However, substantial heterogeneity was observed (I2 = 66.8%, p = 0.01). Subgroup analyses indicated that heterogeneity was attributable to variations in depression assessment tools (p = 0.004). Four studies investigated the association between self-efficacy and daily step count, with self-efficacy assessed using validated instruments including the Activities Specific Balance Confidence Scale (ABC) (28, 31, 47), the Ambulatory Self-Confidence Questionnaire (ASCQ) (37), and the Swedish version of the Falls Efficacy Scale (FES-s) (47). As shown in Figure 15, the meta-analysis revealed a moderate positive correlation between self-efficacy and daily step count (Fisher’s z = 0.31; 95% CI, 0.21 to 0.41; meta r = 0.30; 95% CI, 0.21 to 0.39).
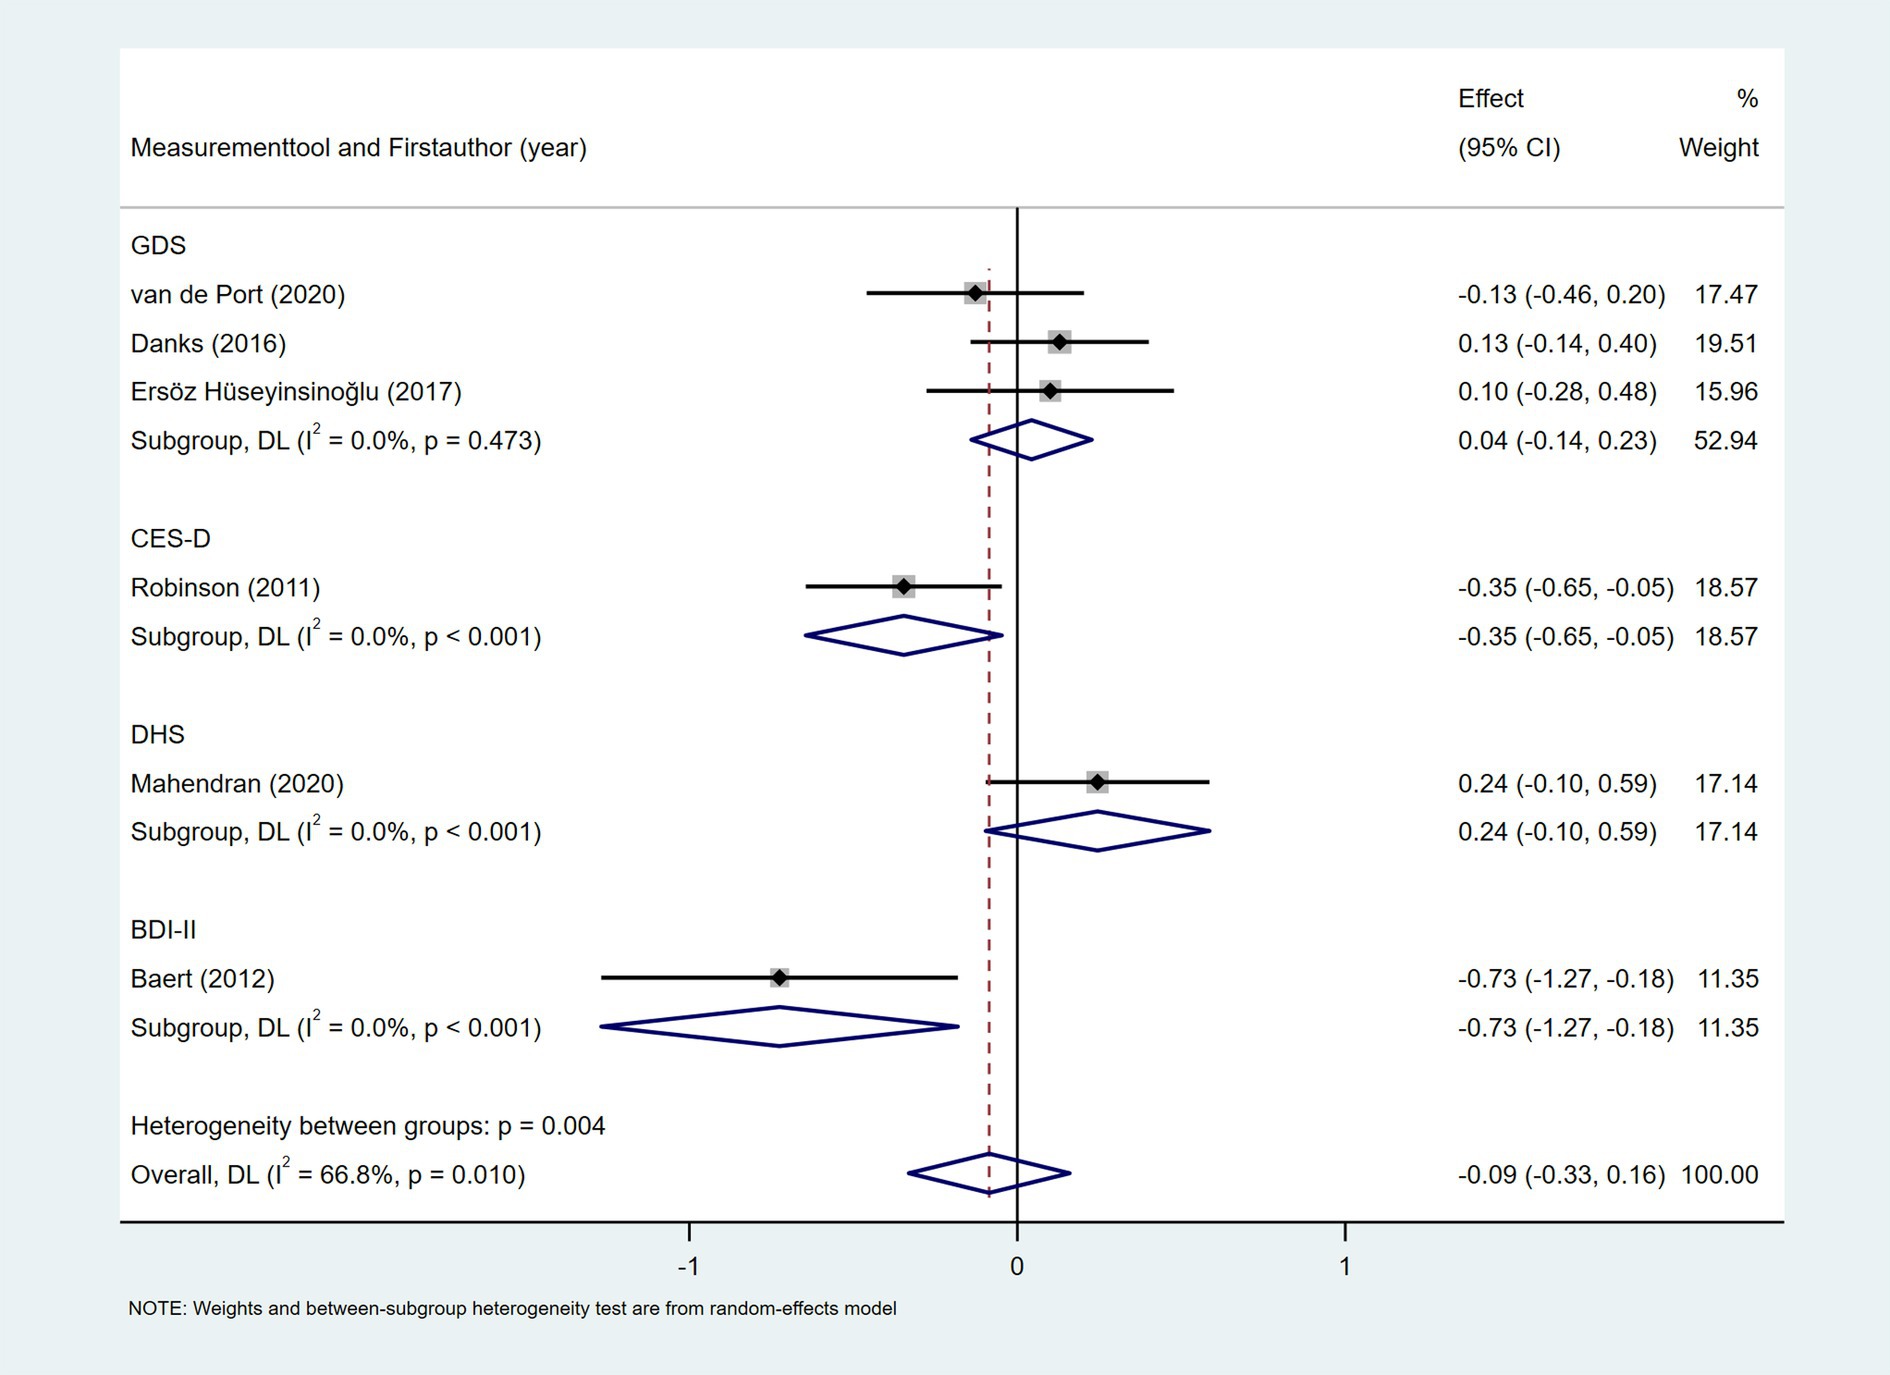
Figure 14. Forest plot for the relationship between depression and daily steps. GDS, Geriatric Depression Scale; CES-D, Center for Epidemiologic Studies Depression Scale; DHS, Depression-Happiness Scale; BDI-II, Beck Depression Inventory-II.
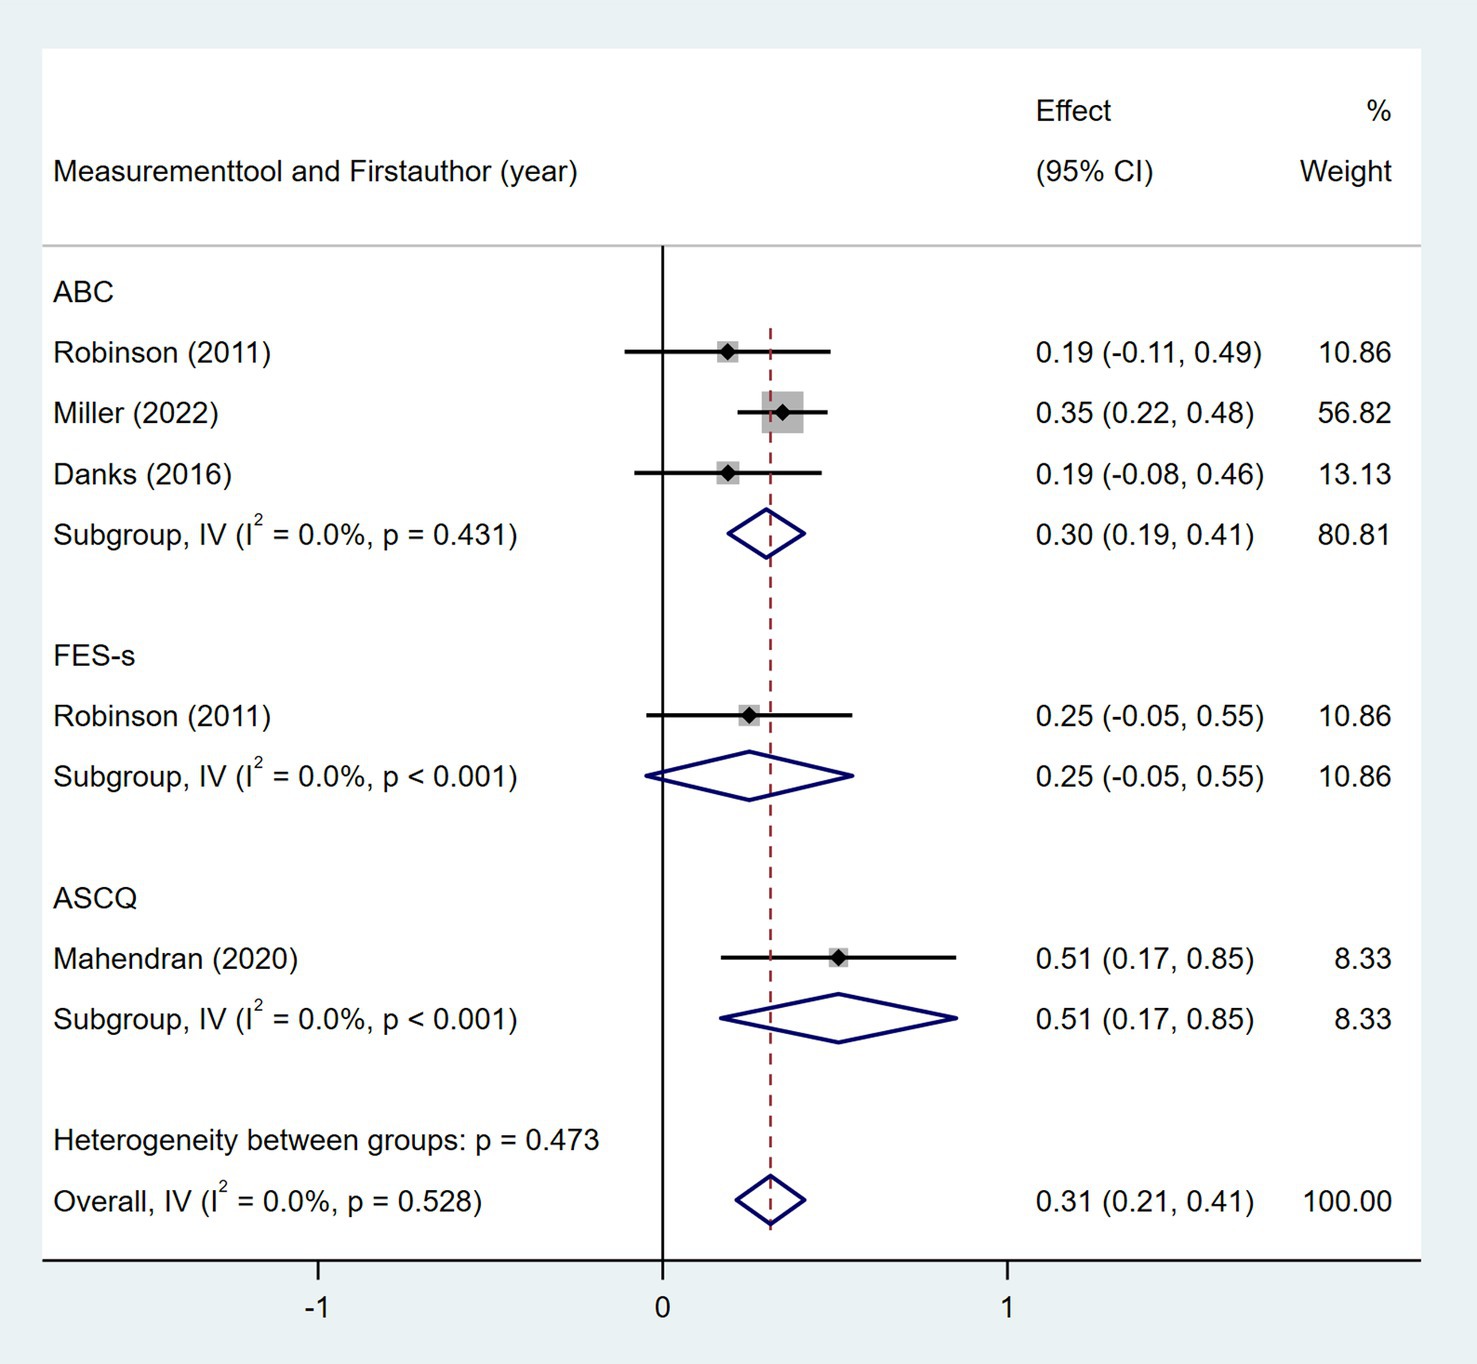
Figure 15. Forest plot for the relationship between self-efficacy and daily steps. ABC, Activities Specific Balance Confidence Scale; FES-s, Swedish version of the Falls Efficacy Scale; ASCQ, Ambulatory Self-Confidence Questionnaire.
3.5.3.1.5 Health status
Seven studies investigated the association between quality of life and daily step count. The quality of life was assessed using the Stroke-Specific Quality of Life Scale (SSQOL) (43, 51), Stroke Impact Scale (SIS) (37, 41, 46), and EuroQol Five-Dimensions (EQ5D) (33, 36). As shown in Figure 16, the meta-analysis revealed a moderate positive correlation between quality of life and daily step count (Fisher’s z = 0.5; 95% CI, 0.36 to 0.41; meta r = 0.64; 95% CI, 0.34 to 0.56). Cardiorespiratory fitness, measured based on peak oxygen consumption (VO2 peak) (26, 27, 46) or the physical working capacity at 75% of the predicted maximal heart rate/kilogram of body weight (PWC75% w kg−1) (49), was investigated in four studies. As shown in Figure 17, the meta-analysis revealed a moderate positive correlation between cardiorespiratory fitness and daily step count (Fisher’s z = 0.38; 95% CI, 0.09 to 0.68; meta r = 0.36; 95% CI, 0.09 to 0.59). However, substantial heterogeneity was observed (I2 = 64.8%, p = 0.036), although measurement tools did not significantly contribute to this variability (p = 0.705). Two studies investigated the relationship between cognitive status and daily step count (41, 48). As shown in Figure 18, the meta-analysis found no statistically significant association (Fisher’s z = 0.07; 95% CI, −0.2 to 0.34; meta r = 0.07; 95% CI, −0.2 to 0.33).
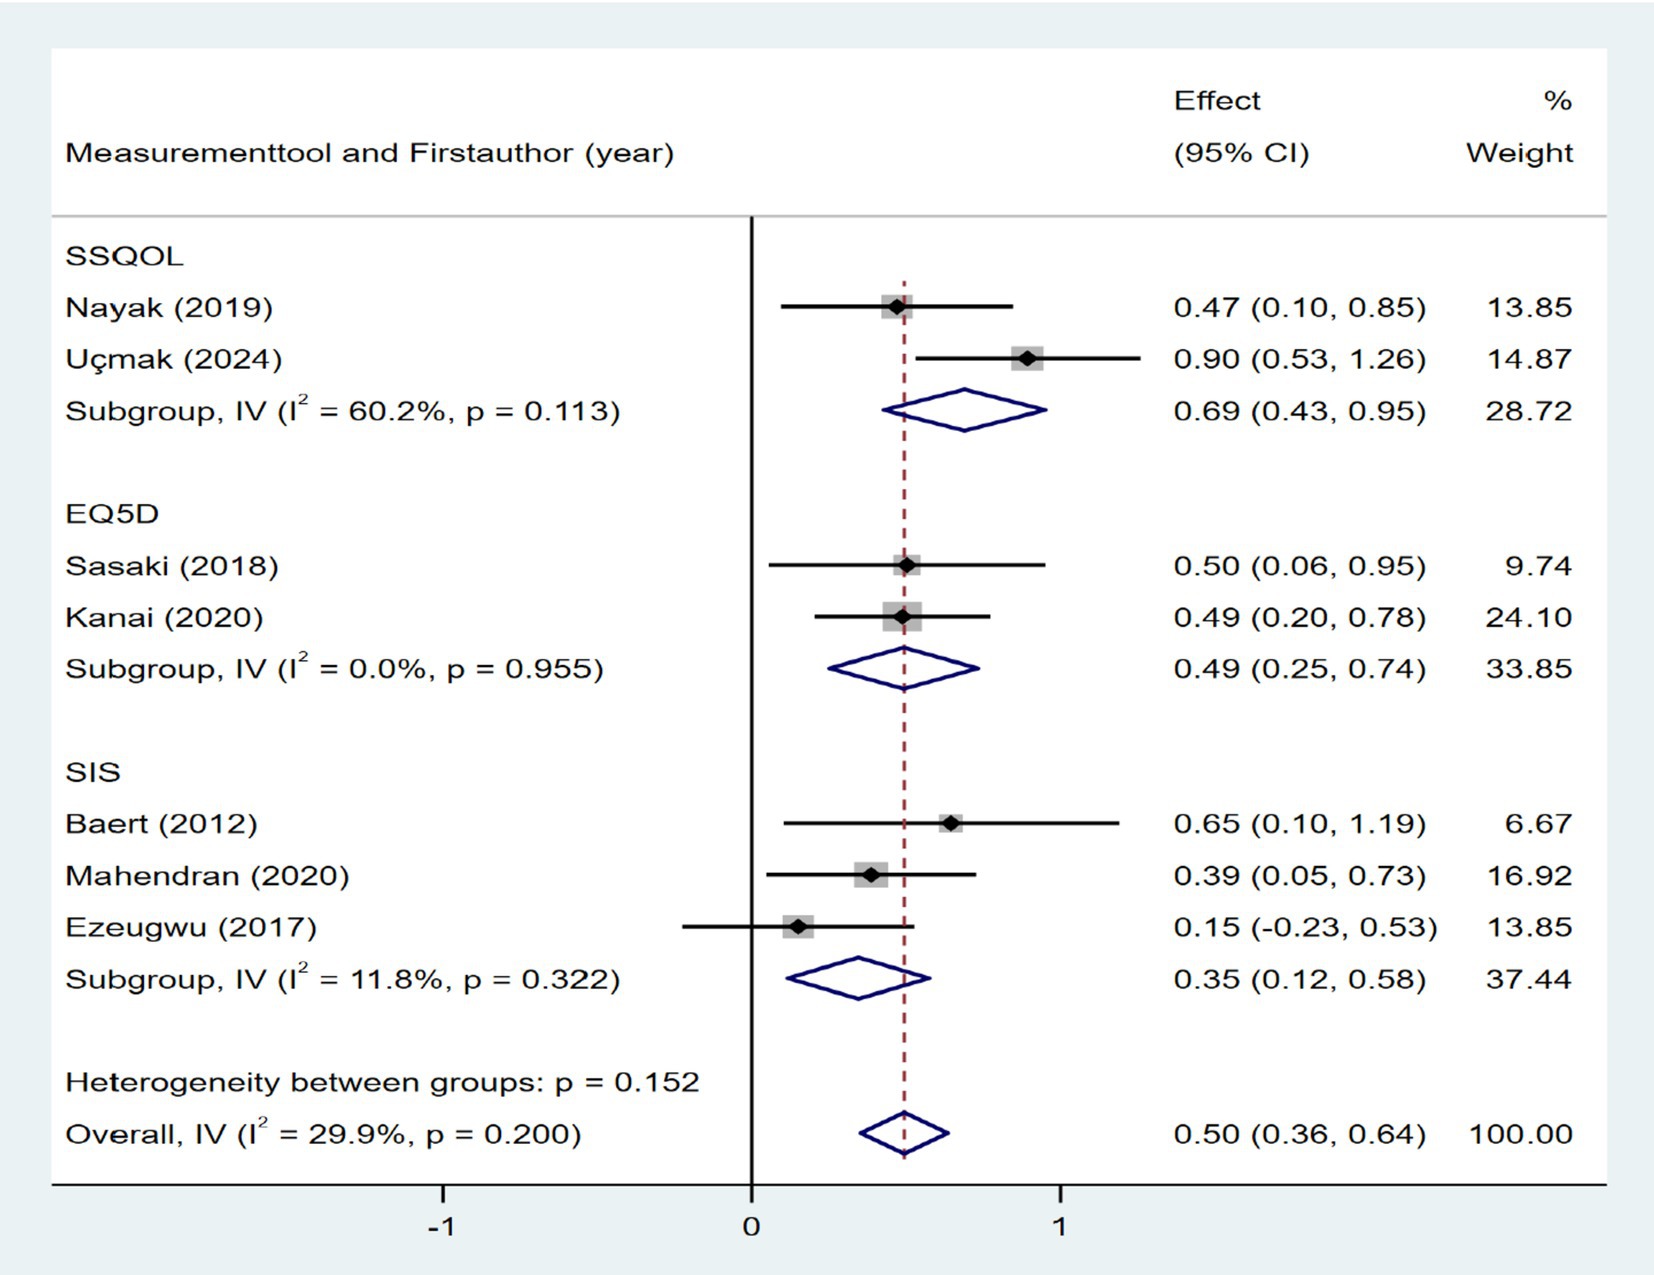
Figure 16. Forest plot for the relationship between quality of life and daily steps. SSQOL, Stroke-Specific Quality of Life Scale; EQ5D, EuroQol Five-Dimensions; SIS, Stroke Impact Scale.
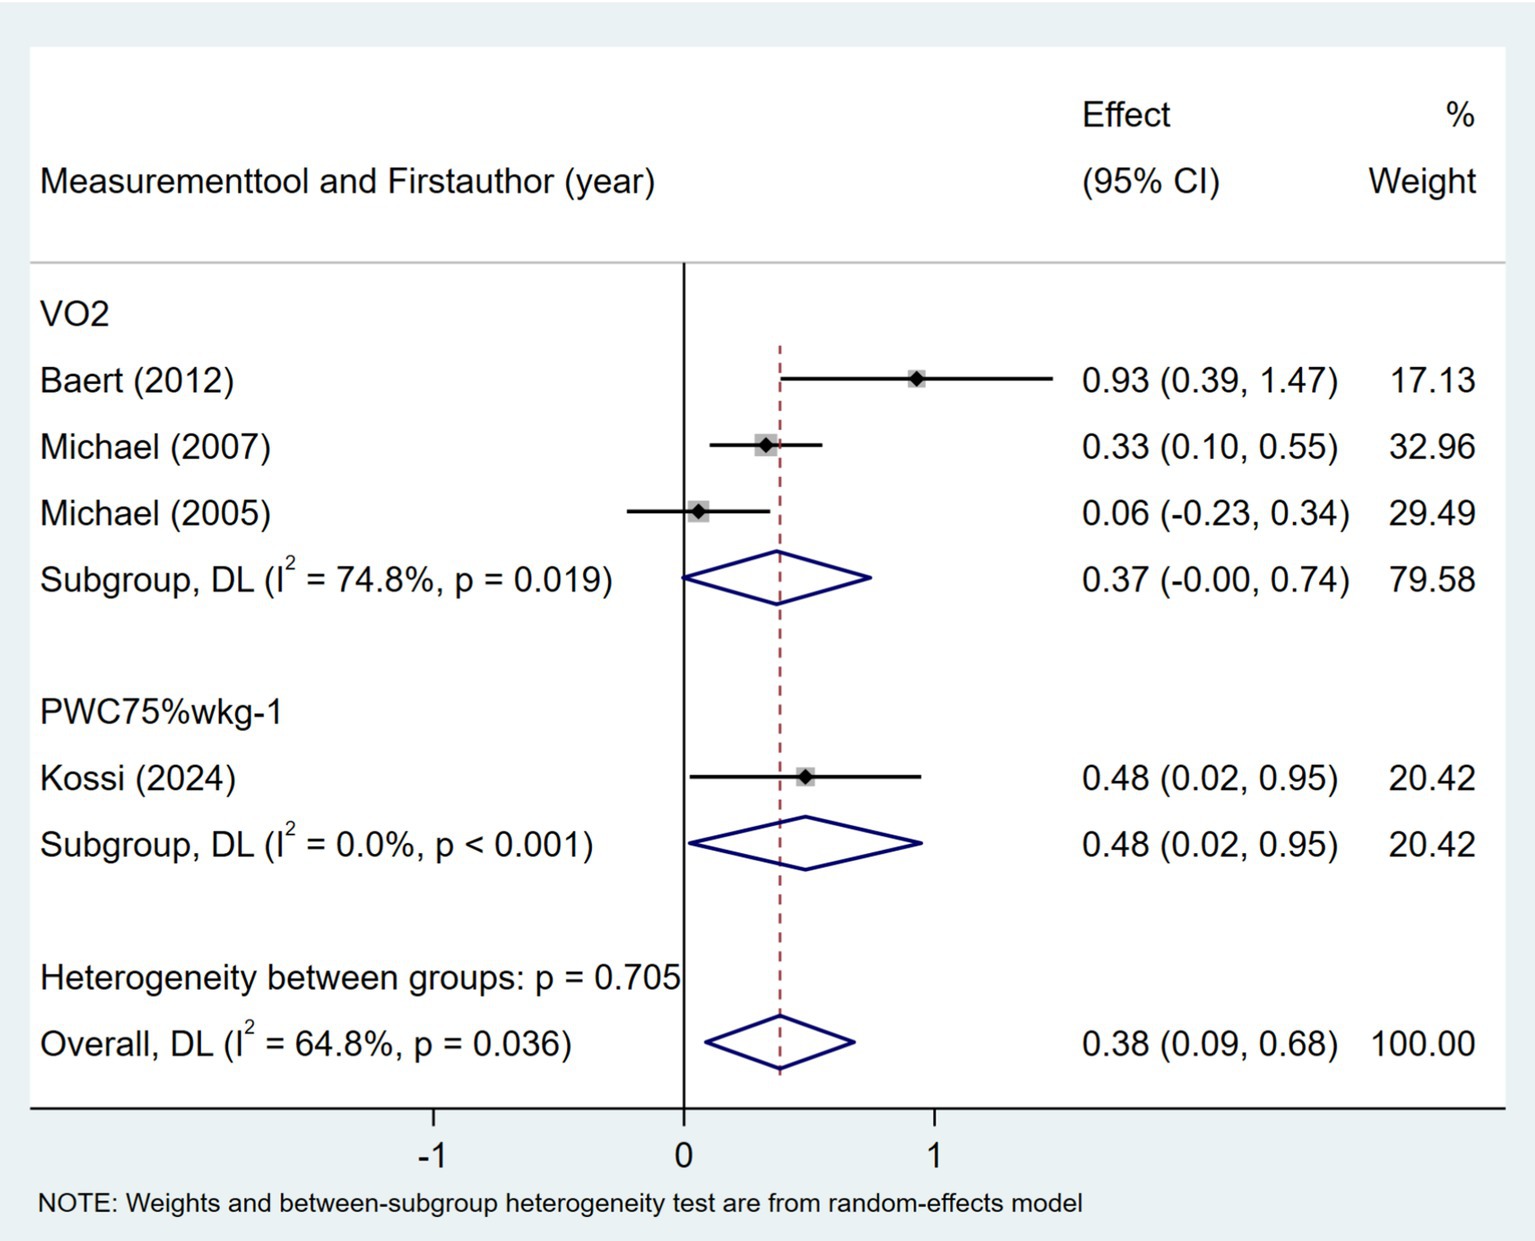
Figure 17. Forest plot for the relationship between cardiorespiratory fitness and daily steps.
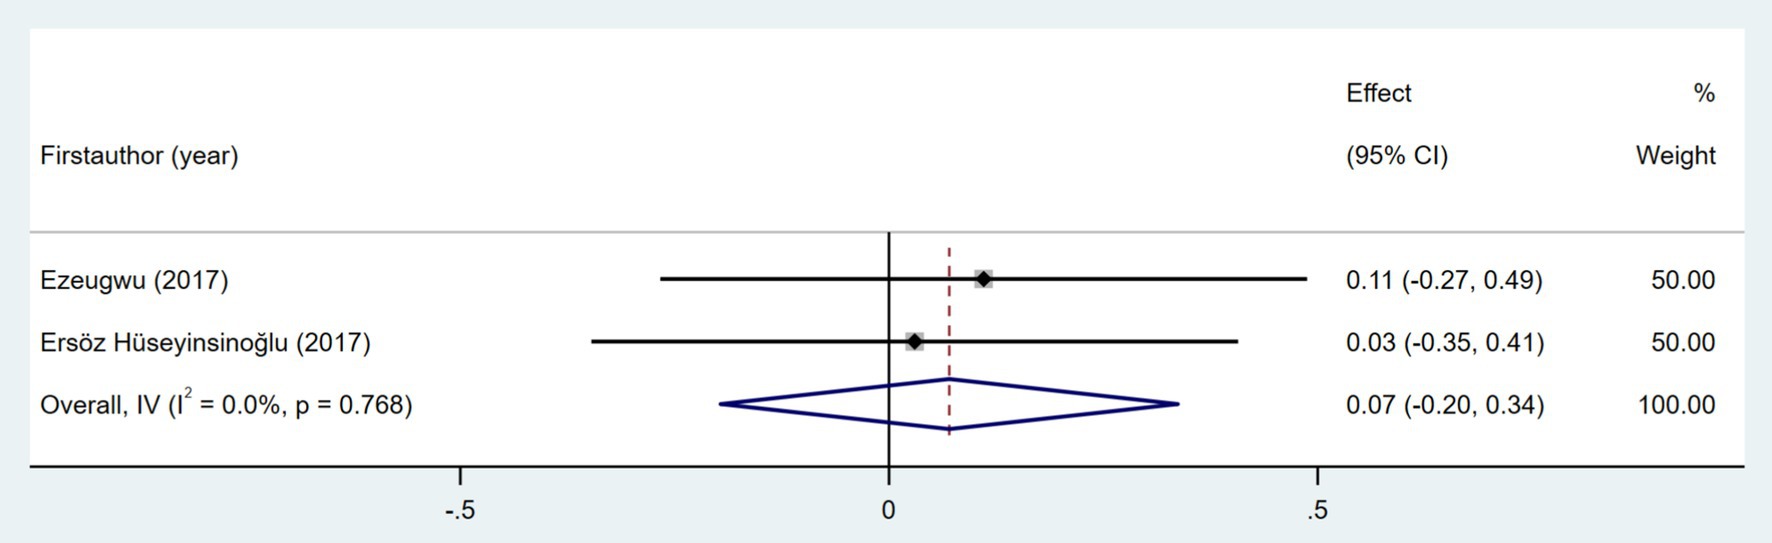
Figure 18. Forest plot for the relationship between cognitive status and daily steps.
3.5.3.2 Environmental context
Two studies examined the association between the area deprivation index (ADI) and daily step count (31, 32). As shown in Figure 19, the meta-analysis indicated a weak negative correlation (Fisher’s z = −0.15; 95% CI, −0.24 to −0.06; meta r = −0.15; 95% CI, −0.24 to −0.06).
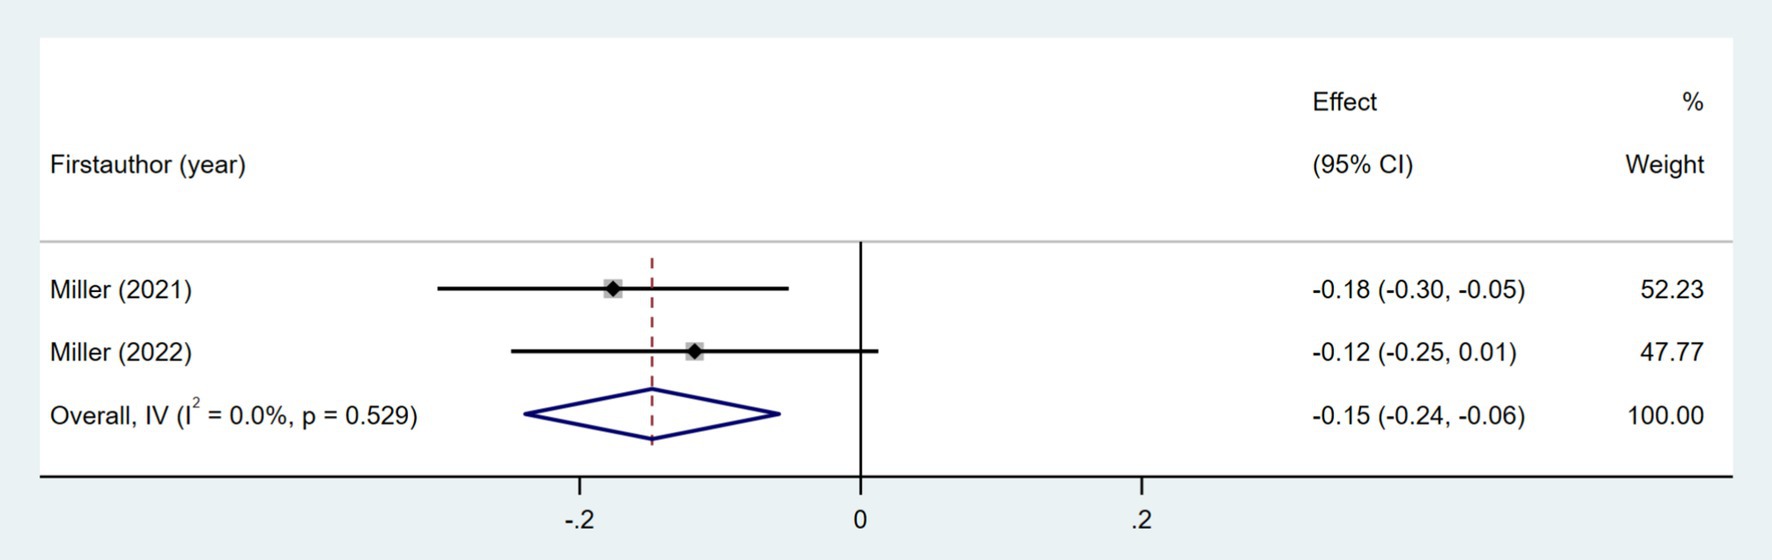
Figure 19. Forest plot for the relationship between area deprivation index and daily steps.
3.6 Sensitivity analysis
Sensitivity analyses were conducted after excluding the walking performance data from each of the 27 studies, and the pooled effect values did not change significantly, suggesting that the results were relatively stable (Supplementary Figure 1). In addition, sensitivity analysis was conducted for the 16 contextual factors, which showed that the results changed in terms of age, area deprivation index, cardiorespiratory fitness, and balance. These findings suggested that the results of the meta-analysis for these four contextual factors were not stable (Supplementary Figure 2). The pooled effect sizes for other contextual factors exhibited no significant changes, suggesting that the results were relatively stable (Supplementary Figure 2).
3.7 Publication bias
Egger’s test was employed to measure publication bias regarding walking performance (number of steps per day) and a funnel plot was drawn. The funnel plot showed that the distribution of study sites was asymmetrical (Supplementary Figure 3). Egger’s test (t = 3.85, p = 0.001) also suggested a significant publication bias. Of the 16 contextual factors extracted, only walking speed was included in ≥10 studies, which was tested in terms of publication bias. The funnel plot is shown in Supplementary Figure 4, and Egger’s test (t = 0.58 p = 0.580) also suggested no significant publication bias.
4 Discussion
In this systematic review and meta-analysis, we found that the metrics used to describe the walking performance in patients with stroke include the daily step count, time in stepping, walking distance and walking bouts. Among these, daily step count emerged as the most frequently reported outcome measure. The meta-analysis showed that the average number of steps per day was 4,269 among individuals with stroke. We also identified nine key contextual factors associated with daily step count in this population: age, gait speed, walking endurance, quality of life, area deprivation index, self-efficacy, cardiorespiratory fitness, balance, and RMA.
Walking performance is poor in people with stroke. Stratified by time since stroke, patients with stroke showed mean daily step counts of 3,217 steps within the first 3 months, 4,729 steps between 3 to 6 months, and 4,196 steps more than 6 months. All of these values were below the recommended threshold of 6,500 steps per day (52). Walking can offer significant health benefits. Daily steps of more than 2,200 were found to be associated with lower mortality (53). Previous studies have indicated that approximately 6,000 steps/day may be an initial target for reducing vascular events in patients with mild ischemic stroke (54). However, the present meta-analysis revealed that patients with stroke did not achieve this target. Therefore, we recommend targeted interventions to increase daily step counts in inactive patients with stroke, which may reduce recurrent vascular events.
Understanding contextual factors associated with the daily step counts of patients with stroke may help guide walking intervention. This is the first systematic review and meta-analysis conducted to synthesize the contextual factors associated with walking performance after stroke. In this study, the contextual factors associated with the walking performance of patients with stroke were categorized into three dimensions using the contextual factors classification model as a guide: user context, environmental context, and task context. We categorized user contexts into demographic information, disease-related information, movement capacity, psychological status, and health status. In terms of demographic information, age was significantly associated with daily steps taken by patients with stroke, with fewer daily steps taken by older patients. Similarly, studies in stroke cohorts have found a significant association between age and physical activity (14). However, the results of sensitivity analyses showed that the correlation between age and daily steps was not significant after excluding the study conducted by Miller et al. (32). This finding suggests that the result for age as a contextual factor for the walking performance of individuals with stroke was not robust and needs further validation. Disease-related information, including NIHSS score, time since stroke, and post-stroke fatigue, showed no statistically significant correlation with post-stroke daily steps in the meta-analysis. This may be attributed to small sample sizes in original studies and inter-study heterogeneity. Future large-sample and high-quality studies are needed to further clarify this association.
Regarding the movement capacity dimension, gait speed, walking endurance, balance, and RMA were significantly and positively correlated with daily step counts, and walking endurance exhibited the strongest correlation. Gait dysfunction is a common sequela following stroke (55). Patients present with gait asymmetry (55), reduced walking speed (56), and increased energy expenditure during walking (57), which contribute to diminished walking endurance and, ultimately, reduced daily activity levels. Impaired balance elevates fall risk and diminishes confidence in ambulatory activities, thereby further reducing daily step count. The RMA consists of 13 items that measure the functional mobility of patients with stroke. The RMA was significantly correlated with daily steps, likely attributed to its comprehensive assessment, which included stair climbing, walking outside, and walking over uneven surfaces. These are widely believed to be important aspects of usual walking performance (58). Thus, assessing movement capacity holds significant value for predicting future daily step counts in stroke patients, a conclusion supported by several recent predictive studies (59–61).
However, possessing excellent movement capacity does not necessarily lead to superior walking performance. Previous study revealed that walking ability contributes to merely 35.9% of the variability in daily step count (28). In the psychological status dimension, we found that self-efficacy was significantly associated with daily steps. Self-efficacy refers to an individual’s confidence and subjective judgment regarding their ability to perform position transitions and walking activities across diverse environmental conditions (28, 37). Patients with stroke who have higher self-efficacy exhibit greater daily step counts. It is recommended that healthcare professionals effectively help enhance the self-efficacy of individuals with stroke in walking activities by breaking down walking training goals to accumulate incremental successes, integrating vicarious demonstrations of rehabilitation cases of similar situations, offering professional and specific rehabilitation feedback, and supporting the regulation of emotional and physiological states.
In addition, the results of the present study showed that the correlation between depression and daily steps was not significant, and heterogeneity was high. Subgroup analyses revealed that the different scales measuring depressive status were the source of heterogeneity, suggesting that the relationship between depression and step counts needs further exploration on the basis of standardized assessment methods.
In the health status dimension, cardiorespiratory fitness and quality of life both exhibited significant correlations with daily step count. Cardiorespiratory fitness is one of the most important determinants of cardiovascular disease, and it may significantly decrease after stroke. Patients with stroke who have impaired cardiorespiratory fitness are more prone to fatigue, which leads to reduced walking endurance and fewer daily steps (62). The quality of life serves as an indicator of patients’ physical and mental well-being. Our results indicated that there exists a moderate positive correlation between quality of life and daily step count. Therefore, early identification of patients with stroke who have impaired cardiorespiratory fitness and reduced quality of life may facilitate the recognition of individuals with poor walking performance.
In the environmental context, factors associated with walking performance in patients with stroke included weather conditions and community environmental. However, due to heterogeneity across studies, only area deprivation index (ADI) within community environmental were included in the meta-analysis. The ADI is a composite index of neighborhood disadvantage that includes various indicators of housing quality and crowding, poverty, education, and employment (32). Our results showed a significant relationship between ADI and real-world walking activity, where higher ADI was associated with fewer real-world walking steps. Therefore, we recommend that policy and guideline makers establish localized ADI assessment frameworks, prioritize patients with stroke in high-deprivation areas, and mitigate the socioeconomic disparities among patients with stroke across different regions through targeted measures, including enhancing the accessibility of primary healthcare resources and improving housing and community environments. Moreover, sensitivity analyses suggested that the results of ADI were unstable, and further studies are needed in this regard. Additionally, while sufficient studies are lacking to conduct a meta-analysis of other environmental factors potentially associated with walking performance in patients with stroke, their impact remains non-negligible.
This study summarized task context as movement behaviors other than walking activities. People have a limited amount of time in the day; thus, changes in walking performance are accompanied by changes in the timing of other activities. So far, some studies have explored the associations and variations between 24-h movement behaviors (5, 63), but the evidence from these studies cannot be quantitatively synthesized. More studies in this area should be conducted to gain a deeper insight into task contexts related to walking performance after stroke.
However, this study may be affected by the following limitations: (1) We only extracted walking performance data from the literature that included both walking performance and associated factors. This strategy could compromise the completeness of qualitative and quantitative assessment of the current state of walking performance. Additionally, the meta-analyzed results for daily step counts exhibited high heterogeneity. Despite efforts to identify potential sources through subgroup analyses and meta-regression, no definitive explanatory factors were found. As a result, the generalizability of these findings warrants cautious interpretation. (2) Only observational studies were included in our meta-analysis; therefore, the factors reported by interventional studies may have been ignored. (3) Due to challenges in combining different effect sizes across studies, correlation coefficients were selected as effect sizes to pool data, increasing the risk of reverse causation. (4) Our study did not include grey literature, potentially resulting in incomplete evidence synthesis and increasing the risk of publication bias.
5 Conclusion
This systematic review and meta-analysis summarized the assessment indicators and contextual factors for walking performance among people had a stroke. These findings may guide the design of context-aware interventions, but the causal relationship between contextual factors and step counts needs further studies.
Author contributions
YZ: Writing – original draft, Software, Funding acquisition, Conceptualization, Methodology, Writing – review & editing. LX: Conceptualization, Resources, Funding acquisition, Writing – review & editing, Project administration, Supervision. XP: Project administration, Supervision, Writing – review & editing, Conceptualization. LC: Writing – review & editing, Investigation. WZ: Investigation, Writing – review & editing. JXL: Writing – review & editing, Investigation.
Funding
The author(s) declare that financial support was received for the research and/or publication of this article. This work was supported by the Suzhou Basic Research Pilot Project (No. SSD2024104) and the First Hospital of Soochow University Nursing Hospital Level Project (No. HLYJ-Z-202505).
Conflict of interest
The authors declare that the research was conducted in the absence of any commercial or financial relationships that could be construed as a potential conflict of interest.
Generative AI statement
The authors declare that no Gen AI was used in the creation of this manuscript.
Any alternative text (alt text) provided alongside figures in this article has been generated by Frontiers with the support of artificial intelligence and reasonable efforts have been made to ensure accuracy, including review by the authors wherever possible. If you identify any issues, please contact us.
Publisher’s note
All claims expressed in this article are solely those of the authors and do not necessarily represent those of their affiliated organizations, or those of the publisher, the editors and the reviewers. Any product that may be evaluated in this article, or claim that may be made by its manufacturer, is not guaranteed or endorsed by the publisher.
Supplementary material
The Supplementary material for this article can be found online at: https://www.frontiersin.org/articles/10.3389/fneur.2025.1635024/full#supplementary-material
References
1. GBD 2019 Stroke Collaborators. Global, regional, and national burden of stroke and its risk factors, 1990–2019: a systematic analysis for the Global Burden of Disease Study 2019. Lancet Neurol. (2021) 20:795–820. doi: 10.1016/S1474-4422(21)00252-0
2. Caspersen, CJ, Powell, KE, and Christenson, GM. Physical activity, exercise, and physical fitness: definitions and distinctions for health-related research. Public Health Rep. (1985) 100:126–31.
3. English, C, Janssen, H, Crowfoot, G, Bourne, J, Callister, R, Dunn, A, et al. Frequent, short bouts of light-intensity exercises while standing decreases systolic blood pressure: breaking up sitting time after stroke (bust-stroke) trial. Int J Stroke. (2018) 13:932–40. doi: 10.1177/1747493018798535
4. Buvarp, D, Viktorisson, A, Axelsson, F, Lehto, E, Lindgren, L, Lundström, E, et al. Physical activity trajectories and functional recovery after acute stroke among adults in Sweden. JAMA Netw Open. (2023) 6:e2310919. doi: 10.1001/jamanetworkopen.2023.10919
5. Zhang, Y, Yao, L, Chen, L, Zhong, W, Li, J, Xu, L, et al. Longitudinal relationship between 24-hour movement behavior patterns and physical function and quality of life after stroke: a latent transition analysis. Int J Behav Nutr Phys Act. (2024) 21:141. doi: 10.1186/s12966-024-01689-1
6. Apriliyasari, RW, Budi, IS, Tan, MP, and Tsai, P-S. Physical activity and depression in Indonesian adults with stroke: a nationwide survey. J Nurs Scholarsh. (2023) 55:356–64. doi: 10.1111/jnu.12823
7. Paprocka-Borowicz, M, Wiatr, M, Ciałowicz, M, Borowicz, W, Kaczmarek, A, Marques, A, et al. Influence of physical activity and socio-economic status on depression and anxiety symptoms in patients after stroke. Int J Environ Res Public Health. (2021) 18:8058. doi: 10.3390/ijerph18158058
8. Stucki, G, Cieza, A, Ewert, T, Kostanjsek, N, Chatterji, S, and Ustün, TB. Application of the international classification of functioning, disability and health (Icf) in clinical practice. Disabil Rehabil. (2002) 24:281–2. doi: 10.1080/09638280110105222
9. Fini, NA, Holland, AE, Keating, J, Simek, J, and Bernhardt, J. How physically active are people following stroke? Systematic review and quantitative synthesis. Phys Ther. (2017) 97:707–17. doi: 10.1093/ptj/pzx038
10. Fini, NA, Bernhardt, J, Churilov, L, Clark, R, and Holland, AE. Adherence to physical activity and cardiovascular recommendations during the 2 years after stroke rehabilitation discharge. Ann Phys Rehabil Med. (2021) 64:101455. doi: 10.1016/j.rehab.2020.03.018
11. Nahum-Shani, I, Smith, SN, Spring, BJ, Collins, LM, Witkiewitz, K, Tewari, A, et al. Just-in-time adaptive interventions (Jitais) in mobile health: key components and design principles for ongoing health behavior support. Ann Behav Med. (2018) 52:446–62. doi: 10.1007/s12160-016-9830-8
12. Dey, AK. Providing architectural support for building context-aware applications In: PhD Thesis. Atlanta, GA: Georgia Institute of Technology (2000)
13. Thomas Craig, KJ, Morgan, LC, Chen, C-H, Michie, S, Fusco, N, Snowdon, JL, et al. Systematic review of context-aware digital behavior change interventions to improve health. Transl Behav Med. (2021) 11:1037–48. doi: 10.1093/tbm/ibaa099
14. Thilarajah, S, Mentiplay, BF, Bower, KJ, Tan, D, Pua, YH, Williams, G, et al. Factors associated with post-stroke physical activity: a systematic review and meta-analysis. Arch Phys Med Rehabil. (2018) 99:1876–89. doi: 10.1016/j.apmr.2017.09.117
15. Chen, Y. Activity-based context awareness model and context awareness interaction design In: Doctoral dissertation. Dalian: Dalian Maritime University (2013)
16. Zeng, X, Liu, H, Chen, X, and Leng, W. Meta-analysis series four: quality assessment tools for observational studies. Chin J Evid Based Cardiovasc Med. (2012) 4:297–9.
17. Luo, D, Wan, X, Liu, J, and Tong, T. Optimally estimating the sample mean from the sample size, median, mid-range, and/or mid-quartile range. Stat Methods Med Res. (2018) 27:1785–805. doi: 10.1177/0962280216669183
18. Wan, X, Wang, W, Liu, J, and Tong, T. Estimating the sample mean and standard deviation from the sample size, median, range and/or interquartile range. BMC Med Res Methodol. (2014) 14:135. doi: 10.1186/1471-2288-14-135
19. Peterson, RA, and Brown, SP. On the use of beta coefficients in meta-analysis. J Appl Psychol. (2005) 90:175–81. doi: 10.1037/0021-9010.90.1.175
20. Field, AP. Meta-analysis of correlation coefficients: a Monte Carlo comparison of fixed- and random-effects methods. Psychol Methods. (2001) 6:161–80. doi: 10.1037/1082-989x.6.2.161
22. Zalewski, KR, and Dvorak, L. Barriers to physical activity between adults with stroke and their care partners. Top Stroke Rehabil. (2011) 18:666–75. doi: 10.1310/tsr18s01-666
23. Ribeiro, JAM, Oliveira, SG, Thommazo-Luporini, LD, Monteiro, CI, Phillips, SA, Catai, AM, et al. Energy cost during the 6-minute walk test and its relationship to real-world walking after stroke: a correlational, cross-sectional pilot study. Phys Ther. (2019) 99:1656–66. doi: 10.1093/ptj/pzz122
24. Mudge, S, and Stott, NS. Timed walking tests correlate with daily step activity in persons with stroke. Arch Phys Med Rehabil. (2009) 90:296–301. doi: 10.1016/j.apmr.2008.07.025
25. French, MA, Moore, MF, Pohlig, R, and Reisman, D. Self-efficacy mediates the relationship between balance/walking performance, activity, and participation after stroke. Top Stroke Rehabil. (2016) 23:77–83. doi: 10.1080/10749357.2015.1110306
26. Michael, KM, Allen, JK, and Macko, RF. Reduced ambulatory activity after stroke: the role of balance, gait, and cardiovascular fitness. Arch Phys Med Rehabil. (2005) 86:1552–6. doi: 10.1016/j.apmr.2004.12.026
27. Michael, K, and Macko, RF. Ambulatory activity intensity profiles, fitness, and fatigue in chronic stroke. Top Stroke Rehabil. (2007) 14:5–12. doi: 10.1310/tsr1402-5
28. Danks, KA, Pohlig, RT, Roos, M, Wright, TR, and Reisman, DS. Relationship between walking capacity, biopsychosocial factors, self-efficacy, and walking activity in persons poststroke. J Neurol Phys Ther. (2016) 40:232–8. doi: 10.1097/NPT.0000000000000143
29. Kanai, M, Izawa, KP, Kubo, H, Nozoe, M, and Shimada, S. Objectively measured physical activity was not associated with neighborhood walkability attributes in community-dwelling patients with stroke. Sci Rep. (2022) 12:3475. doi: 10.1038/s41598-022-07467-y
30. Katzan, I, Schuster, A, and Kinzy, T. Physical activity monitoring using a Fitbit device in ischemic stroke patients: prospective cohort feasibility study. JMIR Mhealth Uhealth. (2021) 9:e14494. doi: 10.2196/14494
31. Miller, A, Pohlig, RT, and Reisman, DS. Relationships among environmental variables, physical capacity, balance self-efficacy, and real-world walking activity post-stroke. Neurorehabil Neural Repair. (2022) 36:535–44. doi: 10.1177/15459683221115409
32. Miller, A, Pohlig, RT, and Reisman, DS. Social and physical environmental factors in daily stepping activity in those with chronic stroke. Top Stroke Rehabil. (2021) 28:161–9. doi: 10.1080/10749357.2020.1803571
33. Sasaki, S, Kanai, M, Shinoda, T, Morita, H, Shimada, S, and Izawa, KP. Relation between health utility score and physical activity in community-dwelling ambulatory patients with stroke: a preliminary cross-sectional study. Top Stroke Rehabil. (2018) 25:475–9. doi: 10.1080/10749357.2018.1492775
34. Andreasen, SC, Wright, TR, Crenshaw, JR, Reisman, DS, and Knarr, BA. Relationships of linear and non-linear measurements of post-stroke walking activity and their relationship to weather. Front Sports Act Living. (2020) 2:551542. doi: 10.3389/fspor.2020.551542
35. Kanai, M, Izawa, KP, Kubo, H, Nozoe, M, Mase, K, Koohsari, MJ, et al. Association of perceived built environment attributes with objectively measured physical activity in community-dwelling ambulatory patients with stroke. Int J Environ Res Public Health. (2019) 16:3908. doi: 10.3390/ijerph16203908
36. Kanai, M, Izawa, KP, Kubo, H, Nozoe, M, Mase, K, and Shimada, S. Association of health utility score with physical activity outcomes in stroke survivors. Int J Environ Res Public Health. (2020) 18:251. doi: 10.3390/ijerph18010251
37. Mahendran, N, Kuys, SS, and Brauer, SG. Which impairments, activity limitations and personal factors at hospital discharge predict walking activity across the first 6 months poststroke? Disabil Rehabil. (2020) 42:763–9. doi: 10.1080/09638288.2018.1508513
38. Paul, L, Brewster, S, Wyke, S, Gill, JMR, Alexander, G, Dybus, A, et al. Physical activity profiles and sedentary behaviour in people following stroke: a cross-sectional study. Disabil Rehabil. (2016) 38:362–7. doi: 10.3109/09638288.2015.1041615
39. Kunkel, D, Fitton, C, Burnett, M, and Ashburn, A. Physical inactivity post-stroke: a 3-year longitudinal study. Disabil Rehabil. (2015) 37:304–10. doi: 10.3109/09638288.2014.918190
40. Luzum, G, Gunnes, M, Lydersen, S, Saltvedt, I, Tan, X, Thingstad, P, et al. Physical activity behavior and its association with global cognitive function three months after stroke: the nor-coast study. Phys Ther. (2023) 103:pzad092. doi: 10.1093/ptj/pzad092
41. Ezeugwu, VE, and Manns, PJ. Sleep duration, sedentary behavior, physical activity, and quality of life after inpatient stroke rehabilitation. J Stroke Cerebrovasc Dis. (2017) 26:2004–12. doi: 10.1016/j.jstrokecerebrovasdis.2017.06.009
42. Sekiguchi, Y, Honda, K, and Izumi, SI. Effect of walking adaptability on an uneven surface by a stepping pattern on walking activity after stroke. Front Hum Neurosci. (2022) 15:762223. doi: 10.3389/fnhum.2021.762223
43. Nayak, P, Kumaran, SD, Babu, AS, Maiya, AG, and Solomon, JM. Levels of physical activity and quality of life among community-dwelling adults with stroke in a developing country. Eur J Phys. (2019) 23:165–70. doi: 10.1080/21679169.2019.1663927
44. van de Port, I, Punt, M, and Meijer, JW. Walking activity and its determinants in free-living ambulatory people in a chronic phase after stroke: a cross-sectional study. Disabil Rehabil. (2020) 42:636–41. doi: 10.1080/09638288.2018.1504327
45. Levin, C, Bachar-Kirshenboim, Y, and Rand, D. Daily steps, walking tests, and functioning in chronic stroke; comparing independent walkers to device-users. Physiother Res Int. (2024) 29:e2035. doi: 10.1002/pri.2035
46. Baert, I, Feys, H, Daly, D, Troosters, T, and Vanlandewijck, Y. Are patients 1 year post-stroke active enough to improve their physical health? Disabil Rehabil. (2012) 34:574–80. doi: 10.3109/09638288.2011.613513
47. Robinson, CA, Shumway-Cook, A, Ciol, MA, and Kartin, D. Participation in community walking following stroke: subjective versus objective measures and the impact of personal factors. Phys Ther. (2011) 91:1865–76. doi: 10.2522/ptj.20100216
48. Ersöz Hüseyinsinoğlu, B, Kuran Aslan, G, Tarakci, D, Razak Özdinçler, A, Küçükoğlu, H, and Baybaş, S. Physical activity level of ambulatory stroke patients: is it related to neuropsychological factors? Noro Psikiyatr Ars. (2017) 54:155–61. doi: 10.5152/npa.2016.12760
49. Kossi, O, Bonnechère, B, Agbetou, M, Somasse, R, Hokpo, A, Houehanou, YCN, et al. Relationships between cardiorespiratory fitness, physical activity practices, and functional outcomes one-year post-stroke in northern Benin: a case–control study. Top Stroke Rehabil. (2024) 31:104–15. doi: 10.1080/10749357.2023.2207286
50. Fini, NA, Bernhardt, J, Churilov, L, Clark, R, and Holland, AE. A 2-year longitudinal study of physical activity and cardiovascular risk in survivors of stroke. Phys Ther. (2021) 101:pzaa205. doi: 10.1093/ptj/pzaa205
51. Uçmak, GS, and Kilinç, M. The effects of kinesiophobia, fatigue, and quality of life on physical activity in patients with stroke. Top Stroke Rehabil. (2024) 31:788–94. doi: 10.1080/10749357.2024.2333159
52. Tudor-Locke, C, Craig, CL, Aoyagi, Y, Bell, RC, Croteau, KA, De Bourdeaudhuij, I, et al. How many steps/day are enough? For older adults and special populations. Int J Behav Nutr Phys Act. (2011) 8:80. doi: 10.1186/1479-5868-8-80
53. Ahmadi, MN, Rezende, LFM, Ferrari, G, Del Pozo, CB, Lee, IM, and Stamatakis, E. Do the associations of daily steps with mortality and incident cardiovascular disease differ by sedentary time levels? A device-based cohort study. Br J Sports Med. (2024) 58:261–8. doi: 10.1136/bjsports-2023-107221
54. Kono, Y, Kawajiri, H, Kamisaka, K, Kamiya, K, Akao, K, Asai, C, et al. Predictive impact of daily physical activity on new vascular events in patients with mild ischemic stroke. Int J Stroke. (2015) 10:219–23. doi: 10.1111/ijs.12392
55. Olney, SJ, and Richards, C. Hemiparetic gait following stroke. Part I: characteristics. Gait Posture. (1996) 4:136–48. doi: 10.1016/0966-6362(96)01063-6
56. Hornby, TG, Reisman, DS, Ward, IG, Scheets, PL, Miller, A, Haddad, D, et al. Clinical practice guideline to improve locomotor function following chronic stroke, incomplete spinal cord injury, and brain injury. J Neurol Phys Ther. (2020) 44:49–100. doi: 10.1097/NPT.0000000000000303
57. Gordon, NF, Gulanick, M, Costa, F, Fletcher, G, Franklin, BA, Roth, EJ, et al. Physical activity and exercise recommendations for stroke survivors: an American Heart Association scientific statement from the council on clinical cardiology, subcommittee on exercise, cardiac rehabilitation, and prevention; the council on cardiovascular nursing; the council on nutrition, physical activity, and metabolism; and the stroke council. Circulation. (2004) 109:2031–41. doi: 10.1161/01.CIR.0000126280.65777.A4
58. Patla, AE, and Shumway-Cook, A. Dimensions of mobility: defining the complexity and difficulty associated with community mobility. J Aging Phys Act. (1999) 7:7–19. doi: 10.1123/japa.7.1.7
59. Fulk, GD, He, Y, Boyne, P, and Dunning, K. Predicting home and community walking activity poststroke. Stroke. (2017) 48:406–11. doi: 10.1161/STROKEAHA.116.015309
60. Miller, AE, Russell, E, Reisman, DS, Kim, HE, and Dinh, V. A machine learning approach to identifying important features for achieving step thresholds in individuals with chronic stroke. PLoS One. (2022) 17:e0270105. doi: 10.1371/journal.pone.0270105
61. Handlery, R, Regan, EW, Stewart, JC, Pellegrini, C, Monroe, C, Hainline, G, et al. Predictors of daily steps at 1-year poststroke: a secondary analysis of a randomized controlled trial. Stroke. (2021) 52:1768–77. doi: 10.1161/STROKEAHA.121.034249
62. Larsson, P, Edvardsen, E, Gay, CL, Ursin, M, Mack, U, and Lerdal, A. Cardiorespiratory fitness, physical activity, and fatigue three months after first-ever ischemic stroke. Top Stroke Rehabil. (2024) 31:817–27. doi: 10.1080/10749357.2024.2333191
Keywords: stroke, walking performance, contextual factor, meta-analysis, systematic review
Citation: Zhang Y, Xu L, Pan X, Chen L, Zhong W and Li J (2025) Contextual factors associated with walking performance after stroke: a systematic review and meta-analysis. Front. Neurol. 16:1635024. doi: 10.3389/fneur.2025.1635024
Edited by:
Anthony Pak Hin Kong, The University of Hong Kong, Hong Kong SAR, ChinaReviewed by:
Hipólito Nzwalo, University of Algarve, PortugalKendra Cherry-Allen, Western University of Health Sciences, United States
Copyright © 2025 Zhang, Xu, Pan, Chen, Zhong and Li. This is an open-access article distributed under the terms of the Creative Commons Attribution License (CC BY). The use, distribution or reproduction in other forums is permitted, provided the original author(s) and the copyright owner(s) are credited and that the original publication in this journal is cited, in accordance with accepted academic practice. No use, distribution or reproduction is permitted which does not comply with these terms.
*Correspondence: Lan Xu, eHVsYW4xMTA4QHNpbmEuY29t; Xi Pan, cGFueGk5MDUwNzBAMTYzLmNvbQ==