Abstract
Objective:
This study aimed to evaluate the prognostic value of Alberta Stroke Program Early CT Score (ASPECTS)-based net water uptake (NWU) in predicting futile recanalization (FR) and develop a nomogram integrating NWU and clinical parameters for personalized risk stratification in early or late time windows in acute ischemic stroke (AIS) at admission.
Methods:
This retrospective study investigated AIS patients with large vessel occlusion who achieved successful recanalization from January 2022 to November 2024. Baseline ASPECTS-NWU was automatically quantified from the admission CT. The primary outcome was FR, defined as a modified Rankin Scale (mRS) score of 3–6 at 90 days following successful recanalization (modified Thrombolysis in Cerebral Infarction score, 2b/3). Intergroup comparisons of clinical and neuroimaging parameters were performed using the Mann–Whitney U test for continuous variables and the χ2 test for categorical measures. Bivariate correlations between NWU values and other covariates were assessed using Spearman’s rho coefficients. Multivariable logistic regression identified independent predictors of FR, and a subsequent nomogram was constructed. The logistic regression model was tested using the 5-fold cross-validation. The predictive accuracy of different models was evaluated using the receiver operating characteristic curve and DeLong’s test.
Results:
A total of 168 patients were included, and FR occurred in 95 patients. Patients with FR were older, had higher National Institutes of Health Stroke Scale scores, an increased number of passes, lower ASPECTS, elevated NWU, larger cerebral blood flow (CBF) < 30% volume, and increased hypoperfusion intensity ratio (HIR), regardless of the time window. In the late time window, multivariable analysis identified baseline NWU and ASPECTS as independent predictors of FR. A nomogram integrating these two factors demonstrated strong predictive power, with an area under the curve of 0.880.
Conclusion:
Baseline NWU and ASPECTS were independent predictors of AIS patients with FR in the late time window. The developed nomogram integrating NWU with ASPECTS provides a clinically actionable tool for pre-endovascular therapy risk stratification.
Introduction
Endovascular therapy (EVT) has become the first-line treatment for acute ischemic stroke (AIS) caused by large vessel occlusion (LVO), with timely recanalization significantly improving patient outcome (1). A recent study indicated that the benefit of successful recanalization is largely mediated by limiting infarct growth and reducing edema (2). However, successful recanalization of LVO does not always translate to functional recovery. In real-world clinical practice, approximately 50% of patients still experience poor functional outcomes at 90 days, a phenomenon known as futile recanalization (FR) (3, 4). Growing evidence suggests that microcirculatory dysfunction and the resulting cytotoxic edema play a pivotal role in this discrepancy, as persistent capillary-level ischemia can persist despite proximal vessel recanalization, exacerbating injury through blood–brain barrier disruption and neurovascular uncoupling (5, 6). Therefore, accurately and early assessing the degree of cerebral edema is of substantial value for treatment decision-making and predicting prognosis.
Currently, cerebral edema is commonly assessed using non-contrast computed tomography (NCCT). The Alberta Stroke Program Early CT Score (ASPECTS) provides a regional evaluation of early ischemic changes but offers only a semi-quantitative, binary assessment that cannot capture gradations in hypoattenuation severity (7, 8). Midline shift (MLS) quantifies mass effect as an indirect marker of edema, yet it is a late sign that emerges only after intracranial compensatory reserves are exhausted, limiting its utility in early decision-making (9–11). There remains a need for a more objective, quantitative, and early biomarker of cerebral edema to better predict post-EVT outcomes.
Net water uptake (NWU) has emerged as a promising quantitative neuroimaging biomarker, measuring the extent of hypoattenuation to directly estimate pathological water accumulation in ischemic tissue (12, 13). Although NWU has not yet been used as an imaging indicator for selecting EVT candidates, an increasing number of studies have shown that elevated NWU in ischemic lesions during the acute phase was significantly correlated with adverse clinical sequelae, including malignant edema, progression to malignant infarction, increased risk of hemorrhagic transformation, and unfavorable functional outcomes (14–17). Notably, NWU can be derived directly from NCCT, an imaging modality that is readily available even in primary stroke centers. However, cerebral edema progression is time-sensitive, and whether the predictive value of NWU differs between early and late time windows remains poorly understood.
We hypothesize that baseline ASPECTS-based NWU differ significantly between early and late time windows in LVO-AIS patients and may serve as a pre-EVT biomarker for predicting FR. This study aimed to evaluate the association between NWU and FR across different treatment windows and to develop an integrated predictive nomogram for FR using readily available admission parameters.
Materials and methods
Study design and population
This retrospective study was reviewed and approved by the local institutional review board. Written informed consent was waived due to its retrospective design. From January 2022 to November 2024, we retrospectively reviewed consecutive patients with AIS who underwent EVT in our stroke center. The inclusion criteria were as follows: (1) adult patients aged 18 years or older; (2) patients underwent a standardized multimodal stroke CT imaging protocol upon admission, including NCCT, CT angiography (CTA), and CT perfusion (CTP); (3) AIS due to LVO of the internal carotid artery (ICA) and/or the M1 segment of the middle cerebral artery (MCA); (4) stroke onset to admission or last seen well to admission time within 24 h. The exclusion criteria were as follows: (1) pre-stroke modified Rankin Scale (mRS) score > 2; (2) previous intracranial hemorrhage, brain surgery, or large territorial lesion; (3) ischemic lesions in the territory of an anterior cerebral artery or posterior circulation; (4) segmentation error of ASPECTS software; (5) incomplete clinical information; (6) 90-day mRS follow-up data were unavailable; (7) modified Thrombolysis in Cerebral Infarction (mTICI) ≤ 2a; (8) ASPECTS = 10.
Clinical information
The clinical information was obtained from the electronic medical records, including demographics (age, sex), vascular risk factors (hypertension, diabetes mellitus, atrial fibrillation, coronary artery disease, smoking), admission medications (prior antiplatelet or anticoagulant use), time metrics, pre-stroke mRS, admission mRS, National Institutes of Health Stroke Scale (NIHSS) at admission, blood glucose, neutrophil count, and lymphocyte count. The neutrophil-to-lymphocyte ratio (NLR) was determined as the ratio of neutrophil count to lymphocyte count.
Image acquisition and protocols
All AIS patients underwent a standardized multimodal stroke imaging on a 256-row CT scanner (Revolution; GE Healthcare, USA) following the order: NCCT, CTP, and CTA. The protocols were as follows: (1) NCCT: tube voltage 100 kVp, tube current 225 mAs, slice thickness 5.0 mm, and scanning ranged from the skull base to the vertex; (2) CTP: tube voltage 80 kVp, tube current 150 mAs, slice thickness 5.0 mm, and scanning ranged from the skull base to the vertex. Twenty-four consecutive axial scans of the brain (Z-axis 160 mm, and 2.0 s temporal resolution) were acquired after injecting 50 mL contrast medium (iopromide, Ultravist 370, Bayer Schering Pharma) at a flow rate of 5 mL/s followed by 50 mL saline chaser; (3) CTA was performed from the aortic arch to the vertex after CTP was completed by injecting 50 mL contrast medium (iopromide, Ultravist 370, Bayer Schering Pharma) at a flow rate of 5 mL/s followed by 50 mL saline chaser, tube voltage 100 kVp, tube current 250 mAs, slice thickness 0.625 mm, pitch value 0.992.
Image analysis
Automated ASPECTS and ASPECTS-NWU quantification
The ASPECTS measurements were automatically calculated using the stroke software tool (RAPID ASPECTS, iSchemaView). The mean Hounsfield unit (HU) within each ASPECTS region was systematically measured. Regions were classified as normal or pathological via a machine learning algorithm, and ischemic involvement was visually mapped in red. A senior neuroradiologist (with 13 years of neuroradiology experience) independently validated all identified ASPECTS territories to ensure segmentation accuracy and anatomical localization reliability. To quantify ischemic changes, the relative HU difference (%) between affected regions (ischemic hemisphere) and their mirroring unaffected areas (contralateral hemisphere) was calculated using the formula:
CTP analysis
All source CTP datasets underwent standardized processing with RAPID (iSchemaView), a dedicated perfusion analysis platform. Ischemic core quantification applied a relative cerebral blood flow (CBF) threshold <30% of contralateral reference values, while hypoperfusion assessment utilized time-to-maximum (Tmax) delays exceeding 6 s as volumetric parameters. Hypoperfusion intensity ratio (HIR) was defined by dividing the volumetric measurement of Tmax >10s regions by the corresponding Tmax >6 s volume.
Evaluation of recanalization
The selection of EVT modalities (stent retriever devices, aspiration systems, or hybrid approaches) with adjunctive strategies, including optional use of balloon-guiding catheters, was determined by the neuro-interventional physician based on real-time angiographic findings and institutional protocols. The degree of recanalization in patients undergoing EVT was assessed by the operator, using the mTICI scale, based on digital subtraction angiography performed after the procedure. Successful recanalization was defined as an mTICI of 2b/3.
Outcomes
The mRS scores at 90 days were evaluated by a trained nurse through structured telephonic interviews or face-to-face evaluations. FR was defined as mRS 3–6 at 90 days following successful recanalization (mTICI, 2b/3), while non-FR was defined as mRS 0–2 (18).
Statistical analysis
The Shapiro–Wilk test was employed to determine if the data followed a normal distribution. Continuous data with a normal distribution are reported as the means ± SD, the independent sample test was used for comparison, whereas non-normally distributed data are expressed as median and interquartile range (IQR), the Mann–Whitney U test was used for comparison. Chi-square test or Fisher’s exact test was used for categorical variables comparison.
We evaluated potential multicollinearity among covariates by establishing a variance inflation factor threshold of < 5 as the diagnostic criterion for the absence of significant collinearity. In logistic regressions, the 90-day mRS was modeled as a binary variable (0–2 vs. 3–6). All baseline characteristics associated with mRS score at 90-day in univariable analysis with significant p values (p < 0.1) were entered into the multivariable logistic regression models to investigate the predictive validity of each parameter for functional outcomes. All patients were divided into two subgroups (early time window, <6 h versus late time window, 6-24 h) based on the stroke onset to admission or last seen well to admission time. In the subgroup analysis, the same logistic regression analysis method was used. Internal validation was performed using a five-fold cross-validation method for the established model. Receiver operating characteristic (ROC) curve analysis was used to assess the performance of different models for predicting FR. The Youden index was utilized to determine the optimal cutoff point, and the sensitivity and specificity were calculated. DeLong’s test was used for ROC curve comparison. Spearman’s correlation coefficient was calculated to assess the correlation between ASPECTS-NWU and ASPECTS, CTP parameters, clinical characteristics, and 90-day mRS. A p value < 0.05 was considered significant.
Statistical analyses were conducted using SPSS 26.0 (IBM Corp, Armonk, NY, USA) and the uAI Research Portal (United Imaging, Shanghai, China).
Results
Patient characteristics
A total of 168 LVO-AIS patients (male, 101; median age, 69.5 years) who underwent EVT and achieved successful recanalization were involved in this study. At 90 days, FR was observed in 95 (56.55%) patients (Figure 1). As listed in Table 1, the median NLR was 4.50 (IQR, 2.85–8.61), the median admission blood glucose was 6.70 (IQR, 5.63–8.28) mmol/L, the median NIHSS score was 12.50 (IQR, 9.00–17.00), and the onset to admission time was 270 (IQR, 180–540) minutes. In the full cohort, the prevalence of vascular risk factors exhibited a heterogeneous distribution, ranging from 13.1 to 46.4%. Automated quantitative NCCT analysis, the median baseline ASPECTS was 6 (IQR, 3–8), and the median baseline NWU% was 6.77% (IQR, 4.84–9.36). On CTP parameters, the median volume of ischemic core (CBF < 30%) and hypoperfusion (Tmax > 6 s) was 16.50 mL (IQR, 0.00–61.00) and 149.00 mL (IQR, 86.50–222.25), respectively. Due to collinearity between Tmax > 6 s and Tmax > 10s, Tmax >10s was used exclusively for calculating the HIR. The median HIR was 0.41 (IQR, 0.14, 0.60).
Figure 1

Flowchart of patient selection.
Table 1
| Variables | Study cohort, N = 168 | Non-FR, N = 73 | FR, N = 95 | P |
|---|---|---|---|---|
| Age, median (IQR) | 69.50 (60.25, 77.00) | 67.00 (56.00, 72.00) | 74.00 (65.00, 79.00) | < 0.001 |
| Male, n (%) | 101 (60.12%) | 52 (71.23%) | 49 (51.58%) | 0.011 |
| NLR, median (IQR) | 4.50 (2.85, 8.61) | 3.80 (2.45, 6.22) | 5.26 (2.93, 10.08) | 0.010 |
| Admission blood glucose (mmol/L) | 6.70 (5.63, 8.28) | 6.70 (5.70, 8.02) | 6.80 (5.50, 8.80) | 0.587 |
| Onset to admission time (minutes) | 270.00 (180.00, 540.00) | 300.00 (120.00, 600.00) | 270.00 (180.00, 480.00) | 0.977 |
| Onset to imaging (minutes) | 223.50 (127.00, 458.00) | 213.00 (97.50, 536.50) | 235.00 (141.00, 454.00) | 0.462 |
| Onset to puncture (minutes) | 388.50 (236.00, 713.00) | 382.00 (230.50, 790.50) | 411.00 (236.00, 639.00) | 0.935 |
| Onset to recanalization (minutes) | 523.00 (374.75, 861.75) | 505.00 (304.50, 976.50) | 543.00 (408.00, 816.00) | 0.449 |
| Number of passes | 2 (1, 3) | 1 (1, 2) | 2 (1, 3) | < 0.001 |
| Previous mRS | 0 (0,0) | 0 (0.0) | 0 (0.0) | 0.625 |
| Admission mRS | 4 (4, 5) | 4 (4, 5) | 5 (4, 5) | 0.002 |
| Admission NIHSS | 12.50 (9.00, 17.00) | 10.00 (8.00, 15.00) | 15.00 (10.00, 18.00) | < 0.001 |
| Baseline ASPECTS | 6 (3, 8) | 8 (6, 9) | 6 (4, 8) | < 0.001 |
| Baseline NWU (%) | 6.77 (4.84, 9.36) | 5.57 (4.10, 7.72) | 8.23 (5.65, 10.78) | < 0.001 |
| Tmax > 6 s(mL) | 149.00 (86.50, 222.25) | 126.00 (69.00, 182.50) | 173.00 (106.00, 239.00) | 0.004 |
| CBF < 30%(mL) | 16.50 (0.00, 61.00) | 0.00 (0.00, 18.50) | 34.00 (12.00, 107.00) | < 0.001 |
| HIR | 0.41 (0.14, 0.60) | 0.25 (0.04, 0.45) | 0.48 (0.28, 0.67) | < 0.001 |
| Hypertension, n (%) | 78 (46.4) | 33 (45.2) | 45 (47.4) | 0.781 |
| Diabetes mellitus, n (%) | 22 (13.1) | 7 (9.6) | 15 (15.8) | 0.238 |
| CAD, n (%) | 33 (19.6) | 15 (20.5) | 18 (18.9) | 0.796 |
| Atrial fibrillation, n (%) | 41 (24.4) | 17 (23.3) | 24 (25.2) | 0.768 |
| Smoking, n (%) | 60 (35.7) | 30 (41.1) | 30 (31.6) | 0.202 |
| Prior anticoagulant, n (%) | 23 (13.7) | 11 (15.1) | 12 (12.6) | 0.649 |
| Prior antiplatelet, n (%) | 16 (9.5) | 7 (9.6) | 9 (9.5) | 0.980 |
Patient characteristics stratified by FR.
FR, futile recanalization; NLR, Neutrophil-to-Lymphocyte Ratio; mRS, modified Rankin Scale; NIHSS, National Institutes of Health Stroke Scale; ASPECTS, Alberta Stroke Program Early CT Score; NWU, net water uptake; Tmax, time to maximum; CBF, cerebral blood flow; HIR, hypoperfusion intensity ratio; CAD, coronary artery disease.
Patients with FR were significantly older (median age, 74 vs. 67 years, p < 0.001), less likely to be men (51.58% vs. 71.23%, p = 0.011), had higher NLR (median, 5.26 vs. 3.80, p = 0.010), had higher admission mRS (median, 5 vs. 4, p = 0.002), and exhibited greater stroke severity (median NIHSS, 15 vs. 10, p < 0.001) compared to the non-FR group. Imaging parameters also differed significantly, the FR group demonstrated larger hypoperfusion volumes (Tmax > 6 s: median 173 mL vs. 126 mL, p = 0.004), expanded ischemic core (CBF < 30%: median 34 mL vs. 0 mL, p < 0.001), increased HIR values (median, 0.48 vs. 0.25, p < 0.001), and elevated NWU% (median, 8.23% vs. 5.57%, p < 0.001). In terms of perioperative indicators, the number of passes in the FR group was higher than that in the non-FR group (IQR, 2 vs. 1), while the other differences were not statistically significant. Conversely, baseline ASPECTS (median, 6 vs. 8, p < 0.001) was significantly lower in the FR group. Additionally, no significant differences were observed in admission blood glucose (p = 0.587), onset-to-admission time (p = 0.985), or comorbidities such as hypertension (p = 0.781) and diabetes (p = 0.238).
Patient characteristics in subgroup
According to the onset to admission time, 104 patients were assigned to the early time window group, and 64 patients were assigned to the late time window group. Patients with FR demonstrated significantly older age, higher NIHSS scores, an increased number of passes, and worse neuroimaging profiles, which included lower ASPECTS, elevated NWU%, larger CBF < 30% volumes, and increased HIR values, regardless of the time window (all p < 0.05). More details are presented in Table 2.
Table 2
| Variables | Early time window (< 6 h), N = 104 | Late time window (≥ 6 h), N = 64 | ||||
|---|---|---|---|---|---|---|
| Non-FR, N = 46 | FR, N = 58 | P | Non-FR, N = 27 | FR, N = 37 | P | |
| Age, median (IQR) | 67.00 (58.25, 72.25) | 75.00 (65.00, 81.00) | 0.002 | 63.74 ± 12.71 | 69.62 ± 9.05 | 0.034 |
| Male, n (%) | 28 (60.9) | 28 (48.3) | 0.201 | 24 (88.9) | 21 (56.8) | 0.005 |
| NLR, median (IQR) | 3.79 (2.20, 6.21) | 4.23 (2.47, 9.46) | 0.292 | 3.98 (2.87, 6.22) | 7.96 (4.08, 14.09) | 0.005 |
| Admission blood glucose (mmol/L) | 6.35 (5.70, 7.60) | 6.85 (5.70, 8.08) | 0.278 | 7.24 (5.60, 8.70) | 6.70 (5.15, 10.25) | 0.989 |
| Onset to admission time (minutes) | 180.00 (120.00, 240.00) | 180.00 (120.00, 240.00) | 0.621 | 780.00 (600.00, 1440.00) | 600.00 (480.00, 1020.00) | 0.068 |
| Onset to imaging (minutes) | 148.50 (77.75, 213.00) | 152.00 (103.75, 222.00) | 0.366 | 692.00 (413.00, 1112.00) | 492.00 (418.50, 907.00) | 0.484 |
| Onset to puncture (minutes) | 266.00 (168.75, 339.00) | 275.00 (216.75, 375.25) | 0.421 | 1110.00 (714.00, 1536.00) | 668.00 (567.00, 1222.00) | 0.027 |
| Onset to recanalization (minutes) | 376.50 (276.50, 475.25) | 423.00 (339.75, 513.75) | 0.051 | 1210.00 (855.00, 1641.00) | 840.00 (686.00, 1372.00) | 0.072 |
| Number of passes | 1 (1, 2) | 2 (1, 3) | 0.010 | 2 (1, 2) | 2 (1, 3) | 0.011 |
| Previous mRS | 0 (0, 0) | 0 (0, 0) | 0.390 | 0 (0, 0) | 0 (0, 0) | 0.746 |
| Admission mRS | 4 (4, 5) | 5 (4, 5) | 0.001 | 4 (4, 5) | 4 (4, 5) | 0.277 |
| Admission NIHSS | 12.07 ± 6.10 | 15.19 ± 5.84 | 0.009 | 9.78 ± 5.63 | 13.27 ± 5.72 | 0.018 |
| Baseline ASPECTS | 7.0 (5.8, 8.0) | 4.5 (2.0, 6.0) | < 0.001 | 8.0 (7.0, 9.0) | 4 (2.5, 6.0) | < 0.001 |
| Baseline NWU% | 5.83 ± 2.59 | 7.31 ± 3.47 | 0.017 | 5.57 (3.48, 7.83) | 10.54 (7.05, 13.63) | < 0.001 |
| Tmax > 6 s(mL) | 127.00 (76.00, 152.25) | 176.00 (100.00, 274.25) | 0.005 | 125.00 (68.00, 233.00) | 168.00 (109.50, 217.50) | 0.407 |
| CBF < 30%(mL) | 4.50 (0.00, 23.25) | 46.50 (14.50, 136.25) | < 0.001 | 0.00 (0.00, 10.00) | 19.00 (9.00, 65.50) | < 0.001 |
| HIR | 0.35 (0.04, 0.49) | 0.51 (0.33, 0.71) | 0.001 | 0.14 (0.03, 0.36) | 0.47 (0.21, 0.62) | < 0.001 |
| Hypertension, n (%) | 22 (47.8) | 26 (44.8) | 0.761 | 11 (40.7) | 19 (51.4) | 0.401 |
| Diabetes mellitus, n (%) | 4 (8.7) | 7 (8.6) | 1.000 | 3 (11.1) | 10 (27.0) | 0.118 |
| CAD, n (%) | 12 (26.1) | 15 (25.7) | 0.979 | 3 (11.1) | 3 (8.1) | 0.691 |
| Atrial fibrillation, n (%) | 16 (34.8) | 20 (34.5) | 0.975 | 1 (3.7) | 4 (10.8) | 0.387 |
| Smoking, n (%) | 17 (37.0) | 16 (27.6) | 0.308 | 13 (48.1) | 14 (37.8) | 0.409 |
| Prior anticoagulant, n (%) | 9 (19.6) | 11 (19.0) | 0.939 | 2 (7.4) | 1 (2.9) | 0.568 |
| Prior antiplatelet, n (%) | 5 (10.9) | 7 (12.1) | 0.849 | 2 (7.4) | 2 (5.9) | 1.000 |
Patient characteristics stratified by time window.
FR, futile recanalization; NLR, Neutrophil-to-Lymphocyte Ratio; mRS, modified Rankin Scale; NIHSS, National Institutes of Health Stroke Scale; ASPECTS, Alberta Stroke Program Early CT Score; NWU, net water uptake; Tmax, time to maximum; CBF, cerebral blood flow; HIR, hypoperfusion intensity ratio; CAD, coronary artery disease.
Association between NWU and the other variables
As shown in Figure 2, NWU demonstrated a moderate positive correlation with CBF (ρ = 0.54, p < 0.01) and HIR (ρ = 0.43, p < 0.01), weak positive correlations with onset time (ρ = 0.20, p < 0.01), NIHSS (ρ = 0.19, p < 0.05) and mRS (ρ = 0.34, p < 0.01), and moderate negative correlation with ASPECTS (ρ = −0.59, p < 0.01).
Figure 2
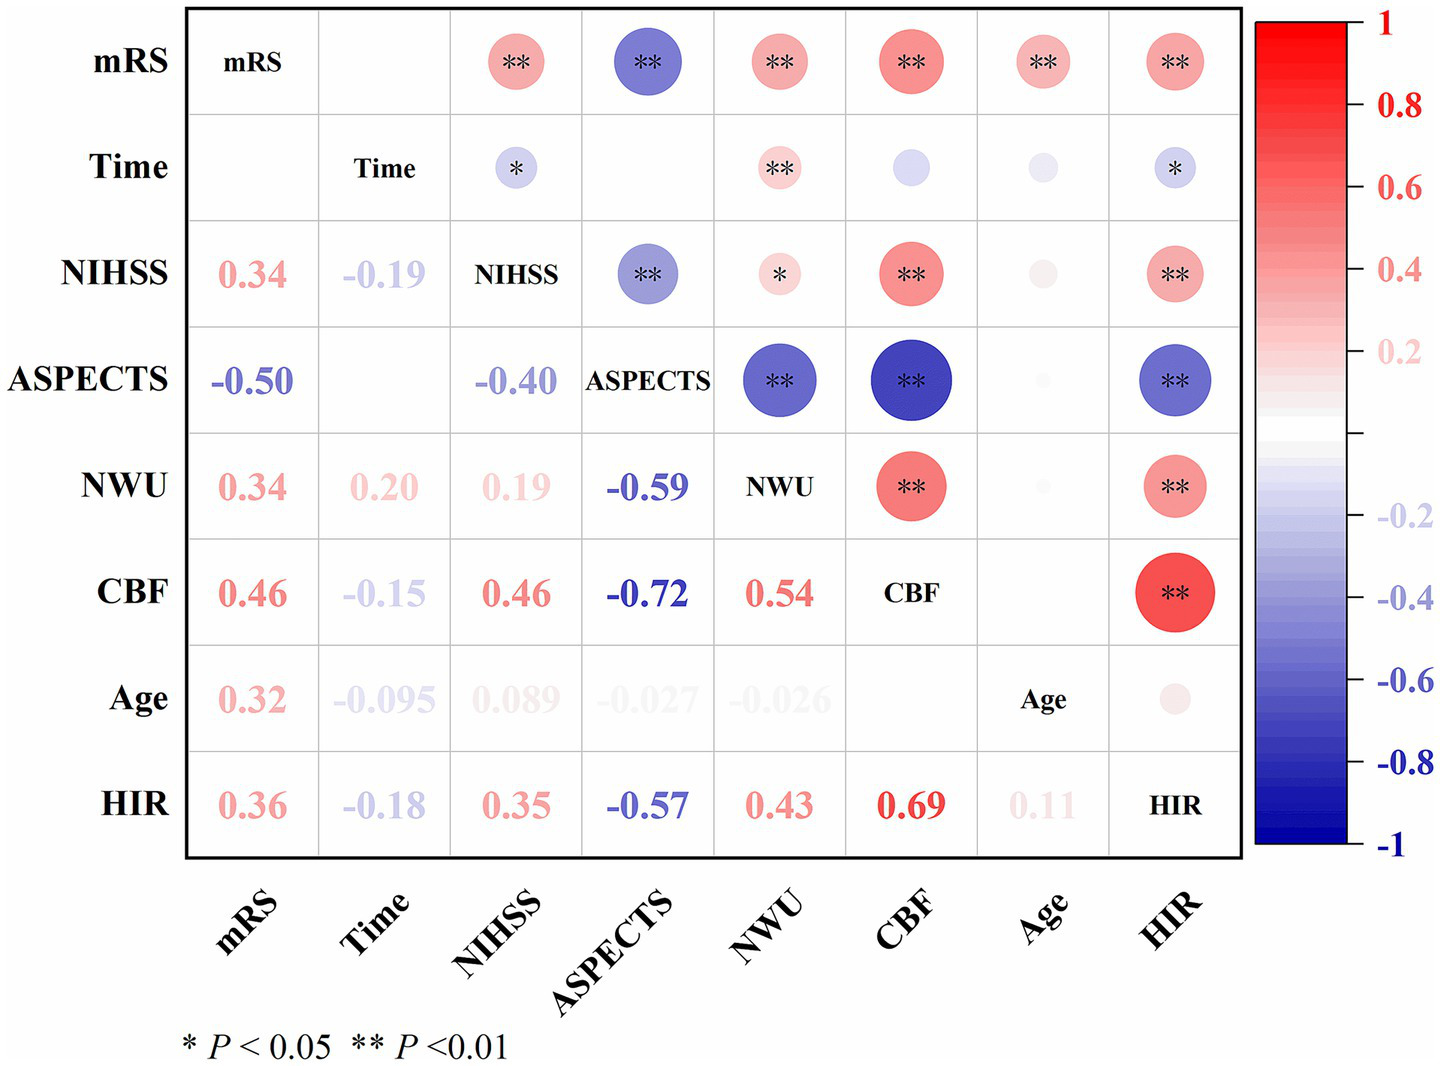
Correlation between NWU and other variables.
Independent predictors of FR in full cohort and subgroups
In the full cohort, an increasing age (aOR, 1.078, 95% CI: 1.033–1.124; p < 0.001) and a higher baseline ASPECTS (aOR, 0.711, 95% CI: 0.555–0.907; p = 0.006) were independently associated with FR in Model A. After incorporating perioperative variables in Model B, both age (aOR, 1.091; 95% CI, 1.042–1.143; p < 0.001), number of passes (aOR, 1.986; 95% CI, 1.314–3.001; p = 0.001), baseline NWU (aOR, 1.179; 95% CI, 1.016–1.369; p = 0.030) and baseline ASPECTS (aOR, 0.755; 95% CI, 0.586–0.975; p = 0.030) identified as independent risk factors for FR (Supplementary Table S1).
In the early time window subgroup, increasing age (aOR, 1.090; 95% CI: 1.034–1.148; p = 0.001) was significantly associated with higher odds of FR in Model A. When perioperative variables were added in Model B, age (aOR, 1.122; 95% CI: 1.053–1.195; p < 0.001) remained a strong independent predictor. In addition, an increased number of passes (aOR, 2.307; 95% CI, 1.296–4.104; p = 0.004) was significantly associated with increased odds of FR (Supplementary Table S2).
In the late time window subgroup, baseline ASPECTS and NWU were identified as significant predictors of FR (Table 3). In Model A, lower ASPECTS (aOR, 0.556; 95% CI, 0.340–0.910; p = 0.020) and higher NWU (aOR, 1.304; 95% CI, 1.010–1.684; p = 0.042) were independently associated with increased odds of FR. After adjusting for perioperative variables in Model B, ASPECTS (aOR, 0.529; 95% CI, 0.307–0.912; p = 0.022) and NWU (aOR, 1.373; 95% CI, 1.034–1.823; p = 0.028) remained statistically significant. As shown in Table 4 and Figure 3, both NWU and ASPECTS demonstrated good performance in predicting FR. The AUC for NWU was 0.809, achieving 59.5% sensitivity and 92.6% specificity at the optimal cutoff of 9.57%. ASPECTS showed an AUC of 0.846, with 86.5% sensitivity and 77.8% specificity at a cutoff of 6.5. Combining these two parameters increased the AUC to 0.880, with a sensitivity of 89.2% and specificity of 81.5%. Pairwise comparisons of AUC differences revealed no significant disparity among the three models (all p > 0.05). The model was evaluated through 5-fold cross-validation, with performance metrics summarized in Supplementary Table S3. Additionally, we have constructed a model using only the CTP indicators Tmax > 6 s and CBF < 30%. This model exhibited an AUC of 0.778, along with a sensitivity of 81.1% and a specificity of 70.4%. The DeLong test demonstrated a significantly higher AUC for the NCCT-based model (ASPECTS+NWU) compared to the CTP-only model (p = 0.023). Subsequently, a nomogram was developed to predict FR in the late time window group. Usefully, we validated the nomogram with a case, and the predicted result showed high consistency with the 90-day classification of mRS (Figure 4).
Table 3
| Variables | MultivariableA | MultivariableB | ||
|---|---|---|---|---|
| aOR (95% CI) | P | aOR (95% CI) | P | |
| Age | 1.031 (0.954, 1.115) | 0.437 | 1.031 (0.944, 1.126) | 0.500 |
| Sex (Male) | 0.252 (0.046, 1.367) | 0.110 | 0.192 (0.029, 1.275) | 0.087 |
| NLR | 1.091 (0.924, 1.288) | 0.306 | 1.090 (0.918, 1.295) | 0.324 |
| Onset to puncture | 1.000 (0.999, 1.001) | 0.790 | ||
| Number of passes | 2.092 (0.855, 5.116) | 0.106 | ||
| Admission NIHSS | 0.948 (0.810, 1.109) | 0.503 | 0.955 (0.803, 1.137) | 0.608 |
| Baseline ASPECTS | 0.556 (0.340, 0.910) | 0.020 | 0.529 (0.307, 0.912) | 0.022 |
| Baseline NWU% | 1.304 (1.010, 1.684) | 0.042 | 1.373 (1.034, 1.823) | 0.028 |
| CBF < 30% | 0.980 (0.945, 1.017) | 0.281 | 0.982 (0.942, 1.024) | 0.404 |
| HIR | 1.012 (0.967, 1.058) | 0.609 | 0.996 (0.945, 1.049) | 0.868 |
Logistic regression to predict FR in the late time window.
Aexcluding perioperative variables. Bincluding perioperative variables; FR, futile recanalization; aOR, adjusted odds ratio; NLR, Neutrophil-to-Lymphocyte Ratio; mRS, modified Rankin Scale; NIHSS, National Institutes of Health Stroke Scale; ASPECTS, Alberta Stroke Program Early CT Score; NWU, net water uptake; Tmax, time to maximum; CBF, cerebral blood flow; HIR, hypoperfusion intensity ratio.
Bold values indicate P < 0.05.
Table 4
| Prediction models | Cutoff value | AUC | Sensitivity | Specificity | P |
|---|---|---|---|---|---|
| NWU (%) | 9.57% | 0.809 | 59.5% | 92.6% | < 0.001 |
| ASPECTS | 6.5 | 0.846 | 86.5% | 77.8% | < 0.001 |
| NWU + ASPECTS | – | 0.880 | 89.2% | 81.5% | < 0.001 |
| CBF + Tmax | – | 0.778 | 81.1% | 70.4% | < 0.001 |
Predication models for FR in the late time window.
FR, futile recanalization; NWU, net water uptake; ASPECTS, Alberta Stroke Program Early CT Score; CBF, cerebral blood flow; Tmax, time-to-maximum.
Figure 3

Comparative among different models for predicting FR in the late time window.
Figure 4
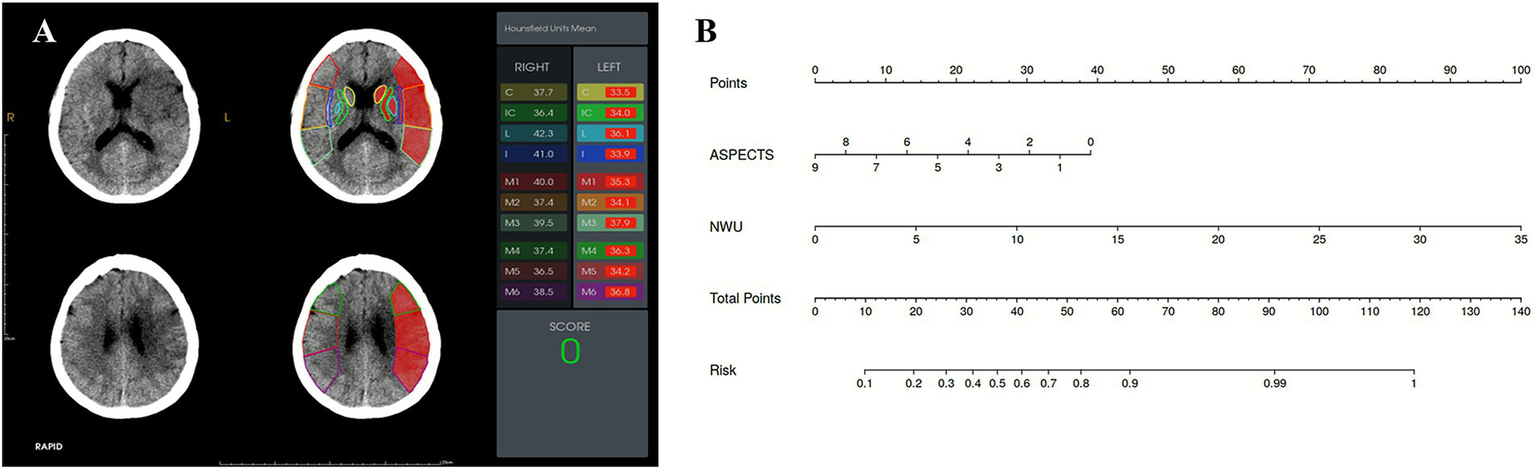
(A) A 57-year-old female presented with acute ischemic stroke due to left middle cerebral artery occlusion, imaged 8 h from onset. The ASPECTS was 0, and the NWU based on ASPECTS was 8.95%. (B) A nomogram used for predicting FR. According to the ASPECTS (0) and NWU% (8.95%), the probability of FR for this patient at 90 days is 90.44%. The patient experienced FR at 90-day follow-up (mRS: 3).
Discussion
This study evaluated the prognostic utility of ASPECTS-based NWU before EVT, a quantitative neuroimaging biomarker, in predicting 90-day functional outcomes among LVO-AIS patients stratified by time window. We found that elevated baseline NWU was associated with higher odds of FR and emerged as an independent predictor of 90-day functional outcomes in late time window patients with an optimal cutoff value of 9.57%. The integration of NWU with the admission ASPECTS into a nomogram provided a robust and clinically practical tool for pre-EVT risk stratification, with an AUC of 0.880 in the late time window cohort.
In this study, 56.55% (95/168) of LVO-AIS patients still experience FR, a rate slightly higher than that reported in previous studies (19, 20). This variance may be explained by several potential contributing factors, including differences in the studied onset-to-admission time windows, varying definitions of successful recanalization, and the enrollment of a cohort comprising patients with larger ischemic cores. Recent evidence from randomized trials has shown that patients with large ischemic infarctions had better functional outcomes with EVT than with medical management alone (21–24). However, other studies have observed that a larger infarct core may reduce the efficacy of EVT (25, 26). The observed differences in results emphasize the necessity of optimizing EVT patient selection criteria in AIS, especially in those with large infarctions.
Extensive cerebral edema development following cerebral ischemia persists as a critical determinant of neurological deterioration (27). The Stroke Treatment Academic Industry Roundtable X has emphasized defining precise neuroimaging biomarkers for cerebral edema, positioning this endeavor as a key priority for adjunctive anti-edema therapeutics (28). Although ASPECTS provided a semi-quantitative evaluation as an inclusion criterion in these trials, the degree of hypoattenuation was not quantified (29). In recent years, NWU has served as a clinically available neuroimaging biomarker based on density measurement that enables quantitative assessment of cerebral edema progression through its dynamic trajectory observed on serial NCCT scans (30). However, this biomarker is susceptible to hemorrhagic transformations and contrast staining after EVT. Reportedly, hyperattenuated intracerebral lesions, including hemorrhagic transformations and contrast staining after mechanical recanalization, were observed in 84.2% of AIS patients (31). Even when overt hyperdense areas were absent on postprocedural imaging, subvisual iodinated contrast staining following endovascular thrombectomy has been demonstrated to significantly impact NWU quantification accuracy, resulting in edema underestimation (32). A previous study has demonstrated that NWU-derived edema indicators failed to predict 90-day functional outcomes in thrombectomy-treated patients with hemorrhagic transformation or EVT history, and NWU application should be strictly constrained to baseline NCCT analysis (33).
Therefore, our research integrates baseline NWU into a multimodal prognostic model to predict FR following successful recanalization. Our key finding is that the predictive value of NWU exhibits a temporally window dependent. We observed that an elevated baseline NWU was associated with FR, regardless of the time window. Multivariable analysis confirmed its role as an independent predictor of FR in patients presenting in the late time window, irrespective of perioperative variables. This is consistent with the evidence of previous studies on stroke onset time using NWU (34, 35). However, in the subsequent early time window subgroup analysis, NWU did not demonstrate independent predictive ability. It is not surprising that interindividual variability in post-stroke edema progression may be associated with the observed nonlinear logarithmic relationship between ASPECTS-NWU measurements and time from symptom onset (36). This result may be due to the patient having mild cerebral edema within 6 h, which reduces the sensitivity of NWU detection. The weak positive correlation between NWU and onset time (ρ = 0.20), alongside its moderate association with core volume (ρ = 0.54) and HIR (ρ = 0.43), underscores that NWU reflects not just time elapsed but more critically, the severity of ischemic pathophysiology. This accounts for its retained independent predictive power in the late window, suggesting a potential advantage over the simple “time clock” model (36).
Current clinical guidelines advocate using CTP-derived penumbral and core assessment to guide intravenous thrombolysis with alteplase and EVT in AIS patients presenting with unknown onset or in the late time window. However, the association of perfusion imaging-guided ischemic lesion analysis with better clinical outcomes in patients with an extended time window continues to be a contentious issue. Current evidence suggests that CTP-derived penumbral/core volume quantification carries risks of overestimating irreversible ischemic damage in AIS, which may inadvertently exclude potential candidates who could derive clinical benefits from EVT (37). The TENSION trial selected patients for EVT based on NCCT-ASPECTS alone and demonstrated treatment effects consistent with trials that relied on advanced imaging modalities (38). Particularly in patients with low ASPECTS, growing evidence highlights the potential of NWU as a selection tool for EVT (39–41). Our study found differences in the infarct core (CBF < 30%) between the FR and the non-FR groups, regardless of the time window. While it provides valuable hemodynamic information, it was not an independent prognostic marker. In contrast, the AUC of ASPECTS and NWU for predicting poor functional outcomes with a late time window in AIS was 0.849 and 0.809, respectively. Notably, both NWU and ASPECTS remained independent predictors of FR in the late time window when ASPECTS was added to the multivariable logistic regression analyses. A significant observation is that the combined NCCT model (ASPECTS + NWU) achieved a statistically superior AUC (0.880) compared to a model based solely on CTP parameters (CBF < 30% + Tmax > 6 s, AUC = 0.778, p = 0.023). As NCCT remains the most accessible and rapid imaging modality for AIS evaluation, these findings suggest that quantitative NWU combined with ASPECTS may serve as a viable alternative selection criterion for the late time window AIS patients, particularly benefiting primary stroke centers lacking advanced CTP capabilities. The nomogram we have established can be easily used for family-centered communication, physician decision support, and healthcare resource optimization before EVT.
This study has several limitations. First, the assessment of NWU was derived from ASPECTS-defined anatomical regions, which may not be entirely consistent with the actual ischemic territories. Nevertheless, NWU quantification provides a rapid and objective method for assessing cerebral edema severity, with clinical utility in AIS settings. Second, this was a single-center, retrospective study, with the principal constraint being the lack of an external validation cohort to confirm the generalizability of our findings. Future multicenter investigations incorporating large samples are required to reinforce the robustness of these observations. Third, the exclusion of patients without successful recanalization limits the generalizability of NWU to this population.
In conclusion, LVO-AIS patients with FR exhibited higher NWU values at admission, regardless of the time window. In addition to ASPECTS, quantitative NWU is another independent risk factor for predicting FR in the late time window cohort. Future studies should incorporate NWU as an imaging criterion for treatment decisions. This developed nomogram, which integrates NWU with ASPECTS, represents a clinically practical and noninvasive tool for pre-EVT individualized risk stratification of FR.
Statements
Data availability statement
The raw data supporting the conclusions of this article will be made available by the authors, without undue reservation.
Ethics statement
The studies involving humans were approved by ethics committee of Chongqing University Three Gorges Hospital. The studies were conducted in accordance with the local legislation and institutional requirements. The ethics committee/institutional review board waived the requirement of written informed consent for participation from the participants or the participants’ legal guardians/next of kin because The requirement for written informed consent was waived by the Institutional Review Board due to the retrospective nature of this study, which involved the analysis of pre-existing, anonymized clinical data.
Author contributions
XiaL: Writing – original draft, Data curation, Writing – review & editing. QX: Writing – review & editing, Data curation. WZ: Writing – original draft, Validation, Investigation, Supervision, Methodology. YW: Data curation, Writing – original draft. XinL: Writing – review & editing, Software. YL: Writing – review & editing, Validation, Supervision.
Funding
The author(s) declared that financial support was received for this work and/or its publication. This work was supported by Science-Health Joint Medical Scientific Research Project of Chongqing (Grant No:2025MSXM157).
Acknowledgments
The authors thank Chuyue Wu, Department of Neurology, Chongqing University Three Gorges Hospital, for assisting with clinical data collection.
Conflict of interest
The author(s) declared that this work was conducted in the absence of any commercial or financial relationships that could be construed as a potential conflict of interest.
Generative AI statement
The author(s) declared that Generative AI was not used in the creation of this manuscript.
Any alternative text (alt text) provided alongside figures in this article has been generated by Frontiers with the support of artificial intelligence and reasonable efforts have been made to ensure accuracy, including review by the authors wherever possible. If you identify any issues, please contact us.
Publisher’s note
All claims expressed in this article are solely those of the authors and do not necessarily represent those of their affiliated organizations, or those of the publisher, the editors and the reviewers. Any product that may be evaluated in this article, or claim that may be made by its manufacturer, is not guaranteed or endorsed by the publisher.
Supplementary material
The Supplementary material for this article can be found online at: https://www.frontiersin.org/articles/10.3389/fneur.2026.1741637/full#supplementary-material
References
1.
Nogueira RG Jadhav AP Haussen DC Bonafe A Budzik RF Bhuva P et al . Thrombectomy 6 to 24 hours after stroke with a mismatch between deficit and infarct. N Engl J Med. (2018) 378:11–21. doi: 10.1056/NEJMoa1706442,
2.
Sarraj A Pujara DK Churilov L Sitton CW Ng F Hassan AE et al . Mediation of successful reperfusion effect through infarct growth and cerebral Edema: a pooled, patient-level analysis of EXTEND-IA trials and SELECT prospective cohort. Ann Neurol. (2023) 93:793–804. doi: 10.1002/ana.26587,
3.
Nie X Leng X Miao Z Fisher M Liu L . Clinically ineffective reperfusion after endovascular therapy in acute ischemic stroke. Stroke. (2023) 54:873–81. doi: 10.1161/STROKEAHA.122.038466,
4.
Deng G Chu YH Xiao J Shang K Zhou LQ Qin C et al . Risk factors, pathophysiologic mechanisms, and potential treatment strategies of futile recanalization after endovascular therapy in acute ischemic stroke. Aging Dis. (2023) 14:2096–112. doi: 10.14336/AD.2023.0321-1,
5.
Ng FC Churilov L Yassi N Kleinig TJ Thijs V Wu TY et al . Microvascular dysfunction in blood-brain barrier disruption and hypoperfusion within the infarct posttreatment are associated with cerebral Edema. Stroke. (2022) 53:1597–605. doi: 10.1161/STROKEAHA.121.036104,
6.
Sperring CP Savage WM Argenziano MG Leifer VP Alexander J Echlov N et al . No-reflow post-recanalization in acute ischemic stroke: mechanisms, measurements, and molecular markers. Stroke. (2023) 54:2472–80. doi: 10.1161/STROKEAHA.123.044240,
7.
Wen X Li Y He X Xu Y Shu Z Hu X et al . Prediction of malignant acute middle cerebral artery infarction via computed tomography radiomics. Front Neurosci. (2020) 14:708. doi: 10.3389/fnins.2020.00708,
8.
Broocks G Flottmann F Ernst M Faizy TD Minnerup J Siemonsen S et al . Computed tomography-based imaging of voxel-wise lesion water uptake in ischemic brain: relationship between density and direct volumetry. Investig Radiol. (2018) 53:207–13. doi: 10.1097/RLI.0000000000000430,
9.
Schleicher RL Vorasayan P McCabe ME Bevers MB Davis TP Griffin JH et al . Analysis of brain edema in RHAPSODY. Int J Stroke. (2024) 19:68–75. doi: 10.1177/17474930231187268,
10.
Minnerup J Wersching H Ringelstein EB Heindel W Niederstadt T Schilling M et al . Prediction of malignant middle cerebral artery infarction using computed tomography-based intracranial volume reserve measurements. Stroke. (2011) 42:3403–9. doi: 10.1161/STROKEAHA.111.619734,
11.
Dhar R Chen Y Hamzehloo A Kumar A Heitsch L He J et al . Reduction in cerebrospinal fluid volume as an early quantitative biomarker of cerebral edema after ischemic stroke. Stroke. (2020) 51:462–7. doi: 10.1161/STROKEAHA.119.027895,
12.
Broocks G McDonough R Meyer L Bechstein M Kniep H Schön G et al . Reversible ischemic lesion hypodensity in acute stroke CT following endovascular reperfusion. Neurology. (2021) 97:e1075–84. doi: 10.1212/WNL.0000000000012484,
13.
Han Q Yang J Gao X Li J Wu Y Xu Y et al . Early Edema within the ischemic Core is time-dependent and associated with functional outcomes of acute ischemic stroke patients. Front Neurol. (2022) 13:861289. doi: 10.3389/fneur.2022.861289,
14.
Nawabi J Flottmann F Kemmling A Kniep H Leischner H Sporns P et al . Elevated early lesion water uptake in acute stroke predicts poor outcome despite successful recanalization - when "tissue clock" and "time clock" are desynchronized. Int J Stroke. (2021) 16:863–72. doi: 10.1177/1747493019884522,
15.
Shi J Wu H Dong Z Liang X Liu Q Zhu W et al . Automated quantitative lesion water uptake in acute stroke is a predictor of malignant cerebral edema. Eur Radiol. (2022) 32:2771–80. doi: 10.1007/s00330-021-08443-2,
16.
Broocks G Flottmann F Scheibel A Aigner A Faizy TD Hanning U et al . Quantitative lesion water uptake in acute stroke computed tomography is a predictor of malignant infarction. Stroke. (2018) 49:1906–12. doi: 10.1161/STROKEAHA.118.020507,
17.
Nawabi J Kniep H Schön G Flottmann F Leischner H Kabiri R et al . Hemorrhage after endovascular recanalization in acute stroke: lesion extent, collaterals and degree of ischemic water uptake mediate tissue vulnerability. Front Neurol. (2019) 10:569. doi: 10.3389/fneur.2019.00569,
18.
Heitkamp C Heitkamp A Winkelmeier L Thaler C Flottmann F Schell M et al . Predictors of futile recanalization in ischemic stroke patients with low baseline NIHSS. Int J Stroke. (2024) 19:17474930241264737. doi: 10.1177/17474930241264737,
19.
van Horn N Kniep H Leischner H McDonough R Deb-Chatterji M Broocks G et al . Predictors of poor clinical outcome despite complete reperfusion in acute ischemic stroke patients. J Neurointerv Surg. (2021) 13:14–8. doi: 10.1136/neurintsurg-2020-015889,
20.
Mohammaden MH Stapleton CJ Brunozzi D Hussein AE Khedr EM Atwal G et al . Predictors of poor outcome despite successful mechanical thrombectomy of anterior circulation large vessel occlusions within 6 h of symptom onset. Front Neurol. (2020) 11:907. doi: 10.3389/fneur.2020.00907,
21.
Yoshimura S Sakai N Yamagami H Uchida K Beppu M Toyoda K et al . Endovascular therapy for acute stroke with a large ischemic region. N Engl J Med. (2022) 386:1303–13. doi: 10.1056/NEJMoa2118191,
22.
Sarraj A Hassan AE Abraham MG Ortega-Gutierrez S Kasner SE Hussain MS et al . Trial of endovascular thrombectomy for large ischemic strokes. T N Engl J Med. (2023) 388:1259–71. doi: 10.1056/NEJMx230009
23.
Huo X Ma G Tong X Zhang X Pan Y Nguyen TN et al . Trial of endovascular therapy for acute ischemic stroke with large infarct. N Engl J Med. (2023) 388:1272–83. doi: 10.1056/NEJMoa2213379,
24.
Costalat V Jovin TG Albucher JF Cognard C Henon H Nouri N et al . Trial of thrombectomy for stroke with a large infarct of unrestricted size. N Engl J Med. (2024) 390:1677–89. doi: 10.1056/NEJMoa2314063,
25.
Sun D Guo X Nguyen TN Pan Y Ma G Tong X et al . Alberta stroke program early computed tomography score, infarct Core volume, and endovascular therapy outcomes in patients with large infarct: a secondary analysis of the ANGEL-ASPECT trial. JAMA Neurol. (2024) 81:30–8. doi: 10.1001/jamaneurol.2023.4430,
26.
Yoo AJ Zaidat OO Sheth SA Rai AT Ortega-Gutierrez S Given CA et al . Thrombectomy for stroke with large infarct on noncontrast CT: the TESLA randomized clinical trial. JAMA. (2024) 332:1355–66. doi: 10.1001/jama.2024.13933,
27.
Broocks G Flottmann F Hanning U Schön G Sporns P Minnerup J et al . Impact of endovascular recanalization on quantitative lesion water uptake in ischemic anterior circulation strokes. J Cereb Blood Flow Metab. (2020) 40:437–45. doi: 10.1177/0271678X18823601,
28.
Savitz SI Baron JC Fisher M . Stroke treatment academic industry roundtable X: brain cytoprotection therapies in the reperfusion era. Stroke. (2019) 50:1026–31. doi: 10.1161/STROKEAHA.118.023927,
29.
Chen H Lee JS Michel P Yan B Chaturvedi S . Endovascular stroke thrombectomy for patients with large ischemic Core: a review. JAMA Neurol. (2024) 81:1085–93. doi: 10.1001/jamaneurol.2024.2500,
30.
Meyer L Schönfeld M Bechstein M Hanning U Cheng B Thomalla G et al . Ischemic lesion water homeostasis after thrombectomy for large vessel occlusion stroke within the anterior circulation: the impact of age. J Cereb Blood Flow Metab. (2021) 41:45–52. doi: 10.1177/0271678X20915792,
31.
Lummel N Schulte-Altedorneburg G Bernau C Pfefferkorn T Patzig M Janssen H et al . Hyperattenuated intracerebral lesions after mechanical recanalization in acute stroke. AJNR Am J Neuroradiol. (2014) 35:345–51. doi: 10.3174/ajnr.A3656,
32.
Steffen P Austein F Lindner T Meyer L Bechstein M Rümenapp J et al . Value of dual-energy dual-layer CT after mechanical recanalization for the quantification of ischemic brain Edema. Front Neurol. (2021) 12:668030. doi: 10.3389/fneur.2021.668030,
33.
Ng FC Yassi N Sharma G Brown SB Goyal M Majoie CBLM et al . Correlation between computed tomography-based tissue net water uptake and volumetric measures of cerebral Edema after reperfusion therapy. Stroke. (2022) 53:2628–36. doi: 10.1161/STROKEAHA.121.037073,
34.
Wu RR Cao YZ Xu XQ Jia ZY Zhao LB Shi HB et al . ASPECTS-based net water uptake outperforms target mismatch for outcome prediction in patients with acute ischemic stroke and late therapeutic window. Eur Radiol. (2023) 33:9130–8. doi: 10.1007/s00330-023-09965-7,
35.
Yang L Kan Y Ren C Li S Li C Wu L et al . Pre-thrombectomy cerebral edema affects outcomes in acute stroke patients treated with thrombectomy. Int J Med Sci. (2025) 22:2354–61. doi: 10.7150/ijms.105692,
36.
Lu SS Wu RR Cao YZ Xu XQ Jia ZY Shi HB et al . Automated estimation of quantitative lesion water uptake as a prognostic biomarker for patients with ischemic stroke and large-vessel occlusion. AJNR Am J Neuroradiol. (2023) 44:33–9. doi: 10.3174/ajnr.A7741,
37.
Broocks G Meyer L Winkelmeier L Kniep H Heitkamp C Christensen S et al . Overestimation of the ischemic Core is associated with higher Core lesion volume and degree of reperfusion after thrombectomy. Radiology. (2024) 312:e231750. doi: 10.1148/radiol.231750,
38.
Bendszus M Fiehler J Subtil F Bonekamp S Aamodt AH Fuentes B et al . Endovascular thrombectomy for acute ischaemic stroke with established large infarct: multicentre, open-label, randomised trial. Lancet. (2023) 402:1753–63. doi: 10.1016/S0140-6736(23)02032-9,
39.
Broocks G Meyer L McDonough R Bechstein M Hanning U Fiehler J et al . The benefit of thrombectomy in patients with low ASPECTS is a matter of shades of gray-what current trials may have missed. Front Neurol. (2022) 12:718046. doi: 10.3389/fneur.2021.718046,
40.
Broocks G Meyer L Elsayed S McDonough R Bechstein M Faizy TD et al . Association between net water uptake and functional outcome in patients with low ASPECTS brain lesions: results from the I-LAST study. Neurology. (2023) 100:e954–63. doi: 10.1212/WNL.0000000000201601,
41.
Broocks G Bendszus M Simonsen CZ Thomalla G Gizewski ER Aamodt AH et al . Net water uptake at CT predicts the treatment effect of thrombectomy for low ASPECTS stroke. Radiology. (2025) 317:e250708. doi: 10.1148/radiol.250708,
Summary
Keywords
acute ischemic stroke, brain edema, net water uptake, nomogram, prognosis
Citation
Li X, Xiong Q, Zeng W, Wen Y, Liu X and Li Y (2026) Net water uptake and ASPECTS in predicting futile recanalization for acute large vessel occlusion stroke: insights from time window stratification. Front. Neurol. 17:1741637. doi: 10.3389/fneur.2026.1741637
Received
07 November 2025
Revised
20 January 2026
Accepted
22 January 2026
Published
04 February 2026
Volume
17 - 2026
Edited by
Felix Ng, University of Melbourne, Australia
Reviewed by
Xiaoqing Cheng, Nanjing General Hospital of Nanjing Military Command, China
Mingjun Pu, Mianyang Central Hospital, China
Updates
Copyright
© 2026 Li, Xiong, Zeng, Wen, Liu and Li.
This is an open-access article distributed under the terms of the Creative Commons Attribution License (CC BY). The use, distribution or reproduction in other forums is permitted, provided the original author(s) and the copyright owner(s) are credited and that the original publication in this journal is cited, in accordance with accepted academic practice. No use, distribution or reproduction is permitted which does not comply with these terms.
*Correspondence: Yongmei Li, lymzhang70@163.com
Disclaimer
All claims expressed in this article are solely those of the authors and do not necessarily represent those of their affiliated organizations, or those of the publisher, the editors and the reviewers. Any product that may be evaluated in this article or claim that may be made by its manufacturer is not guaranteed or endorsed by the publisher.