


- 1 Department of Medical Neurobiology, Institute for Medical Research Israel-Canada, Hadassah Medical School, The Hebrew University, Jerusalem, Israel
- 2 School of Engineering and Computer Science, The Hebrew University, Israel
- 3 Center for Spine Health, Cleveland Clinic, Cleveland, OH, USA
- 4 Department of Mechanical Engineering and Department of Bioengineering, University of California at Berkeley, Berkeley, CA, USA
- 5 The Interdisciplinary Center for Neural Computation, The Hebrew University, Jerusalem, Israel
Spinal neurons operate as a processing link that integrates descending and peripheral information and in turn, generates a specific yet complex muscle command. The functional organization of spinal circuitry during normal motor behavior dictates the way in which this translation process is achieved. Nonetheless, little is known about this organization during normal motor behavior. We examined the spatial organization of neural activity in the cervical spinal cord of behaving primates performing an isometric wrist task by estimating the averaged intraspinal activity of neuronal populations. We measured population response profiles and frequency content around torque onset and tested the tendency of these profiles to exhibit a specific organization within the spinal volume. We found that the spatial distribution of characteristic response profiles was non-uniform; namely, sites with a specific response profile tended to have a preferred spatial localization. Physiologically, this finding suggests that specific spinal circuitry that controls a unique feature of motor actions (with a particular task-related response pattern) may have a segregated spinal organization. Second, attempts to restore motor function via intraspinal stimulation may be more successful when the spatial distribution of these task-related profiles is taken into account.
Introduction
Spinal neurons are a critical element in integrating descending motor commands and converging peripheral inputs to generate a motor action (Baldissera et al., 1981). This integration process is achieved via an extensive spinal network which includes different types of neuronal elements (Jankowska, 1992). While this network was shown to have a clear anatomical organization composed of laminas (in the dorso-ventral axis) and segments (in the rostro-caudal axis), the functional organization of its elements during normal motor action is still under debate (Fetz et al., 2000).
Systematic mapping of spinal circuitry in spinalized frogs indicated that intraspinal stimulations produce a limited number of motor responses termed motor synergies (Giszter et al., 1993; Bizzi et al., 1995). The linear summation of these synergies (Mussa-Ivaldi et al., 1994) is used as a functional infrastructure for spinal translation of motor commands into motor actions. Further support for the existence of such functional modules in the spinal cord comes from experiments on cats (Alstermark et al., 1990, 1991; Pettersson et al., 1997, 2007; Alstermark and Ohlson, 2000; Mushahwar et al., 2002) and monkeys (Sasaki et al., 2004; Isa et al., 2006; Alstermark et al., 2007) and reveal an upper cervical set of neurons which may exert spinal control over reaching movements.
Recently, attempts have been made to use this presumed principle of spinal organization to restore function after spinal cord injury (Mushahwar and Horch, 1998; Aoyagi et al., 2004; Lau et al., 2007). Stimulating currents applied through chronically implanted stimulating electrodes produce near-natural movements in terms of muscle activation pattern, unlike the results obtained when using functional electric stimulation of individual muscles. The systematic mapping of spinal activity in behaving primates can thus shed light on the spatiotemporal organization of this system. Exploiting this organization could also help enhance intraspinal stimulation strategies.
The aim of this study was to explore the underlying organization of spinal activity in behaving monkeys. We recorded spinal activity from the cervical spinal cord of behaving monkeys performing an isometric wrist task and found that the torque-related responses of populations of spinal neurons had a characteristic spatial organization which was consistent across monkeys. We further tested the difference in the average signal power around torque onset relative to the rest period and found that spinal sites located at specific regions of the cord changed their frequency content in a similar manner. Most of the changes in power occurred in the low frequency regime (5–10 Hz), though site-specific modulations of power content also occurred at higher frequencies.
Our results indicate that spinal activity is not spatially homogenous; rather, this activity tends to cluster both in terms of torque-related response patterns and power content. Furthermore, some of the clusters were discontinuous, indicating local groups of activity patterns. It is argued that unique motor circuitries may have a segregated spinal organization.
Materials and Methods
Animals and Behavioral Task
A detailed description of the experimental setup is provided elsewhere (Asher et al., 2009). In short, two monkeys (Maccaca fascicularis, H and V) performed an isometric 2D wrist task with an instructed delay period. During task performance, the monkey held its hand in either a pronation or supination position and controlled a cursor on a computer screen by applying an isometric torque at the wrist (flexion/extension and radial/ulnar). A trial was initiated by the appearance of a central target. The monkey positioned the cursor inside the target by generating 0 torque for a rest period (500–600 ms). Then, eight peripheral targets appeared uniformly distributed around the center target at a fixed distance, defining the onset of a delay period. One of these peripheral targets was presented in a distinct color for 500 ms (cue). The disappearance of the central target (monkey H, 300–400 ms after cue onset; monkey V, 850–1200 ms) served as a “go” signal. The monkey then had to acquire the previously filled target by generating an isometric torque in the appropriate direction, and keep the cursor within the target box for an active torque period (350–750 ms). Subsequently, the peripheral targets disappeared and the central target reappeared. The monkey returned to the rest position and received a reward, after which the screen went blank for 1000–1500 ms and a new trial started.
Recording Sessions
We recorded spinal and cortical activity as described previously (Yanai et al., 2007). A spinal chamber was implanted above the cervical spinal cord (C6–T1). Extracellular single-unit activity (gain, 10K; bandpass filter, 300–6000 Hz) was recorded from spinal interneurons while the monkey performed the task. The principle criterion for selecting recording sites was the presence of stable single-unit activity. This provided an unbiased sampling of the spinal volume and a relative low incidence of sites from which motoneuron were recorded. A detailed anatomical map of recording sites is available in Figure A1 in Appendix.
All surgical and animal handling procedures were according to the National Institutes of Health Guide for the Care and Use of Laboratory Animals (1996), complied with Israeli law and were approved by the joint ethics committee (IACUC) of the Hebrew University. Hadassah Medical Center approved the study protocol for animal welfare. The Hebrew University is an AAALAC International accredited institute.
Data Analysis
Signal processing
All acquired raw signals were first normalized by dividing each signal by its maximum value; multiunit activity (MUA) was then extracted from them (Asher et al., 2009). This measure was obtained by digitally bandpass filtering (eight order Butterworth filter, 300–6,000 Hz) and rectifying the filtered signal. This process yielded an estimate of the local spiking activity in the vicinity of the recording electrode, which has been shown to provide a robust estimate of task-related activity (Stark et al., 2008; Asher et al., 2009). Note that in all subsequent analyses we used the mean MUA obtained by first aligning the signal on a specific behavioral event and then averaging. For these averages we pooled together trials involving different directions and postures.
K-means clustering
The MUA signal was aligned around torque onset time (TO) and the mean responses were computed from 500 ms before TO until 1500 ms after TO. To identify any tendency toward specific response profiles we used a K-means algorithm with K = 3 and a distance measure defined by the Cosine method:

where α is the angle between the vectors. This analysis was replicated 250 times to ensure stability of the results as the K-means algorithm chooses its starting position randomly. The reproducibility of this clustering was high, in that most of the initial seeding (∼75%) yielded the same clustering.
Average power spectrum density
The second measure used to estimate local neural activity was the change in the average power occurring after TO relative to the pre-cue period. For this purpose, we first computed the power spectrum in the range of 0–250 Hz of the average MUA for two different time windows: a test window spanning torque onset (0–600 ms after TO) and a baseline time window spanning 600 ms after the start of a trial (i.e., during the pre-cue period). The difference in power was then summed across all frequencies. The magnitude of the total difference was used for categorizing the sites into three categories: small, medium and large differences in power.
Graphical transformations
After analyzing single-monkey data separately we applied several transformations on the data to make it possible to combine the data across monkeys. This was necessary since the coordinate system was unique for each monkey and there was only an approximate match in recording sites (at the rostro-caudal, left–right, and dorso-ventral coordinates) between the two monkeys. On the rostro-caudal axis the data sets were shifted so that they would both be relative to a 0 point located in the middle between C5 and T1 (measured from the center of the two vertebrae). On the left–right and dorso-ventral axes we shifted the data points of monkey V so that the distributions of points in these two dimension and the two monkeys would have the same mean. Our aim was to have the two data sets aligned with respect to the same anatomical origin (as much as possible given the inherit inaccuracy of our measurements).
Untransformed data from monkey V are shown in Figure A2 in Appendix (for K-means analysis) and Figure A3 in Appendix (for average power spectrum density, AVPSD).
Results
We recorded spinal activity from two monkeys (H and V) for a total of 337 sites (139 and 198 sites respectively). Two different methods were used to quantify task-related modulations in spinal sites. A recording site was only considered valid if the monkey performed more than 30 correct trials during recordings from that site. In most cases, for a given set of medial–lateral (ML) and rostro-caudal (RC) coordinates we obtained data from different dorso-ventral (DV) locations. Note that as the criteria used for each analysis differed slightly, the number of sites used for each monkey and each analysis also differed slightly (Table 1).

Table 1. Number of sites available from each monkey and each analysis.
K-Means Clustering Analysis of Torque-Related Population Activity
We processed the raw unit signal to generate a measure that corresponded to the MUA from the local vicinity of the electrodes (∼100–200 μm) (Asher et al., 2009). The average MUA around torque onset (−500 to +1500 ms) was computed after pooling trials for all targets (eight) and hand postures (two). K-means clustering analysis was applied on the average signals obtained from the spinal recording sites (separately for each monkey). We used three centers (K = 3) based on our previous observations for single-unit data (Prut and Perlmutter, 2003) and the appearance of a slight bent at this value in the plot of the residual error vs. K (Figure 1A). Here we also used three clusters in order to capture the repertoire of neuronal responses (phasic, tonic, and inhibitory) from data obtained in a similar behavioral paradigm. Moreover, the number of clusters we used reflects a reasonable compromise between the richness of response patterns and the stability of clustering. Indeed, re-running the K-means algorithm using different seeds yielded the same results and thus supports this choice.
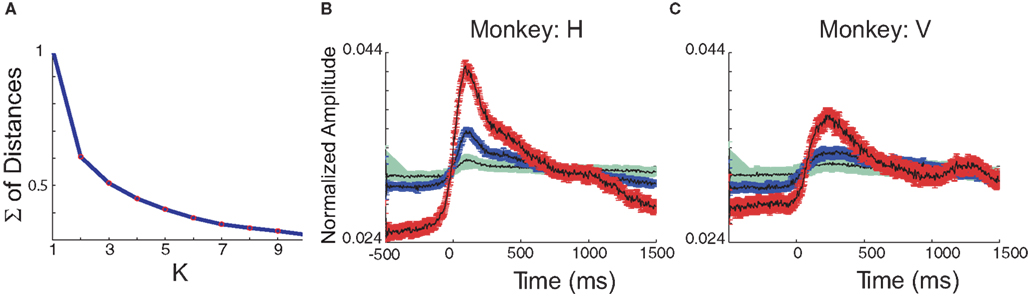
Figure 1. (A) Sum of distances from center in the K-means method for both monkeys averaged. (B,C) Center vectors for each cluster in monkey H (B) and V (C). Mean value and standard error of the means for each cluster.
Using this approach we found three distinct centers (Figures 1B,C) which appeared consistent across monkeys. Some of the observed differences in pattern could be accounted for by the different behavior exhibited by these monkeys (e.g., the broader onset response in monkey V could be explained by a slower movement exhibited by this monkey). The three centers included a prominent phasic response pattern (shown in red), a sustained tonic response (blue) and a slight increase in activation (green). These results are similar to previous analyses using single-unit data (Prut and Perlmutter, 2003) with the exception of the inhibitory responses that were not found here. The lack of an inhibitory profile in the current study was expected based on the strict-positivity of the MUA signal.
After substituting each point by its cluster affiliation, we examined the 3D distribution of these points (Figure 2). To simplify this approach we looked at the 2D projection of these clusters by projecting the points on two out the three axes (rostro-caudal, dorso-ventral, medio-lateral).
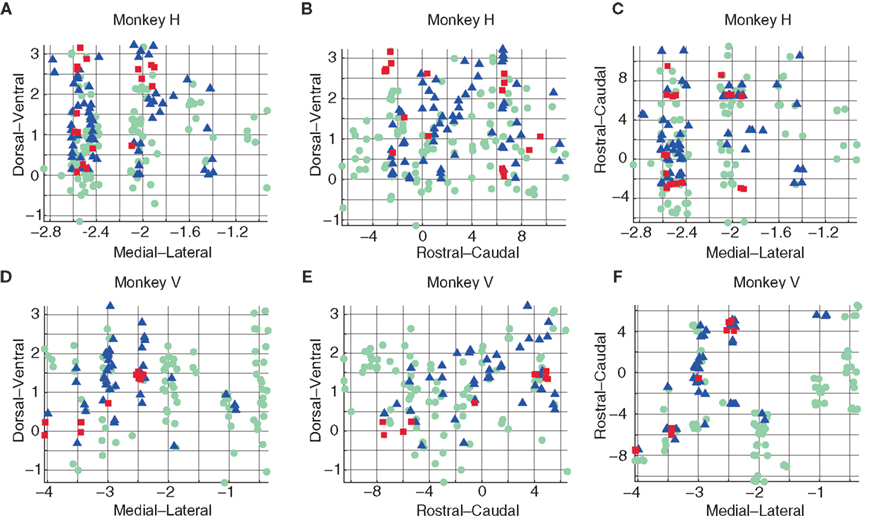
Figure 2. Spatial organization of K-means clusters for monkey H (A–C) and monkey V (D–F). DV–ML (A,D), DV–RC (B,E) and RC–ML (C,F) planes. Cluster 3 points (green, circle) were uniformly distributed throughout the planes. In contrast, points of cluster 2 (blue, triangle) and cluster 1 (red, square) exhibited non-uniform distributions: points of cluster 1 appeared in two patches, one in a rostral and one in a caudal location. Cluster 2 appeared to concentrate on the medial–ventral aspects of the 3D volume. The spatial organization of points belonging to different clusters was similar for the two monkeys.
We found that points belonging to cluster 3 (green, circle) were uniformly distributed in all the planes. However, points that were part of the other two clusters had a non-uniform distribution. Specifically, points in cluster 1 (red, square) tended to appear in two patches: one in a rostral and one in a caudal position (in the RC–ML plane, Figures 2C,F). Points in cluster 2 (blue, triangle) tended to concentrate in the medial–ventral aspects of the 3D volume (Figures 2A–F). By comparing the spatial distribution of the sets of points we found a significant tendency for distinct spatial distributions between nearly all sets (Tables 2–4, p < 0.05 2D Kolmogorov–Smirnov goodness of fit test).
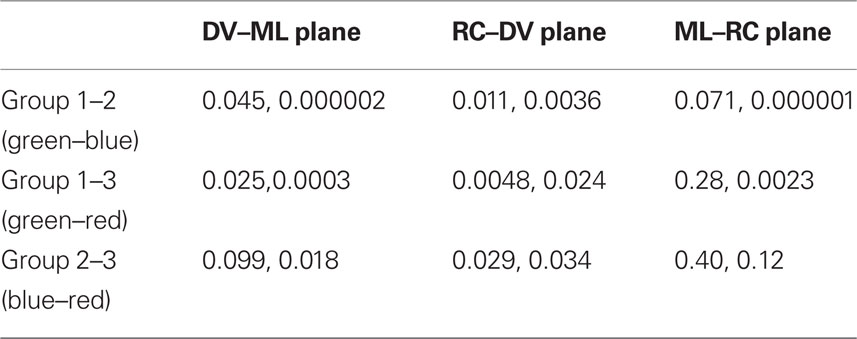
Table 2. Significance levels for 2D K–S test applied on types of points as defined by the K-means test (Monkeys H, V).
Note that the least significant results for spatial distribution were obtained for tests conducted in the ML–RC plane (Figures 2C,F).
We further analyzed the data using the same method but aligned around different behavioral events. Figure A4 in Appendix shows the results obtained for data collected around cue onset instead of torque onset. Note that in this case the responses are nearly homogenous with no clear clustering into different response profiles.
Average Power Spectrum Density
We quantified the average change in power in the time window after torque onset relative to the pre-cue period. For this purpose we calculated the difference in the AVPSD after torque onset relative to the pre-cue (rest) period in the 0–250 Hz range.
The distribution of the difference for the two monkeys is shown in Figure 3. This distribution was then manually divided into three non-overlapping regions to translate the single-site data into three groups. We used the same binning for the two monkeys.
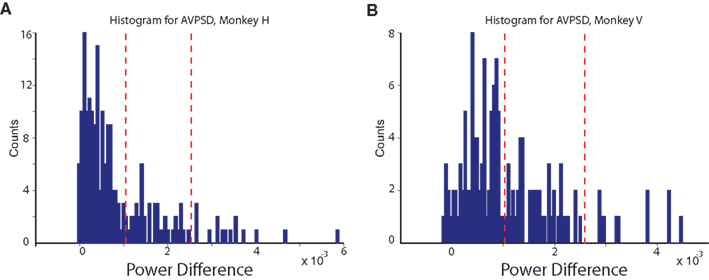
Figure 3. AVPSD method. Distributions of power differences in a frequency range of 0–250 Hz. The histograms were then binned into three non-overlapping groups (indicated by red dashes). (A) Histogram obtained for monkey H. (B) Histogram obtained for monkey V.
Note that here the group number reflects the magnitude of the average change in power in the tested frequency band. We then examined the spatial distribution of the points obtained using this method (Figure 4).
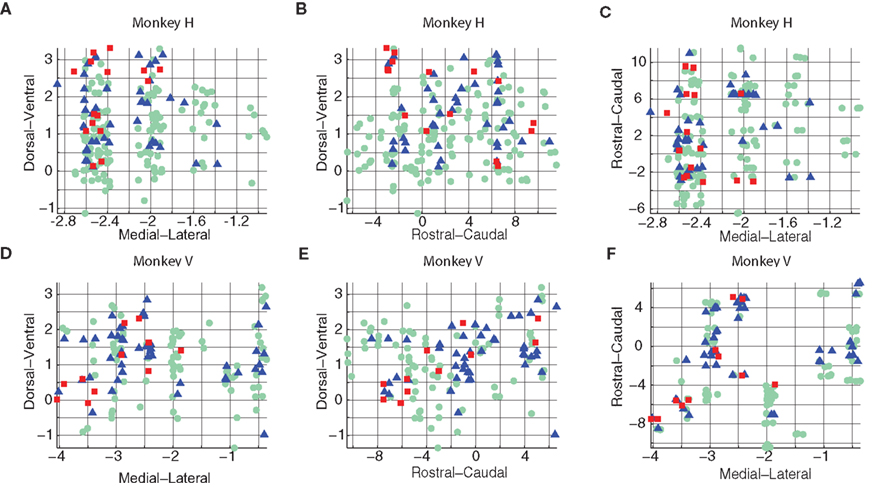
Figure 4. Cluster distribution types computed by the AVPSD method. Data for monkey H (A–C) and monkey V (D–F) is presented in different planes: Dorsoventral–Mediolateral (A,D), Dorsoventral–Rostrocaudal (B,E), and Rostrocaudal–Mediolateral (C,F).
We further tested the spatial distribution of points as defined in the AVSPD method but by using a narrower band of frequencies compared to the spectrum (0–250 Hz).
The histogram of the power difference (around torque onset relative to pre-cue period) had a very similar shape to the one obtained when using the full spectrum; however the values were largest when using lower frequency bands (especially in the 5–10 Hz band). The observed spatial distribution was almost identical when using different frequency bands. This indicates that around torque onset there was a general increase in power across frequencies rather than an increase in a specific frequency band.
We found a general similarity between the results obtained via this method and results obtained using K-means clustering of the evoked response (Figure 2) in terms of the spatial distribution of points. Cluster 3 (green, circle) tended to distribute uniformly over all the planes, whereas the other two clusters had a different distribution. Cluster 1 (red, square) appeared in the medial–ventral position, whereas cluster 2 (blue, triangle) was found in the cluster 1 (red, square) area and the vicinity. A 2D Kolmogorov–Smirnov test (Table 3) showed enhanced independence between group 1 and 3, and group 1 and 2.
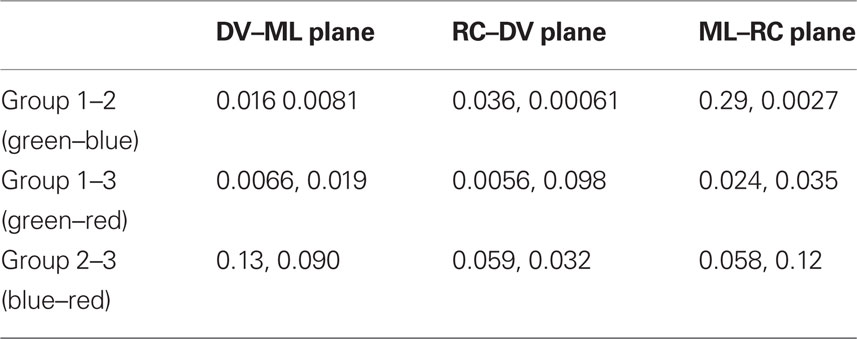
Table 3. Significance levels for 2D K–S test applied on distribution of types obtained by the AVPSD method (monkeys H, V).
Consistency of Results Across Monkeys
To estimate the similarity of the results obtained for the two monkeys, we first combined the data from the two monkeys. As data points (electrode tracks) obtained from the two monkeys were not necessarily aligned, we first transformed the 3D distribution of points into the same scale by linear projection (see Materials and Methods). Note that the data were combined after defining the response pattern for each point (using either the K-means or the AVPSD method). Figure 5 shows the combined results when using the K-means method, and the results of the statistical test for 2D independence are shown in Table 4.
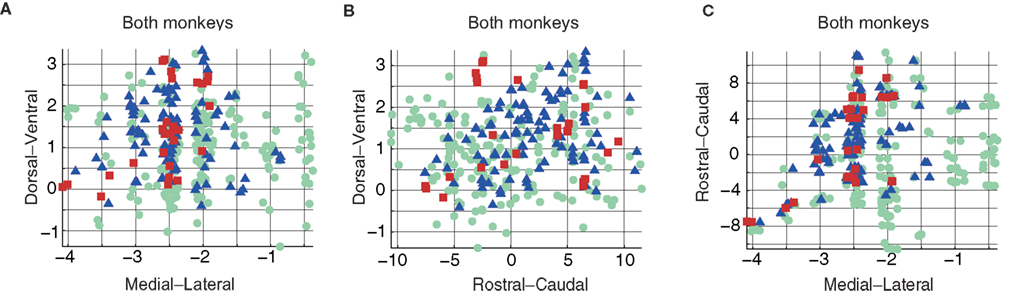
Figure 5. Combined results for both monkeys using the K-means method. DV–ML (A), DV–RC (B), and RC–ML (C) planes.
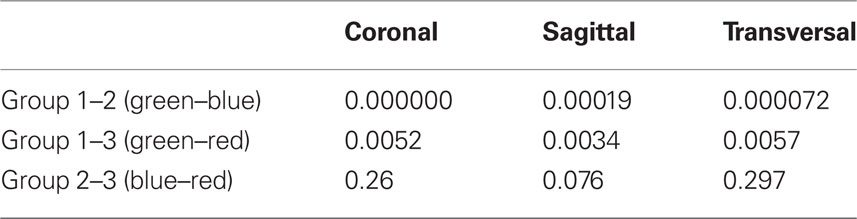
Table 4. Significance levels for 2D K–S test applied on types of points as defined by the K-means test (data from both monkeys combined).
The results of the AVPSD method are shown in Figure 6 and Table 5.
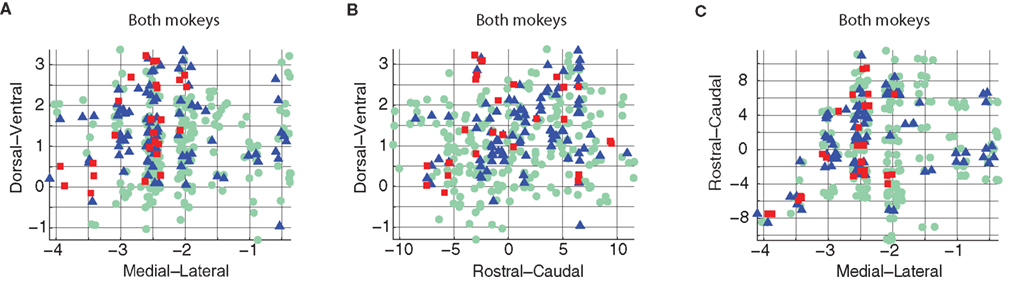
Figure 6. Combined results from both monkeys using the AVPSD method. DV–ML (A), DV–RC (B), and RC–ML (C) planes.

Table 5. Significance levels for 2D K–S test applied on types of points as defined by the AVPSD method (data from both monkeys combined).
The combined results show increased independence compared to the results for the single-monkey data. This indicates that the distribution properties were consistent in the two monkeys. Consequently, pooling more data (with the same characteristics) yielded a higher level of significance.
As our sampling of the spinal volume was not uniform, we applied a non-parametric test to verify the results obtained from the 2D K–S test. We used a random shuffling method in which we randomly assigned a response pattern (1–3) to spatial locations while keeping the relative frequency of each of the response patterns (as shown in Figures 2 and 4) constant. We then applied the 2D K–S tests on the randomly shuffled data. For each random pattern we counted the number of tests that were significant out of the eight possible tests. This procedure was repeated 3500 times and was carried out separately for the K-means and the AVPSD labeling system. The fraction of random patterns for which we had significant tests that were equal to or higher than the number obtained for the real data was less than 1%.
Discussion
Spinal anatomy is clearly organized in the dorso-ventral, medial–lateral, and rostro-caudal axes. Nevertheless the reflection of this underlying anatomical organization in relation to the properties of motor-related activity remains unclear. Early studies showed the existence of spinal modules in spinalized frogs (Bizzi et al., 1995) and intact cats (Mushahwar et al., 2002). In this study we present the first demonstration of spinal modular organization in behaving primates. We show that task-related activity in the spinal cord can be classified into distinct groups. We identified three different groups: one large group which was only weakly related to the task and exhibited a homogenous spatial distribution, a second group which was compactly organized in the cervical volume, and a third smaller group that appeared in either the upper or the lower cervical locations. The two latter groups were strongly task-related but differed in their sensitivity to torque onset and torque offset. While on a macroscopic scale clustering was apparent, some overlap was present between different clusters, indicating that at a given site diverse patterns of task-related activity can be found.
There is evidence (Prut and Perlmutter, 2003) that task-related activity of spinal neurons can be clustered into several distinguishable patterns, and that nearby neurons tend to exhibit similar task-related patterns. Together, these two findings warrant our attempt to study the organization of spinal activity using the MUA signal. The fact that in the AVPSD method the largest change in power was found in the low frequency range may reflect the recruitment and initial firing of large spinal motor neurons. Nevertheless, further testing is required to confirm or reject this hypothesis. Note however that it is expected that pooling data from different torque-directions and hand postures as was done here to increase the signal-to-noise ratio may mask any finer organization of local activity in a directional-related manner, as was reported in other studies (Bizzi et al., 2008).
Additionally, several other limitations of the methods should be mentioned. First, despite our efforts to uniformly sample the cervical gray matter, the actual distribution of recording sites was both biased and different between the two monkeys. To compensate for these differences so that pooling data from the two monkeys would be possible we used a minimal linear graphical transformation which shifted the actual recording sites.
Furthermore, while the organization of task-related activity into distinguishable subsets with a unique spatial organization appears congruent with previous studies (Bizzi et al., 2008) and may thus suggest that spinal circuitry is organized into modules, there are several notable differences between the two approaches. The most crucial is the fact that here we concentrated on a global task-related activity whereas previous studies have focused on the output impact of spinal sites on working muscles. Further research is needed to test the associations between the innate organization of activity studied here and the effects of specific spinal sites on muscles and movements.
The appearance of one group that had a bimodal rostro-caudal distribution is consistent with previous findings suggesting the existence of a C3–C4 propriospinal system in primates (Alstermark et al., 2007). This system is thought to exert more global control on reaching movements and acts in parallel to the specific control on actions exerted by the segmental circuitry. In our paradigm we cannot distinguish between a coordinating role (presumably mediated by the upper cervical system) and a specific control (mediated by segmental circuitry); nevertheless we found a spatially non-continuous spinal representation of motor actions.
From a more practical standpoint, recent progress has been made in the use of chronically implanted electrodes for intraspinal stimulations (Mushahwar et al., 2007). This approach targets the innate and preserved spinal circuitry by using stimulation which is aimed to produce near-natural movement. When control over voluntary movements is lost due to spinal injury or supra-spinal damage, intraspinal stimulation could be implemented to restore motor capacity. Our findings indicate that some spinal sites are more related to movement in a way which is consistent across monkeys. This finding suggests that the placement of stimulating spinal electrodes should not be uniform in the spinal gray matter but rather should follow the spatial organization of these modules. Clearly the relation between ongoing spinal activity (as was used in this study) and the expected impact of intraspinal stimulation are not necessarily simple or predictable. Nevertheless is seems reasonable to speculate, based on our results, that spinal stimulation in some sites (e.g., those sites that exhibited robust phasic response pattern around torque onset) will induce a more profound movement of forelimb muscles compared with other sites (e.g., those in which the torque-relate response pattern was weak and tonic) in which we may expect that stimulation will invoke increase rigidity of joints with no clear movement (Mushahwar et al., 2000). One of the fact that may complicate the relations between ongoing spinal activity and the expected response evoked by intraspinal stimulation is the fact that MUA reflect activity cell soma while stimulation are more likely to recruit nearby axons (Jankowska and Roberts, 1972; Gaunt et al., 2006).
Here again further studies on the relations between local activity and their impact on working muscles is needed.
Conflict of Interest Statement
The authors declare that the research was conducted in the absence of any commercial or financial relationships that could be construed as a potential conflict of interest.
Acknowledgments
This study was supported by the Israel Science Foundation grants (ISF-1355/05, 1490/09), the Binational Science Foundation (BSF2007442), and generous contributions from the Rosetrees Foundation and the Baruch Foundation.
References
Alstermark, B., Isa, T., Kummel, H., and Tantisira, B. (1990). Projection from excitatory C3–C4 propriospinal neurones to lamina VII and VIII neurones in the C6-Th1 segments of the cat. Neurosci. Res. 8, 131–137.
Alstermark, B., Isa, T., Pettersson, L. G., and Sasaki, S. (2007). The C3–C4 propriospinal system in the cat and monkey: a spinal pre-motoneuronal centre for voluntary motor control. Acta Physiol. (Oxf.) 189, 123–140.
Alstermark, B., Isa, T., and Tantisira, B. (1991). Integration in descending motor pathways controlling the forelimb in the cat. 18. Morphology, axonal projection and termination of collaterals from C3–C4 propriospinal neurones in the segment of origin. Exp. Brain Res. 84, 561–568.
Alstermark, B., and Ohlson, S. (2000). Origin of corticospinal neurones evoking monosynaptic excitation in C3–C4 propriospinal neurones in the cat. Neurosci. Res. 38, 249–256.
Aoyagi, Y., Mushahwar, V. K., Stein, R. B., and Prochazka, A. (2004). Movements elicited by electrical stimulation of muscles, nerves, intermediate spinal cord, and spinal roots in anesthetized and decerebrate cats. IEEE Trans. Neural Syst. Rehabil. Eng. 12, 1–11.
Asher, I., Zinger, N., Yanai, Y., Israel, Z., and Prut, Y. (2009). Population-based corticospinal interactions in macaques are correlated with visuomotor processing. Cereb. Cortex. 20, 241–252.
Baldissera, F., Hultborn, H., and Illert, M. (1981). “Integration in spinal neuronal systems,” in The Nervous System, eds J. M. Brookhart and V. B. Mountcastle (Bethesda: American Physiological Society), 509–595.
Bizzi, E., Cheung, V. C., d’Avella, A., Saltiel, P., and Tresch, M. (2008). Combining modules for movement. Brain Res. Rev. 57, 125–133.
Bizzi, E., Giszter, S. F., Loeb, E., Mussa-Ivaldi, F. A., and Saltiel, P. (1995). Modular organization of motor behavior in the frog’s spinal cord. Trends Neurosci. 18, 442–446.
Fetz, E. E., Perlmutter, S. I., and Prut, Y. (2000). Functions of mammalian spinal interneurons during movement. Curr. Opin. Neurobiol. 10, 699–707.
Gaunt, R. A., Prochazka, A., Mushahwar, V. K., Guevremont, L., and Ellaway, P. H. (2006). Intraspinal microstimulation excites multisegmental sensory afferents at lower stimulus levels than local alpha-motoneuron responses. J. Neurophysiol. 96, 2995–3005.
Giszter, S. F., Mussa-Ivaldi, F. A., and Bizzi, E. (1993). Convergent force fields organized in the frog’s spinal cord. J. Neurosci. 13, 467–491.
Isa, T., Ohki, Y., Seki, K., and Alstermark, B. (2006). Properties of propriospinal neurons in the C3–C4 segments mediating disynaptic pyramidal excitation to forelimb motoneurons in the macaque monkey. J. Neurophysiol. 95, 3674–3685.
Jankowska, E. (1992). Interneuronal relay in spinal pathways from proprioceptors. Prog. Neurobiol. 38, 335–378.
Jankowska, E., and Roberts, W. J. (1972). Synaptic actions of single interneurones mediating reciprocal Ia inhibition of motoneurones. J. Physiol. 222, 623–642.
Lau, B., Guevremont, L., and Mushahwar, V. K. (2007). Strategies for generating prolonged functional standing using intramuscular stimulation or intraspinal microstimulation. IEEE Trans. Neural Syst. Rehabil. Eng. 15, 273–285.
Mushahwar, V. K., Collins, D. F., and Prochazka, A. (2000). Spinal cord microstimulation generates functional limb movements in chronically implanted cats. Exp. Neurol. 163, 422–429.
Mushahwar, V. K., Gillard, D. M., Gauthier, M. J., and Prochazka, A. (2002). Intraspinal micro stimulation generates locomotor-like and feedback-controlled movements. IEEE Trans. Neural Syst. Rehabil. Eng. 10, 68–81.
Mushahwar, V. K., and Horch, K. W. (1998). Selective activation and graded recruitment of functional muscle groups through spinal cord stimulation. Ann. N.Y. Acad. Sci. 860, 531–535.
Mushahwar, V. K., Jacobs, P. L., Normann, R. A., Triolo, R. J., and Kleitman, N. (2007). New functional electrical stimulation approaches to standing and walking. J. Neural Eng. 4, S181–S197.
Mussa-Ivaldi, F. A., Giszter, S. F., and Bizzi, E. (1994). Linear combinations of primitives in vertebrate motor control. Proc. Natl. Acad. Sci. U.S.A. 91, 7534–7538.
Pettersson, L. G., Alstermark, B., Blagovechtchenski, E., Isa, T., and Sasaski, S. (2007). Skilled digit movements in feline and primate – recovery after selective spinal cord lesions. Acta Physiol. (Oxf.) 189, 141–154.
Pettersson, L. G., Lundberg, A., Alstermark, B., Isa, T., and Tantisira, B. (1997). Effect of spinal cord lesions on forelimb target-reaching and on visually guided switching of target-reaching in the cat. Neurosci. Res. 29, 241–256.
Prut, Y., and Perlmutter, S. I. (2003). Firing properties of spinal interneurons during voluntary movement. II. Interactions between spinal neurons. J. Neurosci. 23, 9611–9619.
Sasaki, S., Isa, T., Pettersson, L. G., Alstermark, B., Naito, K., Yoshimura, K., Seki, K., and Ohki, Y. (2004). Dexterous finger movements in primate without monosynaptic corticomotoneuronal excitation. J. Neurophysiol. 92, 3142–3147.
Stark, E., Globerson, A., Asher, I., and Abeles, M. (2008). Correlations between groups of premotor neurons carry information about prehension. J. Neurosci. 28, 10618–10630.
Keywords: spinal cord, MUA, neural modules, intraspinal stimulation, motor control
Citation: Sher Y, Cohen O, Zinger N, Harel R, Rubinsky B and Prut Y (2010) Spatiotemporal organization of neuronal activity in the cervical cord of behaving primates. Front. Neurosci. 4:195. doi: 10.3389/fnins.2010.00195
Received: 09 May 2010;
Accepted: 09 November 2010;
Published online: 25 November 2010.
Edited by:
Eberhard E. Fetz, University of Washington, USAReviewed by:
Chet T. Moritz, University of Washington, USAReggie Edgerton, University of California, Los Angeles, USA
Copyright: © 2010 Sher, Cohen, Zinger, Harel, Rubinsky and Prut. This is an open-access article subject to an exclusive license agreement between the authors and the Frontiers Research Foundation, which permits unrestricted use, distribution, and reproduction in any medium, provided the original authors and source are credited.
*Correspondence: Yifat Prut, Department of Medical Neurobiology, The Hebrew University-Hadassah Medical School, P.O. Box 12272, Jerusalem 91120, Israel. e-mail:eWlmYXRwckBla21kLmh1amkuYWMuaWw=