 Noah Levine-Small1
 Ziv Yekutieli2
 Jonathan Aljadeff2 Stefano Boccaletti2,3
 Eshel Ben-Jacob2*
 Ari Barzilai1*
- 1 George S. Wise Faculty of Life Sciences, Department of Neurobiology, Tel Aviv University, Tel Aviv, Israel
- 2 Faculty of Exact Sciences, School of Physics and Astronomy, Tel Aviv University, Tel Aviv, Israel
- 3 The Italian Embassy in Israel, Tel Aviv, Israel
Many neurodegenerative diseases are characterized by malfunction of the DNA damage response. Therefore, it is important to understand the connection between system level neural network behavior and DNA. Neural networks drawn from genetically engineered animals, interfaced with micro-electrode arrays allowed us to unveil connections between networks’ system level activity properties and such genome instability. We discovered that Atm protein deficiency, which in humans leads to progressive motor impairment, leads to a reduced synchronization persistence compared to wild type synchronization, after chemically imposed DNA damage. Not only do these results suggest a role for DNA stability in neural network activity, they also establish an experimental paradigm for empirically determining the role a gene plays on the behavior of a neural network.
Introduction
A hallmark of neurodegenerative diseases is impairment of certain aspects of “brain functionality.” Brain functionality is defined as the total input and output of the brain’s neural circuits and networks. A given neurodegenerative disorder does not deregulate total brain functionality but rather the activity of specific circuits in a given network, affecting their organization and topology, their cell numbers, their cellular functionality, and the interactions between neural circuits. The brain circuits are highly complex thus; to study the effect of disease on network activity one should devise simple model system to do so. The interrelations between various types of DNA damage and neural activity were scarcely studied due to the lack of proper experimental model systems.
An aberrant response to DNA lesions is implicated in many human neurodegenerative disorders (reviewed in Abner and McKinnon, 2004; Su, 2006; Barzilai et al., 2008). In healthy cells, the accumulated DNA damage is rapidly detected, leading to activation of an intricate web of signaling pathways known as the DNA damage response (DDR). On the other hand, in cells with neurodegenerative dysfunction some components of the DDR machinery are impaired (reviewed in Barzilai et al., 2008). Under normal conditions this response culminates in activation of cell-cycle checkpoints and appropriate DNA-repair pathways and in certain contexts, initiation of cell death programs. The DDR is a hierarchical process executed through a series of steps. The DNA lesions are detected by sensor proteins that recognize the lesions themselves or chromatin alterations that may result from the DNA damage. Transducers are then brought into action to convey the damage signal to downstream effectors. It is this relay system from transducers to effectors that enables a single DNA lesion to modulate numerous pathways. The transducers might also be involved in the assembly of DNA-repair complexes at the sites of DNA damage (reviewed in Zhou and Elledge, 2000; Iliakis et al., 2003; Shiloh, 2003; Su, 2006). Following DSB induction, Atm is activated and a portion of nuclear Atm binds to DSB sites (Andegeko et al., 2001; Meyn et al., 2003) Part of the activation process of Atm involves autophosphorylation of serine 1981 and subsequent dissociation of inactive Atm dimers into active monomers (Bakkenist and Kastan, 2003). The fraction of Atm that binds is also autophosphorylated (Uziel et al., 2003), but recent data indicate that this autophosphorylation is not necessary for Atm recruitment to damage sites (Meyn et al., 2003). Activation of the Atm kinase seems to be an initiating event in cellular responses to irradiation. Atm may be activated by various stresses in addition to DSBs (Kurz and Lees-Miller, 2004). Downstream of the transducer proteins are targets that control various cellular processes such as DNA repair, cell-cycle progression, gene transcription, protein synthesis and degradation, and apoptosis.
The Atm protein was identified as the product of the gene that is mutated in the human genetic disease ataxia-telangiectasia (A-T). The A-T syndrome is characterized by progressive cerebellar degeneration, immunodeficiency, genome instability, premature aging, gonadal dysgenesis, extreme radiosensitivity, and high incidence of lymphoreticular malignancies (for review, see Lavin and Shiloh, 1997; Biton et al., 2008). One of the most devastating symptoms of A-T – cerebellar ataxia – develops progressively into general motor dysfunction. One of the main causes of death of A-T patients is aspiration due to cerebellar-related swallowing defects. Post-mortem studies reveal a significant loss of Purkinje and granule neurons in the cerebellum of children with A-T.
A major tool in the investigation of human genetic disorders is the corresponding knockout mice. Atm-deficient mice exhibit many of the characteristics of human A-T, such as retarded growth, immunodeficiency, cancer predisposition, radiosensitivity, infertility, and a cellular phenotype similar to that of A-T cells, but they barely show the most cardinal feature of A-T – neuronal degeneration and associated neuromotor dysfunction (Barlow et al., 1996; Elson et al., 1996; Xu et al., 1996; Borghesani et al., 2000). Careful analysis of Atm-deficient mice did show subtle neurological abnormalities in several instances (Kuljis et al., 1997; Eilam et al., 1998, 2003; Barlow et al., 1999; Watters et al., 1999; Borghesani et al., 2000; Chiesa et al., 2000; Allen et al., 2001; Watters, 2003; Mount et al., 2004), and in vitro survival of Atm−/− Purkinje cells and their dendritic branching were reduced compared to wild type (WT) cells (Chen et al., 2003; Gueven et al., 2006).
Since A-T is characterized by severe loss of motor coordination and movement synchronization, it is important to study these features on the network level by parallel recording of many neurons. The concept of using micro-electrode arrays (MEAs) for recording from and/or stimulating neural tissue or cell cultures stemmed from the need of parallel recording of multiple electrophysiological events. Cultured neural networks grown on MEA provide a suitable neuro-electronic system interfacing tens of neurons in parallel. Growing the cultures on MEA enable to monitor in parallel and non-invasively the electrical activity of many neurons over long periods of time, up to several months (Wheeler and Brewer, 1994; Potter, 2001; Segev and Ben-Jacob, 2001; Segev et al., 2002, 2003, 2004). Investigation the system level activity of neural networks derived from WT and transgenic mice cultivated on MEA provide a relatively simple and well-controlled model system for investigating the effect of DNA damage on various factors of the neuronal activity. Here we report that Atm deficiency leads to reduced synchronization persistence, a phenomenon that significantly intensified following chemically imposed DNA damage, whereas, in comparison, WT networks showed sustained synchronization even following induced DNA damage.
Materials and Methods
Transgenic Mice
Generation of Atm-deficient and WT mice, Atm+/− mice (Barlow et al., 1996) were enabled thanks to a generous gift from Dr. Anthony Wynshaw-Boris (University of California, San Diego, CA, USA). Offspring of these mice were genotyped using PCR-based assays based on mouse-tail DNA prepared with the GenElute Mammalian Genomic DNA Miniprep kit (Sigma, St. Louis, MO, USA). Mice in this study have SV129 background. All the experiment with mice are compliant with minimal standards as defined by the National Institutes of Health Guide for the Care and Use of Laboratory Animals and approved by the Institutional Animal Care and Use Committee of the Tel Aviv University.
Neural Network Recordings
In order to record the electrical activity of many neurons in parallel we used MEA chips (MultiChannel Systems, Reutlingen, Germany). Each chip contains 60 substrate-integrated thin film, titanium nitride (TiN), circular, 30 μm in diameter electrodes (Figure 1). The impedance of an electrode ranges between 100 and 400 kΩ, the average noise is 10 μV peak to peak, and their bandwidth of 0.01–3 kHz permits the recording of individual spikes. All low pass filters and low-noise amplifiers are integrated on a single board (B-MEA-1060, amplifier, gain ×2000 with band pass filter 200–5000 Hz, multi channel systems), thus no external electronic devices are necessary, and the AC components caused by ground loops are reduced. The manufactured electrodes are arranged in several different setups with varying spacing’s (between 200 and 1000 μm). A typical electrode covers an overall of about 2–20 mm2 out of the entire 3 cm2 area. The control and basic reference networks used in this study were homogeneous cultured networks grown on MEA for parallel recording of the activity of tens of neurons.
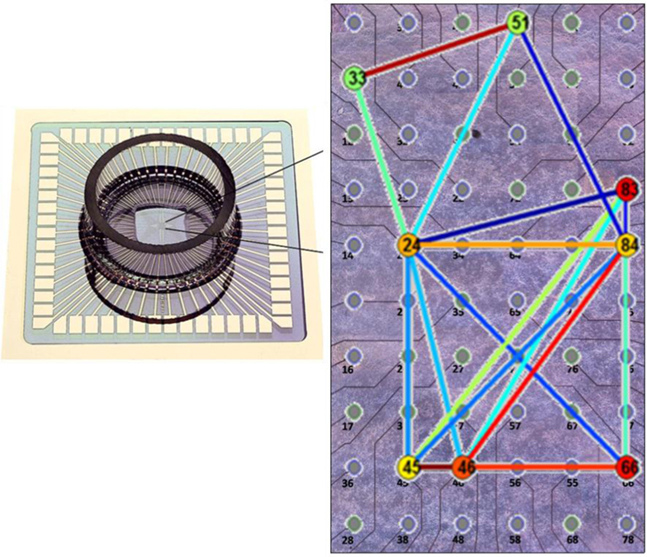
Figure 1. Experimental setup for multicellular recording. On the left, a Micro-Electrode Array chamber for recording dissociated primary neural cell cultures. On the right, a magnified image of the planar recording surface. Thin lines represent traces which terminate at circular electrode pads capable of recording the membrane potential changes of nearby neurons. The colored lines, as in the real space diagrams of represent phase synchronization links between neurons adjacent to their respective electrodes. The colored circles overlaying the electrodes represent the centrality of the electrode. (Photos by MultiChannel Systems, Reutlingen, Germany, overlay by authors).
Micro-Electrode Array Preparation
Micro-Electrode array were purchased from (MultiChannel Systems, Reutlingen, Germany). The MEA’s were sterilized according to the manufacturer‘s instructions. MEAs were washed with 70% EtOH, air dried on a sterile Petri dish, with UV on, in a laminar flow hood. MEA were then coated with 1 mg/ml poly D lysine (PDL) and left to stand overnight in covered Petri dish. The following day, electrodes were washed 4× with 0.22 μM filtered autoclaved DDW. MEA plates were placed onto custom fabricated square plastic clip with the electrodes face up. Thin slices of double-sided tape are adhered to a custom-made white plastic o-ring. The o-ring is firmly attached to the MEA plate. The inner wall of the plastic o-ring is coated with Silicon sealant, a glass cylinder is inserted and a plastic cap. The square plastic frame is disengaged.
Preparation of Cortical Neuronal Cultures
Post-natal day 1 (P1) mice (WT and Atm−/−) were decapitated. The entire brains were excised into room temperate L-15 medium. Meninges were removed, left and right cortices placed in 8 ml 0.06% w/v trypsin solution inserted in its place. The cortex in trypsin was incubated at 37°C for 15 min, occasionally rotating. After removing trypsin, the tissue was washed once with MEM growth medium. Mechanical disaggregation of cells was performed through repeated pipetting followed by centrifugation for 4 min at 300 g. The medium was replaced with 4 ml fresh 37°C MEM growth medium and re-disaggregated. Filter using gross cell strainer (BD Falcon, 70 μm, BD Bioscience, ON, Canada). One million cells were plated in 3 ml MEM growth medium per MEA. Large networks of about 2 cm2 area and about 1 × 10⁶ neurons were prepared.
Induction of DNA Damage by NCS
In order to simulate the long term accumulation of DNA Damage, we induced double strand breaks to WT and Atm−/− cultures, using Neocarzinostatin (NCS). The use of NCS to induce double strand breaks in studies involving Atm is widely documented (Povirk, 1996; Banin et al., 1998). At least 10 h of control recordings were performed prior to NCS introduction to both networks in each experiment. NCS was always dissolved in room temperature, pH matched medium to a final concentration of 500 ng/ml of NCS. NCS was light deactivated after a 30-min exposure. All NCS was from the same stock solution.
Data Pre Processing
The data were discriminated and sorted through Hulata et al. (2002) wavelet packet discrimination method – such that individual neurons could reliably be separated even if recorded from an individual channel. With that, multiple neurons on one channel was a rare occurrence and thus Hulata et al.’s (2000) method was primarily used to separate noise from spikes. The data were also sorted via simple detection of spike peaks to control for any possible artifacts introduced through sorting.
Firing Rate
We define “firing rate” as the count of spikes recorded from the entire network in a given bin of time such that the units are spikes per second. As demonstrated in Figure 2, at high enough resolutions (short time windows) this firing rate will reflect the synchronized nature of bursting, with periodic peaks at the location of synchronized bursting events (SBE) and troughs at periods between bursts. At lower resolutions this measure will give an indication of the global network rate of activity.
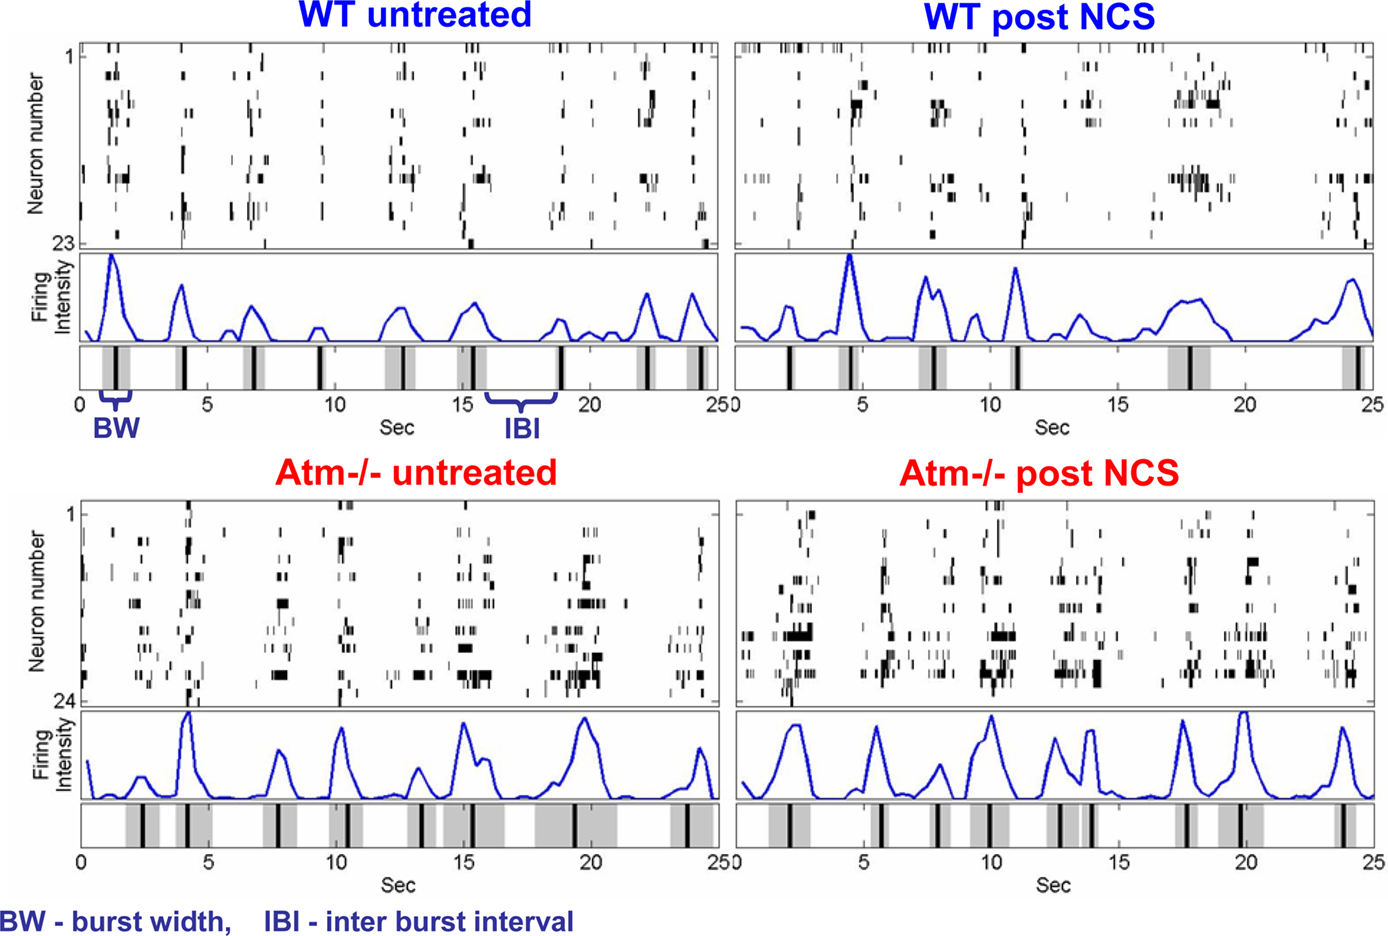
Figure 2. Raster plots, firing rate, and burst detection in WT and Atm-deficient cultures. A raster plot of the network’s activity, shown in (top window), each black line in a row represents a detected spike of a neuron in time. The grouping in time of neuron spikes into bursting events demonstrates a characteristic spatio-temporal structure (fingerprint). (Middle window), we plot the number of spikes per second as a function of time window. We define the peaks of the population activity as the temporal loci of synchronized bursting events (SBE). (Bottom window) Application of the burst detection algorithm (as explained in the Appendix) yields temporal loci of SBEs (black vertical lines), along with their corresponding width (gray regions).
Individual Neuron Firing Rate
The first step in analyzing the behavior of the different cultures was to examine the behavior of each neuron separately. We did that in order to make sure all the neurons survived the duration of the experiment and did not indicate any major change in activity, which might indicate external noise or any other artifact. By doing so we make sure the further analysis of our network will not be biased by such artifacts. Figure 3 is one example showing that the individual neuron activity remains fairly constant throughout the recording session.
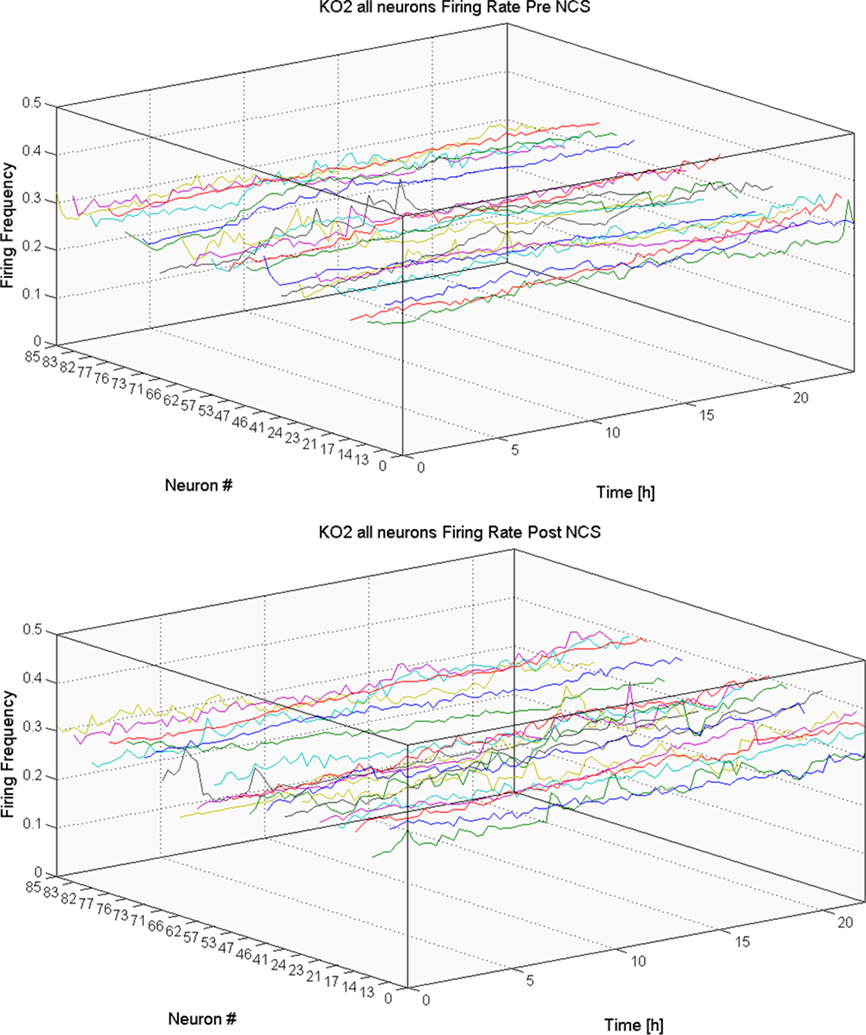
Figure 3. Firing activity of individual neurons. In this figure we examine the firing rate of each electrode individually for a given culture, before introducing Neocarzinostatin (above), and after (below). We note that the firing rate remains fairly constant throughout the recording session and fairly similar in all the electrodes. Similar behavior is noticed for all the other cultures used in this report.
Burst Detection Using Firing Rate
In order to identify a bursting event we determine the firing rate of the network and simply search out the peak activity. To calculate the firing rate we sum all the spikes in a given time window for the entire recording. Next, we convolute the activity with a Gaussian whose width, σ, corresponds to the typical intervals between spikes in the burst. The width of the burst is determined by the intersection of the threshold with the Gaussian surrounding the peak activity of the burst. The threshold corresponds loosely to the levels of inter-burst firing in the recording.
Statistical Scaling Analyses
We defined the inter-burst intervals (IBIs) as the time between the end of a burst and the beginning of the consecutive burst and then inspected the statistical properties of the probability density of the IBIs as well as the statistical properties of the IBI increments (the absolute difference between the values of two successive IBIs; Segev and Ben-Jacob, 2001; Segev et al., 2004; Fuchs et al., 2009). In addition to the IBI, the statistical properties of the burst widths can also provide a tool to assess the network activity. We defined the burst width as the time interval during which the network firing rate was above the threshold level used to identify the burst (1.5 times the STD of the background activity).
Phase Synchronization and Synchronization Matrices
To quantify the network synchronization we measured the phase synchronization (PS; Singer, 1999; Varela et al., 2001; Boccaletti et al., 2002; Newman, 2003; Arenas et al., 2008; Baruchi et al., 2008; Filatova et al., 2008; Li et al., 2008; Zanin et al., 2008; Fuchs et al., 2009) between every pair of neurons in the networks. As detailed below, PS is a measure of the coordination (or coherence) between the firing of two neurons – in other words, the expectation that when one neuron fires the second one will fire within a constant phase shift (time delay). Note that the PS between two neurons is 1 if they always fire with the same time delay, and it does not depend on the value of the delay.
Consider two neurons in a larger system, where the firing of neuron A triggers a series of action potentials in other neurons, which in turn leads to a delayed consistent firing of neuron B. In this case, PS would detect the synchronization of these two neurons where a primitive measure like the correlation of firing times would not.
We transform the firing sequence of each neuron to a continuous phase that is evenly spaced between spikes, and that grows by 2π in each inter-spike-interval (ISI):
where, for the i-th neuron, ti(n) and ISIi(n) are the time of the n-th spike and n-th ISI, respectively. The phases θ for all times are subtracted for each pair of neurons i, j to give a phase difference. We define:

This difference is expected to be constant if neurons are firing in phase, and varying if neurons are asynchronous. Averaging over the entire recording and taking the absolute value we obtain the matrix PS:

Averaging the exponent of the phase difference over the recording time, and taking the absolute value of the obtained result yields a mean phase difference with limits between a totally synchronous value of 1 (constant phase difference or time delay) and value 0 for asynchronous relations (varied phase difference). Note that the PS between all pairs of neurons can be represented as a synchronization matrix whose element (i, j) is the phase synchronization (Fuchs et al., 2009) between neurons (i) and (j). Note that this is a symmetric matrix with the diagonal elements equal to 1.
Using Clustering Algorithm to Identify Synchronization Cliques
We have employed the dendrogram clustering algorithm (Fuchs et al., 2009) to identify the existence of sub-groups of neuron that are highly synchronized (in comparison of their synchronization with the other neurons in the network).
Synchronization Networks and Node Centrality
The synchronization matrices can be viewed as synchronization networks, in which the color of the links between the nodes (neurons) represents the level of pair synchronization (Fuchs et al., 2009). Once the inter-neuron synchronization is presented in terms of synchronization network, it is possible to adopt different measures from network theory to assess the synchronization relations. An efficient measure of network structure and topology is node eigenvector centrality (see Newman, 2003 and SI). We also inspect the association between the synchronization cliques and the neuron synchronization centrality.
Note that the PS between all pairs of neurons can be represented as a synchronization matrix whose element (i, j) is the phase synchronization PSi,j between neurons (i) and (j). We also note that the network global synchronization is simply defined as the mean of the PS between all neuron pairs at a given time point. Calculating the networks global synchronization, we found similar levels for the WT and the Atm−/− networks. We also found that for both network types, the global mean synchronization levels are sustained before and after the DNA damaging NCS treatment (Figure 5).
Phase Synchronization Variation: Normalization
For quantitative comparisons of the synchronization variations between different networks, we normalized the PS in the following way:
where 〈〉i,j is the average of the matrix and σ is the SD at time, tn. This normalization scheme effectively reduces the dilution effect of many low PS values (each neuron is strongly synchronized with only a small subset of other neurons) as well as the differing numbers of recorded channels between cultures.
The ΔPS is further normalized with respect to its initial values (untreated control). The initial raw PSV values differ between cultures, which is an expected aftermath of the individuality of each neural network – different number of recorded channels, differing cellular topology, etc.

Results
Networks Activity Rates and Statistical Properties Endure DNA Damage
Both the WT and Atm−/− networks exhibited spontaneous activity with global network coordination manifested by the generation of bursting events – short time windows during which most of the neurons participate in more rapid neuronal firings. Quantitative assessments of the networks’ activity rates and statistical properties revealed that the two network types share similar individual neuron firing rate, averaged neuron firing rates, IBI distributions and burst width distribution.
Next we tested whether the aforementioned activity properties of the two network types exhibit differing responses to DNA damage. In order to induce long term accumulation of DNA damage, we exposed the networks (the WT and Atm−/− networks), to the double strand break inducer, Neocarzinostatin (NCS). In each experiment, at least 10 h of control recordings were performed prior to the NCS treatments. Quantitative inspection revealed that for both network types, the activity rates and statistical properties were retained following the NCS treatments (Figures 2–4 for details). These results can be thought to be consistent with the fact that Atm−/− mice display limited neurological deficits (see Discussion).
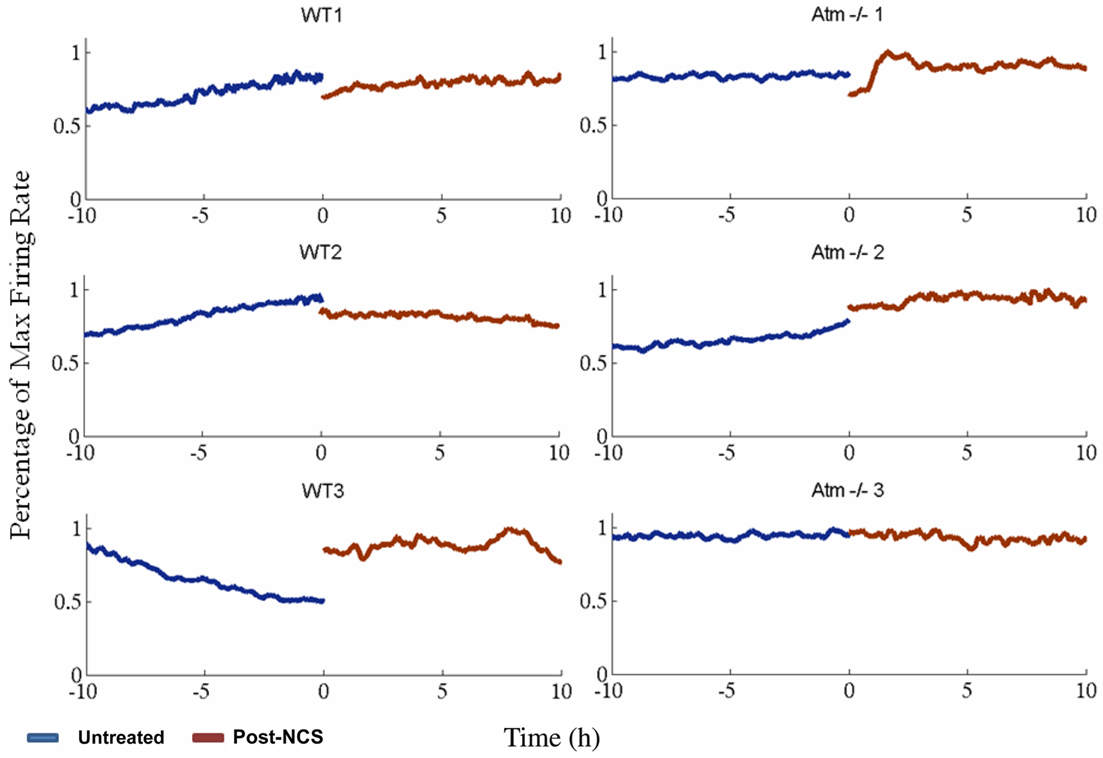
Figure 4. Number of spikes detected in windows of 1000s with 250s steps. Blue lines indicate untreated networks, brown lines post NCS treatment. On the left: three examples of WT cultures, on the right: three Atm−/− samples. Though global firing rates vary across different cultures – representing the unique nature of each respective disassociated neural network – we cannot detect any firing rate motifs unique to wild type or Atm−/− cultures nor can we detect any consistent changes following exposure to DNA damage inducing agent Neocarzinostatin. WT3 shows anomalously decreasing activity until circa 2 h prior to NCS application.
DNA damage endurance of the statistical behavior
To test whether Atm deficiency or DNA damage affect network behavior, we applied a double strand break inducing agent, Neocarzinostatin (NCS), while simultaneously monitoring the neural activity. Figure 2 shows raster plots obtained from WT and Atm−/− in the absence and presence of NCS. The activity seems to endure the NCS treatment for both network types. These results are consistent with the fact that Atm−/− mice display limited neurological deficits.
Inter-burst interval increments
After establishing the time points for burst peak, burst beginning, and burst end we use this information to explore the statistics of the intervals between bursts. We find that the changes in these distributions as a result of exposure to NCS are not significantly different for WT and Atm−/− cultures. The average Kullback–Leibler (KL) divergence between pairs of pre/post IBI increment distributions is found to be 0.0045 ± 0.0007 for WT and 0.0238 ± 0.0227 for Atm−/− cultures. Comparing these two values using a two tailed t-test shows that they are not statistically significantly different (t < 0.2775; Figure 5A).
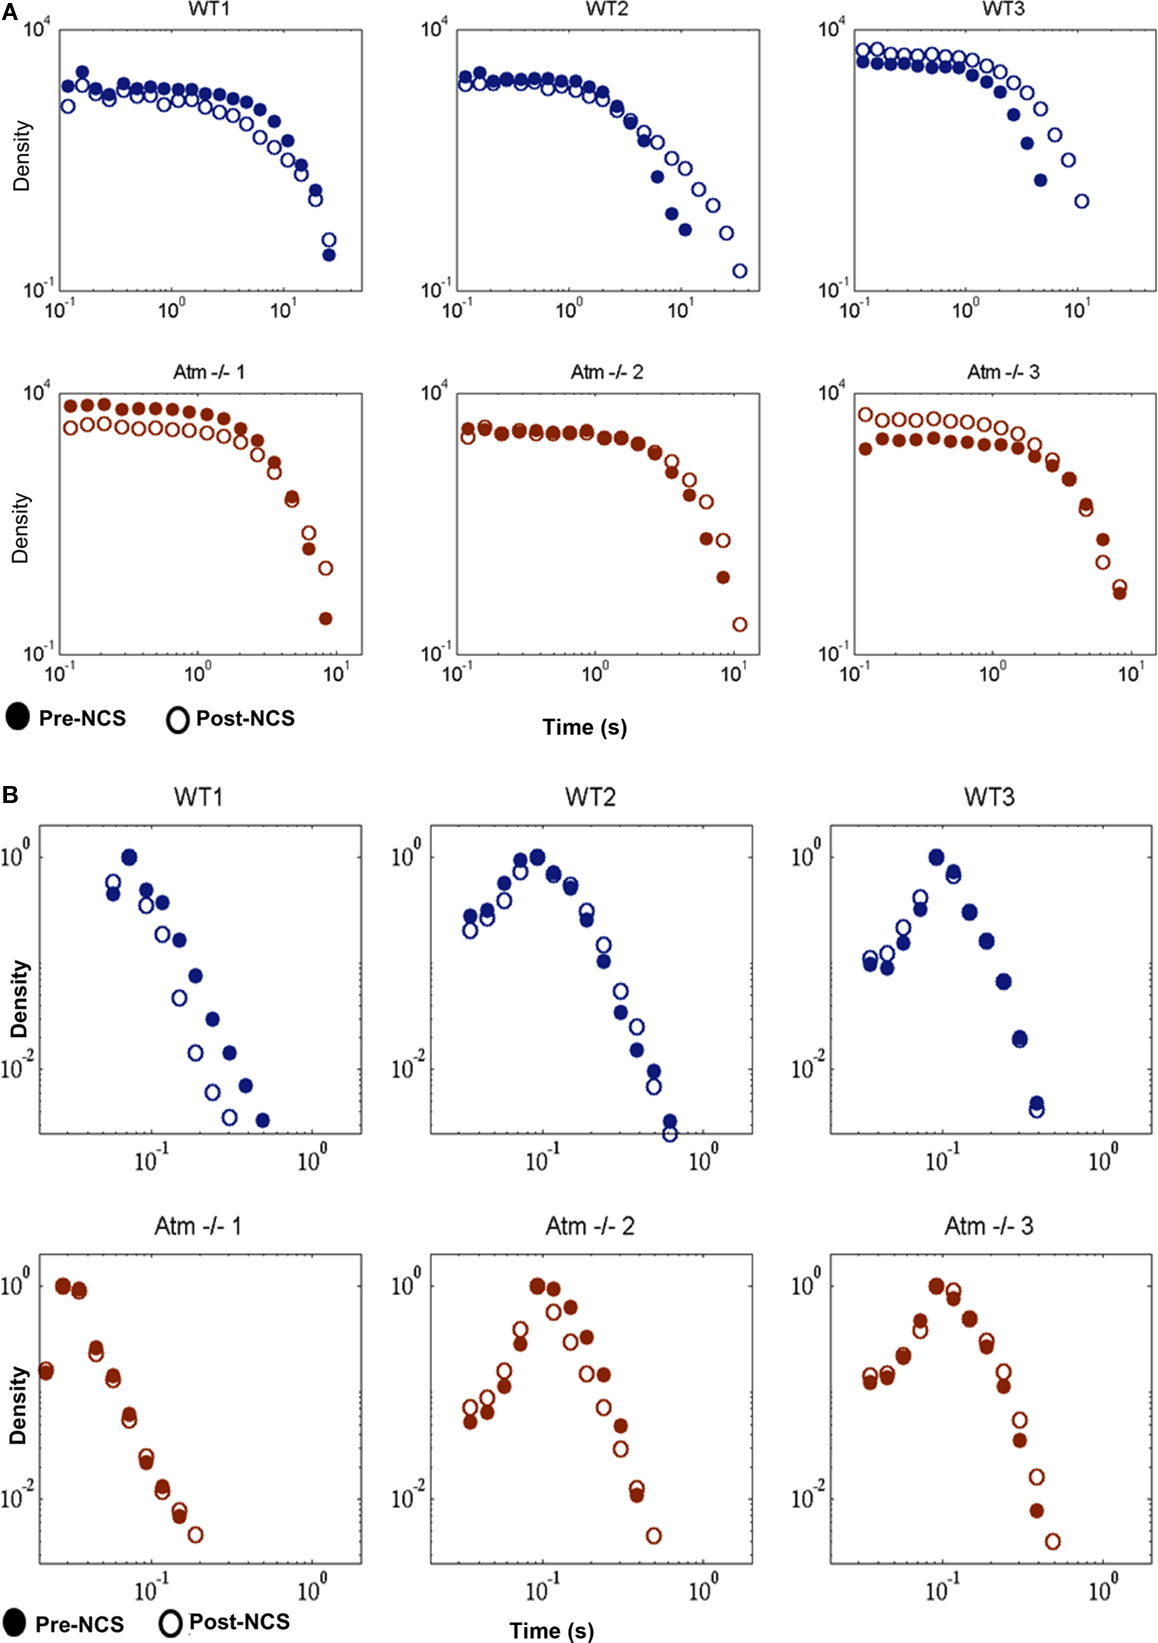
Figure 5. Inter-burst interval increments and burst widths in WT and Atm−/− cultures. (A) Delta Inter-Burst Intervals shown as a histogram with logarithmic binning. (B) Burst Widths shown as a histogram with logarithmic binning. In (A,B) – Blue lines (on the top) indicate WT, brown lines (on the bottom) indicate Atm−/−. Closed circles indicate untreated cultures, open circles post NCS.
Burst widths
The organized behavior of neural networks in the form of synchronized bursts of activity can be described by the statistics of the width of intervals separating these events as well as by the width (in time) of the events themselves. The burst width distribution varies between cultures – once again emphasizing the unique nature of each disassociated network –however, changes as a result of DSBs are minor and insignificant both in WT and Atm-deficient mice. The KL divergence between pre and post NCS for WT is 0.0431 ± 0.0518 and for Atm−/−, 0.0302 ± 0.0425. These values are not statistically different from each other (t < 0.7556, n = 3; Figure 5B).
Endurance of global network phase synchronization
The global (mean) synchronization calculated over long time scales (hours), as is explained in the text, is retained for both network types even following the NCS treatment (Figure 6).
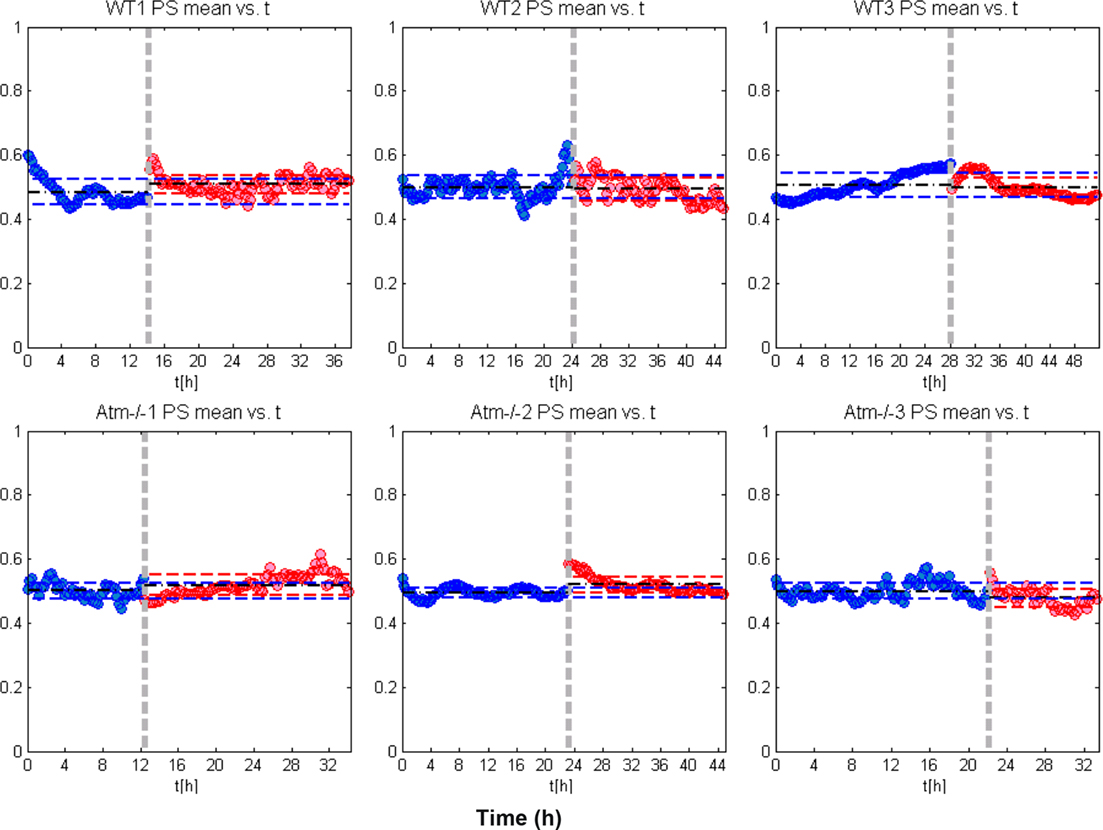
Figure 6. Global (mean) network synchronization. In this figure we show the global network phase synchronization (PS) as function of time. Each dot (blue or red), corresponds to the global synchronization calculated for a time window of 15 min. As is explained in the article, the global PS is simply the sum of the PS between every pairs of neurons. To ease the comparison we actually calculated the mean global PS – the global PS divided by the number of neuron pairs. Since we are interested here in the endurance of the mean PS, we also set the average of the mean PS over all time windows before NCS treatment (the blue dots) to be 0.5. The results show that the global PS is retained for both WT and the Atm−/− networks even after the NCS imposed DNA damage (red dots).
Phase synchronization bias
Theoretically, the calculation of PS could be biased by a neuron’s firing activity even for long time intervals, i.e., there is a possibility for a strong correlation (positive or negative) between the firing rate and average PS of neurons. In order to rule out this possibility we show the independence of PS on activity rates by comparing the average PS values between each neuron and the rest of the network (denoted Si), to the neuron’s relative firing rate, in each 15 min recording time interval (same intervals that were used in the article to calculate the derivative like quantity – PS Variation).

where N is the number of recorded neurons (the dimension of the PS matrix).
Results indeed show a very low level of correlation suggesting that the conclusions we have reached in the article are not a result of an artifact introduced by changes in firing rates (Figure A1 in Appendix).
The Existence of Synchronization Cliques, Synchronization Networks, and Node Centrality
For closer inspection of the distribution of the inter-neuron synchronization, we reordered the synchronization matrices using the dendrogram clustering algorithm.
Dendrogram synchronization matrices and the existence of synchronization cliques
The PS between all neuron pairs defines a synchronization matrix. This matrix is symmetric (the PSi,j = PSj,i) and the diagonal equals to 1 (PSi,i = 1 for all neurons).
For closer inspection of the distribution of the inter-neuron synchronization, we reordered the synchronization matrices using the dendrogram clustering algorithm. Doing so, we discovered (Figures 7 and 8) the existence of synchronization cliques – sub-groups of highly synchronized neurons, both in the WT and the Atm−/− networks and both untreated and after (Post) NCS treatments. In Figure 7 we show examples of the dendrogramed synchronization matrices calculated over 4 h time windows and we compare the significance of the detected sub-clusters (of highly synchronized neurons) with those detected in dendrogram synchronization matrices calculated over mush shorter, 15 min, time windows.
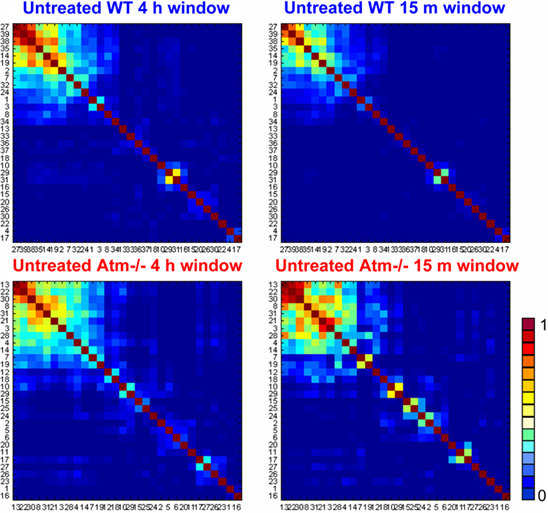
Figure 7. Comparison between dendrogramed synchronization matrices calculated for long (4 h) and short (15 min) time windows. The 4-h synchronization matrices for WT (top) and Atm−/− (bottom) are shown on the left, and the ones for 15 min are shown on the right. The matrices for all four cases show the existence of synchronization cliques as is reflected by the detected clusters of highly synchronized neurons.
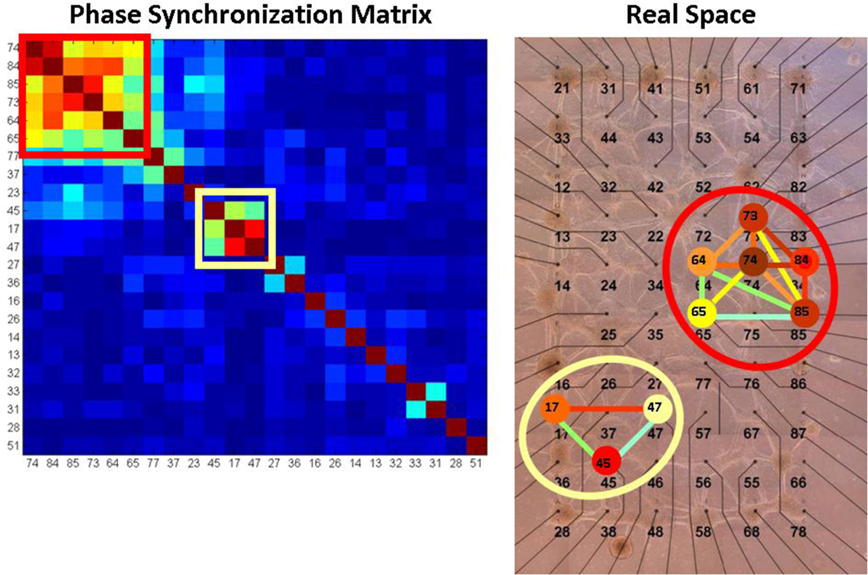
Figure 8. Projection of the synchronization networks and node centrality on real space. The picture on the left shows a dendrogramed synchronization matrix and the picture on the right shows the real space mapping of its corresponding synchronization network. In this example of WT network before NCS treatment (calculated for 15 min time window), two synchronization cliques are detected. The node eigenvalue centrality information is incorporated by coloring the neurons according to their centrality.
The comparison presented in Figure 7 clearly shows high similarity between the clusters of highly synchronized neurons detected (for each network) in the 4-h and 15-min matrices. The similarity is both in terms of the identity of the neurons that compose the clusters and the level of the PS between them. The noted difference is that the clusters detected in the 15-min synchronization matrices have somewhat high statistical significance as is reflected by the weaker (darker blue) PS between the neurons that do not belong to the clusters. Mathematically, a 4-h synchronization matrix corresponds to and averaging over 16 successive 15 min matrices. Hence, the high similarity between the detected cliques in a 4-h matrices and the cliques detected in a specific 15 min matrix (out of the 16), reflects high endurance of the synchronization cliques for the cases shown in Figure 8 – the WT and Atm−/− networks prior to the NCS treatments. Further below we will discuss the fact that similar endurance is retained after the NCS treatments for the case of the WT networks but not in the case of the Atm−/− networks.
Synchronization networks and neuron centrality
To inspect whether the synchronization cliques are mainly composed of central (influential) neurons, we represent the synchronization matrices in terms of their corresponding synchronization networks. As was mentioned in the article, the nodes of the synchronization networks are the neurons and the edges between each pair of nodes correspond to the PS between the two neurons. In network theory a network topology is defined by its corresponding adjacency matrix A whose elements Ai,j define the strength of the connection between the (i, j) nodes. For example, for topological networks the Ai,j elements equal to one when the two nodes are connected and to zero otherwise. When the distances between nodes is of interest, the elements Ai,j are higher for shorter distances (one for zero distance and zero for not connection or infinite distance). The elements Ai,j of the adjacency matrix that define the synchronization network can either, simply be equal to the PSi,j elements of the synchronization matrix or equal to one when PSi,j exceeds a certain threshold and equal to zero otherwise. Here we used the former definition for the adjacency matrix of the synchronization networks.
Once the adjacency matrix is defined, it is possible to use the centrality measures (as well as other measures) developed within the context of network theory for quantitative characterization of the synchronization networks.
One of the efficient and widely used measures of nodes centrality, is the nodes eigenvector centrality (Freeman, 1979; Newman, 2003). This measure estimates the relevance (or importance) of each node according to the relevance of the nodes with which it is connected; connections to nodes who are themselves relevant will contribute to the node “centrality” more than connections to less relevant (“central”) nodes. Mathematically, the structural centrality of each node j was calculated by solving the self-consistent matrix equation,

where Ai,j is the Adjacency matrix that describes the synchronization network in terms of the PS between nodes and Xj is the corresponding eigenvector centrality of node (j). The eigenvalue centrality of the node (j), is then defined as the largest eigenvalue λj in Eq. 7.
Projection of the synchronization networks and node centrality on real space
For visualization of the synchronization networks and the neuron centrality, we project a compact graphical representation of the synchronization network on the physical (real space) organization (locations) of the recorded neurons on the MEA. In this representation the edges between the nodes (the links between the neurons) are color coded according the PS between them (from blue for low to red for high). To ease the visual inspection, not all the links are plotted but only those with relatively higher PS. To incorporate the node centrality information, the neurons are colored according to their corresponding centrality (from blue for low to red for high). An example of the real space mapping is shown in Figure 1B in the article and additional example is shown in Figure 9.
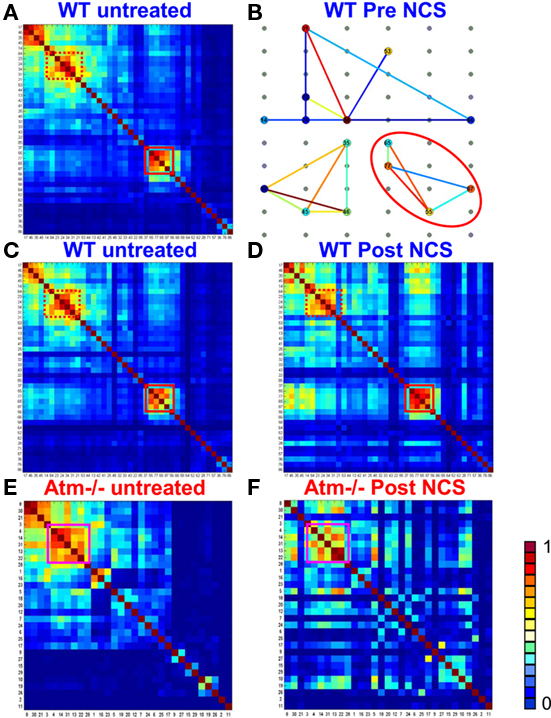
Figure 9. Phase synchronization matrices and synchronization networks. In (A) we show a typical phase synchronization dendrogram for a specific 15 min window prior to NCS addition, for one of the WT networks (see SI3). The distinct synchronization cliques are the clusters of highly synchronized neurons. In (B) we show the corresponding synchronization networks presented on top of the real space diagram of the MEA electrodes (Figure A1 in Appendix). Here, the phase synchronization is represented by color coded lines between the nodes (neurons). The neurons are color coded (blue for low and red for high) according to their centrality. One clique is marked by a red square in (A), the same clique is now marked by a red ellipse in (B). This shows that the synchronization clique is indeed formed by proximate neurons. The synchronization endurance is illustrated in (C,D) by the similarity of the synchronization matrices [using the same dendrogram order as in (A)], evaluated at different time windows before NCS treatment (C) and after (D). Performing similar comparison for the Atm−/− networks reveals reduced synchronization persistence – the dendrogram obtained post NCS (F) is somewhat different than the one obtained pre NCS addition (E).
We discovered (Figure 8) the existence of synchronization cliques – sub-groups of highly synchronized neurons, in the WT and the Atm−/− networks. We note that, as has recently been shown by Fuchs et al (2009), the detection of such synchronization cliques in neural networks might be indicative of underlying modular organization of the network topology. Statistically significant synchronization cliques are clearly detected even when calculating the PS matrices over several hours (Figure 7). This observation indicates that the synchronization cliques have relatively long time (hours) stability.
Quantitative Calculation of the Synchronization Persistence (Short Time Variations)
Visual inspection of the dendrogramed synchronization matrices at consecutive 15 min time windows (Figures 9 and 11) indicates significantly large synchronization variations in the Atm−/− cultures after imposed DNA damage by NCS treatments.
Calculating variation in phase synchronization
To quantify the variations, we performed a quantitative comparison between the matrices at successive time windows using the approach illustrated in Figure 10: First, for each pair of neurons (i, j) we calculated ΔPSi,j – the difference of PSi,j between two successive time windows. Then we defined and calculated the overall network PS variation, ΔPS, as the average for all pairs of neurons i, j.
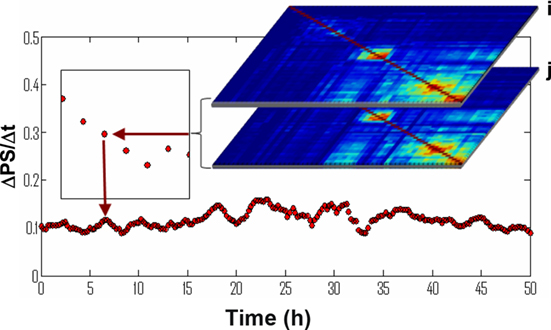
Figure 10. Calculation of a synchronization persistence measure. For a PS matrix, m, representing the synchronization state of the network in 15 min snapshots, is subtracted from the next snapshot, n. All neuron pairs are summed and divided by the time period to yield a rate of synchronization changes.
Closer inspection of the synchronization persistence using the dendrogramed synchronization matrices
For closer inspection of the persistence of the synchronization cliques, we compared the structure of sequence of successive synchronization matrices between two cases: (1) when each matrix is independently ordered using the dendrogram clustering algorithm. (2) The successive matrix is presented using the order of the preceding matrix.
Typical results for Atm−/− networks untreated and post NCS treatments are shown in Figure 11. Note that we do not show results for WT untreated and post NCS treatments, since the results for these two cases for the WT networks are similar to those of the untreated Atm−/− networks. Visual inspection of the results shown in Figure 11 clearly illustrates the short time (15 min) breakdown of the synchronization persistence of the Atm−/− networks post NCS treatments. As is explained in the captions of Figure 12, the breakdown is associated with: (1) lower stability of the synchronization cliques that change (in terms of their neuron composition) on short time scales of 15 min and (2) higher changes over successive time windows in the distribution of PS between different pairs of neurons (that do not belong to the cliques) while the sum of the distribution is retained (i.e., the synchronization between some pairs increases while between other pairs it decreases). These two features explain the fact that the global synchronization level is retained (Figure 7) also for the Atm−/− networks post NCS treatments, despite the breakdown in the synchronization persistence in this networks after the NCS treatments.
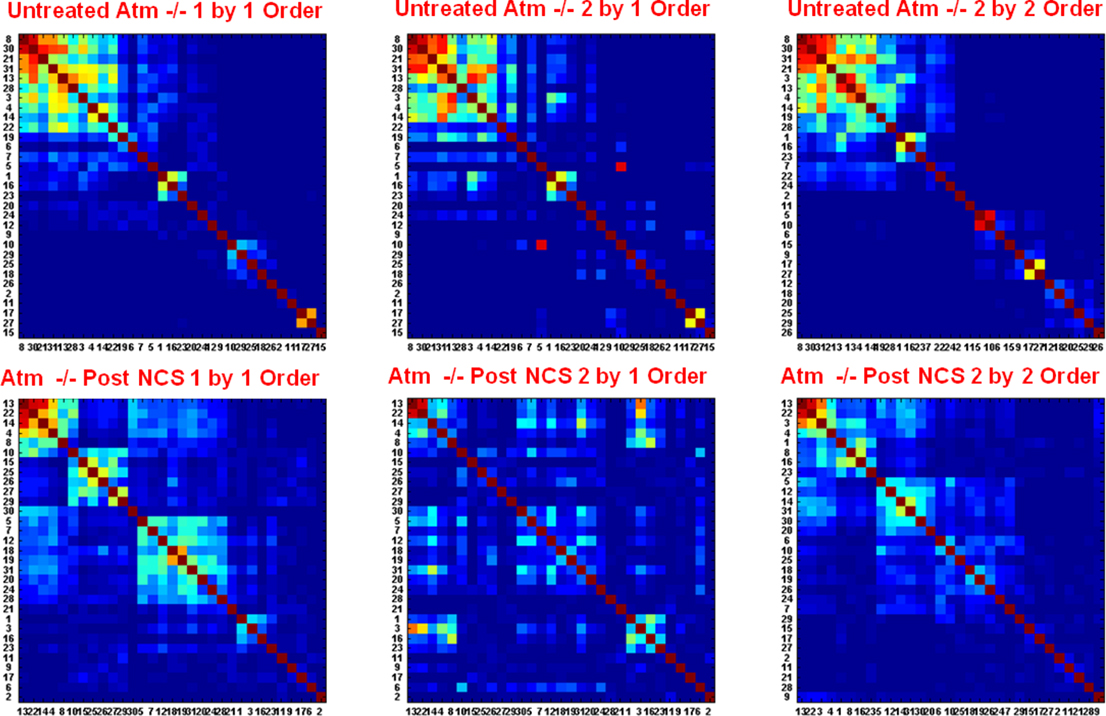
Figure 11. Closer inspection breakdown of the phase synchronization persistence of the Atm−/− networks post NCS treatments. The results of the untreated cultures are shown at the top and the ones for post NCS treatments are shown at the bottom. For both cases we show the 15-min time window synchronization matrices for two consecutive time windows of 15 min. The matrices termed “1 and 2 by 2 order” refer to the independently ordered first (1) and successive (2) synchronization matrices using the dendrogram clustering algorithm. The matrices termed “2 by 1 order” mean to the second synchronization matrix presented using the dendrogram order of the first matrix (1). Visual inspection of the results clearly illustrates the breakdown of the synchronization persistence of the Atm−/− network post NCS treatment as is reflected by the significant differences between the structures of the “2 by 1 order” and 2 by 2 order” matrices for this case. More specifically, clusters of synchronized neurons (synchronization cliques) are detected both in “1 by 1 order” and “2 by 2 order” matrices. Since the clusters detected in the matrix “2 by 2 order” break in the “2 by 1 order” (the corresponding neurons are spread through the “2 by 1 order” matrix), the results indicate instability of the synchronization cliques: The synchronization cliques change (the cliques break and new cliques composed of different neurons are formed) on short time scales of 15 min. Note that there is one small clique (the cluster at the top left corner in matrix (1) for the post NCS treatment Atm−/− network that is stable. In addition, we also observe high variations in the phase synchronization between neuron pairs that do not belong to the synchronization cliques (the off diagonal terms). Closer inspection reveals that while the distribution changes its sum is retained.
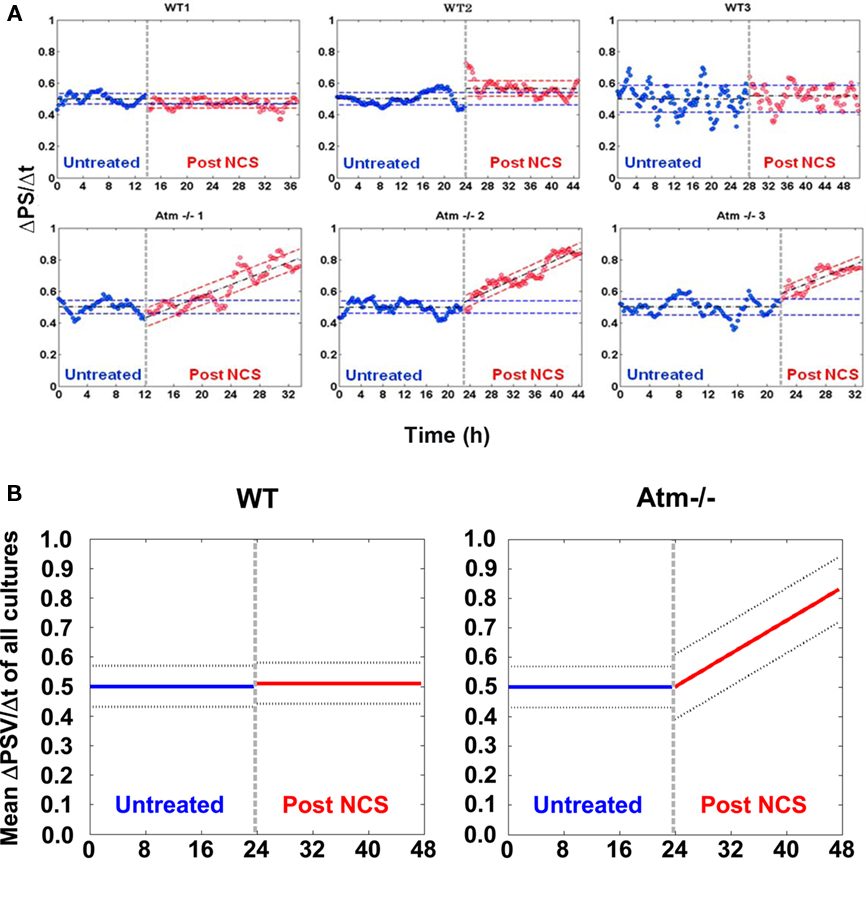
Figure 12. Phase synchronization variations. Part (A) shows the variation in the phase synchronization between successive time windows, 15 min apart, as is explained above. Three WT cultures are presented in the top row and three Atm−/− are presented at the bottom. The SE are shown as dashed colored lines The results prior to DNA damage induction (marked by a dashed vertical gray line) are in blue, whereas post induction are in red. Prior to DNA damage induction the mean values are shown as dashed black lines. Each plot is normalized so that the mean value is exactly 0.5. As opposed to WT cultures, Atm−/− networks presents an increase in variation following the induction of DNA damage with Neocarzinostatin (NCS). The dashed black line following NCS application represents the least mean square (LMS) fit for the samples rather than the mean value. In (B) we show the mean levels of the slope and STD of the results for the three WT and the three Atm−/− networks respectively.
Phase synchronization variation
The changes in the distribution include both changes in the neurons that composed the synchronization cliques (the matrix clusters), and in neurons that do not belong to the cliques (the matrices off diagonal terms).
Using this measure we found a significant difference between the WT and Atm−/− networks (Figure 12). The WT and Atm−/− networks exhibit comparable levels of synchronization persistence prior to the NCS treatment (Figure 12). However, while the WT networks sustain the same level of synchronization persistence after the imposed DNA damage by NCS treatments, the synchronization variation ΔPS of the Atm−/− networks increases over many hours to levels that are almost an order of magnitude higher than that of the WT networks. Average variation in the PS is shown in Figure A2 in Appendix.
We emphasize that while, following the NCS treatments in the Atm−/− networks, we detect significant variation in synchronization between successive time windows on short time scales (15 min), and the mean level of the global synchronization is retained for all cases including the Atm−/− networks post NCS treatments (Figure 6). These observations reflect the fact that while the distribution of synchronization between different pairs of neurons change over successive time windows, the sum of the distribution is retained (i.e., the synchronization between some pairs increases while between other pairs it decreases). Hence, it represents a potentially important connection between genome instability and neural network system level dynamics.
Discussion
We recorded the activity of tens of neurons using MEAs from both Atm-deficient mice and their related WT litter mates. There are some legitimate objections to multi-array recordings of disassociated neural networks. The applicability of these 2D, small neural population studies to in vivo, large cell population, three dimensional neural networks is contentious. Due to the complexity of brain circuits, it is almost impossible to delineate the basic law governing the behavior of these complex circuits. On the other hand, cultured neural networks cultivated on MEA provide relatively simple and well-controlled model systems for investigating how does malfunctioning DDR affects neural activity, since it is possible to monitor in parallel and non-invasively the electrical activity of many neurons over long periods of time. And indeed, the use of MEA could provide valuable information regarding the interrelations between DNA damage and neural network activity.
Li et al. (2009) show that Atm deficiency was associated with hippocampal long term potentiation (LTP) dysfunction. Though Li et al. (2009) indicate a non-nuclear role for Atm in synaptic function of hippocampal neurons without the induction of DNA damage; we detect no defect in Atm−/− neurons or networks until DNA damage is induced. Moreover, we were unable to detect any distinguishing characteristics of Atm deficiency in individual channels. This is consistent with the fact that synaptic deficiencies would likely manifest in analysis of network parameters rather than deficiencies in individual neurons. Thus, one outcome of our study is that a systems-level network approach is crucial for understanding the neurological implications of the Atm mutation. In fact, when we compared the firing rates, ISI and the raw spike signals of individual neurons; we were unable to distinguish Atm−/− neurons from WT.
Unlike the findings of Li et al. (2009) in neurons of the hippocampus, Chiesa et al. (2000) did not observe the EPSP deficiencies (that suggested to Li et al. (2009) LTP issues) in Purkinje neurons. The authors did observe, however, calcium current abnormalities in Atm−/− Purkinje neurons which also suggest synaptic deficiencies in these cell types (Chiesa et al., 2000). The fact that we have detected on the network level, decreasing synchronization persistence, could suggest a connection to the synaptic deficiencies observed by Chiesa et al. (2000). That is, to maintain a consistent pace of variation in synchronization links, proper synaptic function is likely a necessity. We predict that interfering with proper synaptic function on a normal network will also lead to reduced synchronization persistence. This is a likely avenue for fruitful future investigation.
Both calcium dynamics and LTP are processes involved in the persistence of synaptic connections between neurons in a network. Considering the findings of Li et al. (2009) – that the Atm deficiency leads to synaptic persistence deficiencies – and that A-T patients suffer from poor movement synchronization, we compared the PS of pairs of neurons over time in Atm−/− networks to WT. We found that compared to WT networks, Atm-deficient networks increase the rate neurons switch partners or change the magnitude of existing PS links, when DNA damage is induced.
Whether it is cell death caused by DNA damage or DNA damage directly (or a combination of the two) that leads to the neurological phenotype of A-T, these symptoms are in fact a manifestation of the output of the neural network. A-T patients accumulate DNA damage and present a diminishing level of motor coordination over time. Figures 9 and 12 show that in the presence of DNA damage, Atm−/− networks consistently demonstrate a decreasing persistence of PS over time. It is possible that lack of motor coordination is reflected in neural networks by the decrease in PS over time.
In WT and Atm−/− cultures, we identified synchronization cliques that are mainly composed of central nodes. These cliques persist despite the decrease in PS persistence detected in Atm−/− cultures after induction of DNA damage and shown in Figures 7 and 9. These findings indicate a previously unknown correlation between DNA damage and neural network activity. It is also important to note, that post NCS treated Atm−/− cultures did not lose their ability to synchronize but rather the synchronization persistence is reduced over time. Thus, the DNA damage accumulated as a result of a malfunctioning DDR has an immediate effect on the behavior of neural circuits in a way that might corresponds to the symptoms observed in the disease.
The analysis of the node vulnerability in the DDR protein interaction network indicate that a missing Atm protein leads to the failure of the DDR protein network to propagate information regarding DNA damage to the cells’ various response mechanisms. This failure, in turn, leads to the accumulation of DNA damage, particularly double strand breaks. This accumulated DNA damage in the nucleus affects cells ability to maintain persistent synchronization motifs within the neural network. We hypothesize that this failure is at the core of the neurological symptoms of A-T. Our studies revealed that Atm deficiency (which is known to lead to an accumulation of DNA damage and especially DSBs; Dar et al., 2006) causes both a tremendous change in the protein interactome’s efficiency (Bensimon et al., 2010) and most likely a destabilization in the PS of the neurons in a cultured network. Thus, Atm deficiency is correlated to the efficiency of the DDR and accumulated DNA damage is correlated to the PS of a neural network.
Since, only in response to a DNA damage inducing agent did Atm−/− cultures show their reduced propensity for PS persistence, we conclude that DNA damage, as opposed to an unknown neurological function of the protein Atm, is responsible for maintaining persistent PS. This is a surprising finding of a wider scope than a single neurological disease, for it implies that genome integrity has a prompt, previously unknown, role in neural circuits. It is reasonable to assume that neurological symptoms are generally not always the product of the malfunction of one cell but rather the failure of interacting networks of cells. Thus, another implication of this work is that a systems-level network perspective for investigating neurological deficits is crucial to understanding neural systems in general and developing treatment modalities for illness in particular.
The neurological manifestation of A-T is mainly cerebellar and it would be interesting and preferable to analyze cerebellar granule neuronal cultures instead of cortical neurons. However, we failed to record neuronal activity from cerebellar granule cultures. In our case the homogenous cortical neural networks served as a model system to analyze the effect of DNA damage on network activity. The results of this study yielded some important observations as summarized in this study.
In summary, our findings indicate a previously unknown association between DNA damage and neural network activity. While post NCS Atm−/− cultures did not lose their ability to synchronize, the synchronization persistence was reduced over time. Moreover, we identified synchronization cliques that are mainly composed of central nodes. In contrast to WT, Atm-deficient networks only partially sustain persistence in response to DNA damage. These results show that the DNA damage accumulated as a result of a malfunctioning DDR has an immediate effect on the behavior of neural circuits. This suggests a correlation between DNA damage and persistence of PS on short time scales.
Conflict of Interest Statement
The authors declare that the research was conducted in the absence of any commercial or financial relationships that could be construed as a potential conflict of interest.
Acknowledgments
This work was partially supported by grants from the A-T Children Project, The Israeli Science Foundation and Israeli Ministry of Health, the Italian Embassy via the Italy–Israel Initiative on Integrative Network Neuroscience, the Tauber Family Foundation and the Maguy-Glass chair in Physics of Complex Systems at Tel Aviv University.
References
Abner, C. W., and McKinnon, P. J. (2004). The DNA double-strand break response in the nervous system. DNA Repair (Amst.) 3, 1141–1147.
Allen, D. M., van Praag, H., Ray, J., Weaver, Z., Winrow, C. J., Carter, T. A., Braquet, R., Harrington, E., Ried, T., Brown, K. D., Gage, F. H., and Barlow, C. (2001). Ataxia telangiectasia mutated is essential during adult neurogenesis. Genes Dev. 15, 554–566.
Andegeko, Y., Moyal, L., Mittelman, L., Tsarfaty, I., Shiloh, Y., and Rotman, G. (2001). Nuclear retention of ATM at sites of DNA double strand breaks. J. Biol. Chem. 276, 38224–38230.
Arenas, A., Diaz-Guilera, A., Kurths, J., Moreno, Y., and Zhou, C. (2008). Synchronization in complex networks. Phys. Rep. 469, 93–153.
Bakkenist, C. J., and Kastan, M. B. (2003). DNA damage activates ATM through intermolecular autophosphorylation and dimer dissociation. Nature 421, 499–506.
Banin, S., Moyal, L., Shieh, S., Taya, Y., Anderson, C. W., Chessa, L., Smorodinsky, N. I., Prives, C., Reiss, Y., Shiloh, Y., and Ziv, Y. (1998). Enhanced phosphorylation of p53 by ATM in response to DNA damage. Science 281, 1674–1677.
Barlow, C., Dennery, P. A., Shigenaga, M. K., Smith, M. A., Morrow, J. D., Roberts, L. J. II, Wynshaw-Boris, A., and Levine, R. L. (1999). Loss of the ataxia-telangiectasia gene product causes oxidative damage in target organs. Proc. Natl. Acad. Sci. U.S.A. 96, 9915–9919.
Barlow, C., Hirotsune, S., Paylor, R., Liyanage, M., Eckhaus, M., Collins, F., Shiloh, Y., Crawley, J. N., Ried, T., Tagle, D., and Wynshaw-Boris, A. (1996). Atm-deficient mice: a paradigm of ataxia telangiectasia. Cell 86, 159–171.
Baruchi, I., Volman, V., Raichman, N., Shein, M., and Ben-Jacob, E. (2008). The emergence and properties of mutual synchronization in in vitro coupled cortical networks. Eur. J. Neurosci. 28, 1825–1835.
Barzilai, A., Biton, S., and Shiloh, Y. (2008). The role of the DNA damage response in neuronal development, organization and maintenance. DNA Repair (Amst.) 7, 1010–1027.
Bensimon, A., Schmidt, A., Ziv, Y., Elkon, R., Wang, S. Y., Chen, D. J., Aebersold, R., and Shiloh, Y. (2010). ATM-dependent and -independent dynamics of the nuclear phosphoproteome after DNA damage. Sci. Signal. 3, rs3.
Biton, S., Barzilai, A., and Shiloh, Y. (2008). The neurological phenotype of ataxia-telangiectasia: solving a persistent puzzle. DNA Repair (Amst.) 7, 1028–1038.
Boccaletti, S., Kurths, J., Osipov, G., Valladares, D. L., and Zhou, C. (2002). The synchronization of chaotic systems. Phys. Rep. 366, 1.
Borghesani, P. R., Alt, F. W., Bottaro, A., Davidson, L., Aksoy, S., Rathbun, G. A., Roberts, T. M., Swat, W., Segal, R. A., and Gu, Y. (2000). Abnormal development of Purkinje cells and lymphocytes in Atm mutant mice. Proc. Natl. Acad. Sci. U.S.A. 97, 3336–3341.
Chen, P., Peng, C., Luff, J., Spring, K., Watters, D., Bottle, S., Furuya, S., and Lavin, M. F. (2003). Oxidative stress is responsible for deficient survival and dendritogenesis in purkinje neurons from ataxia-telangiectasia mutated mutant mice. J. Neurosci. 23, 11453–11460.
Chiesa, N., Barlow, C., Wynshaw-Boris, A., Strata, P., and Tempia, F. (2000). Atm-deficient mice Purkinje cells show age-dependent defects in calcium spike bursts and calcium currents. Neuroscience 96, 575–583.
Dar, I., Biton, S., Shiloh, Y., and Barzilai, A. (2006). Analysis of the ataxia telangiectasia mutated-mediated DNA damage response in murine cerebellar neurons. J. Neurosci. 26, 7767–7774.
Eilam, R., Peter, Y., Elson, A., Rotman, G., Shiloh, Y., Groner, Y., and Segal, M. (1998). Selective loss of dopaminergic nigro-striatal neurons in brains of Atm-deficient mice. Proc. Natl. Acad. Sci. U.S.A. 95, 12653–12656.
Eilam, R., Peter, Y., Groner, Y., and Segal, M. (2003). Late degeneration of nigro-striatal neurons in ATM−/− mice. Neuroscience 121, 83–98.
Elson, A., Wang, Y., Daugherty, C. J., Morton, C. C., Zhou, F., Campos-Torres, J., and Leder, P. (1996). Pleiotropic defects in ataxia-telangiectasia protein-deficient mice. Proc. Natl. Acad. Sci. U.S.A. 93, 13084–13089.
Filatova, A. E., Hramov, A. E., Koronovskii, A. A., and Boccaletti, S. (2008). Synchronization in networks of spatially extended systems. Chaos 18, 023133.
Freeman, L. C. (1979). Centrality in social networks: conceptual clarification. Soc. Networks 1, 215.
Fuchs, E., Ayali, A., Ben-Jacob, E., and Boccaletti, S. (2009). The formation of synchronization cliques during the development of modular neural networks. Phys. Biol. 6, 036018.
Gueven, N., Luff, J., Peng, C., Hosokawa, K., Bottle, S. E., and Lavin, M. F. (2006). Dramatic extension of tumor latency and correction of neurobehavioral phenotype in Atm-mutant mice with a nitroxide antioxidant. Free Radic. Biol. Med. 41, 992–1000.
Hulata, E., Segev, R., and Ben-Jacob, E. (2002). A method for spike sorting and detection based on wavelet packets and Shannon’s mutual information. J. Neurosci. Methods 117, 1–12.
Hulata, E., Segev, R., Shapira, Y., Benveniste, M., and Ben-Jacob, E. (2000). Detection and sorting of neural spikes using wavelet packets. Phys. Rev. Lett. 85, 4637–4640.
Iliakis, G., Wang, Y., Guan, J., and Wang, H. (2003). DNA damage checkpoint control in cells exposed to ionizing radiation. Oncogene 22, 5834–5847.
Kuljis, R. O., Xu, Y., Aguila, M. C., and Baltimore, D. (1997). Degeneration of neurons, synapses, and neuropil and glial activation in a murine Atm knockout model of ataxia-telangiectasia. Proc. Natl. Acad. Sci. U.S.A. 94, 12688–12693.
Kurz, E. U., and Lees-Miller, S. P. (2004). DNA damage-induced activation of ATM and ATM-dependent signaling pathways. DNA Repair (Amst.) 3, 889–900.
Lavin, M. F., and Shiloh, Y. (1997). The genetic defect in ataxia-telangiectasia. Annu. Rev. Immunol. 15, 177–202.
Li, D., Leyva, I., Almendral, J. A., Sendina-Nadal, I., Buldu, J. M., Havlin, S., and Boccaletti, S. (2008). Synchronization interfaces and overlapping communities in complex networks. Phys. Rev. Lett. 101, 168701.
Li, J., Han, Y. R., Plummer, M. R., and Herrup, K. (2009). Cytoplasmic ATM in neurons modulates synaptic function. Curr. Biol. 19, 2091–2096.
Meyn, M. S., Khanna, K. K., Young, D., and Wang, W. (2003). Nuclear Dynamics of ATM Following DNA Damage. A-T International Workshop. Abstract Book.
Mount, H. T., Martel, J. C., Fluit, P., Wu, Y., Gallo-Hendrikx, E., Cosi, C., and Marien, M. R. (2004). Progressive sensorimotor impairment is not associated with reduced dopamine and high energy phosphate donors in a model of ataxia-telangiectasia. J. Neurochem. 88, 1449–1454.
Potter, S. M. (2001). Distributed processing in cultured neuronal networks. Prog. Brain Res. 130, 49–62.
Povirk, L. F. (1996). DNA damage and mutagenesis by radiomimetic DNA-cleaving agents: bleomycin, neocarzinostatin and other enediynes. Mutat. Res. 355, 71–89.
Segev, R., Baruchi, I., Hulata, E., and Ben Jacob, E. (2004). Hidden neuronal correlations in cultured networks. Phys. Rev. Lett. 96, 1–4.
Segev, R., and Ben-Jacob, E. (2001). Spontaneous synchronized bursting in 2D neural networks. Physica 64, 64–69.
Segev, R., Benveniste, M., Hulata, E., Cohen, N., Palevski, A., Kapon, E., Shapira, Y., and Ben-Jacob, E. (2002). Long term behavior of lithographically prepared in vitro neuronal networks. Phys. Rev. Lett. 88, 101–104.
Segev, R., Benveniste, M., Shapira, Y., and Ben-Jacob., E. (2003). Formation of electrically active clusterized neural networks. Phys. Rev. Lett. 90, 101–104.
Shiloh, Y. (2003). ATM and related protein kinases: safeguarding genome integrity. Nat. Rev. Cancer 3, 155–168.
Singer, W. (1999). Neuronal synchrony: a versatile code for the definition of relations? Neuron 24, 49–65, 111–125.
Su, T. T. (2006). Cellular responses to DNA damage: one signal, multiple choices. Annu. Rev. Genet. 40, 187–208.
Uziel, T., Lerenthal, Y., Moyal, L., Andegeko, Y., Mittelman, L., and Shiloh, Y. (2003). Requirement of the MRN complex for ATM activation by DNA damage. EMBO J. 22, 5612–5621.
Varela, F., Lachaux, J. P., Rodriguez, E., and Martinerie, J. (2001). The brainweb: phase synchronization and large-scale integration. Nat. Rev. Neurosci. 2, 229–239.
Watters, D., Kedar, P., Spring, K., Bjorkman, J., Chen, P., Gatei, M., Birrell, G., Garrone, B., Srinivasa, P., Crane, D. I., and Lavin, M. F. (1999). Localization of a portion of extranuclear ATM to peroxisomes. J. Biol. Chem. 274, 34277–34282.
Wheeler, B. C., and Brewer, G. C. (1994). “Multi neuron patterning and recording,” in Enabling Technologies for Cultured Neural Networks, eds D. A. Stenger and T. M. McKenna (San Diego: Academic Press), 167–185.
Xu, Y., Ashley, T., Brainerd, E. E., Bronson, R. T., Meyn, M. S., and Baltimore, D. (1996). Targeted disruption of ATM leads to growth retardation, chromosomal fragmentation during meiosis, immune defects, and thymic lymphoma. Genes Dev. 10, 2411–2422.
Zanin, M., Buldu, J. M., Cano, P., and Boccaletti, S. (2008). Disorder and decision cost in spatial networks. Chaos 18, 023103.
Keywords: Atm, neural networks, micro-electrode array
Citation: Levine-Small N, Yekutieli Z, Aljadeff J, Boccaletti S, Ben-Jacob E and Barzilai A (2011) Reduced synchronization persistence in neural networks derived from Atm-deficient mice. Front. Neurosci. 5:46. doi: 10.3389/fnins.2011.00046
Received: 11 November 2010;
Accepted: 21 March 2011;
Published online: 04 April 2011.
Edited by:
Mark R. Cookson, National Institutes of Health, USAReviewed by:
Michal Zochowski, University of Michigan, USATim Mhyre, Georgetown University Medical Center, USA
Roland Brandt, University of Osnabrück, Germany
Jürgen Kurths, Universität Potsdam, Germany
Copyright: © 2011 Levine-Small, Yekutieli, Aljadeff, Boccaletti, Ben-Jacob and Barzilai. This is an open-access article subject to a non-exclusive license between the authors and Frontiers Media SA, which permits use, distribution and reproduction in other forums, provided the original authors and source are credited and other Frontiers conditions are complied with.
*Correspondence: Ari Barzilai, George S. Wise Faculty of Life Sciences, Department of Neurobiology, Tel Aviv University, Tel Aviv 69978, Israel. e-mail:YXJpYkB0YXVleC50YXUuYWMuaWw=; Eshel Ben-Jacob, Faculty of Exact Sciences, School of Physics and Astronomy, Tel Aviv University, Tel Aviv 69978, Israel. e-mail:ZXNoZWxiakBnbWFpbC5jb20=