 Fivos Panetsos1,2*
 Abel Sanchez-Jimenez1,3 Elena Rodrigo-Diaz1,2 Idoia Diaz-Guemes4 and Francisco M. Sanchez4
- 1 Neurocomputing and Neurorobotics Research Group, Complutense University of Madrid, Madrid, Spain
- 2 School of Optics, Complutense University of Madrid, Madrid, Spain
- 3 Faculty of Biology, Complutense University of Madrid, Madrid, Spain
- 4 Applied Research, “Jesus Uson” Minimally Invasive Surgery Centre, Caceres, Spain
Most work on visual prostheses has centered on developing retinal or cortical devices. However, when retinal implants are not feasible, neuroprostheses could be implanted in the lateral geniculate nucleus (LGN) of the thalamus, the intermediate relay station of visual information from the retina to the visual cortex (V1). The objective of the present study was to determine the types of artificial stimuli that when delivered to the visual thalamus can generate reliable responses of the cortical neurons similar to those obtained when the eye perceives a visual image. Visual stimuli {Si} were presented to one eye of an experimental animal and both, the thalamic {RThi} and cortical responses {RV1i} to such stimuli were recorded. Electrical patterns {RThi*} resembling {RThi} were then injected into the visual thalamus to obtain cortical responses {RV1i*} similar to {RV1i}. Visually- and electrically generated V1 responses were compared. Results: During the course of this work we: (i) characterized the response of V1 neurons to visual stimuli according to response magnitude, duration, spiking rate, and the distribution of interspike intervals; (ii) experimentally tested the dependence of V1 responses on stimulation parameters such as intensity, frequency, duration, etc., and determined the ranges of these parameters generating the desired cortical activity; (iii) identified similarities between responses of V1 useful to compare the naturally and artificially generated neuronal activity of V1; and (iv) by modifying the stimulation parameters, we generated artificial V1 responses similar to those elicited by visual stimuli. Generation of predictable and consistent phosphenes by means of artificial stimulation of the LGN is important for the feasibility of visual prostheses. Here we proved that electrical stimuli to the LGN can generate V1 neural responses that resemble those elicited by natural visual stimuli.
Introduction
Loss of vision is a major challenge for science today. Over 124 million of the world population has low vision and 37 million people are blind (WHO, 2003). A person with impaired vision is vulnerable, discriminated against, often poorly educated and lacking social protection, and besides has to deal with the obvious problems of transport, difficulties accessing buildings, etc. The severely reduced quality of life of the blind has meant that developing visual prostheses is one of the highest priorities in the field of Biomedical Engineering. Blindness is the consequence of either an inability of the visual system to transduce light energy into electrical signals or failure of the neural electrical signals to reach the higher centers of the brain (Thanos et al., 2007). The research efforts of engineers and neuroscientists have focused on trying to create electronic and neuro-electronic devices to replace the damaged segments of the eye and/or the visual pathway (Dowling, 2005; Thanos et al., 2007; Normann et al., 2009; Tehovnik et al., 2009). However, the extreme complexity of the problems that need to be solved (engineering, information processing, and biological) make it a very difficult scientific challenge.
The work presented here addresses the feasibility of implanting a visual neuroprosthesis in the thalamus to obtain direct electrophysiological evidence that visual sensations generated by natural images presented to the eye can also be generated by artificially stimulating the lateral geniculate nucleus (LGN) of the thalamus. In particular, our data confirm that it is possible to induce activity in the primary visual cortex by electrically stimulating the LGN and that this activity of the primary visual cortex (V1) may be modified by varying certain parameters of the stimulus applied.
In the following sections, we summarize the features of the organization of the visual pathway as the basis for the design of a visual neuroprosthesis.
The Human Visual System
The organization of the central nervous system (CNS) is such that incoming sensory information is processed in a sequence of steps of increasing complexity by a hierarchy of neural relays. The visual system comprises three main information processing centers (retina, thalamus, and cortex) connected via a number of parallel circuits, each of them being to some extent serial (Mason and Kandel, 1991). The retina is the eyeball’s inner lining onto which images of the outside world are projected by the light that enters the eye (Figure 1, top, inset). These images formed at the retina consist of continuous multidimensional stimuli formed by spatiotemporal and intensity patterns of different wavelengths of light. A sheet of photoreceptors, similar to the pixels in a charge-coupled device (CCD) camera, transforms these images into another multidimensional pattern, but this time made up of a spatiotemporal, and intensity pattern of electrical signals (Saito et al., 1978). Still in the retina, these patterns are further processed by a network of bipolar, horizontal, amacrine, and ganglion cells, to extract their spatial, temporal, intensity, and color features (Dowling, 1979). The optic nerve, an information pathway formed by the fibers (axons) of the ganglion cells, transmits the output from the retina to the LGN of the thalamus (Figure 1, top). Here the visual input is further processed and more feature extraction is performed. Via their optic radiations, LGN neurons project their axons directly to the primary (V1, Figure 1, top), the primary recipient of visual input from the thalamus. The output from V1 reaches higher visual cortical regions for further processing and perception, but this output is also transmitted back to the LGN (Mason and Kandel, 1991; Figure 1, top). The feedback input from the cortex to the thalamus constitutes the main source of visual information for the LGN (≈50% is received from the cortex and ≈10% from the retina) and also determines which information arriving from the retina will be processed by the thalamus and how this will be done (Cudeiro and Sillito, 2006; Kastner et al., 2006; Sillito et al., 2006).
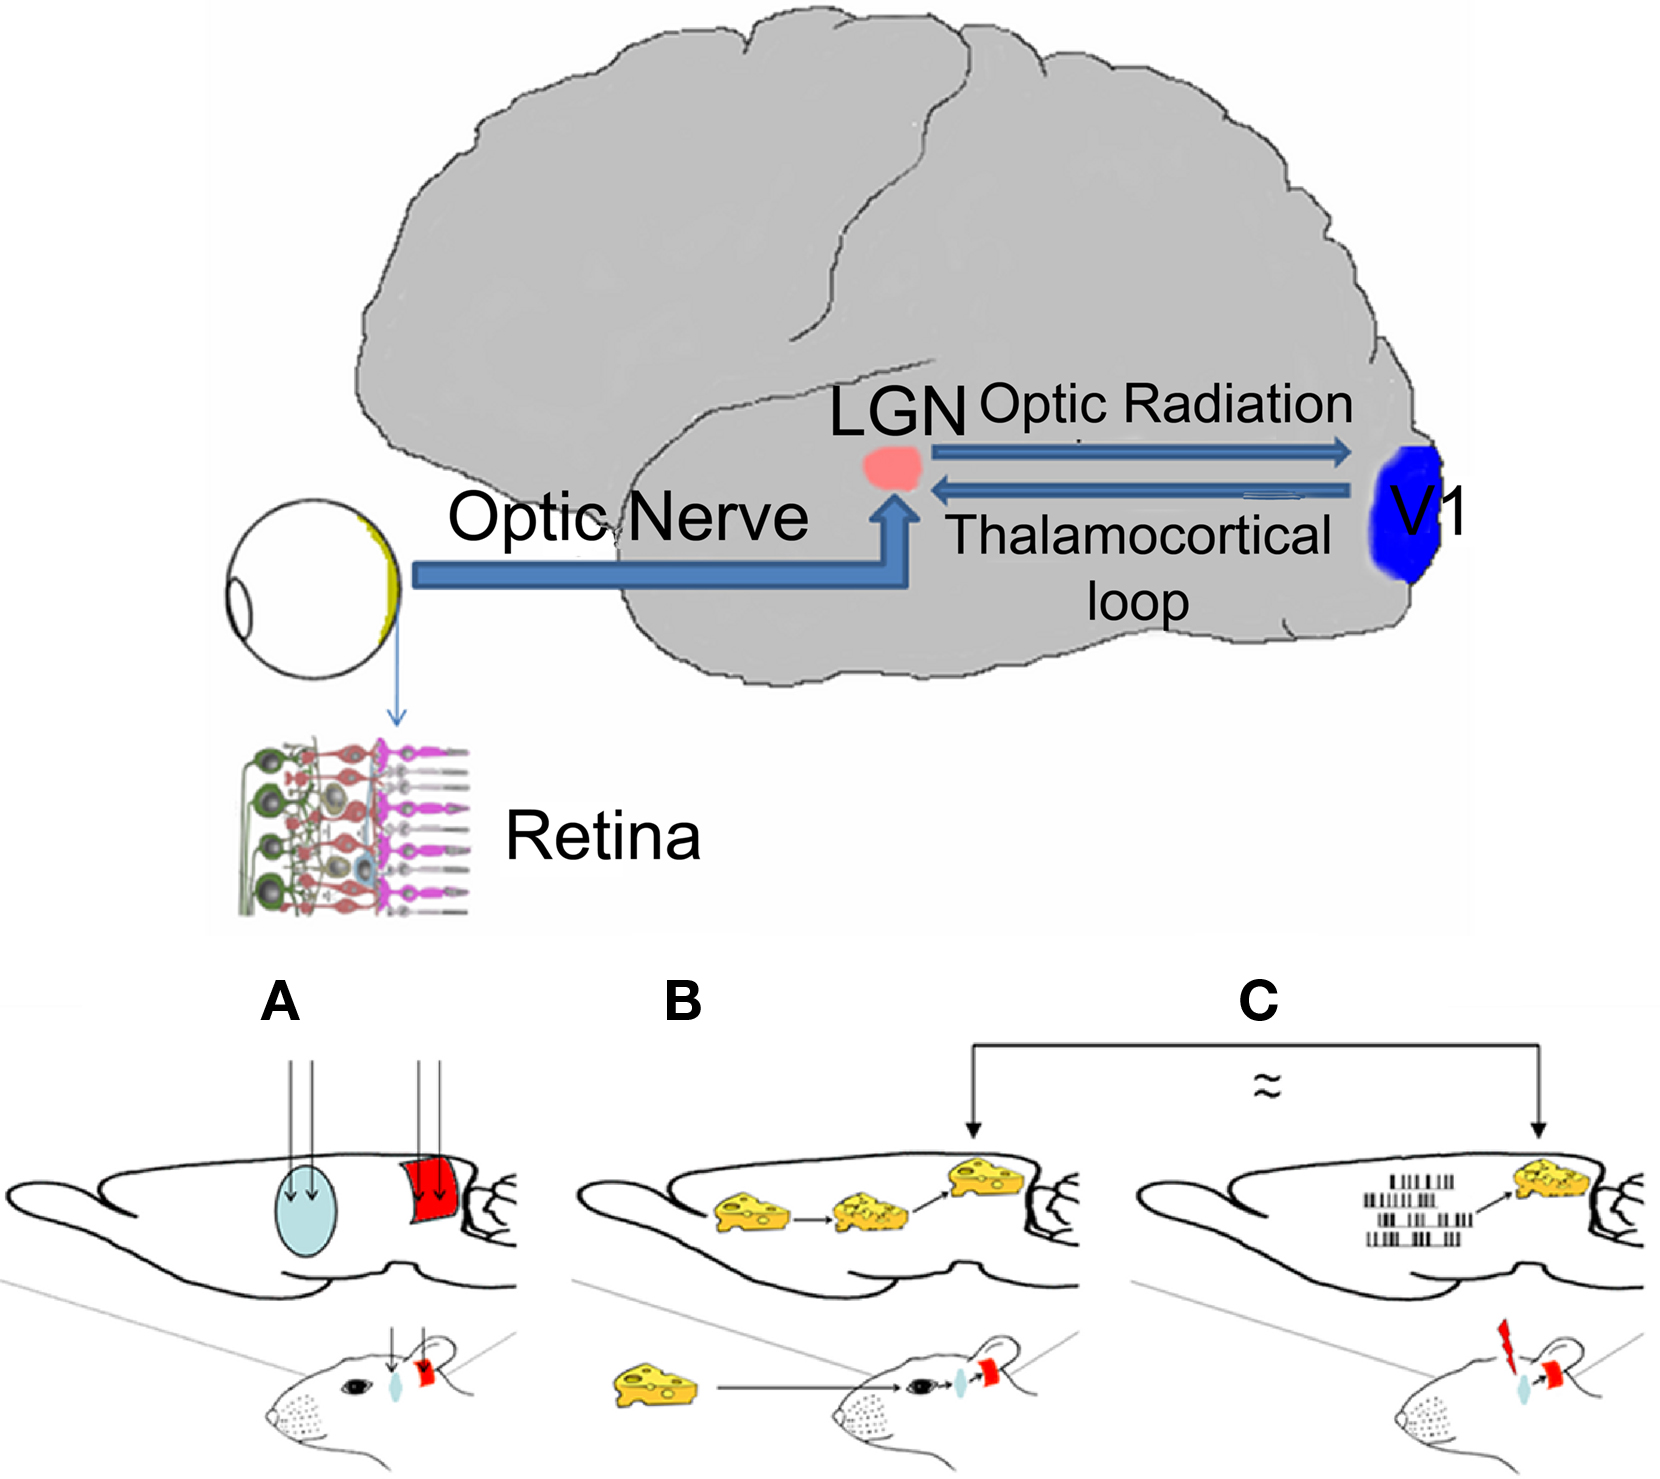
Figure 1. Top. Diagram of the visual sensory system (thick line) of the human brain. Arrows indicate visual information flow from the retina to the primary visual cortex and back to the thalamus. Only the right hemisphere is depicted. LGN: lateral geniculate nucleus of the thalamus; V1 primary visual cortex; inset: cross-section of the retina. Bottom Rationale of the experiment: (A) Diagram of the rat brain showing the implant sites of the electrodes in the two relay nuclei of the visual pathway: thalamus (blue) and cortex (red). (B) Visual stimuli enter the eye and excite the retina; neural signals are generated and sent to the thalamus (blue) through the optic nerve; thalamic neurons are activated and their output is sent to the cortex; the cortex is activated and the image is perceived. (C) In the absence of visual signals, the LGN is artificially electrically stimulated; the output from the LGN is transmitted to the cortex and then perceived as a visual stimulus/phosphene. Electrodes (only depicted in the first image) are placed in LGN and V1; these are used for both recording and stimulation in the former and only for recording in the later.
Visual perception is therefore the result of a cascade of electric activity patterns. However, visual percepts (sensations of spots of light called phosphenes) can be generated by electrical microstimulation of visual neural structures (Brindley and Lewin, 1968; Dowling, 2005; Cohen, 2007; Pezaris and Reid, 2007). In effect, the biophysical basis for visual prostheses has been to try to generate consistent phosphenes perceived by the brain as representations of the external world (Brindley and Lewin, 1968; Dowling, 2005; Cohen, 2007; Thanos et al., 2007).
Visual Prostheses
As mentioned, blindness results from either an inability of the visual system to transduce light energy into electric signals or a failure of the generated signals to reach the higher relay stations of the visual pathway. Visual percepts (phosphenes) are sensations of spots of light (Cohen, 2007; Tehovnik et al., 2009) and can be generated by electrical microstimulation of the retina, optical nerve, LGN, or V1 (Saito et al., 1978; Dowling, 1979; Thanos et al., 2007).
Retinal prostheses act as a substitute for the photoreceptors (Krisch and Hosticka, 2007). They have many advantages: (i) are placed in the first relay station of the visual pathway so they need not take into account any previous image processing; (ii) benefit from all information processing steps of the visual pathway to analyze their artificial input in a natural manner; (iii) the retinotopy of the visual pathway allows us to control dimensions and location of the elicited phosphenes; (iv) the plasticity of the CNS allows us to provide “biased/incorrect” visual input and be sure that the visual pathway will adapt itself to process such input and extract useful information; and (v) the corticothalamic loop helps such adaptation by selecting the most consistent LGN activity according to what V1 is expecting to process and perceive from the artificial input. However they need undamaged retinas and intact optic nerves, being suitable for a limited number of patients (Lakhanpal et al., 2003).
Cortical prostheses consist in arrays of epidural or intracortical electrodes (placed near to or into the neural tissue) to stimulate V1 (Dowling, 2005; Chowdhury et al., 2008). The former are less invasive but also less precise and effective, while intracortical electrodes allow fine stimulation, precise location, and higher resolution. Cortical prostheses are suitable for almost any kind of blind patients and offer a very good resolution in the macular area. However (i) V1 is non-linear and non-conformal with visual space; (ii) V1 receives and analyses complex visual information processed by the previous relay stations and coded in the spike trains of the thalamic neurons; nevertheless, similar information cannot be injected to V1 neurons by the electrodes of a visual prosthesis; (iii) V1 implants do not allow the visual system to use the continuous feedback of the thalamo-cortical loop; and (iv) V1 is the third relay station of the visual pathway so cortical implants can make very limited use of the adaptability of the CNS to process our artificial visual information.
In optic nerve implants, multipoint cuff electrodes, similar to those used in functional neuromuscular stimulation, are placed around the optic nerve. Then, by means of complex patterns of electrical stimuli, subsets of axons or even individual fibers are selectively stimulated (Kanda et al., 2004). Thought as an intermediate solution between retinal and cortical prostheses, they face two serious problems: (i) a fine retinotopy has not been reported in the fibers within the nerve and (ii) multiple groups of axons cannot be selectively and simultaneously stimulated.
Finally, when the retina and/or the optic nerve are damaged or not functioning an excellent target for visual neuroprostheses is the thalamus: (i) LGN neurons have similar organization and receptive fields to the retinal neurons from which they receive visual input and respond to simple, well characterized stimuli as their afferents do (Nakauchi et al., 2005); (ii) the center of the retina is spatially overrepresented facilitating implants in loci corresponding to the center of the visual field (Mason and Kandel, 1991; Peterman et al., 2003); (iii) thanks to the anatomical–physiological organization of the thalamo-cortical connections(Alteheld et al., 2007) stimulation of small numbers of LGN neurons should achieve simple, focal percepts (Mason and Kandel, 1991; Alteheld et al., 2007); (iv) LGN cells receive a massive cortical feedback that directly control the processing capabilities of these neurons conditioning and selecting which visual information will reach V1 (Panetsos et al., 1995).
Despite the aforementioned advantages of thalamic neuroprostheses and the demonstration that artificial visual percepts can be generated through thalamic microstimulation (Mason and Kandel, 1991) LGN has rarely been taken into account in the development of prosthetic visual devices (Tehovnik et al., 2009) and almost all research activity has been devoted to the development of retinal and cortical implants.
Electrical Microstimulation of the Visual Thalamus
The rat LGN is the main source of visual input to the cortex (Cleland et al., 1971; Ribak and Peters, 1975; Hughes, 1977; Coleman and Clerici, 1980; Sanderson et al., 1991) and mainly generates excitatory responses of the cortical neurons. Electrical stimulation of the LGN in co-cultures of LGN-Cx tissues elicits almost only excitatory responses (Hamasaki et al., 1987; Yamamoto et al., 1989) and in vivo stimulation by single monophasic pulses produces excitation (60%) or inhibition (40%), almost all responses being monosynaptic (82.5%; Fukuda and Sugitani, 1974; Saez et al., 1998). Although the neurochemistry of geniculo-cortical connections has not been extensively studied, excitatory amino acids could be responsible for these cortical responses (Johnson and Burkhalter, 1992). In addition, controlled electrical microstimulation of the visual thalamus generates phosphenes that are perceived as such by awake animals (Pezaris and Reid, 2007).
Experimental Goals of the Present Study
This study was designed to examine the manner in which electrical stimuli delivered to the visual thalamus generate reliable and strong cortical responses, similar to those obtained when images are presented to the eye, and to determine a range of stimulation parameters that could be used for this purpose. Within this context, four experimental goals were pursued:
The first goal was to determine the appropriate stereotaxic coordinates to implant our electrodes so that the visual thalamus could be functionally stimulated, and in particular the coordinates of the fovea. The spatial arrangement of the electrodes of an implanted neuroprosthesis should reflect the spatial organization of the retina that it is intended to replace. This is feasible in principle, since the retinotopic organization of the visual pathway determines a physical correspondence between the photoreceptors in the retina and the neurons of each relay station (retinotopic maps) and the activation of adjacent photoreceptors elicits, in each relay nucleus, responses in neurons located close to each other (Cudeiro and Sillito, 2006; Cohen, 2007). By sampling the responses of LGN neurons to visual stimuli, we tried to generate a 3D model of the LGN and identify the zone corresponding to the fovea, which is the small area that relays most of the visual input from the retina.
Our second goal was to estimate the neural response variables [spiking frequency, latencies, duration of the responses, interspike intervals (ISI), etc.] of the LGN and V1 mainly involved in information coding of black and white geometric figures. This was needed to induce cortical activity via electrical stimuli delivered to the thalamus and to compare patterns of cortical activity to those evoked by visual stimuli. Despite the fact that neural codes have not yet been deciphered, these variables were selected because it is commonly accepted that they constitute a major proportion of the neural codes (MacKay and McCulloch, 1952; Gielen et al., 1988; Bialek and Zee, 1990). We thus extended the maps created for the first goal to include these variables.
Once the maps had been established, we determined the ranges of stimulation parameters (intensity, duration, number of pulses, frequency, etc.) required to achieve orthodromic stimulation of individual cortical neurons, and modulate the responses of V1 cells. Although electrical stimulation of the LGN could also antidromically activate cortical neurons, it is known that by adjusting stimulation parameters, orthodromic activation can be achieved (Fukuda and Sugitani, 1974; Saez et al., 1998).
Our final goal (Figure 1, bottom) was to present a series of visual stimuli {Si} to one eye of an animal and record the cortical responses {Rcxi} to such stimuli and to then inject electrical patterns into the visual thalamus and modify these thalamic stimuli until cortical responses {Rcxi*} similar to {Rcxi} were produced.
Materials and Methods
To determine the stereotaxic coordinates for the electrodes and then estimate the stimulation parameters needed for orthodromic activation of individual cortical neurons, we systematically recorded responses to visual stimuli in both the LGN and V1 and created 3D models reflecting the electrophysiological characteristics of their neurons. Next, by obtaining simultaneous recordings in the two regions, we correlated the responses of thalamic and cortical neurons elicited by different visual patterns. Finally, we estimated the ranges of the electrical stimulation parameters that evoked useful responses in V1 neurons by delivering different stimuli to the LGN while recording cortical responses.
Surgery and Electrode Implants
Data were obtained from urethane-anaesthetized (1.5 g/kg i.p., n = 121) or sodium pentobarbital-anaesthetized (35 mg/kg i.p., n = 27) Wistar rats of both sexes, weighting 200–240 g and also from four adult rabbits anaesthetized with propofol and desflurane (the procedure and doses for the rabbits are described below). Experiments, animal handling, housing, surgery, and sacrificing were approved by the UCM ethical committee and carried out according to national legislation (R.D. 1201/2005) and EU Directives on this matter (86/609/EC).
For rats, the experimental procedure was similar to that described in Panetsos et al. (1995). Animals were placed in a stereotaxic device that enables performing visual experiments (Narishige SN – 3N or Kopf 1340). An incision was made in the skin, muscles were removed, one or two holes were drilled in the skull following the atlas of Paxinos and Watson (1998), the dura was removed and electrodes introduced into the brain. Drying of the exposed neural surface was prevented by covering with vaseline oil. The anesthesia level was controlled by the amplitude of the electroencephalogram (EEG) recorded through an insulated (except at the tip) 1 mm diameter Cr – Ni electrode introduced in the frontal cortex at a depth of 1.0 mm. An additional dose of anesthetic was administered when a reduction in wave amplitude and reaction to noxious stimuli was observed. Animals were artificially ventilated under control of the end – tidal concentration of CO2. Rectal temperature was kept at 38 ± 0.2°C using a servo-controlled abdominal heating pad (Letica Scientific Instruments Spain, model HB101/2).
The procedure for the rabbits was as follows. In a first step conducted under aseptic conditions, animals were operated on to implant the electrodes in the LGN and V1. The skull was then sealed with acrylic cement, the muscles and skin were sutured, and the animals were reintroduced in their boxes and left to wake up. After 1–2 months, they were anaesthetized again for mapping (two animals) or the experimental procedure (two animals). For surgery, an initial dose of midazolam 0.25 mg/kg (Dormicum™ 5 mg/ml, Roche, Madrid, Spain) was delivered. Animals were artificially ventilated and gas anesthesia was induced using propofol (5 mg/kg, Recofol™, Shering España S.A., Madrid, Spain) and maintained by a combination of 11% desflurane (1.25 MAC, Suprane™, Baxter S.L, Valencia, Spain) in 0.5 l of oxygen. Endotracheal intubation and muscle relaxation was facilitated by a subcutaneous injection of vecuronium bromide (0.25 mg/kg, Norcuron™ 10 mg, NV Organon, Holland) and buprenorphine (0.05 mg/kg, Buprex™, Schering – Plough SA, Madrid, Spain) delivered immediately after the preanesthesia. For the implant of the electrodes, the coordinates of LGN and V1 were calculated according to the Atlas of Girgis and Shi-Chang, (1981)37. The animals were always monitored. Enrofloxacin (5–10 mg/kg) was given as antibiotic prophylaxis and meloxicam (0.1 mg/kg) was administered over 4 days for pain relief.
Electrode placement was guided by X-ray imaging (Figure 2A and inset). At the end of each experiment, the animals were deeply anaesthetized (with sodium pentobarbital, 45 mg/kg, i.p.) and sacrificed by an intracardiac injection of hypertonic NaCl solution (3 ml).
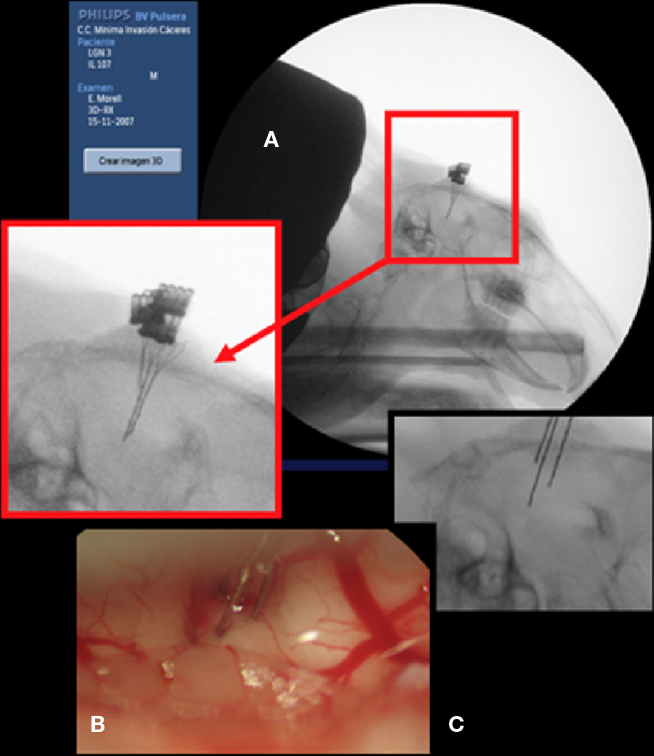
Figure 2. Implant of multielectrode probes. (A) X-ray image of three tetrodes implanted in the visual thalamus and cortex of a rabbit. (B) External dorsolateral view of a tetrode implanted in the thalamus of an anaesthetized rat. (C) Tips of thalamic electrodes visibly distant from one from the other.
Tungsten microelectrodes (2.0 MΩ, World Instruments Precision) were introduced vertically to the brain at the appropriate stereotaxic coordinates for sampling the LGN and V1 responses. At the same sites, we then implanted groups of multielectrodes for stimulations and recordings: probes with four – six tip FHC probes (2.0 MΩ) or tetrodes (0.5–0.8 MΩ, Figure 2B) home made from 50 to 125 μm diameter thread tungsten wires coated with four layers of Teflon according to the Neuralynx method (www.neuralynx.com). The two tetrodes inserted into the LGN were separated by a distance of 0.5–1.5 mm (Figure 2C).
Stimulations and Recordings
Neural responses were sampled as steps of 200 μm in depth along the rostro-caudal and mediolateral axes while flash stimuli (Grass model PS33, 20–40 stimuli at 1 Hz) were presented to the open eye. The visual patterns used for LGN–V1 correlations were static geometric black and white figures: a circle, ring of light, white cross on black background, black cross on a white background, horizontal stripes, etc. These patterns were generated on a PC screen (324 × 244 mm, resolution of 1024 × 768 pixels) at 1.0 m and applied at a frequency of 0.3 Hz. Upon each stimulus, a TTL synchronization signal was sent to the data acquisition system. Single channel recordings were performed using Micro1401 hardware by CED with accompanying Spike2 software; multielectrode recordings using a PCI – 6071E data acquisition card from National Instruments, with the Recorder software amplified and displayed on a Plexon Inc PCI device, stored and then imported to a Spike2 software and analyzed using MATLAB (©MathWorks Corp) and Spike2 software. Spikes were sampled and digitized at 20 kHz and local field potentials, EEG and synchronization pulses at 1.0 kHz, all stored in personal computers and then processed off-line. Visual stimulations were monocular and all experiments were performed in the dark.
Electrical stimulation was performed by current injection through the tips of the tetrodes implanted in the LGN using SIUs (World Instruments Precision, A365 and A360 Stimulus Isolator Units) controlled by Spike software through the Micro1401 mk II data acquisition unit.
Data Analysis
The significance level in all statistical tests is 0.05. When multiple comparisons were carried on, Bonferroni correction was applied (division of the significance level by the number of tests) to avoid an increase of the probability of type I errors.
To characterize cortical responses we considered the distributions of: (i) spiking densities [i.e., peristimulus histogram (PSTH) distribution], (ii) duration of the responses, and (iii) ISIs and compared the distribution patterns observed following electrical stimulation of the thalamus to those obtained after visual stimulation of the eye. First we compared mean (μ) and SD (σ) of each variable between the V1 response elicited by one of the visual stimuli (e.g., black and white vertical bars of 0.15 cycles/°) and the response elicited by one of the electrical stimuli. If significant differences were found in the comparison (t-tests for mean and F-tests for SD), we proceeded to adjust the parameters of the electrical stimulus until no significant differences were found. Then we compared PSTHs and ISIs distributions of both optical and electrical responses by means of Kolmogorov–Smirnov tests. Cortical responses fulfilling these criteria were assumed to correspond to similar visual percepts. To obtain a common distribution of the neural responses to use for the generation of the artificial stimuli we subtracted background activity from the PSTH and then we applied a moving average filter (span = 5) to eliminate noisy peaks. The resulting spike distribution was fitted to a Gaussian distribution by means of non-linear regression.
Results
Determining the Appropriate Coordinates for Functional Stimulation of the Visual Thalamus
Thirty-eight rats and two rabbits were used to map the neural responses of the LGN and V1, create 3D representations of the nuclei and to determine correlations of the neural responses. For each recording point, we considered spike densities, initial and peak response latencies as well as duration of the responses to flash stimuli (Figure 3). LGN neurons (n = 1303) fired 0.2 ± 0.09 spikes/ms per stimulus with an initial response latency of 43.8 ± 8.9 ms and peak response latency of 62.0 ± 19.2 ms (here and below results are shown as mean ± SD). 69.1% of the neurons showed a second component in their response, which was attributed to corticothalamic feedback, whose initial and peak latencies appeared 54.8 ± 43.1 ms and 53.6 ± 40.3 ms after those of the first component. The magnitude of this response was similar to the first one: 0.2 ± 0.2 spikes/ms per stimulus but its length was somewhat shorter (45.0 ± 29.5 ms and 39.0 ± 23.4 ms). V1 responses (n = 1189) lasted 153.8 ± 68.7 ms and were followed by a background activity of up to 500 ms. Their initial response latency was 70.8 ± 21.3 ms and peak latency was 104.9 ± 32.6 ms, firing 0.1 ± 0.08 spikes/ms per stimulus.
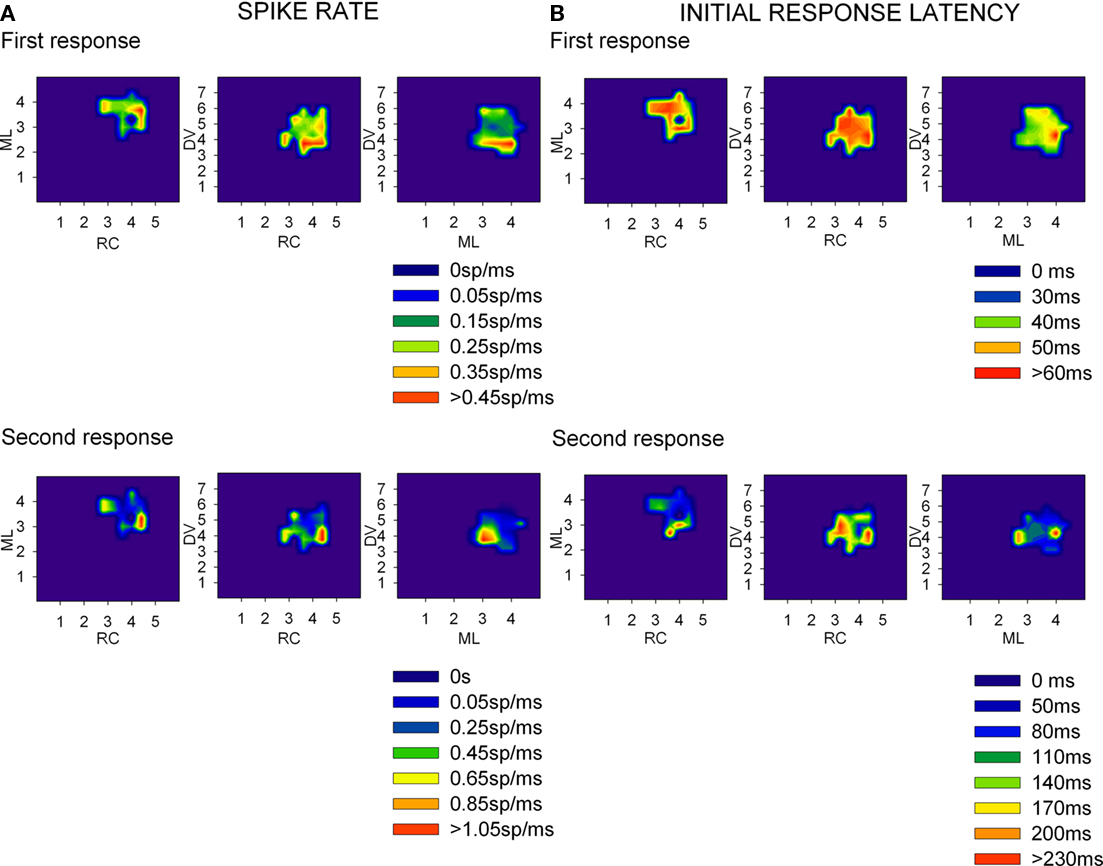
Figure 3. Spike rate (A) and initial response latency (B) densities from LGN recordings across rat brain’s stereotaxic coordinates. Several recordings were obtained at each coordinate and then the average of each response parameter was plotted as a density trace for each pair of coordinates (rostro-caudal (RC) as mm from Bregma, medial-lateral (ML) as mm from the midline, and Dorso-ventral (DV) as mm from the brain surface). The top row of graphics at each panel correspond to the first component of the response (sensorial response) while the bottom one correspond to the second component (assumed corticothalamic loop response).
Lateral geniculate nucleus of the thalamus responses to the geometric figures (n = 521) began at 54.5 ± 12.8 ms, lasted 135.4 ± 68.5 ms, and peaked after 23.8 ± 8.8 ms. Mean spiking frequency was 0.14 ± 0.06 spikes/ms per stimulus showing a Gaussian distribution (p ≥ 0.05, Kolmogorov–Smirnov Test). In contrast, V1 responses started at 59.5 ± 22.8 ms, lasted 182.1 ± 94.0 ms, and peaked 78.8 ± 63.6 ms after the response onset (n = 521). This time, the mean spiking frequency was 0.15 ± 0.07 spikes/ms per stimulus.
Determining the Stimulation Parameters Needed for Orthodromic Activation of Cortical Neurons
Another 74 rats were used to assess the dependence of the V1 response parameters on the properties of the electrical stimuli delivered to the LGN. We started with single pulses of increasing intensity (100–600 μA) and duration (50–100 μs) and then delivered trains of electrical stimuli. The minimum intensity necessary to evoke a single orthodromic response was always determined. V1 responses were mainly affected in terms of their duration and spiking rate. The values reported below were normalized to make comparisons.
With respect to the intensity of the stimulus, there are significant differences in the mean duration of V1 responses between 100 and 300 μA on one hand and 300 and 600 μA on the other. (p < 0.0001 in both cases, paired t-tests, n = 144, Figure 4A). V1 mean response length significantly increased from 100 to 600 μA in a linear manner (length = 0.424883 + 0.000926176*stimulus intensity, r = 0.72, p = 0.0 ANOVA). This ANOVA was calculated on the beta coefficient (slope) of the regression line to contrast if it was 0 or not. In this case we exclude it was 0 and, consequently, the two variables (stimulus intensity and response duration) are independent. Similarly, mean spiking rate increased between 100 and 300 μA (p < 0.0001, paired t-test, n = 144, Figure 4A) but not between 300 and 600 μA (p = 0.60, paired t-test, n = 144, Figure 4B). Mean response duration significantly increased with the duration of the stimuli (50–100 μs, response length = 0.579418 + 0.00420582*Stimulus duration, r = 0.55, p = 0.0 ANOVA. p < 0.0001, paired t-test, n = 108, Figure 4B) and the same behavior was observed in the number of the spikes (N spikes = 0.653495 + 0.00301326*Stimulus duration, r = 0.42, p = 0.0 ANOVA p < 0.0001, paired t-test, n = 108, Figure 4B). Results are summarized in Table 1. However, the mean spiking rate was not affected (p = 0.82, paired t-test, n = 108, Figure 4B). In short trains we varied the number of pulses (3–4), number of trains (up to 7), and stimuli duration (15–50 ms) at 20–66 Hz.
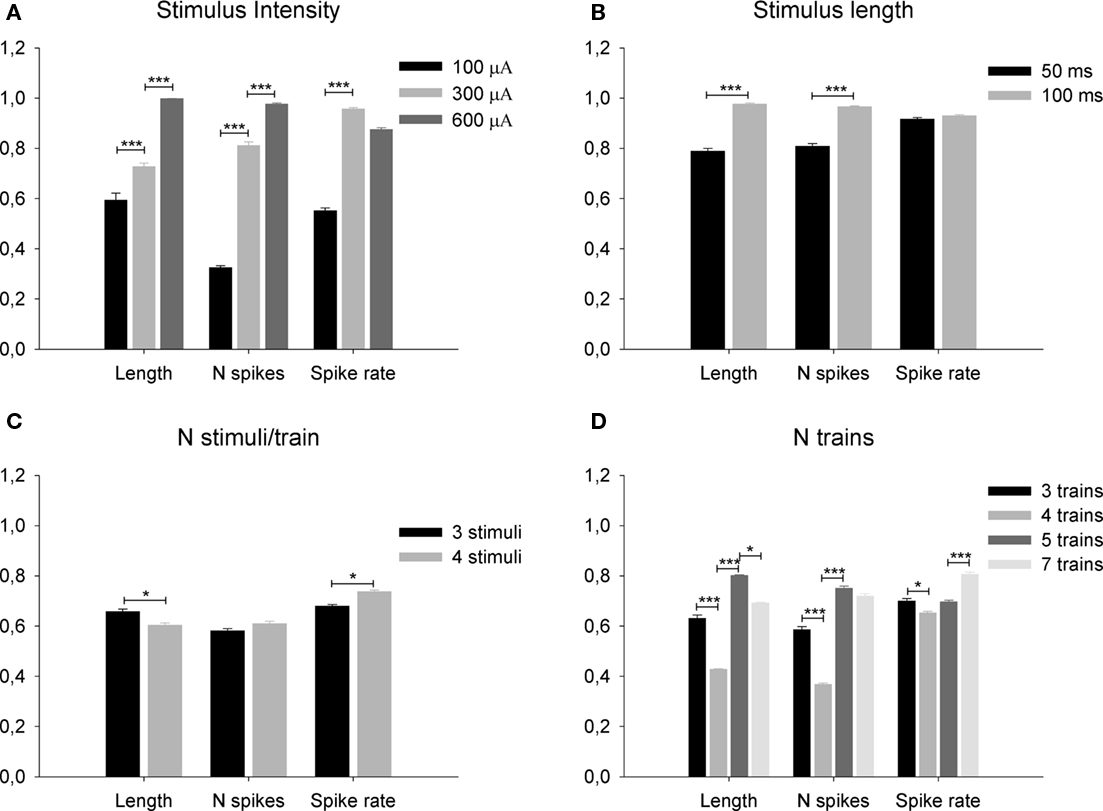
Figure 4. Effect of different parameters of the thalamic electrical stimulation [stimulus intensity (A) and length (B) of single stimuli and number of stimuli per train (C) and numbers of trains (D) of composite stimuli] on length, number of spikes and spiking rate of the evoked cortical response. All data has been normalized for comparisons. (*) p < 0.05, (**) p < 0.01, (***) p < 0.001.
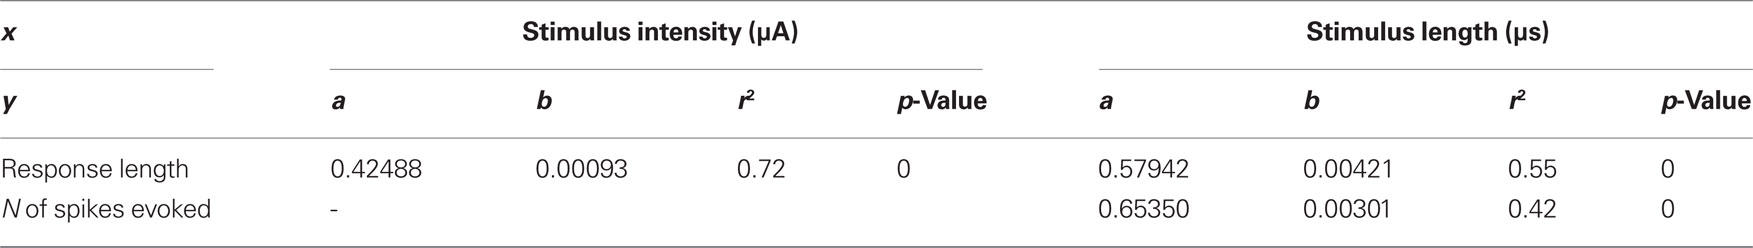
Table 1. Lateral geniculate nucleus of the thalamus response features dependence on stimulation parameters linear regression (Y = a + bx).
V1 responses shortened as the train pulses increased (see Figure 4C) but they did not show a linear relationship with the number of trains: from three to four trains the response length was reduced; from four to five it increased and thereafter it stabilized (Figure 4D). The number of spikes evoked was not significantly affected by the number of pulses within trains (p = 1.0, paired t-test between 3 and 4 pulses/train, n = 104, Figure 4C). Other statistical relations were not observed (see Figure 4D). The spiking rate ranged from 0.25 to 0.32 spikes/ms and was never affected by any of the stimulation parameters (always p > 0.999). Results are summarized in Table 2. Cortical responses comparable to those obtained with the visual stimuli could be elicited by more than one electrical stimulation pattern.
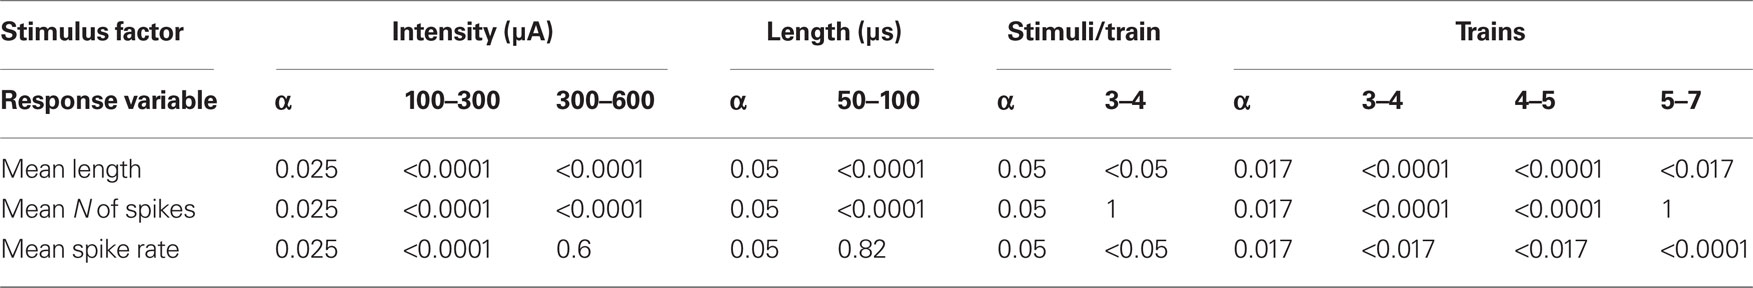
Table 2. Changes on V1 response features due to stimulation parameters paired t-tests comparisons.
Matching Visually Generated and Electrically Generated Cortical Patterns
Thirty-six acute rats (216 recordings) and two rabbits with chronically implanted electrodes were used for the complete “optical and electrical stimulation” experimental paradigm as follows (Figure 1, bottom): (i) multielectrodes were implanted in the LGN and V1 of anesthetized animals; (ii) a series of visual stimuli {Si} were presented to one eye and {Rthi} and {Rcxi} responses recorded in the contralateral thalamic (LGN) and cortical (V1) neurons respectively; (iii) the two responses were analyzed and artificial electrical stimuli {Rthi*} identified capable of mimicking the thalamic responses {Rthi} recorded during the natural stimulation of the eye, {Rthi*}≈{Rthi}; (iv) electrical patterns {Rthi*} were injected into the thalamus and cortical responses {Rcxi*} to this electrical stimulation recorded; (v) the two cortical responses {Rcxi} and {Rcxi*} were compared; and (vi), the parameters of the electrical patterns were modified until the best match between {Rcxi} and {Rcxi*} was observed.
In Figures 5A–C, we provide three examples of the PSTHs of cortical responses to visual stimuli (left) and the PSTHs of the corresponding electrical stimuli to the thalamus (right). In (a) are represented the PSTHs distributions of the cortical responses to a black dot on a white background and the responses elicited by the electrical stimulation (p = 0.76 Kolmogorov–Smirnov test). Cortical activity after the onset of the responses shows means of μ = 71.4 ms and μ = 70.3 ms (p = 0.5, t-test) and SD of σ = 37.5 ms and σ = 38.7 ms (p = 0.3, F-test) for the visual and the electrical stimuli respectively. Visually and electrically evoked distributions fitted Gaussian distributions with determination coefficients of r2 = 0.9581 (N = 1389 spikes) and r2 = 0.8473 (N = 1357 spikes) respectively. In (b) are represented the PSTHs distributions of the responses to black and white vertical bars of 0.15 cycles/° and the corresponding electrical stimulation of the thalamus (p = 0.99, Kolmogorov–Smirnov test). Cortical activity after the onset of the responses shows mean of μ = 43.8 ms and μ = 43.6 ms (p = 0.9, t-test) and SD of σ = 22.2 ms and σ = 23.2 ms (p = 0.4, F-test) for the visual and the electrical stimuli respectively. Visually and electrically evoked distributions fitted Gaussian distributions with determination coefficients of r2 = 0.9441 (N = 430 spikes) and r2 = 0.9338 (N = 367 spikes) respectively. In (c) are represented the PSTHs distributions of the responses to black and white vertical bars of 0.05 cycles/° and the corresponding electrical stimulation of the thalamus (p = 0.11 Kolmogorov–Smirnov test). Cortical activity after the onset of the responses shows means of μ = 98.8 ms and μ = 94.4 ms (p = 0.1, t-test) and SD of σ = 52.1 ms and σ = 49.4 ms (p = 0.2, F-test) for the visual and the electrical stimuli respectively. Visually and electrically evoked distributions fitted Gaussian distributions with determination coefficients of 0.8504 (N = 685 spikes) and r2 = 0.9282 (N = 665 spikes) respectively. ISIs show similar behavior. As an example, in (d) we display the ISIs distributions corresponding to the PSTHs shown in (a), p = 0.9 Kolmogorov–Smirnov test. They show means of μ = 4.1 ms and μ = 4.3 ms (p = 0.25, t-test) and SD of σ = 4.8 ms and σ = 4.9 ms (p = 0.1, F-test) for the visual and the electrical stimuli respectively. Results are summarized in Table 3.
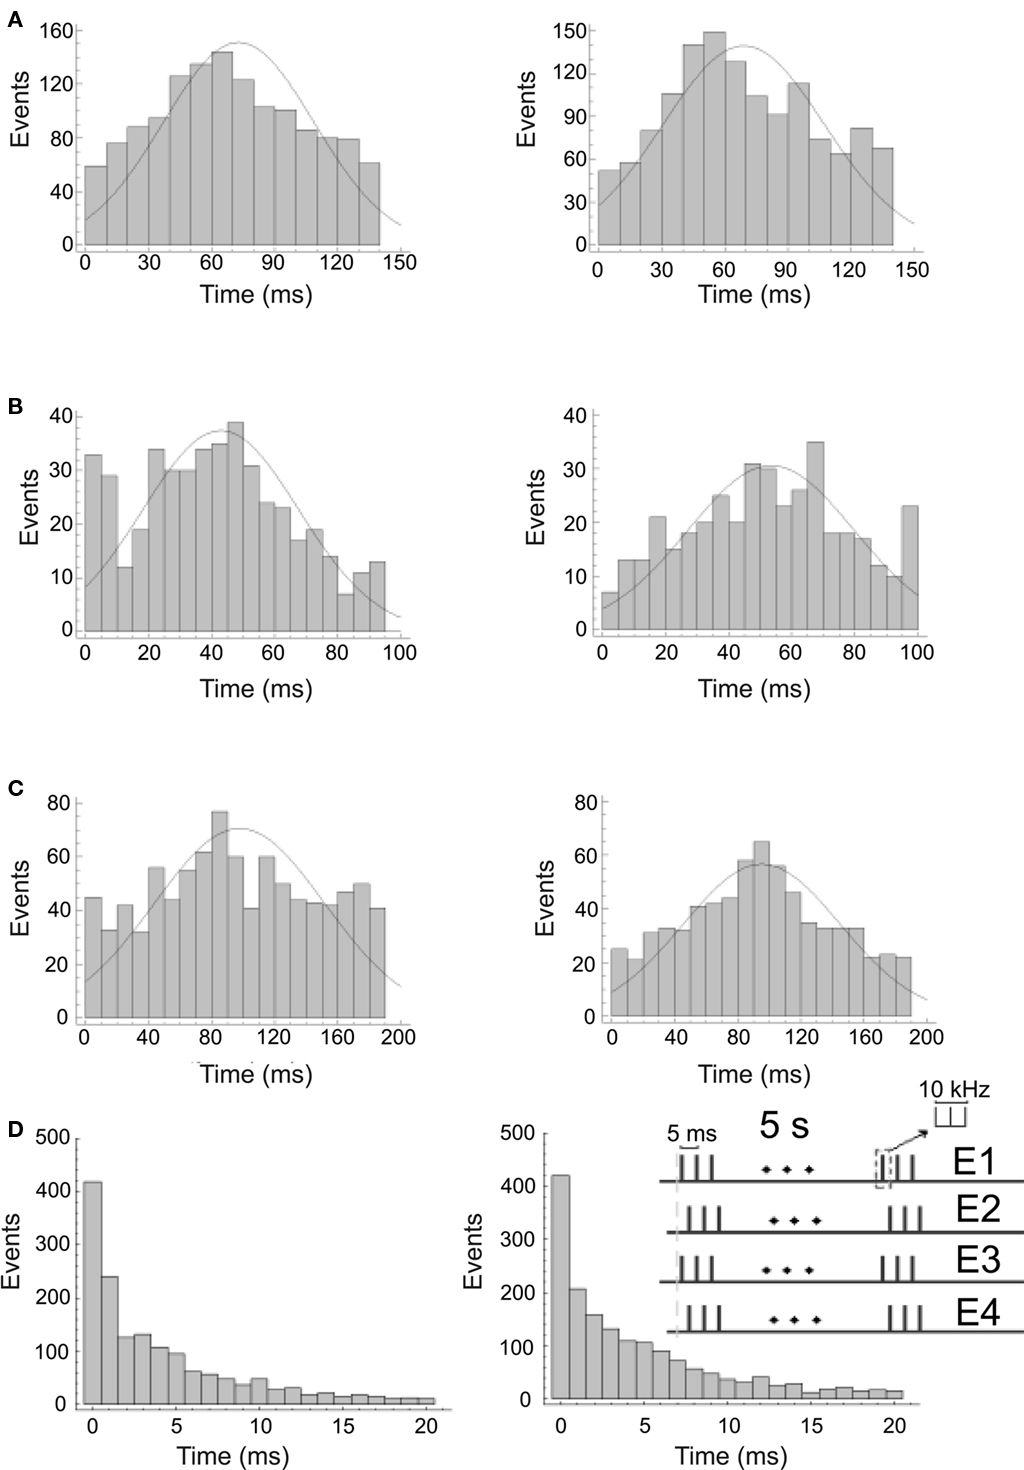
Figure 5. Cortical responses lo visual (left) and electrical stimuli (right) recorded by one of the tips of a cortical tetrode. (A–C) show the distributions of the spiking frequency of the cortical responses. (D) shows the distribution of the interspike intervals corresponding to (A). Thalamic stimulation patterns were adjusted to mimic the activity of the LGN during presentation of the visual stimuli and to elicit the best possible cortical response. Stimuli correspond to a black dot on a white background (A), black and white vertical bars of 0.15 cycles/° (B) and black and white vertical bars of 0.05 cycles/° (C). Inset in (D) shows the electrical stimulation pattern employed for this response.
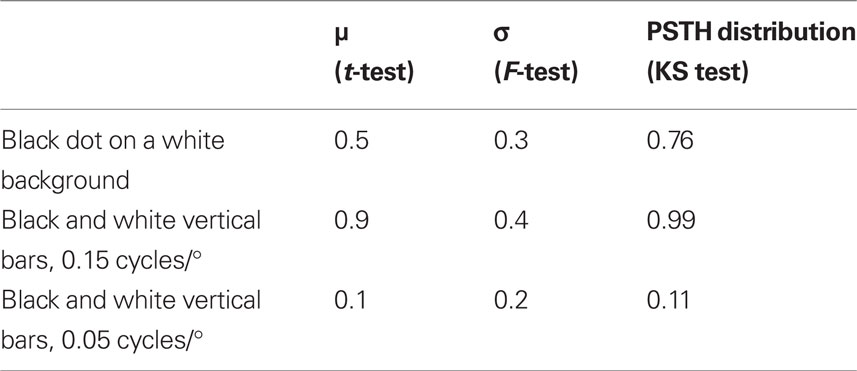
Table 3. Comparisons between visual and electrical V1 evoked responses (p-values).
To test the specificity of the electrical stimulation we compared the PSTHs and ISIs of all visually- generated responses to the electrically evoked responses for each one of the selected stimuli, following the above described procedure. In all cases differences were significant except when visually- and electrically evoked responses corresponded (Figure 5D). In general, electrical stimulation of the thalamus generated the desired cortical responses (similar to those generated by visual stimuli) only when the distribution of the electrical stimuli approached the distribution of the multiunit activity recorded in the LGN under visual stimulation. An example of the complete experiment is provided in Figure 6.
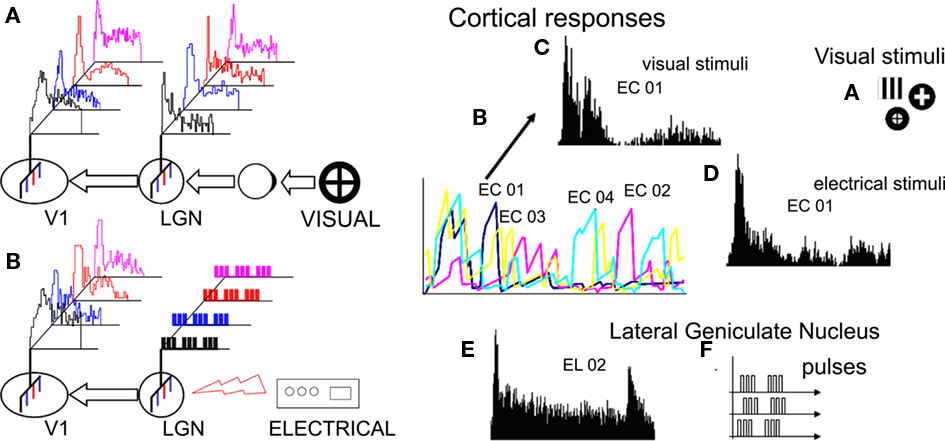
Figure 6. Left: diagram of a complete experiment. (A) A visual stimulus is presented to the eye; the photoreceptors of the retina are stimulated and an image is formed; neural signals are transmitted to the LGN whose neurons are activated and process the image; the LGN output (electric activity) is transferred to V1; V1 is activated and the image is perceived. (B) The input to the LGN is replaced with artificially generated electrical stimuli; the LGN output is transmitted to V1 and perceived. By adjusting the parameters of the electrical stimuli, we can obtain similar V1 responses in the two cases. Right. A typical experiment: Visual stimuli (A) are presented to the eye and neural responses are recorded by multielectrodes implanted in the lateral geniculate nucleus of the thalamus and the primary visual cortex. Cortical responses recorded by the four cortical electrodes (EC01–EC04) during repeated presentations of the vertical bars (30 times) shown as 3 s-long summed peristimulus histograms. Details of the responses recorded by one of the cortical electrodes (CE01) under visual stimulation by the vertical bars (C) and under electrical stimulation via the thalamic electrodes (D) shown as 1.5 s-long peristimulus histograms. Peristimulus histogram (E) of the thalamic response to the presentation of the visual stimulus recorded by the second of four LGN electrodes used for subsequent electrical stimulation (F).
Discussion
Our ongoing research addresses the topic of visual neuroprostheses implanted in the thalamus, as an intermediate visual pathway relay station between the retina and the cortex. Upon electrical stimulation, such neuroprostheses should generate visual percepts similar to those obtained by photo stimulation of the eye. The main objective of the present study was to determine which types of artificial stimulus delivered to the visual thalamus can generate reliable responses of cortical neurons similar to those obtained when visual images are presented to the eye.
In this study we: (i) characterized the response of cortical neurons to visual stimuli in terms of response magnitude, duration, spiking rate, and the ISI distribution; (ii) experimentally tested the dependence of cortical responses on a set of stimulation parameters including intensity, frequency, duration, etc., and determined the ranges of these parameters across which the desired cortical activity could be recorded; (iii) defined a measure of similarity between responses of the visual cortex as a useful tool to compare the naturally and artificially generated neuronal activity of V1; and (iv) by electrically stimulating the thalamus, we generated artificial cortical responses similar to those elicited by visual stimuli.
Visual Percepts
The neural activity recorded in response to either visual or electrical stimulation of the cortex should be equivalent to that evoked by visual percepts and similar cortical responses should correspond to similar visual percepts. Indeed, cortical activity recorded under stimulation with natural sensory stimuli, normally corresponds to specific sensory percepts (tactile, visual, acoustic), and similar sensory stimuli evoke similar neural responses and mental representations (Mountcastle et al., 1990). Thus, sensations, actions, memory, and thinking are the outcome of the electrical activity of the neural structures involved in these processes and clear correlations exist between them (Zeman, 2001; Leynes et al., 2006). Moreover, in a setting of artificial stimulation of the CNS, electrical stimulation of the sensory cortex, whether direct or indirect, elicits consistent sensory percepts (Dobelle et al., 1974; Pezaris and Reid, 2007), and our results are consistent with the work of the later on the generation of visual percepts by electric stimulation of the thalamus. In our case animals are under anesthesia so it is not possible to identify to what kind of percept should correspond the cortical responses we recorded. Such a proof is very difficult to obtain with non-human subjects even in the case of awake behaving animals. Neither the experiments of Pezaris and Reid (2007) performed on awake monkeys obtained direct evidence on the nature of the visual percepts provoked by their thalamic stimulation.
It should be mentioned that our recordings represent only a very limited sample of thalamic and cortical activity (corresponding to the internal representation of visual stimuli by the brain) and probably reflect only particular aspects/characteristics/attributes of the visual scene. The same consideration is applicable to our electrical stimulation of the visual thalamus. It is logical that 4–8 stimulation electrodes are too few to generate LGN electrical patterns capable of approximating those generated by the natural retinal input. However, pioneer researchers in the field of neuroprostheses have been able to demonstrate that sensory perception useful for real life can be achieved with only a few electrodes and simple stimulation patterns applied to the visual cortex (Dobelle et al., 1974). We should not forget that highly acceptable hearing skills can be restored by implanting a single electrode in the auditory nerve (Pfingst et al., 1989).
The above considerations are useful yet fall short of practical application. Thus, electrical stimulation of the neural structures seldom generates visual percepts of complex physical characteristics. This is probably the consequence of a small number of stimulation loci and the spatial extension of electrical stimulation recruiting several neurons/fibers. However, the initial goal of any type of visual neuroprosthesis is not to fully restore the visual capabilities of human patients. If we were only able to achieve a “rough” perception of volumes, obstacles, etc., this would still mean an enormous success. Only then will we be able to expand our research targets to achieve goals such as the perception of contours and recognition of finer features.
Thalamic Implants
Lateral geniculate nucleus of the thalamus neurons respond to simple stimuli in a similar fashion to retinal ganglion cells (Cleland et al., 1971). Consequently, fine mapping of the retinal output should help decipher the input LGN cells will receive from a visual prosthesis. However, although the LGN is retinotopically organized and the thalamic overrepresentation of the center of the retina offers a wide space for the implant of electrodes corresponding to the visual field center (Schneider et al., 2004), to date there are no precise anatomical or physiological data available to establish the ideal site for the implant of stimulation electrodes (Chen et al., 1999; Schneider et al., 2004). On the other hand, the depth of the thalamus should not represent a serious problem from a surgical standpoint, since thalamic implants could be positioned by procedures similar to deep brain stimulation approaches or the procedures for Parkinson’s disease (Marconi et al., 2008; Freund et al., 2009) that have been used in human patients.
Any visual neuroprosthetic design should benefit from the capacity of the CNS to adapt to damage to its structures and/or modifications in sensory inputs to better process the new information flow (plasticity; Panetsos et al., 1995; Jones et al., 2002). The earlier in the sensory pathways the alteration occurs, the better the adaptive response of the CNS, so prostheses implanted in the thalamus should become better integrated than cortical devices (Fernandez et al., 2005) and could then improve their performance given the plasticity properties of the sensory cortex. Electrical stimulation of the LGN can induce NMDA-dependent LTP of V1 neurons, increase the extension of their receptive fields and potentiate responses to the characteristics of the visual stimuli (Heynen and Bear, 2001). An important role in the adaptation of the CNS to the artificial input and the extraction of physical characteristics from artificial visual scenes has been ascribed to the corticothalamic loop, since the massive cortical feedback LGN cells receive from the cortex acts by conditioning and selecting the information that will reach the cortex (Cudeiro and Sillito, 2006).
Mapping of Visual Information by Electrical Stimulation Patterns
Phosphenes generation by means of electrical stimulation has several limitations. Regardless of where one stimulates, a major problem with this approach is the spread of current, resulting in problems with spatial resolution of stimulation. The spatial resolution of the stimulation could be controlled by increasing the stimulation frequency. Indeed, it is known that within neural tissue, higher temporal frequencies attenuate faster with distance than slow frequencies. Consequently, stimulation with high frequencies should lead to more spatially localized current patterns. Moreover, the development of very advanced probes with a high number of fine tips could be useful to select and stimulate individual thalamo-cortical fibers (Houweling et al., 2010); stimulation of appropriate single neuron projections could also be used to promote activation of inhibitory cortical circuits to limit spatial diffusion of the activity. However, although the architecture of the thalamic nuclei has been well established and the functional properties of their neurons have been extensively examined, the ideal type of stimulation is not “a priori” predictable and stimulation parameters need to be varied in a heuristic, trial-and-error procedure. The outcome of systematically varying such factors will also depend on the location of the implanted electrodes. Thus, information coding strategies need to be developed to transform visual information from CCD cameras into electrical signals that can then be injected into the deep structures of the brain. In turn, each of these signals should elicit specific and well-localized phosphenes, the sum of which will have to be interpreted by the CNS as representing the external world. The automatic adjustment of the stimulation parameters for each implanted electrode would also be a welcome advance. These aspects are not disadvantages of the thalamic prostheses. They are shared by the cortical and visual nerve prostheses since, from an information processing and coding perspective all three, optic nerve, thalamus, and cortex, receive similarly organized, complex input of visual information.
In this context, an important question that needs resolving is the number of electrodes required to inject useful visual information into the thalamus. “Ad hoc” information processing and coding strategies will reduce the dimension of the thalamic input. On the other hand, miniaturization of devices will increase the number of microelectrodes that can be implanted in the thalamus. Thalamic prostheses could also benefit from alternative approaches like the use of neurotransmitters instead of (or in addition to) direct electrical activity to stimulate thalamic neurons (Peterman et al., 2003) and/or other technological characteristics of stimulation devices (Chowdhury et al., 2008).
Conclusion
The generation of predictable and consistent phosphenes by means of artificial stimulation of the LGN is important for the feasibility of visual prostheses. In the present paper we prove that electrical stimulation of the LGN can generate neural responses in V1 that resemble those elicited by natural visual stimuli presented to the eye. Due to the architectonic organization of the LGN and the lower complexity of the processing of visual information it performs (if compared to V1) LGN is the best candidate for visual implants when the retina and/or optic nerve are not functional. Moreover, the direct action of V1 to the thalamic neurons through the thalamo-cortical loop allows a better adaptation of the CNS to the artificial input to the thalamus than to the cortex. Our data were obtained under anesthesia with a consequent decrease of the cortical activity and lower responses in comparison to the awake animals. Future studies oriented to the development of thalamic prostheses should be conducted on awake animals and might benefit from modeling approaches where the optimal stimulation parameters are modeled according to the structure of the visual input rather than manually tuned as here.
Conflict of Interest Statement
The authors declare that the research was conducted in the absence of any commercial or financial relationships that could be construed as a potential conflict of interest.
Acknowledgments
This work was supported by grants awarded for the projects “Connection between Central Nervous System and electronic devices” MAPFRE Medicine Foundation 2004, “Visual Prostheses” MAPFRE Foundation 2005 and “VISNE: VISual neuroprosthesis based on adaptive Neuron-silicon interfaces” Spanish National Organization for the Blind (O.N.C.E.) 2006–2009. The authors thank I. Rodriguez and J. J. Navarro Valls for preliminary experiments and Prof. Anne Burton and Vincent Jaskowski for language revision.
References
Alteheld, N., Roessler, G., and Walter, P. (2007). Towards the bionic eye – the retina implant: surgical, opthalmological and histopathological perspectives. Acta Neurochir. Suppl. 97, 487–493.
Bialek, W., and Zee, A. (1990). Coding and computation with neural spike trains. J. Stat. Phys. 59, 103–115.
Brindley, G. S., and Lewin, W. S. (1968). The visual sensations produced by electrical stimulation of the medial occipital cortex. J. Physiol. 194, 54–5P.
Chen, W., Zhu, X. H., Thulborn, K. R., and Ugurbil, K. (1999). Retinotopic mapping of lateral geniculate nucleus in humans using functional magnetic resonance imaging. Proc. Natl. Acad. Sci. U.S.A. 96, 2430–2434.
Chowdhury, V., Morley, J. W., and Coroneo, M. T. (2008). Development of an extraocular retinal prosthesis: evaluation of stimulation parameters in the cat. J. Clin. Neurosci. 15, 900–906.
Cleland, B. G., Dubin, M. W., and Levick, W. R. (1971). Simultaneous recording of input and output of lateral geniculate neurones. Nat. New Biol. 231, 191–192.
Cohen, E. D. (2007). Prosthetic interfaces with the visual system: biological issues. J. Neural Eng. 4, R14–R31.
Coleman, J., and Clerici, W. J. (1980). Extrastriate projections from thalamus to posterior occipital-temporal cortex in rat. Brain Res. 194, 205–209.
Cudeiro, J., and Sillito, A. M. (2006). Looking back: corticothalamic feedback and early visual processing. Trends Neurosci. 29, 298–306.
Dobelle, W. H., Mladejovsky, M. G., and Girvin, J. P. (1974). Artifical vision for the blind: electrical stimulation of visual cortex offers hope for a functional prosthesis. Science 183, 440–444.
Dowling, J. (1979). “Information processing by local circuits: the vertebrate retina as a model system,” in The Neurosciences Fourth Study Program, eds F. O. Schmitt, and F. G. Worden (Cambridge: MIT press), 163–181.
Fernandez, E., Pelayo, F., Romero, S., Bongard, M., Marin, C., Alfaro, A., and Merabet, L. (2005). Development of a cortical visual neuroprosthesis for the blind: the relevance of neuroplasticity. J. Neural Eng. 2, R1–12.
Freund, H. J., Kuhn, J., Lenartz, D., Mai, J. K., Schnell, T., Klosterkoetter, J., and Sturm, V. (2009). Cognitive functions in a patient with Parkinson-dementia syndrome undergoing deep brain stimulation. Arch. Neurol. 66, 781–785.
Fukuda, Y., and Sugitani, M. (1974). Cortical projects of two types of principal cells of the rat lateral geniculate body. Brain Res. 67, 157–161.
Gielen, C. C. A. M., Hesselmans, G. H. F. M., and Johannesma, P. I. M. (1988). Sensory interpretation of neural activity patterns. Math. Biosci. 88, 15–35.
Girgis, M., and Shi-Chang, W. (1981). Stereotaxic Atlas of the Rabbit Brain. St. Louis: Warren H. Green.
Hamasaki, T., Komatsu, Y., Yamamoto, N., Nakajima, S., Hirakawa, K., and Toyama, K. (1987). Electrophysiological study of synaptic connections between a transplanted lateral geniculate nucleus and the visual cortex of the host rat. Brain Res. 422, 172–177.
Heynen, A. J., and Bear, M. F. (2001). Long-term potentiation of thalamocortical transmission in the adult visual cortex in vivo. J. Neurosci. 21, 9801–9813.
Houweling, A. R., Doron, G., Voigt, B. C., Herfst, L. J., and Brecht, M. (2010). Nanostimulation: manipulation of single neuron activity by juxtacellular current injection. J. Neurophysiol. 103, 1696–1704.
Hughes, H. C. (1977). Anatomical and neurobehavioral investigations concerning the thalamo-cortical organization of the rat’s visual system. J. Comp. Neurol. 175, 311–336.
Johnson, R. R., and Burkhalter, A. (1992). Evidence for excitatory amino acid neurotransmitters in the geniculo-cortical pathway and local projections within rat primary visual cortex. Exp. Brain Res. 89, 20–30.
Jones, E. G., Woods, T. M., and Manger, P. R. (2002). Adaptive responses of monkey somatosensory cortex to peripheral and central deafferentation. Neuroscience 111, 775–797.
Kanda, H., Morimoto, T., Fujikado, T., Tano, Y., Fukuda, Y., and Sawai, H. (2004). Electrophysiological studies of the feasibility of suprachoroidal-transretinal stimulation for artificial vision in normal and RCS rats. Invest. Ophthalmol. Vis. Sci. 45, 560–566.
Kastner, S., Schneider, K. A., and Wunderlich, K. (2006). Beyond a relay nucleus: neuroimaging views on the human LGN. Prog. Brain Res. 155, 125–143.
Krisch, I., and Hosticka, B. J. (2007). Restoring visual perception using microsystem technologies: engineering and manufacturing perspectives. Acta Neurochir. Suppl. 97, 473–480.
Lakhanpal, R. R., Yanai, D., Weiland, J. D., Fujii, G. Y., Caffey, S., Greenberg, R. J., de Juan, E. Jr., and Humayun, M. S. (2003). Advances in the development of visual prostheses. Curr. Opin. Ophthalmol. 14, 122–127.
Leynes, P. A., Grey, J. A., and Crawford, J. T. (2006). Event-related potential (ERP) evidence for sensory-based action memories. Int J. Psychophysiol. 62, 193–202.
MacKay, D. M., and McCulloch, W. S. (1952). The limiting information capacity of a neuronal link. Bull. Math. Biophys. 14, 127–135.
Marconi, R., Landi, A., and Valzania, F. (2008). Subthalamic nucleus stimulation in Parkinson’s disease. Neurol. Sci. 29(Suppl. 5), S389–S391.
Mason, C., and Kandel, E. R. (1991). “Central visual pahtways,” in Principles of Neural Science, eds E. R. Kandel, J. H. Schwartz, and T. M. Jessell (New York: Elsevier), 421–439.
Mountcastle, V. B., Steinmetz, M. A., and Romo, R. (1990). Frequency discrimination in the sense of flutter: psychophysical measurements correlated with postcentral events in behaving monkeys. J. Neurosci. 10, 3032–3044.
Nakauchi, K., Fujikado, T., Kanda, H., Morimoto, T., Choi, J. S., Ikuno, Y., Sakaguchi, H., Kamei, M., Ohji, M., Yagi, T., Nishimura, S., Sawai, H., Fukuda, Y., and Tano, Y. (2005). Transretinal electrical stimulation by an intrascleral multichannel electrode array in rabbit eyes. Graefes Arch. Clin. Exp. Ophthalmol. 243, 169–174.
Normann, R. A., Greger, B., House, P., Romero, S. F., Pelayo, F., and Fernandez, E. (2009). Toward the development of a cortically based visual neuroprosthesis. J. Neural Eng. 6, 035001.
Panetsos, F., Nunez, A., and Avendano, C. (1995). Local anaesthesia induces immediate receptive field changes in nucleus gracilis and cortex. Neuroreport 7, 150–152.
Paxinos, G., and Watson, C. (1998). The Rat Brain in Stereotaxic Coordinates. San Diego, CA: Academic Press.
Peterman, M. C., Bloom, D. M., Lee, C., Bent, S. F., Marmor, M. F., Blumenkranz, M. S., and Fishman, H. A. (2003). Localized neurotransmitter release for use in a prototype retinal interface. Invest. Ophthalmol. Vis. Sci. 44, 3144–3149.
Pezaris, J. S., and Reid, R. C. (2007). Demonstration of artificial visual percepts generated through thalamic microstimulation. Proc. Natl. Acad. Sci. U.S.A. 104, 7670–7675.
Pfingst, B. E., Miller, J. M., Tjellstrom, A., Albrektsson, T., and Carlisle, L. (1989). Development of cochlear-wall implants for electrical stimulation of the auditory nerve. Acta Otolaryngol. 107, 210–218.
Ribak, C. E., and Peters, A. (1975). An autoradiographic study of the projections from the lateral geniculate body of the rat. Brain Res. 92, 341–368.
Saez, J. A., Paniagua, J., Dominguez, I., and Ferrer, J. M. (1998). Image processing in the primary visual cortex. Rev. Neurol. 26, 439–444.
Saito, T., Kondo, H., and Toyoda, J. (1978). Rod and cone signals in the on-center bipolar cell: their different ionic mechanisms. Vision Res. 18, 591–595.
Sanderson, K. J., Dreher, B., and Gayer, N. (1991). Prosencephalic connections of striate and extrastriate areas of rat visual cortex. Exp. Brain Res. 85, 324–334.
Schneider, K. A., Richter, M. C., and Kastner, S. (2004). Retinotopic organization and functional subdivisions of the human lateral geniculate nucleus: a high-resolution functional magnetic resonance imaging study 1. J. Neurosci. 24, 8975–8985.
Sillito, A. M., Cudeiro, J., and Jones, H. E. (2006). Always returning: feedback and sensory processing in visual cortex and thalamus. Trends Neurosci. 29, 307–316.
Tehovnik, E. J., Slocum, W. M., Smirnakis, S. M., and Tolias, A. S. (2009). Microstimulation of visual cortex to restore vision. Prog. Brain Res. 175, 347–375.
Thanos, S., Heiduschka, P., and Stupp, T. (2007). Implantable visual prostheses. Acta Neurochir. Suppl. 97, 465–472.
WHO. (2003). World Health Organization. Available at: http://www.who.int/mediacentre/factsheets/fs282/en/ and http://www.who.int/mediacentre/news/releases/2003/pr73/en/
Yamamoto, N., Kurotani, T., and Toyama, K. (1989). Neural connections between the lateral geniculate nucleus and visual cortex in vitro. Science 245, 192–194.
Keywords: LGN, V1, phosphene, visual percept, BMI, implant
Citation: Panetsos F, Sanchez-Jimenez A, Rodrigo-Diaz E, Diaz-Guemes I and Sanchez FM (2011) Consistent Phosphenes Generated by Electrical Microstimulation of the Visual Thalamus. An Experimental Approach for Thalamic Visual Neuroprostheses. Front. Neurosci. 5:84. doi: 10.3389/fnins.2011.00084
Received: 26 December 2010;
Accepted: 10 June 2011;
Published online: 05 July 2011.
Edited by:
Leonardo Cohen, National Institutes of Health, USAReviewed by:
Krishnankutty Sathian, Emory University, USAAndrea Kübler, University of Würzburg, Germany
Subramaniam Venkatraman, University of California Berkeley, USA
Copyright: © 2011 Panetsos, Sanchez-Jimenez, Rodrigo-Diaz, Diaz-Guemes and Sanchez. This is an open-access article subject to a non-exclusive license between the authors and Frontiers Media SA, which permits use, distribution and reproduction in other forums, provided the original authors and source are credited and other Frontiers conditions are complied with.
*Correspondence: Fivos Panetsos, Neurocomputing and Neurorobotics Research Group, Complutense University of Madrid, Avda Arcos de Jalon 118, 28037 Madrid, Spain. e-mail:Zml2b3MucGFuZXRzb3NAb3B0LnVjbS5lcw==