


- 1 The Fishberg Department of Neuroscience and Friedman Brain Institute, The Mount Sinai School of Medicine, New York, NY, USA
- 2 The Laboratory of Biophysics, The Rockefeller University, New York, NY, USA
- 3 Department of Neuroscience, Weill Medical College, New York, NY, USA
Recent technological advances have made the simultaneous recording of the activity of many neurons common. However, estimating the amount of information conveyed by the discharge of a neural population remains a significant challenge. Here we describe our recently published analysis method that assists in such estimates. We describe the key concepts and assumptions on which the method is based, illustrate its use with data from both simulated and real neurons recorded from the lateral geniculate nucleus of a monkey, and show how it can be used to calculate redundancy and synergy among neuronal groups.
1 Introduction
The brain processes information by the coordinated activity of many neurons, and it is therefore natural to ask: How much information does a given set of neurons transmit? In the past, several methods that estimated information rates from the firing pattern (Optican and Richmond, 1987; Richmond and Optican, 1987; Richmond et al., 1987; Bialek et al., 1991; Rieke et al., 1997; Strong et al., 1998; Brenner et al., 2000) or membrane potential (Borst and Theunissen, 1999; DiCaprio, 2004) of single neurons have been used. The information contained in spike trains was estimated by calculating the entropy associated with the various temporal patterns of spike discharge, using Shannon’s formula (Shannon, 1949; Shannon and Weaver, 1949; Victor, 2006). For a thorough review of existing approaches, see Quiroga and Panzeri (2009).
Such calculations become impractical when we are dealing with a substantial number of neurons, and since all brain functions involve many interacting neurons, it is important to provide similar information estimates for a neuronal population. Simply adding up the information delivered by individual neurons in the population is not a valid procedure because of these interactions (see, for example, Zohary et al., 1994; Bair et al., 2001; Latham and Nirenberg, 2005; Pillow et al., 2008). Methods adequate for single neuron data, such as the Reconstruction Method (Bialek et al., 1991) or the Direct Method (Strong et al., 1998), become impractical for a substantial population of neurons because of the “curse of dimensionality”: the huge multi-dimensional space inhabited by many diverse spike trains can only be sampled rather sparsely by most real-life neurophysiological experiments.
Calculating the information carried by a population of many neurons thus has remained a significant challenge (Brown et al., 2004; Quiroga and Panzeri, 2009), while the need for such estimates has become increasingly urgent: the technology of recording simultaneously from many neurons has become affordable and wide-spread, and data from such recordings are becoming common.
A quantitative measure of the information transmitted by a neural population should make it possible to investigate synergy (population codes; for example, Gat and Tishby, 1999; Brenner et al., 2000; Latham and Nirenberg, 2005) and redundancy (less than additive combination of information) among interacting neurons, and thus provide new insights into the computational principles employed by the brain. Here we describe a method that estimates the amount of information transmitted by a population of spiking neurons, and demonstrate its use with both simulated data and data recorded from the lateral geniculate nucleus (LGN) of an anesthetized macaque monkey. To make the method accessible to a broader audience of interested neuroscientists, we minimize here the explicit use of mathematics. Interested readers can find details in the appendix of our original paper (Yu et al., 2010), where the details of the experimental procedures used to obtain the laboratory recordings can also be found.
2 Estimation of the Rate at Which a Neural Ensemble Delivers Information
2.1 Information
In everyday usage, the word “information” refers to the amount of novelty transmitted in a message – data that enable us to choose among alternatives. In its quantitative, technical meaning, the information in a message refers to the reduction in uncertainty associated with a presupposed probability distribution of possible events. In this sense, information is a function of both the contents of the message and of an a priori assumption concerning the relative likelihood of possible events. Consider, for example, a message sent as ASCII characters, which is received as a string of 0’s and 1’s. This bitstream of 0’s and 1’s contains several levels of information that we might decompose. On a per-character basis, every group of eight bits corresponds to a single ASCII character. Given that each bit is either a 0 or a 1, we have 28, or 256, total possible characters for every eight bits. Each additional bit of information reduces the remaining uncertainty of the sequence by half. Conversely, we might say that each bit doubles the number of potential choices: the number of possible sequences is 2N, where N is the number of bits.
Does each bit carry the same amount of information? Usually not. For example, all 36 alphanumeric characters in English begin with one of only five unique 4-bit sequences: 0011, 0100, 0101, 0110, and 0111. Note that the first bit of every character is a 0. Since this 0 occurs with 100% probability, it carries zero information with respect to the alphabet. In a similar vein, the character e occurs almost 172 times as often as the letter z (Lewand, 2000), and so it is wasteful to use the same number of bits for both: an efficient encoding scheme would require fewer bits for common characters than for rare ones. To encode otherwise introduces redundancy into the system – informally defined as the number of “wasted” bits used in transmitting the message. Because an e will appear in English with higher probability than a z, our uncertainty is reduced to a lesser extent when it occurs. Our total uncertainty, therefore, is a function of the probability of occurrence of the characters. It is this uncertainty, dubbed entropy, that Claude Shannon quantified in his seminal paper A Mathematical Theory of Communication (1948).
In a similar manner, a neuron in the nervous system encodes information about a stimulus via a sequence of action potentials. How might we calculate the entropy from such a sequence? As just discussed, at the heart of Shannon’s entropy lies the probability distribution – a description of the likelihood of different messages. With this in mind, to calculate entropy we must do two things: (1) define what a neuronal “message” is, and (2) calculate the probability distribution of the various messages. Several methods have been proposed for accomplishing these tasks, yet dealing with more than a few neurons recorded simultaneously has remained beyond reach.
2.2 Features of the Formulation
The methodology of information theory may be addressed not only to the example of messages in ASCII code, but also to situations that are more general in several different respects (Cover and Thomas, 2006). In a rather remarkable way, a useful theory emerges which has several unexpected features.
Suppose we had a very large collection of signals of a specified duration, each occurring numerous times. From that ensemble we could derive a list of the probability of occurrence of each distinct signal. The first step of information theory is to observe that any such list of probabilities gives rise to an essentially unique number – its entropy – which states, in bits, the potential capability of an average member of that ensemble to convey a message. Entropy is the central concept and central building-block of information theory and is constructed from the list of probabilities by the formula
where pr indicates the probability of a specific signal r.
Equation 1 has the following property: if we regard two separate signals as two consecutive “chapters” of a longer signal, then the entropy of a set of these longer signals is the sum of the entropies calculated for its two consecutive chapters. The distribution p of all n signals is maximized when p is the uniform distribution (that is, all signals are equally likely, with probability 1/n). When this occurs, the formula reduces to log2 n.
Equation 1 is the only way to satisfy two requirements: (1) in the case of equal probabilities, as above it reduces to a simple logarithm, and (2) as in the “chapter” example above, the sum of the entropies of two signals is equal to the entropy of the signals taken together.
2.2.1 Noise and signal entropies
Experimental data typically contain noise: the accuracy and precision of any measurement are limited by noise in both the production of the stimulus signal, the transduction of the signal through the inherently noisy nervous system, and the recording of the output signal through the measurement devices. In the complete absence of noise, any differential response of the nervous system would indicate its ability to discriminate different stimuli. With noise, however, our system’s ability to discriminate between stimuli is greatly reduced: the signal is muddied, and the reduction in uncertainty accompanying any measured output signal – the information in the signal – is itself diminished. Variations in the measured output signal still exist, but we can no longer reliably ascribe such variations to changes in the input. Some of the variability in the signal, therefore, contains not signal entropy (which would allow us to discriminate stimuli), but noise entropy – entropy that is due entirely to noise.
To properly calculate the actual signal information of the system, we must remove from the entropy calculation the contribution of noise. By analogy with the calculation of the total entropy (denoted by HT), the noise entropy (HN) is calculated from observing the variability of responses to repeated presentations of a (typical) stimulus, with a formula similar to equation 1; The distribution of these responses provides the probabilities that the entropy formula requires. The (noiseless) information available in our signal (often called Mutual Information) is thus

This equation describes the process of measuring and removing the amount of variability in the signal that is due to noise. Details of the derivation of this equation can be found in Rieke et al. (1997, see Section 3.1.3) and in Cover and Thomas(2006, chap. 7). We note that the need to estimate the noise entropy together with the total entropy over a long experiment requires the use of repeated presentations of a chosen stimulus (referred to as repeats), which are interleaved with presentations of non-repeating stimuli (referred to as uniques).
2.2.2 Continuous signals
So far we have dealt with signals composed of sequential, well-defined markers. Information theory generalizes to signals that are continuous in time and to parallel multiples of such signals.
A natural way to approach such an extension is to study a sequence of approximations, in each of which a continuous signal in time is discretized into progressively shorter time-steps. At each successive level of approximation, the situation may be represented (as discussed above) as a sequence of discrete symbols. In doing so, however, difficulties arise, some with a surprising resolution.
2.2.2.1 The timestep problem. The probability of a continuous variable is characterized by its probability density function. When this density function is divided into very small intervals, the probability associated with each interval approaches zero; as these divisions are further refined, the total entropy and noise entropy diverge to infinity. However, these two entropies diverge together, and the offending divergence is thus canceled by taking the difference of the two entropies, and the resulting signal information (equation 2) approaches a well-defined limiting value. In this sense, the signal information is more fundamental than is either of the two entropies from which it is calculated.
2.2.2.2 The finite-sampling problem. There is a second problem that arises from dividing time into brief intervals. As we saw in the early discussion, the number of alternative code-word possibilities increases exponentially with the number of intervals. Straightforward evaluation of their probabilities for use in equation 1 demands many repeated presentations of each stimulus, and eventually becomes experimentally unfeasible. In consequence, the deep theoretical structure of this problem has received a great deal of attention, and insightful methods have been advanced for extrapolation from more modest and feasible data sets (for example, Panzeri et al., 2007). When one considers a response composed of several parallel signals, the difficulty is severely compounded, since the number of possible messages increases greatly. These extrapolation procedures (which continue to be refined) have so far successfully addressed the challenge of eight simultaneously recorded neurons.
In the following section, we advance an alternative approach that avoids the difficult step of dividing continuous time into brief discrete segments. If the specific probability density function is known analytically, one may proceed as above to evaluate its entropy directly, following equation 1. For example, the entropy of a Gaussian with variance σ2 is
Our method exploits the a priori knowledge of the statistical distribution of the data to overcome the finite-sampling problem, and thus has allowed us to compute the entropy of 1024 parallel simulated signals on a desktop computer in a matter of minutes.
Shannon has observed (Shannon, 1948; Shannon and Weaver, 1949, chap. 3) that, in the continuous-time limit, the underlying random variables of the signal information may be expressed in numerous ways. In fact, any smooth transformation of variables leads to a new expression for signal information. Shannon then made the remarkable observation (Shannon and Weaver, 1949, chap. 4) that such transformations leave the bit-value of the signal information (but not the values of its two component entropies) unchanged. Following Shannon, the electronic communication community has used this observation to express the bit-rate of a time-varying continuous signal in terms of required frequency bandwidth. We observe here that similar treatment is applicable to spike trains.
2.2.3 Frequency representation (Fourier Analysis) and spike trains
Under diverse circumstances, a signal defined at every moment of time and over a fixed span of time can be approximated indefinitely well by a constant plus a sum of weighted sines and cosines that oscillate with frequencies that are integer multiples of a single fundamental frequency. Such a representation as a weighted sum of sines and cosines is technically a Fourier series representation, and its list of weighting coefficients (technically Fourier coefficients) fully characterizes the signal (Bendat and Piersol, 2010).
The weighting coefficients of each sinusoid may be calculated for a large ensemble of signals, and may thus be characterized by a probability distribution. From this distribution one can calculate, using equation 1, the associated entropy. A signal representing a spike train may be expressed as a series of delta functions (smooth “spikes” of infinitesimal width, infinite height, and area 1), with each spike representing an action potential fired by the neuron at that moment in time. The Fourier coefficients of this resulting smooth function of time may be directly evaluated (Figure 1, top). This procedure may be applied to the laboratory data of the experiment discussed above, where spike trains driven by unique and repeat stimuli were interleaved. From the responses to each of the two kinds of stimuli we can estimate a multivariate probability distribution for the Fourier coefficients and, by Shannon’s observation above, evaluate the signal information. Several further features simplify this approach.
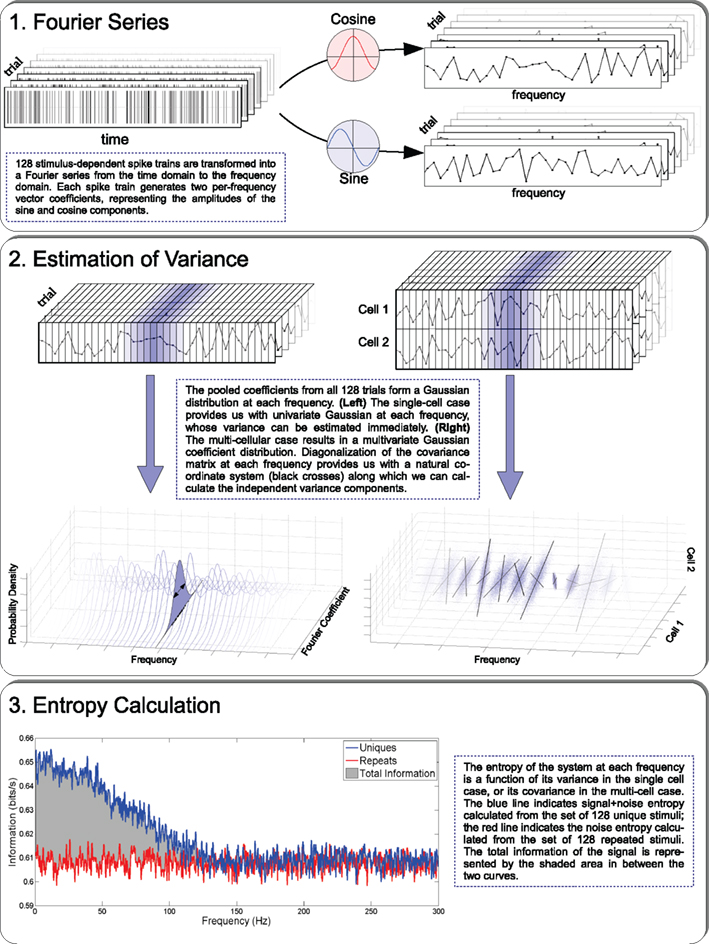
Figure 1. The three steps that are required for calculating the information carried by a neural population: Fourier representation of each spike train; variance estimation, and entropy-information calculation.
2.2.4 Features of the frequency representation
Our signal technically constitutes a time-stationary random process with finite memory, and from this it can be shown that Fourier components at different frequencies are uncorrelated. Thus, the multi-frequency probability distribution can be parceled into independent distributions at the separate frequencies.
We discussed above an ambiguous width in the representation of spikes as tall, narrow pedestals with unit area. In fact, one might have represented the spikes with tall, narrow positive functions of any shape. On closer inspection the Fourier coefficients separate into two natural frequency sets. At low frequencies, the coefficients essentially depend only on the pattern of the spikes and not on their shapes. Once the period of the sine wave becomes briefer than most spike separation times, the Fourier coefficients become dependent only on the spike shape, and not on their firing pattern. In this regime the probability distribution is the same for the repeat stimuli and for the non-repeat set. Fourier coefficients at these higher frequencies do not contribute to the signal information. The remaining influences of spike shape may be removed by taking the narrow unit-area spikes toward the limit of zero width, which assigns well-defined limiting values to the Fourier coefficients, and leaves the features above intact.
This approach greatly simplifies the calculation of Fourier coefficients from laboratory data: each Fourier coefficient is simply the sum, over all spike times, of the values of the relevant sinusoid at those times.
A further great simplification takes place: that sum of values may be broken up across time as a sum of sub-sums that are, in the ensemble, statistically independent of one another, because the signal has finite memory. Here the central limit theorem applies, and we conclude that the coefficient’s distribution is Gaussian, which we have verified for both simulated and laboratory data (See Yu et al., 2010, Figure 5). The entropy of a Gaussian depends only upon its variance (equation 3), and a modest sample from a distribution known to be Gaussian is sufficient to reasonably determine its variance (Figure 1, middle left). Since any empirical sample is finite, the variance estimation is still slightly biased, but the bias is small compared to the bias encountered in more direct approaches that attempt to fully characterize a distribution of unknown form from a limited sample. Thus we may evaluate the signal information by summing the Gaussian entropies of equation 3 over the range of frequencies for which the entropies for responses to the two different types of stimuli (unique and repeated) are unequal.
2.3 Information in Multiple-Neuron Spike Trains
In the previous section we described how the entropy of a single neuron may be calculated from the variances of its Fourier coefficients over a range of frequencies. In the more general situation, in which several neurons are recorded simultaneously, a common input may lead to features in common in those neurons’ outputs. This would imply that the response of a given neuron was, in part, predictable from the responses of others, and consequently the amount of information delivered by the group would be less than the sum of what was calculated for the individual neurons. The way this situation can be addressed quantitatively may be illustrated by the case of two neurons, as presented in Figure 2.
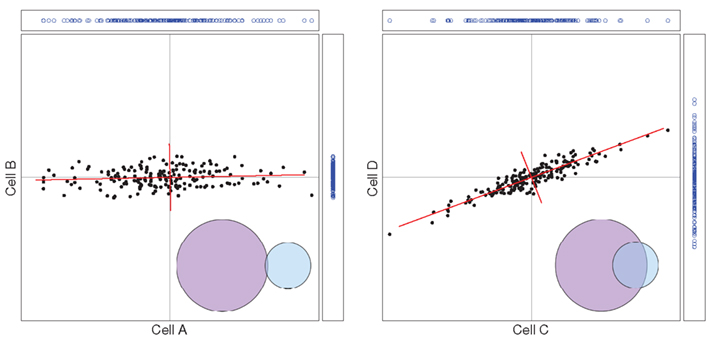
Figure 2. Left: the two cells (A and B) fire independently; a two-dimensional distribution is the product of two one-dimensional distributions. Right: the two cells (C and D) are correlated in this bi-variate Gaussian distribution; when new coordinates (red axes) are chosen, the distribution becomes a product of two one-dimensional Gaussian distributions.
We choose a Fourier coefficient at one particular frequency, and for each of a sequence of trials we plot its value for cell A horizontally and its value for cell B vertically. In the left frame we consider the case where the cells are firing independently. The points are thus drawn from a two-dimensional distribution that is the product of the horizontal distribution and the vertical distribution that are both Gaussian. The two-dimensional distribution is thus the product of two univariate Gaussians. We have chosen for the vertical cell B a Gaussian with a smaller variance than that of cell A. The entropy of the distribution is the sum of the two entropies, each obtained from its variance as in equation 3.
The right frame of Figure 2 shows what happens when the firings of the two cells are correlated, as in response to some common input. It is evident in the figure that a positive Fourier coefficient for one cell predisposes the Fourier coefficient of the other cell to be positive, and similarly for negatives.
But here, again, there is a simple calculation for the distribution’s entropy. The single-cell argument above, that the central limit theorem applied and that therefore the distribution must be Gaussian, generalizes to the present case. By the same argument the multivariate distribution of the Fourier coefficients across cells is governed by the multivariate central limit theorem, and so must be a multivariate Gaussian distribution. A multivariate Gaussian distribution has the special property that by rotation one can always find a new set of coordinates, in which the distribution becomes the product of univariate Gaussians, and one can then proceed as before. Technically, a multivariate Gaussian is characterized by a covariance matrix whose principal component vectors define the special choice of the new coordinates. For the case of two cells this is shown by the red axes in the right frame of Figure 2. Performing this at many frequencies (Figure 1, middle right) on both Repeat and Unique trial sets allows the direct calculation of the signal entropy (Figure 1, bottom).
2.4 Estimating Redundancy and Synergy
We have seen above how the simple summation of information from individual cells can easily overestimate the actual amount of information conveyed by the group. This overestimation arises from the fact that the information content of the cells’ outputs overlaps, and is thus redundant. In some systems, the converse may be true: the communal output of cells might exceed the sum total information of the individuals, and we have synergy. The circumstances in a complex system from which redundancy or synergy may arise have been the subject of much interest and theoretical discussion (Gawne and Richmond, 1993; Gat and Tishby, 1999; Panzeri et al., 1999; Brenner et al., 2000; Panzeri and Schultz, 2001; Petersen et al., 2001; Bezzi et al., 2002; Pola et al., 2003; Schneidman et al., 2003; Latham and Nirenberg, 2005; Montani et al., 2007).To quantify redundancy (we refer here to redundancy, but the discussion applies to synergy as well), we must quantify the amount of entropy overlap in a group and compare this amount to the total information being transmitted. Using our 2-cell example, we represent each neuron’s information output by the two circles in the bottom right of each panel (Figure 2). In this way we can visualize the amount of information redundantly conveyed by both neurons: it is the overlapping area. Quantifying these two values with the Fourier method is straightforward – the overlap is equal to the difference between the sum total and the group entropy. Calculation of redundancy with any number of cells proceeds exactly in the same manner. When each cell conveys unique information there is no overlap between the information from the various cells, and redundancy is zero.
In the case of synergy, the information conveyed by the group is greater than the sum total of information; cells work synergistically to convey more information than the algebraic sum of the contributions of each one alone. Here the notion of overlap does not apply. However, one may regard the extra information as “negative overlap,” still defined by the difference between sum total entropy and group entropy, and proceed in the same manner as above.
2.4.1 Examples
2.4.1.1 Information from individual neurons. Figure 3 shows, in its left frame, simulated results from eight model neurons. These were of the currently much-used Poisson type: each produced an inhomogeneous Poisson point process at a time-dependent rate that was directly proportional to the fluctuating luminance levels used as a visual stimulus in the laboratory; as a result, the model Poisson neurons and the real laboratory neurons were driven by experiments with equal number of trials and, therefore, the number of samples from the two sets was identical. The mean rates of these 8 neurons were set at the mean rates of 8 the actual neurons we recorded in our monkey LGN. The lower lines show the cumulative information, with advancing frequency, of those individual simulated neurons. The upper line in red shows the sum of those eight cumulative information plots. The dashed blue line below it shows the cumulative information calculated for the merged group of 8. The difference between the two curves is a measure of the redundancy of the information that those neurons carry individually.
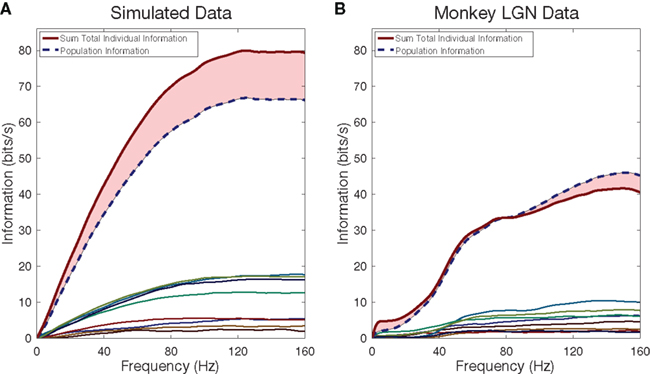
Figure 3. Cumulative information rates as a function of frequency for single cells and for a neural population. Colored lines near the bottom indicate the cumulative information for each of the eight simulated cells (A) and eight LGN cells (B). In simulated cells, the sum total information of all individual cells exceeds the information conveyed by the group together, indicating redundancy. In the monkey LGN cells, the sum total exceeds the group information until approximately half the stimulus frequency, after which synergy dominates.
The right frame of Figure 3 shows the corresponding calculation for real neurons recorded in our laboratory from the monkey LGN. We see several new features. The individual neurons, not surprisingly, show a low-frequency cutoff, and as expected, the details of that cutoff are somewhat different for different neurons. When we compare the cumulative information of the merged group to the summed information of the individuals, we see that redundancy at lower frequencies crosses over to synergy at higher frequencies. This recurring observation, which is absent in the simulated neurons, merits further study.
2.4.1.2 Merging information from smaller groups of neurons. In Figure 4 we examine the effect of merging groups of neurons into a single, larger group. For both the simulated neurons and the LGN neurons we divided the neurons into two groups: we ranked the neurons in order of increasing mean firing rate, and placed the even and odd numbered neurons in separate groups. From Figure 3 for simulated neurons we recall that this merger removed redundant information, so the information of the two groups should already be reduced from the total single neuron information, which is confirmed in the left frame. Similarly for the laboratory data (right frame) the gap is reduced from what the previous figure showed. Again, for the two groups of LGN cells we see that as frequency increases there is a transition from redundancy to synergy.
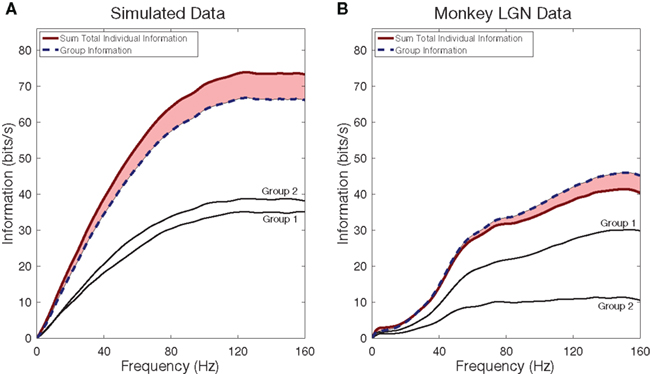
Figure 4. Redundancy and Synergy among groups of neurons in a population. Information rates from simulated Poisson spike trains (A), created to match the firing rates of monkey LGN neurons (B). In both panels the eight cells were split into two groups, matched approximately for firing rates. The total group information is shown in a dashed blue line, and the summed information from two groups is shown in a solid red line. For the LGN cells, but not for the simulated cells, the curves cross around 30 Hz: below 30 Hz we see redundancy, while above it we see synergy.
3 Discussion
We have described a new method (Yu et al., 2010) for the estimation of the amount of information delivered by the discharges of a neuronal population. The method fills a gap in the armamentarium of the neuroscientist who is interested in the information processing aspects of the brain, and is timely in view of the abundance of multi-neuron recordings appearing in the literature. We now mention a few caveats, and comment on other recent approaches.
3.1 Caveats and Challenges
3.1.1 Differences between responses to unique and repeat stimuli
The methodology presented here confronts the “curse of dimensionality” head-on. In our application, every 8-s spike train is represented as a point in a space of 2 × 8 × 160 = 2,560 dimensions: sine and cosine Fourier coefficients at evenly spaced frequencies from 1/8 to 160 Hz. The challenge becomes tractable when we note that the central limit theorem tells us a great deal about how these points must be distributed in that large space, and, in particular, that correlations across dimensions are confined to two-dimensional sub-spaces defined by a sine–cosine pair at each frequency. The needed computations may be performed one pair at a time, and the central limit theorem further tells us that the final result may be derived from a simple analytic expression.
However, the laboratory data consist of only finite samples, while the theory addresses an ensemble of indefinite size. For example, the third panel in Figure 1 illustrates how an atypical sample may lead to a challenge in data analysis. In that figure we see that total entropy and noise entropy converge at high frequencies, which furnishes a cutoff for the sum in equation 26 of Yu et al. (2010). This convergence is predicted by the theory. But in the laboratory, the noise entropy is estimated from responses to repetitions of one sampled “repeat” stimulus, and if that sample is atypical, the computed noise entropy may converge to a slightly different value than the corresponding total entropy. Knowing the origin of the problem, one can apply a small common sense adjustment to remove it. But currently there is no overall theory to point the way that such small-sample adjustments should be made. We look forward to future developments that would help bring this approach to a more mature usefulness.
3.1.2 Do we need repeated stimuli?
Our method requires repeated presentations of a stimulus in order to calculate the noise entropy. This requirement is shared by other methods, such as the Direct Method of Strong et al. (1998). It would be beneficial to have a method that did not require repeated presentations of a stimulus, and which offered some other way of estimating the noise entropy. This might require different approaches to the estimation of complexity, entropy, and information. Steps in that directions have begun to appear in the past few years with the emergence of methods that sidestep the requirement for repeated stimuli. For example, entropy can be estimated with the Lempel and Ziv (1976) complexity measure, as was done recently by Szczepanski et al. (2003), Amigó et al. (2004), and Szczepanski et al. (2011). The complexity and entropy of spike trains can also be estimated by deducing the (hidden) computational structure of a system that could generate the observed spike train (Shalizi et al., 2002; Haslinger et al., 2010).
3.1.3 Non-sensory systems
Most of the information-theory applications to neuroscience have been to data from sensory neurons, where a well-defined stimulus is used, often repeatedly. However, studies of other parts of the brain, such as the hippocampus, the pre-frontal cortex, or the nucleus accumbens, which often involve recordings without any specific experimenter-controlled stimulus, could also benefit from estimates of how much information is carried by the recorded neurons. The methods used by (Amigó et al., 2004) are a step in this direction, but additional methods to provide such estimates would be highly desirable.
3.1.4 Robustness against errors in spike sorting
In our experience, the method is reasonably robust against errors in spike sorting, such as missed spikes, mis-assigned spikes, etc. However, its robustness has limits: if many spikes are erroneously assigned to more than one neuron, this is bound to affect the redundancy/synergy calculation.
3.1.5 Computational efficiency
The information calculations illustrated here may be performed on a desktop computer in a few seconds. Computing time scales roughly with the number of spikes fired by the neuronal population, and our approach can easily handle hundreds of neurons.
3.1.6 Available software
The software used in the analysis discussed in this review is freely available at http://camelot.mssm.edu/~kaplane/Fourier_information.zip
3.2 Other approaches
To calculate Shannon information, one needs to know the distribution of the underlying variables. This can be rather challenging with experimental data, which are finite and usually provide only biased estimates of the underlying distribution (Panzeri et al., 2007). On the other hand, if one has a credible model of the process that is being investigated, the model’s parameters can be optimized to bring the model’s output close to the experimental data. The model now can provide robust and accurate estimates of the distribution, and that distribution can be sampled to yield entropy estimates, using equation 1.
Model-based approaches to spike encoding seek to define an optimal set of parameters for a given model from which the observed spike trains are most likely to have been generated. Such models are useful in that providing a stimulus-response paradigm allows for testable criteria concerning the nature of the encoding process, including statistical measures of accuracy and confidence, and also lends itself well to the application of Shannon Information. Paninski et al. (2007) suggested three criteria for the development of such models: the model must be powerful enough to properly describe the data, it must be both computationally tractable and simple enough to understand, and finally it must fit well with current physiological and anatomical knowledge of the system being studied. The maximum entropy principle, put forth by Jaynes (1957), states that given a set of constraints, the current state of knowledge is best described by the probability distribution with the greatest entropy.
The application of the maximum entropy principle to model-based approaches representing neural systems has garnered much attention among neuroscientists seeking to describe spike encoding. Some recent models (Schneidman et al., 2006; Shlens et al., 2006; Nirenberg and Victor, 2007) have explored the ability to account for the firing patterns of groups of neurons using only parameters that describe single neurons and the interactions between pairs of neurons, since the nature and consequences of the interactions among neurons in the population are at the heart of the issue of population codes and synergy. Whether applications of this type of model will be valid for much larger populations of cells, as found in the nervous system, remains a subject of future exploration (Roudi et al., 2009). These decoding methods utilize the principle of maximum entropy in determining maximum parameter likelihoods. Likelihood-based models, such as the Generalized Linear Model, are tractable due to the concavity of their log-likelihood functions; absence of local maxima in the likelihood function allows for standard numerical ascent techniques in determining optimal parameter choices (Paninski et al., 2007).
The current literature on alternative methods for estimating information is large and growing. These methods, more fully described in Victor (2006) and Dimitrov et al. (2011), directly cast spike-train data, from one or several neurons, into a form that fits into equation 1. Such methods operate either directly on the spike trains, represented as point processes, or on continuous functions of time derived from such processes. For example, a time-span of neuronal output may be divided into a sequence of intervals in such a manner that neuronal output statistics may be gathered and processed so as to produce a measure of entropy, as in the Direct Method of Strong et al. (1998). As mentioned above, the major challenge to these approaches is the problem of small-sample bias. This contrasts with our Fourier method, which is based on estimating the variance of Gaussians, which is a relatively unbiased statistic (see Figure 5 of Yu et al., 2010). A recent additional method (Pola et al., 2005; Montemurro et al., 2007; Panzeri et al., 2007; Magri et al., 2009; Ince et al., 2010) cleverly approximates the problem in such a manner as to allow the information calculation to be split, not into the Total and Noise entropies, but rather into pieces that involve both the exact and the approximate problems, giving rise to further cancelation of the small-sample bias. However, with such bias corrections it was only possible to estimate signal information from laboratory data of correlated spikes recorded from only a handful of neurons.
Conflict of Interest Statement
The authors declare that the research was conducted in the absence of any commercial or financial relationships that could be construed as a potential conflict of interest.
Acknowledgments
This research was supported by NIH grants EY016371, EY12867, GM71558, and core grant EY01867. We thank Youping Xiao for his help with this project.
Key Concepts
In information theory, entropy is a measure of the uncertainty associated with a random variable. It quantifies the disorder, or unpredictability, of a collection of signals. Entropy is the expected value of the information contained in a message, and is measured in bits. The concept was introduced in this context by C. Shannon’s 1948 paper “A Mathematical Theory of Communication.”
If all the neurons in a population were independent, their group information would equal the sum over the information each of them carries. If their group information is less than that sum, we have redundancy: some of the information delivered by some neurons is also delivered by others. If their group information has more than that sum, we have synergy, providing information that depends on the coordinated firing of some neurons, and cannot be extracted by examining individual neurons.
Mutual information between stimulus and response quantifies (in bits) the reduction in stimulus uncertainty gained from analyzing the response. It is calculated by subtracting from the total entropy the noise entropy, which is estimated from the variability of responses to repeated presentations of a stimulus.
We are interested here in a neuron’s rate of transmitting information, rather than in the development of the neuronal signal over time. Since Fourier analysis decomposes a set of neuronal outputs into a sum of sine and cosine coefficients at various frequencies, it provides insight into the underlying processes that gave rise to the signal.
References
Amigó, J. M., Szczepanski, J., Wajnryb, E., and Sanchez-Vives, M. V. (2004). Estimating the entropy rate of spike trains via lempel-ziv complexity. Neural Comput. 16, 717–736.
Bair, W., Zohary, E., and Newsome, W. T. (2001). Correlated firing in macaque visual area MT: time scales and relationship to behavior. J. Neurosci. 21, 1676–1697.
Bendat, J. S., and Piersol, A. G. (2010). Random Data: Analysis and Measurement Procedures. Hoboken, NJ: John Wiley and Sons, Inc.
Bezzi, M., Diamond, M. E., and Treves, A. (2002). Redundancy and synergy arising from pairwise correlations in neuronal ensembles. J. Comput. Neurosci. 12, 165–174.
Bialek, W., Rieke, F., de Ruyter van Steveninck, R. R., and Warland, D. (1991). Reading a neural code. Science 252, 1854–1857.
Borst, A., and Theunissen, F. (1999). Information theory and neural coding. Nat. Neurosci. 2, 947–957.
Brenner, N., Strong, S. P., Koberle, R., Bialek, W., and de Ruyter van Steveninck, R. R. (2000). Synergy in a neural code. Neural Comput. 12, 1531–1552.
Brown, E. N., Kass, R. E., and Mitra, P. P. (2004). Multiple neural spike train data analysis: state-of-the-art and future challenges. Nat. Neurosci. 7, 456–461.
Cover, T., and Thomas, J. (2006). Elements of Information Theory, 2nd Edn. Hoboken, NJ: Wiley Interscience.
DiCaprio, R. A. (2004). Information transfer rate of nonspiking afferent neurons in the crab. J. Neurophysiol. 92, 302–310.
Dimitrov, A. G., Lazar, A. A., and Victor, J. D. (2011). Information theory in neuroscience. J. Comput. Neurosci. 30, 1–5.
Gat, I., and Tishby, N. (1999). “Synergy and redundancy among brain cells of behaving monkeys,” in Advances in Neural Processing Systems, Vol. 11, eds M. Kearns, S. Solla, and D. Cohn (Cambridge, MA: MIT press), 465–471.
Gawne, T. J., and Richmond, B. J. (1993). How independent are the messages carried by adjacent inferior temporal cortical neurons? J. Neurosci. 13, 2758–2771.
Haslinger, R., Klinkner, K. L., and Shalizi, C. R. (2010). The computational structure of spike trains. Neural Comput. 22, 121–157.
Ince, R. A. A., Senatore, R., Arabzadeh, E., Montani, F., Diamond, M. E., and Panzeri, S. (2010). Information-theoretic methods for studying population codes. Neural Netw. 23, 713–727.
Latham, P. E., and Nirenberg, S. (2005). Synergy, redundancy, and independence in population codes, revisited. J. Neurosci. 25, 5195–5206.
Lempel, A., and Ziv, J. (1976). On the complexity of finite sequences. IEEE Trans. Inf. Theory 22, 75–88.
Lewand, R. (2000). Cryptological Mathematics, Washington, DC: The Mathematical Association of America.
Magri, C., Whittingstall, K., Singh, V., Logothetis, N. K., and Panzeri, S. (2009). A toolbox for the fast information analysis of multiple-site lfp, eeg and spike train recordings. BMC Neurosci. 10, 81. doi: 10.1186/1471-2202-10-81
Montani, F., Kohn, A., Smith, M. A., and Schultz, S. R. (2007). The role of correlations in direction and contrast coding in the primary visual cortex. J. Neurosci. 27, 2338–2348.
Montemurro, M. A., Senatore, R., and Panzeri, S. (2007). Tight data-robust bounds to mutual information combining shuffling and model selection techniques. Neural Comput. 19, 2913–2957.
Nirenberg, S. H., and Victor, J. D. (2007). Analyzing the activity of large populations of neurons: how tractable is the problem? Curr. Opin. Neurobiol. 17, 397–400.
Optican, L. M., and Richmond, B. J. (1987). Temporal encoding of two-dimensional patterns by single units in primate inferior temporal cortex. III. information theoretic analysis. J. Neurophysiol. 57, 162–178.
Paninski, L., Pillow, J., and Lewi, J. (2007). Statistical models for neural encoding, decoding, and optimal stimulus design. Prog. Brain Res. 165, 493–507.
Panzeri, S., and Schultz, S. R. (2001). A unified approach to the study of temporal, correlational, and rate coding. Neural Comput. 13, 1311–1349.
Panzeri, S., Schultz, S. R., Treves, A., and Rolls, E. T. (1999). Correlations and the encoding of information in the nervous system. Proc. Biol. Sci. 266, 1001–1012.
Panzeri, S., Senatore, R., Montemurro, M. A., and Petersen, R. S. (2007). Correcting for the sampling bias problem in spike train information measures. J. Neurophysiol. 98, 1064–1072.
Petersen, R. S., Panzeri, S., and Diamond, M. E. (2001). Population coding of stimulus location in rat somatosensory cortex. Neuron 32, 503–514.
Pillow, J. W., Shlens, J., Paninski, L., Sher, A., Litke, A. M., Chichilnisky, E. J., and Simoncelli, E. P. (2008). Spatio-temporal correlations and visual signalling in a complete neuronal population. Nature 454, 995–999.
Pola, G., Petersen, R. S., Thiele, A., Young, M. P., and Panzeri, S. (2005). Data-robust tight lower bounds to the information carried by spike times of a neuronal population. Neural Comput. 17, 1962–2005.
Pola, G., Thiele, A., Hoffmann, K. P., and Panzeri, S. (2003). An exact method to quantify the information transmitted by different mechanisms of correlational coding. Network 14, 35–60.
Quiroga, R. Q., and Panzeri, S. (2009). Extracting information from neuronal populations: information theory and decoding approaches. Nat. Rev. Neurosci. 10, 173–185.
Richmond, B. J., and Optican, L. M. (1987). Temporal encoding of two-dimensional patterns by single units in primate inferior temporal cortex. II. quantification of response waveform. J. Neurophysiol. 57, 147–161.
Richmond, B. J., Optican, L. M., Podell, M., and Spitzer, H. (1987). Temporal encoding of two-dimensional patterns by single units in primate inferior temporal cortex. I. response characteristics. J. Neurophysiol. 57, 132–146.
Rieke, F., Warland, D., Steveninck, R. d., and Bialek, W. (1997). Spikes: Exploring the Neural Code. Cambridge, MA: MIT Press.
Roudi, Y., Nirenberg, S., and Latham, P. E. (2009). Pairwise maximum entropy models for studying large biological systems: when they can work and when they can’t. PLoS Comput. Biol. 5, e1000380. doi: 10.1371/journal.pcbi.1000380
Schneidman, E., Berry, M. J., Segev, R., and Bialek, W. (2006). Weak pairwise correlations imply strongly correlated network states in a neural population. Nature 440, 1007–1012.
Schneidman, E., Bialek, W., and Berry, M. J. (2003). Synergy, redundancy, and independence in population codes. J. Neurosci. 23, 11539–11553.
Shalizi, C. R., Shalizi, K. L., and Crutchfield, J. P. (2002). An Algorithm for Pattern Discovery in Time Series. Technical Report, Santa Fe Institute, 1–26. Available at http://arxiv.org/abs/cs.LG/0210025
Shannon, C. (1948). A mathematical theory of communication. Bell Syst. Technical J. 27, 379–423, 623–656.
Shannon, C., and Weaver, W. (1949). The Mathematical Theory of Communication. Chicago, IL: University of Illinois Press.
Shlens, J., Field, G. D., Gauthier, J. L., Grivich, M. I., Petrusca, D., Sher, A., Litke, A. M., and Chichilnisky, E. J. (2006). The structure of multi-neuron firing patterns in primate retina. J. Neurosci. 26, 8254–8266.
Strong, S. P., Koberle, R., de Ruyter van Steveninck, R. R., and Bialek, W. (1998). Entropy and information in neural spike trains. Phys. Rev. Lett. 80, 197–200.
Szczepanski, J., Amigó, J. M., Wajnryb, E., and Sanchez-Vives, M. V. (2003). Application of lempel-ziv complexity to the analysis of neural discharges. Network 14, 335–350.
Szczepanski, J., Arnold, M., Wajnryb, E., Amigó, J. M., and Sanchez-Vives, M. V. (2011). Mutual information and redundancy in spontaneous communication between cortical neurons. Biol. Cybern. 104, 161–174.
Victor, J. D. (2006). Approaches to information-theoretic analysis of neural activity. Biol. Theory 1, 302–316.
Yu, Y., Crumiller, M., Knight, B., and Kaplan, E. (2010). Estimating the amount of information carried by a neuronal population. Front. Comput. Neurosci. 4:10. doi: 10.3389/fncom.2010.00010
Keywords: information, neural population, redundancy, frequency analysis
Citation: Crumiller M, Knight B, Yu Y and Kaplan E (2011) Estimating the amount of information conveyed by a population of neurons. Front. Neurosci. 5:90. doi: 10.3389/fnins.2011.00090
Received: 17 January 2011;
Accepted: 28 June 2011;
Published online: 15 July 2011.
Edited by:
Jakob H. Macke, University College London, UKReviewed by:
Stefano Panzeri, Italian Institute of Technology, ItalyJakob H. Macke, University College London, UK
Copyright: © 2011 Crumiller, Knight, Yu and Kaplan. This is an open-access article subject to a non-exclusive license between the authors and Frontiers Media SA, which permits use, distribution and reproduction in other forums, provided the original authors and source are credited and other Frontiers conditions are complied with.
*Correspondence: Ehud Kaplan, The Mount Sinai School of Medicine, The Friedman Brain Institute, One Gustave Levy Place, New York, 10029, NY, USA,ZWh1ZC5rYXBsYW5AbXNzbS5lZHU=