

- 1 Motivation and Cognition Interface Lab, Department of Psychology/Cognitive, Texas A&M University, College Station, TX, USA
- 2 The University of Texas at Austin, Austin, TX, USA
We incorporated behavioral and computational modeling techniques to examine age-based differences in strategy use in two four-choice decision-making tasks. Healthy older (aged 60–82 years) and younger adults (aged 18–23 years) performed one of two decision-making tasks that differed in the degree to which rewards for each option depended on the choices made on previous trials. In the choice-independent task rewards for each choice were not affected by the sequence of previous choices that had been made. In contrast, in the choice-dependent task rewards for each option were based on how often each option had been chosen in the past. We compared the fits of a model that assumes the use of a win-stay–lose-shift (WSLS) heuristic to make decisions, to the fits of a reinforcement-learning (RL) model that compared expected reward values for each option to make decisions. Younger adults were best fit by the RL model, while older adults showed significantly more evidence of being best fit by the WSLS heuristic model. This led older adults to perform worse than younger adults in the choice-independent task, but better in the choice-dependent task. These results coincide with previous work in our labs that also found better performance for older adults in choice-dependent tasks (Worthy et al., 2011), and the present results suggest that qualitative age-based differences in the strategies used in choice tasks may underlie older adults’ advantage in choice-dependent tasks. We discuss possible factors behind these differences such as neurobiological changes associated with aging, and increased use of heuristics by older adults.
Introduction
The US population is aging at a very high rate. By 2050 developed nations are projected to have substantially higher populations of older adults (26% of the population) than children under age 15 (16%; Cohen, 2003). It is thus very important to develop a deep understanding of how aging affects cognition and behavior. One task that both younger and older adults must undertake on a daily basis is decision-making. Older adults often continue to work in important jobs, and even those who retire must make important choices that will affect their well-being and the well-being of their posterity. There has recently been a surge in excellent research aimed at understanding decision-making across the lifespan (Kovalchik et al., 2004; Wood et al., 2005; Mata et al., 2007; Peters et al., 2007; Samanez-Larkin et al., 2007, 2011; Schott et al., 2007; Brown and Ridderinkhof, 2009).
One important aspect of decision-making is that decisions can rarely be considered as isolated events. Rather, our decisions often affect what possibilities are available in the future. For example, the choices of whether to attend college, what college to attend, and what to major in will affect what job prospects are available to choose from in the future. Likewise, the choices regarding how to invest and save for retirement will eventually affect the class of retirement homes that are available to choose from. It is thus important to examine how people make decisions based not only on their immediate effects, but also based on how the present decisions will affect future possibilities.
A recent study from our lab suggests that older adults may actually be better than younger adults in situations where rewards are choice-dependent (Worthy et al., 2011). Choice-dependent decision-making situations are similar to the examples presented above where the rewards available from the various options in the environment depend on the sequence of choices made in the past. In contrast, in choice-independent situations the rewards available from the options in the environment are not affected by the choices made in the recent past. In choice-independent laboratory paradigms the rewards available for each option on each trial are usually set by the experimenter and often vary arbitrarily based on the trial number. Many of the decision-making tasks that have been used to examine how aging affects decision-making incorporate choice-independent reward structures. This is true for tasks like the Iowa Gambling task (Denburg et al., 2005), the Behavioral Investment Allocation Strategy task (Kuhnen and Knutson, 2005; Samanez-Larkin et al., 2010), the Monetary Incentive Delay task (Samanez-Larkin et al., 2007), and the Probabilistic Object Reversal Task (Mell et al., 2005, 2009). A common finding in these tasks is poorer or, at a minimum, equivalent performance for older adults compared to younger adults. Thus, older adults have been shown to outperform younger adults on choice-dependent tasks, whereas younger adults may outperform older adults on choice-independent tasks (Worthy et al., 2011).
One reason for this interaction between age and the reward structure of the task on decision-making performance may be an age related shift in the neural areas recruited during decision-making. A number of studies have shown that normal aging leads to structural and functional declines in a number of brain regions including the striatum, cerebellum, hippocampus, and prefrontal cortices (Raz, 2000; Resnick et al., 2003; Raz et al., 2005). Normal aging also leads to a loss of dopamine receptor density (Li et al., 2001). The striatum and prefrontal cortices, along with the mesencephalic dopamine system, are neural regions that have been consistently implicated in reward-based decision-making (Montague et al., 1996; McClure et al., 2003; Daw et al., 2006; Daw and Doya, 2006). Thus, the neurobiological changes associated with aging affect areas implicated in decision-making, and it is important to consider how these changes might affect behavior.
An additional distinction that has emerged in the decision-making literature concerns brain regions implicated in the evaluation of immediate versus future consequences of each action. The ventral striatum has often been linked to the evaluation of immediate rewards (Hariri et al., 2006; McClure et al., 2007; Samanez-Larkin et al., 2011), while areas of the prefrontal cortices, particularly the orbitofrontal cortex (OFC) and dorsolateral prefrontal cortex (DLPFC) have been associated with the evaluation of delayed rewards (Winstanely et al., 2006; McClure et al., 2007; Samanez-Larkin et al., 2011). Several behavioral studies that have examined how age affects intertemporal choice have found reduced delayed discounting in older adults (Green et al., 1994; Lockenhoff, 2011; Lockenhoff et al., 2011). Thus, older adults may focus more on the long-term benefits of their actions, whereas younger adults may focus more on immediate outcomes.
A recently proposed theory of cognitive aging, the scaffolding theory of aging and cognition (STAC; Park and Reuter-Lorenz, 2009), suggests that older adults engage a broader network of frontal areas to compensate for declines in a number of regions (Cabeza et al., 2002; Reuter-Lorenz and Cappell, 2008; Cappell et al., 2010). We propose that this frontal compensation leads older adults to focus more on the delayed effects of each action, rather than the immediate effects. This should lead older adults to outperform younger adults in choice-dependent situations, but underperform, relative to younger adults, in choice-independent situations. This is exactly what we found in a recent study (Worthy et al., 2011), however, the age-based differences in the precise computational mechanisms by which older and younger adults make repeated decisions remains underexplored, and little work has applied computational models to older and younger adults’ data to better understand these mechanisms.
In the current work we seek to fill this gap by examining older and younger adults’ behavior in choice-dependent and choice-independent decision-making tasks, and by fitting a series of computational models to each participant’s data that differ in their assumptions about how participants make decisions in the task. Increased frontal compensation in older adults may lead them to employ explicit, heuristic-based strategies to a greater extent than younger adults, who may show more use of less explicit, reinforcement-learning (RL) strategies. Indeed, some recent work suggests that older adults are more likely to make their decisions based on simple heuristics than younger adults (e.g., Mata et al., 2007; Castel et al., in press). To test these hypotheses we compare the fits of a heuristic-based, win-stay–lose-shift (WSLS) model with fits of two popular RL models that do not assume the use of a heuristic strategy. We provide more details on the mechanisms and assumptions of the models the next section. We first explain the mechanisms of each model and then discuss their different assumptions.
Computational Models of Decision-Making
WSLS model
Win-stay–lose-shift models have been extensively used to model decision-making behavior (Frank and Kong, 2008; Steyvers et al., 2009; Lee et al., 2011; Otto et al., 2011). These models were originally developed for simple prediction tasks where the participant chooses an option and receives a reward with a certain probability, P, or does not receive a reward with a probability (1 − P). It assumes that participants will “stay” by picking the same option on the next trial if they are rewarded (a “win” trial), or “shift” by selecting another option on the next trial if they are not rewarded (a “lose” trial).
In the tasks used in the present experiments participants select from among four options on each trial and receive between 1 and 10 points. We develop a WSLS model for these tasks by having the model assume that participants compare the reward received on the present trial to the reward received on the previous trial. The trial is a “win” trial if the reward on the present trial is equal to or greater than the reward received on the previous trial, and the trial is a “loss” trial if the reward on the present trial is less than the reward received on the previous trial.
The WSLS model has two free parameters. The first parameter represents the probability of staying with the same option on the next trial if the reward received on the current trial is equal to or greater than the reward received on the previous trial:

In Eq. 1 r represents the reward received on a given trial. The probability of switching to another option following a win trial is 1 − P(stay|win). To determine a probability of selecting each of the other three options we divide this probability by three, so that the probabilities for selecting each option sum to one.
The second parameter represents the probability of shifting to the other option on the next trial if the reward received on the current trial is less than the reward received on the previous trial:

This probability is divided by three and assigned to each of the other three options. The probability of staying with an option following a “loss” is 1 − P(shift|loss). Thus, this model assumes a simple, heuristic-based strategy that requires the reward received on the previous trial to be maintained in working memory (e.g., Otto et al., 2011).
RL models
Many common RL models used to account for decision-making behavior in choice tasks operate by developing and updating expected reward values for each option, aj, on each trial, t. These EVs are denoted here and elsewhere as EV(aj, t). The EVs for each option are used to determine the model’s probability for selecting each option. Action selection probabilities for each option are computed via a Softmax decision rule:
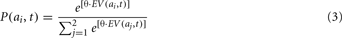
Here θ is an exploitation parameter that determines the degree to which the option with the highest EV is chosen. As θ approaches infinity the highest valued option is chosen more often, and as θ approaches 0 all options are chosen equally often.
Learning rules for the delta-rule and eligibility trace RL models
We fit two models that have slight differences in the assumptions regarding how EVs are updated on each trial. Both models use the Softmax rule in Eq. 1 to determine the probability of selecting each option. The Delta-Rule model assumes that the EV for the option chosen on each trial, denoted as option i, is updated on each trial using the following equation:

This model assumes that the expected values for each option are updated only when that option is selected, and are based only on the reward received immediately after making a choice. Learning is primarily mediated by a prediction error between the reward received and the EV for the chosen option (the bracketed portion of Eq. 2). The prediction is positive if the reward received is larger than expected and negative if the reward received is less than expected. Learning is modulated by a learning rate, or recency parameter (α), 0 ≤ α ≤ 1, that weighs the degree to which participants update the EVs for each option based on the most recently received rewards. As α approaches 1 greater weight is given to the most recent rewards in updating EVs, indicative of more active updating of EVs on each trial, and as α approaches 0 rewards are given less weight in updating EVs. When α = 0 no learning takes place, and EVs are not updated throughout the experiment from their initial starting points, Q(ai, t0). The Delta-Rule model has been used in a number of studies, primarily when the rewards in the environment are choice-independent (e.g., Sutton and Barto, 1998; Yechiam and Busemeyer, 2005; Daw et al., 2006; Worthy et al., 2007; Otto et al., 2010).
The learning rule for the Delta-Rule model can be modified to include eligibility traces (ET) which simply assert that participants remember which options they have chosen in the recent past, and that some of the credit from the reward received on each trial goes to options chosen on previous trials, rather than all of the credit going to only the option that was just chosen. The addition of ETs in the ET model has often resulted in an improved fit (Sutton and Barto, 1998; Pan et al., 2005; Bogacz et al., 2007; Gureckis and Love, 2009). The updating equation for the ET model is:

The model assumes that participants keep a memory for recent actions, known as an ET. The ET for each option is denoted above as, λj, and reflects how eligible each option is for learning.
On each trial, the ET, λj, for every option decays based on a decay parameter, ζ, 0 ≤ ζ ≤ 1:

Additionally, each time an option is chosen the ET for that option is incremented according to:

Eligibility traces are meant to assert that participants remember which actions they have recently selected, and in this way recent actions can be credited if they lead to increases in reward. Thus, in the ET model traces for options that are not chosen continue to decay and EVs are updated more based on recent rewards the more often they are chosen (Eq. 7). To summarize, there are two main differences between the Delta-Rule and ET models presented above. First, the ET model incorporates ETs for recent actions, and second, the ET model updates the EVs of all options on each trial based on each option’s ET value, whereas the Delta-Rule model only updates the EV for the chosen option. It should also be noted that the Delta-Rule model is nested within the ET model, as the ET model is identical to the Delta-Rule model when ζ = 0.
Age-based predictions for RL versus WSLS strategy use
We propose that utilizing a heuristic-based WSLS strategy will engage frontal brain regions, while utilizing an RL strategy will engage striatal brain regions. Older adults who engage in compensatory scaffolding should be more likely to utilize a WSLS strategy than an RL strategy than younger adults. Evidence for this distinction in the neural areas that mediate these two different types of strategies comes from many different sources. Reward prediction errors from RL models similar to the one presented above have been correlated with striatal activity in a number of studies (Pagnoni et al., 2002; Pessiglione et al., 2006; Hare et al., 2008). This suggests that EVs for each option may be updated in a more implicit, proceduralized manner that is not dependent on explicit processing (e.g., Frank and Claus, 2006; Frank et al., 2006).
In contrast, there is a large body of evidence that suggests that the use of heuristics, or rules, is explicit and more frontally mediated (e.g., Ashby et al., 1998; Maddox and Ashby, 2004; Ashby and Maddox, 2005). Recently, Otto et al. directly compared the fits of a WSLS strategy with fits of an Expectation-Matching strategy, with assumptions similar to the RL models presented above, to data from participants who performed a simple prediction task under either single-task or dual-task conditions. Participants who performed under single-task conditions showed more evidence of being best fit by the WSLS model, while participants who performed the task along with a concurrent, WM demanding task showed more evidence of being best fit by the Expectation-Matching model (Otto et al., 2011).
Based on the scaffolding theory outlined above, we predict that, relative to younger adults, older adults will employ more explicit strategies like WSLS due to frontal compensation. Thus, older adults’ data should show more evidence of being best fit by the WSLS model, while younger adults’ data should show more evidence of being best fit by one of the RL models.
In the following sections we present an experiment in which older and younger adults performed either a choice-dependent or choice-independent decision-making task. We then present behavioral results, followed by results of a modeling analysis where we compare the fits of the WSLS, Delta-Rule, and ET models, as well as the fits of a Baseline model that assumes random responding. This Baseline model has three free parameters representing the probability of selecting three of the four options on any given trial. The probability of selecting the fourth option is 1 minus the sum of the probabilities of the three other options. This model assumes random, stochastic responding. To foreshadow, we find that the ET and WSLS models provide the best fit to the data. We directly compare the fits of these two models and find that younger adults show more evidence of being best fit by the ET model than older adults.
Materials and Methods
Participants
Fifty-six younger adults (18–23 years of age, M = 20.29; 9 male and 19 female; Mean education = 15.34 years) were recruited from the University of Texas community and 58 older adults (60–82 years of age M = 69.71; 31 male and 18 female; Mean education = 17.28 years) were recruited from the greater Austin community. Participants were paid $10 per hour for participating. Older adults were administered an extensive neuropsychological testing battery to determine any mental declines not due to normal aging (detailed below).
Procedure
Neuropsychological testing session
Older adults were given a series of standardized neuropsychological tests before being included in the study. The neuropsychological testing session was held separately and before the experimental session. The battery of tests was designed to assess general intellectual ability across three functional realms: memory (Wechsler Memory Scale Third Edition (WMS-III) subtests: Wechsler, 1997; California Verbal Learning Test (CVLT): Delis et al., 1987), mood (Geriatric Depression Scale, GDS: Brink et al., 1982), and executive functioning and mental flexibility [Stroop Color–Word Test: Stroop, 1935; Trail Making Test A&B (TMT): Lezak, 1995; Controlled Oral Word Association (COWA): Lezak, 1995; Wisconsin Card Sorting Task (WCST): Heaton, 1981]. The tests were administered in a single 2 h session, in the same basic order to all subjects. The delay period of these tests was kept constant, and was comprised of other tests not requiring any long-term memory storage. The testing order was: CVLT, GDS, WAIS-III Information subtest, WAIS-III Arithmetic subtest, WAIS-III Vocabulary subtest, CVLT delayed-recall, WMS-III Logical Memory subtest, Stroop, TMT A&B, WAIS-III Similarities subtest, COWA, WAIS-III Digit Span subtest, WMS-III Logical Memory delayed-recall, WMS-III Visual Reproduction subtest, WAIS-III Letter/Numbering Sequencing subtest, WCST computerized version, WMS-III Visual Reproduction delayed-recall.
The standard, age appropriate, published norms were used to calculate normative scores for each subject. For all of the WAIS subtests, the percentile was calculated according to testing instructions, and this score was then converted to a standardized z-score. For the Stroop, CVLT, and WCST standardized t-scores were calculated according to testing directions, and this score was then converted to a standardized z-score. Finally, for the TMT and COWA standard z-scores were calculated according to the testing instructions. Older adults who had z-scores on two or more tests in the same functional realm that were 2 SD below the mean were not asked to participate in the study.
Experimental session
Each participant completed one of two decision-making tasks where all options led to gains in points and the goal was to maximize points gained. The two tasks had the same basic surface features and differed only on how the rewards for each option were structured. Figure 1 shows a series of sample screen shots from the tasks. Each task was 80 trials long, and participants made a choice and received between 1 and 10 points on each trial. Participants performed either a choice-independent or choice-dependent tasks. The tasks used in the Experiment were four-deck versions of tasks used in a previous paper from our lab (Worthy et al., 2007). The reward structures were modified from two-deck four-deck versions by simply adding one of each type of deck.
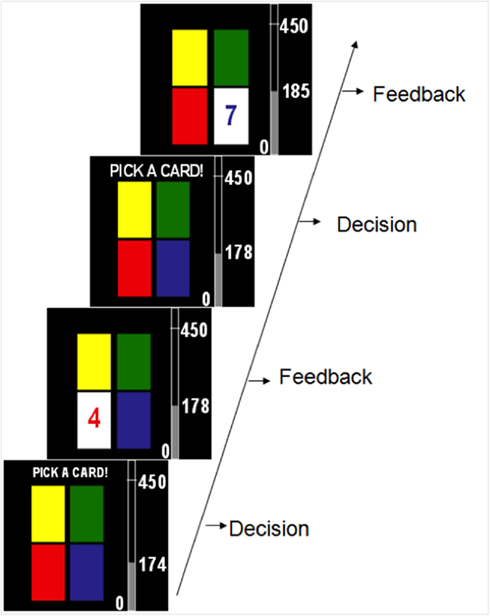
Figure 1. Timeline of two possible trials in the experiment. On each trial participants received between 1 and 10 points after selecting each option.
The rewards given for each deck in the choice-independent task are shown in Figure 2. There were two “A” decks that gave the same reward for a given trial, and two “B” decks that gave the same reward for a given trial. The A decks gave lower rewards over the first 50 trials of the task, but higher rewards over the final 30 trials of the task. The B decks gave higher rewards over the first 50 trials of the task, and lower rewards over the final 30 trials of the task. Optimal performance on the task required identifying and exploiting the decks that the largest gain or the smallest loss over the course of the task. The best strategy was to exploit one of the B Decks for the first 50 trials and to then switch to exploiting one of the A Decks for the final 30 trials. Participants were given a goal of earning at least 550 points by the end of the experiment. To accomplish this goal the best deck had to be exploited on approximately 90% of the trials in order for the goal criterion to be met. At the end of the session participants were told whether or not they met the goal.
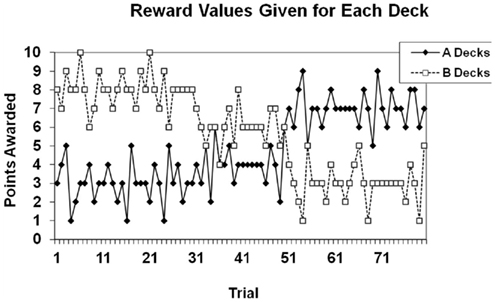
Figure 2. Reward structure for the choice-independent task. Points given were based on the trial number, rather than participants’ previous behavior.
The reward structure for the choice-dependent task is shown in Figure 3A. In the choice-independent task the rewards were a function of the trial number (as seen on the x-axis of Figure 2), but in the choice-dependent the rewards were based on how many cards have already been drawn from either the increasing or decreasing decks (cf. x-axis for Figure 3A). In this task there were two different types of decks: increasing decks and decreasing decks, and there were two of each type. The increasing decks gave poorer reward values at the beginning of the task, but better values as more cards were drawn from them. In contrast, the decreasing decks gave good values at the beginning of the tasks, but poorer values as more cards were drawn from them. The two increasing decks and the two decreasing decks were yoked, and separate counters were kept for each type of deck. Each time a card was drawn from one of the two increasing (or decreasing) decks the counter would increase by one and this number would be equivalent to the value on the x-axis of Figure 3A1.
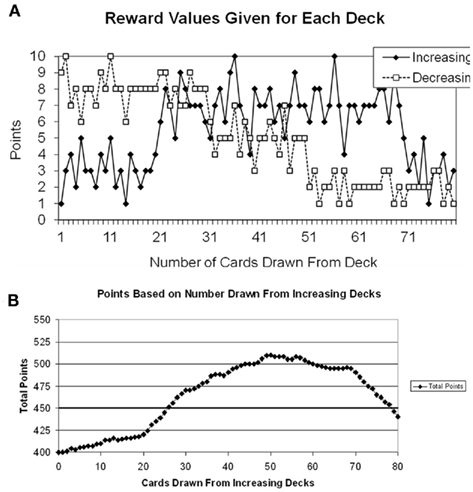
Figure 3. (A) Reward structure for the choice-dependent task. Points given were based on how many times participants had drawn from each type of deck. Separate counters were kept for the increasing and decreasing decks. (B) Plot of the points participants would earn based on the number of draws from the increasing decks.
Participants were given a goal of earning at least 450 points by the end of the experiment. The goal criterion was determined so that participants had to draw a minimum of 25 cards from the increasing decks to meet the criterion in each task. The total points earned for the gains task can be plotted as a function of the number of cards drawn from the increasing decks. This is shown in Figure 3B.
The specific instructions participants received before performing the choice-independent task are shown below. The instructions were the same for participants who performed the choice-dependent task except participants were told that their goal was to earn 450, not 550, points.
Specific instructions. You will perform a gambling task where you will be asked to make selections from one of four options. After each selection you will gain a certain number of points. Your objective is to gain as many points as possible. You will have a specific goal to earn a certain number of points by the end of the task. When you begin the task your goal will be listed on the screen. Try your best to earn as many points as possible.
Four decks will appear on the screen. You will use the “W,” “Z,” “P,” and “?/” keys to pick from these decks.
Press the “W” key to pick from the deck on the top left.
Press the “Z” key to pick from the deck on the bottom left.
Press the “P” key to pick from the deck on the top right.
Press the “?/” key to pick from the deck on the bottom right.
You will receive between 1 and 10 points each time you draw a card. Your goal is to earn at least 550 points by the end of the task.
Results
Performance
We first examined performance in each task by computing each participant’s payoff relative to the payoff obtained by an optimal performer. This proportion of the optimal cumulative payoff was computed by dividing the points earned by each participant by the maximum number of points that could be earned by an omniscient observer (600 in the choice-independent task and 515 in the choice-dependent task). The proportions of the optimal cumulative payoff are shown in Figure 4. A 2 (Age) × 2 (Task) ANOVA showed no main effect of age or for task, however there was a significant age × task interaction, F(1,110) = 12.96, P < 0.001, η2 = 0.11. We conducted pair-wise comparisons within each task to investigate the locus of the interaction. Within the choice-independent task there was a significant effect of age, F(1,57) = 5.42, P < 0.05, η2 = 0.09. Younger adults (M = 0.87) earned a significantly higher proportion of the optimal cumulative payoff than older adults (M = 0.84). There was also a main effect of age in the choice-dependent task, F(1,53) = 7.92, P < 0.01, η2 = 0.13. Older adults (M = 0.86) outperformed younger adults in this task (M = 0.83). Thus younger adults performed better on the choice-independent task, and older adults performed better on the choice-dependent task.
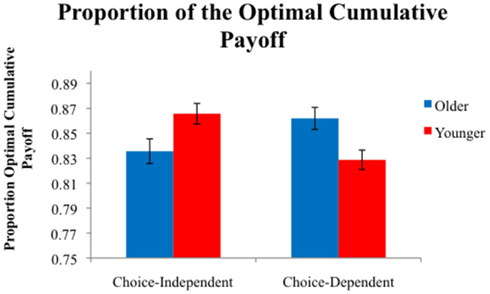
Figure 4. Average proportion of the optimal cumulative payoff earned by participants in each condition.
Model-Based Results
We fit each participant’s data individually with the WSLS, Delta-Rule, ET, and the Baseline models detailed above. The models were fit to the choice data from each trial by maximizing negative log-likelihood. We used Akaike weights to compare the relative fit of each model (Akaike, 1974; Wagenmakers and Farrell, 2004). Akaike weights are derived from Akaike’s information criterion (AIC) which is used to compare models with different numbers of free parameters. AIC penalizes models with more free parameters. For each model, i, AIC is defined as:

where Li is the maximum likelihood for model i, and Vi is the number of free parameters in the model. Smaller AIC values indicate a better fit to the data. We first computed AIC values for each model and for each participant’s data. Akaike weights were then calculated to obtain a continuous measure of goodness-of-fit. A difference score is computed by subtracting the AIC of the best fitting model for each data set from the AIC of each model for the same data set:

From the differences in AIC we then computed the relative likelihood, L, of each model, i, with the transform:

Finally, the relative model likelihoods are normalized by dividing the likelihood for each model by the sum of the likelihoods for all models. This yields Akaike weights:
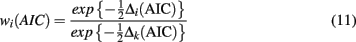
These weights can be interpreted as the probability that the model is the best model given the data set and the set of candidate models (Wagenmakers and Farrell, 2004).
We computed the Akaike weights for each model for each participant. Table 1 shows the average Akaike weights for participants in each condition. Akaike weights were highest for the ET model for younger adults across both tasks. Older adults’ had higher Akaike weights for the WSLS model in the choice-independent task, although the ET model also provided a good fit to the data. Akaike weights were highest for the ET model for older adults in the choice-dependent task, although the WSLS model also provided a good fit to the data. The Akaike weights for the Delta-Rule model were lower than the weights for the ET model across all four conditions, indicating that adding ETs provided a better fit to the data. The baseline model did not provide a good fit to the data compared to the fit of the two TD models.
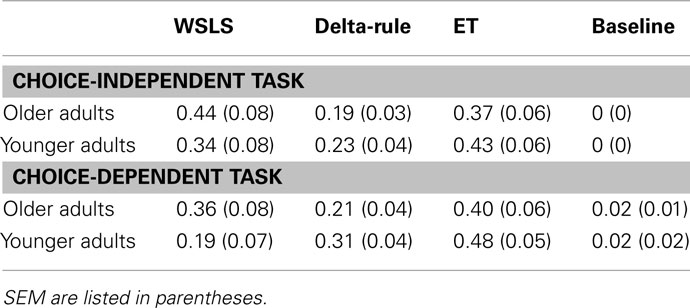
Table 1. Akaike weights for each model.
We can conclude from Table 1 that the ET and WSLS models provided the best fit to the data. We next compared the fits of the ET model and WSLS models directly for each participant to determine if participants were using a heuristic-based WSLS strategy, or a more associative RL strategy. To obtain a relative measure of the degree to which the ET model provided a better fit to the data than the WSLS model we subtracted the AIC of the ET model from the AIC of the WSLS (Relative fitET = lnLWSLS − lnLET), for each participant’s data. Because lower log-likelihood values indicate a better fit, positive Relative fitET values indicate a better fit for the ET model, while negative Relative fitET values indicate a better fit for the WSLS model.
These Relative fitET values are plotted in Figure 5. A 2 (Age) × 2 (Task) ANOVA showed a main effect of age, F(1,53) = 4.19, P < 0.05, η2 = 0.04. Younger adults (11.63) had higher Relative fitET values than older adults (M = 1.10), indicating more use a of an RL strategy than a heuristic-based WSLS strategy for younger adults. Relative fitET values were near 0 for older adults, indicating equal evidence for both models.
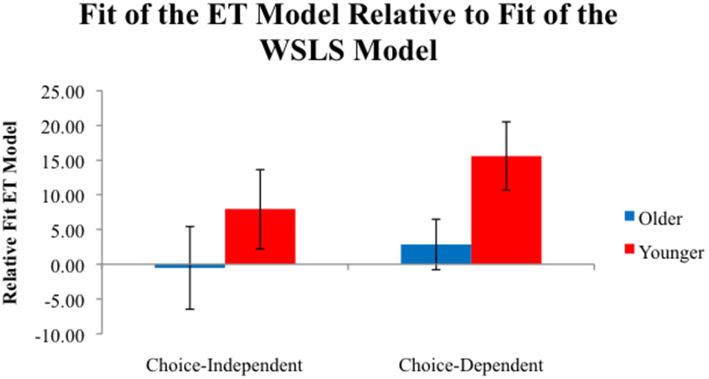
Figure 5. Average Relative fitET values for participants in each condition. Positive values indicate a better fit for the ET model, while negative values indicate a better fit for the WSLS model.
We next examined whether there was a relationship between the Relative fitET values and proportions of the optimal cumulative payoff obtained in the choice-independent and choice-dependent tasks. For the choice-independent task there was a significant positive correlation between Relative fitET values and the proportions of optimal cumulative payoff (r = 0.37, P < 0.01). We examined these correlations within the younger and older adults groups. There was a significant positive correlation between Relative fitET values and proportions of the optimal cumulative payoff within the older adults group (r = 0.41, P < 0.05). The correlation between Relative fitET values and proportions of the optimal cumulative payoff was also positive, but only marginally significant within the younger adult group (r = 0.26, P < 0.10).
Across all participants in the choice-dependent task there was a significant negative correlation between Relative fitET values and the proportions of optimal cumulative payoff (r = −0.43, P < 0.001). This correlation was negative, but did not reach significance for the older adults (r = −0.14, P > 0.10). The correlation between Relative fitET values and the proportions of optimal cumulative payoff was negative and highly significant for younger adults (r = −0.58, P < 0.001).
Neuropsychological Test Results and Strategy Use
We examined the older adult data from the neuropsychological testing session to determine if there were any relationships between scores on those tests and strategy use in the decision-making tasks. We first examined correlations between the scores on each neuropsychological test for older adults, and the proportions of the optimal cumulative payoff they earned as well as their Relative fitET values. However, none of these correlations reached significance (all P > 0.10).
We next split up the data based on whether older adult participants’ data were best fit by the ET or WSLS model. Thirty-two older adults were fit better by the WSLS model and 26 were fit better by the ET model. We examined the average z-scores from the neuropsychological tests for participants who were best fit by each of these models. There were two test variables for which scores significantly differed between these two groups: the CVLT’s recognition for true positives score, t(55) = −2.05, P < 0.05, and the WCST’s number of categories score, t(55) = −2.06, P < 0.05. Scores on both of these measures were higher for older adults who were best fit by the WSLS model compared to older adults who were best fit by the ET model (CVLT: WSLS M = 0.40, ET M = −0.02; WCST: WSLS M = 0.62, ET M = −0.05). Interestingly, z-scores for these two neuropsychological measures were not correlated (r = −0.07, P > 0.10).
The CVLT recognition for true positives test requires yes/no recognition of items presented earlier and has been linked to frontal lobe functioning. For example, patients with frontal lobe dysfunction have been found to underperform on this test relative to normal controls (Baldo et al., 2002). The WCST has been shown to activate the DLPFC to store earlier events in working memory and the mid-ventrolateral prefrontal cortex to signal the need for a mental shift in response to a new set (Monchi et al., 2001). Thus, while this analysis is only exploratory, the findings of superior performance on two neuropsychological tests related to frontal lobe functioning for older adults whose data were best fit by the WSLS model is consistent with the hypothesis that a WSLS strategy is more frontally mediated.
Discussion
We observed an interaction between age and the nature of the optimal task strategy on performance. Older adults performed better when rewards were choice-dependent, while younger adults performed better when rewards were choice-independent. This replicates our previous finding in the same choice-independent task, and mirrors our previous findings for two different choice-dependent tasks (Worthy et al., 2011). We fit the data with four different mathematical models to better characterize the behavior of younger and older adults when performing these tasks. Overall an RL model that included ETs provided the best fit to the data, although a WSLS model provided a good fit as well, particularly for older adults who performed the choice-independent task.
A direct comparison of the ET and WSLS model fits showed more evidence of WSLS strategy use for older adults than younger adults. Participants who were better fit by the ET model, relative to the fit of the WSLS model, tended to perform better on the choice-independent task, but worse on the choice-dependent task. A WSLS strategy may lead to sub-optimal switches from the most-rewarding options in the choice-independent task due to variation around the mean value given by each deck. A participant may switch to a different deck after receiving less on the current trial than what they received on the previous trial, even though they may be switching to a deck with a lower overall mean reward value. The ET model assumes that participants update and maintain EVs for each option. The EVs are essentially recency-weighted averages of the rewards received on previous trials, and the model predicts which option should be chosen by comparing the EV of each option with the EVs of the other options. This model should not predict as much switching from decks that give high average rewards because the decks are valued based on the average rewards received over many trials, rather than a relative comparison between the current reward and the reward received on the preceding trial.
A WSLS strategy likely helps on the choice-dependent task because participants are less likely to stay with the Decreasing options, and will select the Increasing options more due to the variation in rewards around each deck’s mean reward value. A WSLS strategy should also lead participants to switch away from the Decreasing options quicker once the rewards given by the Decreasing options begin to decline. An RL strategy will consistently value the Decreasing option early in the task because selecting it leads to larger average rewards. Because the EVs are recency-weighted averages of the rewards received for each option, participants using this type of strategy will pick the Increasing option less often early in the task, leading to poorer overall performance.
Thus, the age-based differences in performance on the choice-independent and choice-dependent tasks were due to differences in the types of strategies older and younger adults used to make their decisions on each trial, with older adults using a heuristic-based WSLS more often than younger adults. Other work also suggests that older adults may be more likely to use simple heuristics during decision-making than younger adults (Thornton and Dumke, 2005; Mata et al., 2007; Peters et al., 2007; Castel et al., in press). For example, Castel et al. (in press) recently found that older adults showed higher endorsement of the “hot-hand” heuristic in basketball than younger adults (i.e., the rule that the player who has made his/her last few shots should shoot the ball). Older participants in our experiment showed a similar preference for a heuristic-based WSLS strategy based on a comparison of the current and previous rewards, over an RL strategy that favored options with large expected reward values.
The differences in strategy preferences that we observed could be due to a shift in the neural areas recruited during decision-making, as predicted by STAC (Park and Reuter-Lorenz, 2009). A WSLS strategy may be more demanding of WM and executive attention resources than an RL strategy, which is more striatally mediated and less demanding of working memory and executive attention resources (Frank and Claus, 2006; Frank et al., 2006; Otto et al., 2011). Participants performing a concurrent working memory demanding task have been shown to be better fit by an expectation-matching model, similar to the RL models used here, relative to a WSLS model (Otto et al., 2011). While frontal compensation could be a cause for the age-based difference in strategy use, older adults may have also learned from life experience that the use of heuristics can often be an adaptive and useful way of making decisions (e.g., Gigerenzer and Todd, 1999; Broder, 2003; Scheibehenne et al., 2011). Indeed the use of a WSLS strategy was adaptive in the choice-dependent task as it led participants away from repeatedly selecting the Decreasing options. Older adults’ greater experience in advantageously using heuristics in decision-making situations may have led them to prefer such strategies more than younger adults in our decision-making tasks.
Conclusion
This study applied a series of mathematical models to data from younger and older adults who performed either a choice-dependent or choice-independent decision-making task. Older adults showed more evidence of utilizing a WSLS heuristic to make decisions than younger adults, who were best fit by an RL model that tracked recency-weighted averages of each option based on prediction errors. These results suggest that older and younger adults use qualitatively different strategies to make decisions, and that the shift in strategies may results from older adults engaging more frontal brain regions to compensate for age-based neural declines (Park and Reuter-Lorenz, 2009), and the greater experience of older adults in successfully using heuristics to make decisions.
Conflict of Interest Statement
The authors declare that the research was conducted in the absence of any commercial or financial relationships that could be construed as a potential conflict of interest.
Footnote
- ^It should be noted that the choice-dependent task is formally a partially observable Markov decision process (POMDP). Some research in machine learning suggests that the inclusion of ETs can help RL models cope with partial observability (e.g., Loch and Singh, 1998).
References
Akaike, H. (1974). A new look at the statistical model identification. IEEE Trans. Automat. Contr. 19, 716–723.
Ashby, F. G., Alfonso-Reese, L. A., Turken, A. U., and Waldron, E. M. (1998). A neuropsychological theory of multiple systems in category learning. Psychol. Rev. 105, 442–481.
Baldo, J. V., Delis, D., Kramer, J., and Shimamura, A. P. (2002). Memory performance on the California Verbal Learning Test-II: findings from patients with focal lesions. J. Int. Neuropsychol. Soc. 8, 539–546.
Bogacz, R., McClure, S. M., Li, J., Cohen, J. D., and Montague, P. R. (2007). Short-term memory traces for action bias in human reinforcement learning. Brain Res. 1153, 111–121.
Brink, T. L., Yesavage, J. A., Lum, O., Heersema, P. H., Adey, M., and Rose, T. L. (1982). Screening tests for geriatric depression. Clin. Gerontol. 1, 37–43.
Broder, A. (2003). Decision making with the “adaptive toolbox”. Influence of environmental structure, intelligence, and working memory load. J. Exp. Psychol. Learn. Mem. Cogn. 29, 611–625.
Brown, S. B. R. E., and Ridderinkhof, K. R. (2009). Aging and the neuroeconomics of decision-making. Cogn. Affect. Behav. Neurosci. 9, 365–379.
Cabeza, R., Anderson, N. D., Locantore, J. K., and McIntosh, A. R. (2002). Aging gracefully: compensatory brain activity in high-performing older adults. Neuroimage 17, 1394–1402.
Cappell, K. A., Gmeindl, L., and Reuter-Lorenz, P. A. (2010). Age differences in prefrontal recruitment during verbal working memory maintenance depend on memory load. Cortex 46, 462–473.
Castel, A. D., Rossi, A. D., and McGillivray, S. (in press). Beliefs about the “hot hand” in Basketball across the adult lifespan. Psychol. Aging.
Daw, N. D., and Doya, K. (2006). The computational neurobiology of learning and reward. Curr. Opin. Neurobiol. 16, 199–204.
Daw, N. D., O’Doherty, J. P., Dayan, P., Seymour, B., and Dolan, R. J. (2006). Cortical substrates for exploratory decisions in humans. Nature 441, 876–879.
Delis, D. C., Kramer, J. H., Kaplan, E., and Ober, B. A. (1987). California Verbal Learning Test: Adult Version Manual. San Antonio, TX: The Psychological Corporation.
Denburg, N. L., Tranel, D., and Bechara, A. (2005). The ability to decide advantageously declines prematurely in some normal older persons. Neuropsychologia 43, 1099–1106.
Frank, M. J., and Claus, E. D. (2006). Anatomy of a decision: striato-orbitofrontal interactions in reinforcement learning, decision-making, and reversal. Psychol. Rev. 113, 300–326.
Frank, M. J., O’Reilly, R. C., and Curran, T. (2006). When memory fails, intuition reigns: midazolam enhances implicit inference in humans. Psychol. Sci. 17, 700–707.
Gigerenzer, G., and Todd, P. M. (1999). “Fast and frugal heuristics: the adaptive tool box,” in Simple Heuristics that Make us Smart, eds G. Gigerenzer, P. Todd, and the ABC Research Group (New York: Oxford University Press), 3–34.
Green, L., Fry, A. F., and Myerson, J. (1994). Discounting of delayed rewards: a life span comparison. Psychol. Sci. 5, 33–36.
Gureckis, T. M., and Love, B. C. (2009). Learning in noise: dynamic decision-making in a variable environment. J. Math. Psychol. 53, 180–193.
Hare, T. A., O’Doherty, J., Camerer, C. F., Schultz, W., and Rangel, A. (2008). Dissociating the role of the orbitofrontal cortex and the striatum in the computation of goal values and prediction errors. J. Neurosci. 28, 5623–5630.
Hariri, A. R., Brown, S. M., Williamson, D. E., Flory, J. D., de Wit, H., and Manuck, S. B. (2006). Preference for immediate over delayed reward is associated with magnitude of ventral striatal activity. J. Neurosci. 20, 13213–13217.
Heaton, R. K. (1981). A Manual for the Wisconsin Card Sorting Test. Odessa, FL: Psychological Assessment Resources.
Kovalchik, S., Camerer, C. F., Grether, D. M., Plott, C. R., and Allman, J. M. (2004). Aging and decision making: a comparison between neurologically healthy elderly and young individuals. J. Econ. Behav. Organ. 58, 79–94.
Kuhnen, C. M., and Knutson, B. (2005). The neural basis of financial risk-taking. Neuron 47, 763–770.
Lee, M. D., Zhang, S., Munro, M., and Steyvers, M. (2011). Psychological models of human and optimal performance in bandit problems. Cogn. Syst. Res. 12, 164–174.
Li, S. C., Biele, G., Lindenberger, U., and Sikstrom, S. (2001). Aging cognition: from neuromodulation to representation. Trends Cogn. Sci. (Regul. Ed.) 5, 97–111.
Loch, J., and Singh, S. P. (1998). “Using eligibility traces to find the best memoryless policy in partially observable Markov decision processes,” in Proceedings of the Fifteenth International Conference on Machine Learning, Madison, 323–331.
Lockenhoff, C. E. (2011). Age, time, and decision making: from processing speed to global time horizons. Ann. N. Y. Acad. Sci. 1235, 44–56.
Lockenhoff, C. E., O’Donoghue, T., and Dunning, D. (2011). Age differences in temporal discounting: the role of dispositional affect and anticipated emotions. Psychol. Aging 26, 274–284.
Maddox, W. T., and Ashby, F. G. (2004). Dissociating explicit and procedural-learning systems of perceptual category learning. Behav. Processes 66, 309–332.
Mata, R., Schooler, L. J., and Rieskamp, J. (2007). The aging decision maker: cognitive aging and the adaptive selection of decision strategies. Psychol. Aging 22, 796–810.
McClure, S. M., Berns, G. S., and Montague, P. R. (2003). Temporal prediction errors in a passive learning task activate human striatum. Neuron 38, 329–337.
McClure, S. M., Ericson, K. M., Laibson, D. I., Loewenstein, G., and Cohen, J. D. (2007). Time discounting for primary rewards. J. Neurosci. 27, 5796–5804.
Mell, T., Heekeren, H. R., Marschner, A., Wartenburger, I., Villringer, A., and Reischies, F. M. (2005). Effects of aging on stimulus-reward association learning. Neuropsychologia 43, 554–563.
Mell, T., Wartenburger, I., Marschner, A., Villringer, A., Reischies, F. M., and Heekeren, H. R. (2009). Altered function of ventral striatum during reward-based decision-making in old age. Front. Hum. Neurosci. 3:34. doi:10.3389/neuro.09.034.2009.
Monchi, O., Petrides, M., Petre, V., Worsley, K., and Dagher, A. (2001). Wisconsin Card Sorting revisited: distinct neural circuits participating in different stages of the task identified by event-related functional magnetic resonance imaging. J. Neurosci. 21, 7733.
Montague, P. R., Dayan, P., and Sejnowski, T. J. (1996). A framework for mesencephalic dopamine systems based on predictive Hebbian learning. J. Neurosci. 16, 1936–1947.
Otto, A. R., Markman, A. B., Gureckis, T. M., and Love, B. C. (2010). Regulatory fit and systematic exploration in a dynamic decision-making environment. J. Exp. Psychol. Learn. Mem. Cogn. 36, 797–804.
Otto, A. R., Taylor, E. G., and Markman, A. B. (2011). There are at least two kinds of probability matching: evidence from a secondary task. Cognition 118, 274–279.
Pagnoni, G., Zink, C. F., Montague, P. R., and Berns, G. S. (2002). Acitivity in the human ventral striatum locked to errors of reward prediction. Nat. Neurosci. 5, 97–98.
Pan, W. X., Schmidt, R., Wickens, J. R., and Hyland, B. I. (2005). Dopamine cells respond to predicted events during classical conditioning: evidence for eligibility traces in the reward-learning network. J. Neurosci. 25, 6235–6242.
Park, D. C., and Reuter-Lorenz, P. (2009). The adaptive brain: aging and neurocognitive scaffolding. Annu. Rev. Psychol. 60, 173–196.
Pessiglione, M., Seymour, B., Flandin, G., Dolan, R. J., and Frith, C. D. (2006). Dopamine-dependent prediction errors underpin reward-seeking behavior in humans. Nature 442, 1042–1045.
Peters, E., Hess, T. M., Vastfjall, D., and Auman, C. (2007). Adult age differences in dual information processes: implications for the role of affective and deliberative processes in older adults’ decision making. Perspect. Psychol. Sci. 2, 1–23.
Raz, N. (2000). “Aging of the brain and its impact on cognitive performance: integration of structural and functional findings,” in The Handbook of Aging and Cognition, eds F. Craik and T. A. Satlhouse (Hillsdale, NJ: Erlbaum), 1–90.
Raz, N., Linberger, U., Rodrique, K. M., Kennedy, K. M., Head, D., Williamson, A., Dahle, C., Gerstorf, D., and Acker, J. D. (2005). Regional brain differences in aging healthy adults: general trends, individual differences and modifiers. Cereb. Cortex 15, 1676–1689.
Resnick, S. M., Pham, D. L., Kraut, M. A., Zonderman, A. B., and Davatzikos, C. (2003). Longitudinal magnetic resonance imaging studies of older adults: a shrinking brain. J. Neurosci. 23, 3295–3301.
Reuter-Lorenz, P. A., and Cappell, K. A. (2008). Neurocognitive aging and the compensation hypothesis. Curr. Dir. Psychol. Sci. 17, 177–182.
Samanez-Larkin, G. R., Gibbs, S. E. B., Khanna, K., Nielsen, L., Carstensen, L. L., and Knutson, B. (2007). Anticipation of monetary gain bus not loss in healthy older adults. Nat. Neurosci. 10, 787–791.
Samanez-Larkin, G. R., Kuhnen, C. K., Yoo, D. J., and Knutson, B. (2010). Variability in nucleus accumbens activity mediates age-related suboptimal financial risk-taking. J. Neurosci. 30, 1426–1434.
Samanez-Larkin, G. R., Wagner, A. D., and Knutson, B. (2011). Expected value information improves financial risk taking across the adult life span. Soc. Cogn. Affect. Neurosci. 6, 207–217.
Scheibehenne, B., Wilke, A., and Todd, P. M. (2011). Expectations of clumpy resources influence predictions of sequential events. Evol. Hum. Behav. 32, 326–333.
Schott, B. H., Niehaus, L., Wittman, B. C., Schutze, H., Seidenbecher, C. I., Heinze, H. J., and Duzel, E. (2007). Ageing and early-stage Parkinson’s disease affect separable neural mechanisms of mesolimbic reward processing. Brain 130, 2412–2424.
Steyvers, M., Lee, M. D., and Wagenmakers, E. J. (2009). A Bayesian analysis of human decision-making on bandit problems. J. Math. Psychol. 53, 168–179.
Stroop, J. R. (1935). Studies of interference in serial verbal reactions. J. Exp. Psychol. 18, 643–662.
Sutton, R. S., and Barto, A. G. (1998). Reinforcement Learning: An Introduction. Cambridge: MIT Press.
Thornton, W. J. L., and Dumke, H. A. (2005). Age differences in everyday problem-solving and decision-making effectiveness: a meta-analytic review. Psychol. Aging 20, 85–99.
Wagenmakers, E. J., and Farrell, S. (2004). AIC model selection using Akaike weights. Psychon. Bull. Rev. 11, 192–196.
Wechsler, D. (1997). Wechsler Adult Intelligence Scale, 3rd Edn. San Antonio: Harcourt Brace & Company.
Winstanely, C. A., Dalley, J. W., Theobald, D. E., and Robbins, T. W. (2006). Double dissociation between serotonergic and dopaminergic modulation of prefrontal and orbitofrontal cortex during a test of impulsive choice. Cereb. Cortex 16, 106–114.
Wood, S., Busemeyer, J., Koling, A., Davis, H., and Cox, C. R. (2005). Older adults as adaptive decision-makers: evidence from the Iowa Gambling Task. Psychol. Aging 20, 220–225.
Worthy, D. A., Gorlick, M. A., Pacheco, J. L., Schnyer, D. M., and Maddox, W. T. (2011). With age comes wisdom: decision-making in older and younger adults. Psychol. Sci. 22, 1375–1380.
Worthy, D. A., Maddox, W. T., and Markman, A. B. (2007). Regulatory fit effects in a choice task. Psychon. Bull. Rev. 14, 1125–1132.
Keywords: aging, decision-making, reinforcement learning, heuristics, computational modeling
Citation: Worthy DA and Maddox WT (2012) Age-based differences in strategy use in choice tasks. Front. Neurosci. 5:145. doi: 10.3389/fnins.2011.00145
Received: 15 October 2011;
Accepted: 16 December 2011;
Published online: 06 January 2012.
Edited by:
Gregory R. Samanez-Larkin, Vanderbilt University, USAReviewed by:
Samuel Joseph Gershman, Princeton University, USACarlos Diuk, Princeton University, USA
Copyright: © 2012 Worthy and Maddox. This is an open-access article distributed under the terms of the Creative Commons Attribution Non Commercial License, which permits non-commercial use, distribution, and reproduction in other forums, provided the original authors and source are credited.
*Correspondence: Darrell A. Worthy, Department of Psychology, Texas A&M University, 4235 TAMU, College Station, TX 77843-4235, USA. e-mail:d29ydGh5ZGFAdGFtdS5lZHU=