 Alexandra Sideris1
 Tatiana Bekker1
 Wai Si Chan1,2
 Jose V. Montoya-Gacharna1 Thomas J. J. Blanck1,2
 Esperanza Recio-Pinto1,3*
- 1 Department of Anesthesiology, New York University Langone Medical Center, New York, NY, USA
- 2 Department of Neuroscience and Physiology, New York University Langone Medical Center, New York, NY, USA
- 3 Department of Pharmacology, New York University Langone Medical Center, New York, NY, USA
In contrast to the adult brain, the adult spinal cord is a non-neurogenic environment. Understanding how to manipulate the spinal cord environment to promote the formation of new neurons is an attractive therapeutic strategy for spinal cord injury and disease. The cannabinoid 1 receptor (CB1R) has been implicated as a modulator of neural progenitor cell proliferation and fate specification in the brain; however, no evidence exists for modulation of adult spinal cord progenitor cells. Using adult rat spinal cord primary cultures, we demonstrated that CB1R antagonism with AM251 significantly decreased the number of Nestin(+) cells, and increased the number of βIII tubulin(+) and DCX(+) cells, indicative of neuronal differentiation. AM251’s effect was blocked by co-application of the CB1R agonists, WIN 55, 212-2, or ACEA. Consistent with our hypothesis, cultures, and spinal cord slices derived from CB1R knock-out (CB1−/−) mice had significantly higher levels of DCX(+) cells compared to those derived from wild type (CB1+/+) mice, indicative of enhanced neuronal differentiation in CB1−/− spinal cords. Moreover, AM251 promoted neuronal differentiation in CB1+/+, but not in CB1−/− cultures. Since CB1R modulates synaptic transmission, and synaptic transmission has been shown to influence progenitor cell fate, we evaluated whether AM251-induced neuronal differentiation was affected by chronic inactivity. Either the presence of the voltage-dependent sodium channel blocker tetrodotoxin (TTX), or the removal of mature neurons, inhibited the AM251-induced increase in DCX(+) cells. In summary, antagonism or absence of CB1R promotes neuronal differentiation in adult spinal cords, and this action appears to require TTX-sensitive neuronal activity. Our data suggest that the previously detected elevated levels of endocannabinoids in the injured adult spinal cord could contribute to the non-neurogenic environment and CB1R antagonists could potentially be used to enhance replacement of damaged neurons.
Introduction
The cannabinoid 1 receptor (CB1R) is a G-protein coupled receptor originally discovered as the specific binding cite of the major psychoactive constituent of marijuana (cannabis). CB1R is ubiquitously expressed on neurons throughout the central nervous system primarily at pre-synaptic sites, and is activated by the endocannabinoids AEA or 2-AG to decrease the probability of neurotransmitter release through inhibition of voltage-dependent calcium channels or activation of inwardly rectifying potassium channels (Wilson and Nicoll, 2002). CB1R is also involved in developmental processes such as proliferation, survival, and differentiation of neural progenitor cells derived from embryonic and adult rodent brain (Wilson and Nicoll, 2002). Though these studies demonstrate the importance of CB1R in adult brain neurogenesis, controversy exists regarding whether activation or inhibition of CB1R induces neuronal differentiation of brain progenitor cells (Rueda et al., 2002; Hill et al., 2006; Aguado et al., 2007). The contrasting, but not necessarily conflicting, results can be attributed to various factors such as chronic versus acute administration of cannabinoid drugs or thymidine analogs, endogenous versus synthetic cannabinoid compounds, and the patho-physiological context under which these compounds are administered (Rueda et al., 2002; Galve-Roperh et al., 2006, 2007).
Interestingly, no studies have examined CB1R’s role in neuronal differentiation of adult spinal cord progenitor cells. Though progenitors exist in the adult spinal cord, the environment is not permissive for neurogenesis (Horner et al., 2000; Horky et al., 2006; Barnabe-Heider et al., 2010). The ability to direct the progenitors to a neuronal fate by manipulating the non-permissive adult spinal cord environment is an attractive therapeutic strategy for spinal cord injuries involving neuronal death. These progenitor cells have intrinsic neurogenic potential, but they preferentially differentiate into glial phenotypes in vivo (Weiss et al., 1996; Shihabuddin et al., 1997, 2000; Barnabe-Heider et al., 2010). CB1R is located throughout the spinal cord and is involved in sensory and motor functions (Pernia-Andrade et al., 2009; El Manira and Kyriakatos, 2010). The findings of this study indicate that CB1R may also be a modulator of progenitor cell fate in the spinal cord.
Using primary cultures from adult rats and CB1R knock-out mice, we tested the hypothesis that CB1R antagonism/inverse agonism with AM251 could promote neuronal differentiation of adult spinal cord-derived progenitor cells in vitro. This study demonstrates that adult spinal cord progenitors have intrinsic neurogenic potential that can be revealed by manipulating the endocannabinoid system.
Materials and Methods
Primary Mixed Culture of Adult Rat Spinal Cord Cells
Adult male Sprague Dawley rats aged 60–80 days were used, weighing between 250 and 450 g and CB1+/+ (wild type) and CB1−/− (knock-out) mice aged 6–8 weeks were used for experiments because of increased mortality of CB1−/− beginning after 10 weeks (Zimmer et al., 1999). All experiments were approved by and performed in accordance with the New York University Langone Medical Center Institutional Animal Care and Usage Committee. Rats/mice were anesthetized with an intraperitoneal injection containing a cocktail mixture of Ketamine (80 mg/kg-rats/100 mg/kg-mice Ketaset, Fort Dodge Animal Health, IA, USA) and Xylazine (12 mg/kg, Anased, Shenandoah, IA, USA) and were perfused intracardially with 250 ml (rat)/125 ml (mouse) artificial cerebrospinal fluid (ACSF), pH 7.4 at 4°C as previously described (Montoya et al., 2009). The ACSF was prepared in distilled de-ionized water as follows: dextran 0.4 mM, Sucrose 125 mM, Glycerol 125 mM, NaHCO3 26 mM, Glucose 15 mM, HEPES 2.1 mM, KCl 3 mM, MgSO4 1.3 mM, and KH2PO4 1.2 mM. The ACSF was filtered and oxygenated for 30 min with 95% O2/5% CO2 prior to use. After perfusion, the rat/mouse was decapitated with a guillotine, and the spinal cord was extracted using hydraulic extrusion (modified from Shihabuddin, 2008). The spinal column of the rat/mouse was exposed and cut ~4 cm (rat)/1 cm (mouse) from the base of the tail to expose the spinal canal in the sacral region. A 10-ml (rat)/5 ml (mouse) syringe filled with ACSF and capped with a 16½ (rat)/20½ (mouse) gage needle was inserted into the spinal canal and quickly compressed to extrude the cord from the decapitated cervical end. The extruded spinal cord was collected in cold Hibernate A medium (Brain Bits, IL, USA) supplemented with 2% B27 (Gibco), 0.5 mM Glutamax (Gibco), and Penicillin (100 U/ml)/Streptomycin (100 μg/ml; Gibco), (referred to as “HA-complete”).
The entire spinal cord was cut into 2 mm pieces and placed into a 10-ml sterile solution of HA-complete with 0.2% papain (Worthington) and 0.02% DNase (Worthington). The tissue was incubated with these enzymes for 15 min at room temperature (RT) with gentle agitation, and then for 15 min at 30°C with gentle agitation. Afterwards, the supernatant was discarded and 2 ml of HA-complete with 0.02% DNase was added to the pellet. Using three sterile fire-polished pasteur pipettes of decreasing bore size, the tissue pellet was triturated 10 times each and allowed to settle for 1 min before the supernatant was collected into a separate tube. After each trituration, an additional 2 ml of HA-complete was added to the pellet. The resulting 6 ml of dissociated tissue was added on top of 5 ml of a 6% OptiPrep (Accurate Chemical and Scientific Corp., NY, USA) in a 50-ml conical tube (prepared using HA medium). This was centrifuged for 10 min at 4°C at 822 × g (1700 rpm Beckman JS-4.2 rotor). The myelin band (formed at the interface of the two fractions) was removed using a sterile 3 ml transfer pipette (Samco) and discarded. To remove the OptiPrep from the cell suspension, 20 ml of HA-complete was added and mixed thoroughly with the cell suspension. This mixture was passed through a 70-μM cell strainer (BD Falcon) to remove debris or tissue pieces that were not fully dissociated, and was then centrifuged for 5 min at 480 × g at 4°C. The supernatant was discarded and the pellet resuspended in 3 ml of HA-complete. An Optiprep gradient was then prepared and consisted of the following fractions: from bottom to top, 12, 9, 7.4, 6, 4.8%, 2 ml each in a 15-ml conical tube. The different fractions were with Hibernate A medium supplemented with 2% B27 and either pure OptiPrep or OptiPrep stock as follows. OptiPrep stock (10 ml) was made by mixing 4.95 ml of pure OptiPrep with 5.05 ml HA medium. For the fractions 4 ml of each were made: 12% – add 0.8 ml pure OptiPrep to 3.2 ml of HA medium; for 9% – add 0.6 ml pure OptiPrep to 3.4 ml HA medium); for 7.4% – add 1 ml stock OptiPrep to 3 ml of HA medium; for 6% add 0.8 ml OptiPrep Stock to 3.2 ml of HA medium and finally, for 4.8% – add 0.6 ml of stock OptiPrep to 3.4 ml of HA medium. The gradient was prepared by adding 2 ml of each fraction in a 15-ml conical tube, and then adding 3 ml of the cell suspension to the top of the gradient. The gradient was centrifuged for 15 min at 480 × g and 4°C. The 12%, 9%, and 7.4% fractions were collected into separate 15 ml tubes. The volume of each fraction was brought up to 5 ml with HA-complete, mixed well, and centrifuged for 5 min at 480 × g and 4°C to dilute out the OptiPrep and obtain a pellet of cells. After the centrifugation, the pellets were resuspended separately with warm Neurobasal A medium supplemented with 2% B27 (Gibco), 0.5 mM Glutamax (Gibco), 100 U/ml Penicillin, and 100 μg/ml Streptomycin (Gibco) and then pooled. The final volume for all the fractions was ~500 μl. The total cell yield in each experiment was ~250,000 cells (500,000 cells/ml), and 10 μl of the cell suspension was plated onto poly-D-lysine coated coverslips (Sigma, 50 μg/ml). The cells were incubated for 1 h at 37°C/5% CO2 to attach before additional media with or without drugs was added. Unless otherwise indicated, the culture medium (growth media) consisted of Neurobasal A medium supplemented with B27 (2%), Glutamax (0.5 mM), Penicillin (100 U/ml), Streptomycin (100 μg/ml), a growth factor mixture [Glial Derived Neurotrophic Factor (Chemicon; 0.1 ng/ml); Ciliary Neurotrophic Factor (Sigma; 10 ng/ml); brain derived neurotrophic factor (Invitrogen; 1 ng/ml), and cAMP analog 8-(4-Chlolorophenyl-thio) cyclic adenosine-3′,5′-cyclic monophosphate sodium salt (Sigma C3912)], and 30% muscle conditioned medium that was prepared using a muscle cell line as previously described (Montoya et al., 2009).
Cultures Enriched for Progenitors from Adult Rat Spinal Cord Cells
The cell isolation was done exactly as described above, except that the media consisted of Neurobasal A medium supplemented with only B27 (2%), Glutamax (0.5 mM) Glutamax, Penicillin (100 U/ml), Streptomycin (100 μg/ml), and basic fibroblast growth factor (bFGF; Invitrogen; 20 ng/ml).
Drugs
All drugs were purchased from Tocris USA (WIN 55, 212-2; AM251; ACEA) and dissolved in either sterile DMSO (Dimethyl Sulfoxide; Sigma) or absolute Ethanol. On days 0, 1, 3, and 5 in culture, 75% of the growth media was removed and replaced with fresh media treated with either a vehicle (DMSO or ethanol), a cannabinoid receptor agonist (WIN 55, 212-2, or ACEA), an antagonist (AM251), or a mixture of agonist and antagonist. For the experiments in Figures 4C–E, only 50% of media was removed. When performing the concentration–response experiments, the apparent potency of AM251 was higher if the feeding protocol involved removal of 75%, instead of 50%, of the old media, probably reflecting drug dilution in our cultures. We also observed that the potency of AM251 decreased over time while stored at −20°C, but nevertheless a range of efficacy for inducing neuronal differentiation was observed between 10 and 500 nM. For all experiments, different stock solutions were made so that the volume of drug added into each well and the final vehicle concentration was the same.
Genotyping CB1R Transgenic Mice
The genotyping protocol was kindly provided by Dr. Rui Costa from the Instituto Gulbenkian de Ciencia, Portugal [personal communication, and for reference (Hilario et al., 2007)]. The kit used for DNA extraction and PCR was Sigma PCR kit, and the company protocol was followed, with slight modifications. Briefly, each tail snip was incubated at RT with Extraction and Tissue Preparation mixture for 12 min. The samples were then placed in boiling water for 3 min. Immediately afterward, Neutralization solution was added to the samples, the tubes vortexed for 3 s, and kept on ice until the “Master Mix” PCR mixture was made. A “Master Mix” was made with Extract-N-Amp solution (Sigma), DNAse free water, primers, and DNA extract. Primers were obtained from Integrated DNA Technologies, and dissolved in distilled, de-ionized water at a 100-μM stock concentration, and at 5 μM working solution concentration, all stored at −20°C. A final concentration of 400 nM of each of the following primers was used in the PCR reaction, Forward: GTA CCA TCA CCA CAG ACC TCC TC, Wild Type: GGA TTC AGA ATC ATG AAG CAC TCC A, Knock-out: AAG AAC GAG ATC AGC AGC CTC TGT T (Costa et al., 2005). A 1% agarose gel was made in 1× TAE buffer, with SYBR Safe DNA Gel Stain (Invitrogen). Samples were electrophoresed in TAE buffer at 100 V using an EPS250 power supply (C.B.S. Scientific Company, Inc.) for ~40 min. The gel was visualized under UV light and an image of the gel acquired. Amplicon size for the CB1+/+ mice was 300 bp, for CB1−/− was 160 bp, and CB1+/− contained both bands.
Spinal Cord Slice Preparation
Spinal cord slices of adult CB1+/+ and CB1−/− mice were prepared and stained with DCX following the protocol described by Shechter et al. (2010). As a control, five times excess of the DCX blocking peptide (Santa Cruz cat# sc-8066 P) was incubated with the primary antibody.
Immunocytochemistry
Two hours after plating the cells, or after 6 days in culture, the cells were washed [two times for 2 min each, with phosphate buffered saline (PBS) that was pre-warmed to 37°C], fixed with 4% paraformaldehyde (EM Sciences) for 15 min at RT, and then rinsed with PBS three times. The cells were permeabilized with 0.3% Triton X-100 (Sigma) for 15 min at RT, then rinsed three times with PBS. Then the cells were blocked for 1 h at RT using 10% normal goat serum, NGS-(Sigma) in PBS. For co-labeling, the following antibodies were used by diluting in 2% NGS and incubating overnight at 4°C: polyclonal anti-CB1R (1:500 Thermo Scientific #PA-743); monoclonal anti-Tu-20 (βIII tubulin isoform 1:1000 Millipore cat # MAB1637); or polyclonal Doublecortin-DCX (1:250 Santa Cruz cat # sc-8066). Two Nestin antibodies were used: polyclonal anti-Nestin (1:1000 Abcam cat # ab5968, lot#122206, we found that lot #575937 gave too high of a background and hence were not used) and the monoclonal anti-Nestin (1:200 Millipore cat # MAB353). After primary antibody incubation, the cells were rinsed three times with PBS, and incubated with the appropriate secondary antibodies for 1 h in the following concentrations: Alexa-Fluor 546 goat anti-mouse (1:1000 Molecular Probes cat #A11030), Alexa-Fluor 488 goat anti-rabbit (1:1000 Molecular Probes #A11034). After rinsing with PBS, Hoechst (20 μg/ml Sigma) was added for 20 min at RT to stain nuclei. For experiments to determine proliferation, Click-iT EdU™(5-ethynyl-2′-deoxyuridine; Invitrogen) was used according to the manufacturer’s protocols. EdU was added to the cultures at a concentration of 5 μM (higher concentrations were toxic) for ~20 h and then identified using the Click-iT technique. For all staining, negative controls were coverslips that did not have any primary antibody, but only received secondary antibodies.
Western Blot
For Western blots 1 × 10⁶ cells (E17 rat hippocampal neurons, courtesy of J. J. Sutachan, NYU Medical Center), were plated on poly-D-lysine coated Petri dish (35 mm diameter) and cultured for 48 h. Adult rat hippocampus, and adult rat lumbar spinal cord were isolated, frozen on dry ice, and stored at −80°C until protein isolation. For protein extraction, dishes were placed on ice and washed first with 1.0 ml of cold PBS (containing Ca2+ and Mg2+) and a second time with 1.0 ml of cold PBS (without Ca2+ and Mg2+) plus 5 μl of a protease inhibitor cocktail (PIC; Pierce, Thermo, Fisher Scientific Inc., Rockford, IL, USA, cat # 78410) for 5 min each. Then 50–55 μl of RIPA lysis buffer (Millipore, Billerica, MA, USA), 0.1% SDS, and PIC (1:66) were added to each of the Petri dishes and left on ice for 30 min. Samples were detached with a cell scraper, collected, vortexed (5–7 s), left on ice (30 min), and centrifuged (14,000g, 15 min, 4°C). The supernatant was collected, aliquoted, and stored at −80°C. Protein concentrations were determined using the Lowry Assay (Sigma Aldrich). The sample volume containing 20 μg of protein was brought to a volume of 15–25 μl by adding RIPA and 3–5 μl of loading buffer 5× was added (Crystalgen Inc., Commack, NY, USA). The protein was denatured (boiling, 5 min) and loaded onto a 4–20% gradient (Invitrogen, #EC6025) SDS-PAGE gels. Electrophoresis was carried out (120–150 min, Power supply Model-EPS-250-CBS Scientific Company, Del Mar, CA, USA, set at ~25 mA) in 1× running buffer (from 10× Tris Gly–SDS electrophoresis solution, Fisher Scientific, Pittsburgh, USA). The protein was transferred onto Amersham Hybond-P polyvinylidene difluoride (PVDF) membranes (GE Healthcare, USA). PVDF membranes were incubated/activated in 100% methanol (2 min), rinsed with dH2O (5 min), and equilibrated in transfer buffer (10 min, RT). A “sandwich” containing sponge-filter paper, the gel, and the membrane was made and protein transfer was performed (2 h, ~100 V; Power supply Model-EPS-250-CBS Scientific Company, Del Mar, CA, USA). Proteins were visualized by placing the membrane in Ponceau S solution (Sigma) for 5 min. The non-specific binding sites were blocked by incubating the membrane (90 min, RT) with either 5% non-fat dry milk (Lab Scientific, Livingston, NJ, USA) in 0.1% PBST (PBS containing 0.1% Tween 20). The membrane was incubated with monoclonal anti-Tu-20 [βIII tubulin isoform (1:3000 Millipore) overnight with gentle agitation, 4°C]. The primary antibody was diluted in 3% non-fat dry milk. Blots were washed four times for 5 min with 0.1% PBST and incubated with a goat anti-mouse secondary antibody (Santa Cruz Biotechnology 1:5000, cat # sc-2005) for 90 min at RT with agitation. Blots were then extensively washed according to the manufacturer’s instruction and developed using the ECL detection method (SuperSignal West Pico, Thermo Scientific #34077, or the SuperSignal West Dura, Thermo Scientific #37071).
Image Acquisition and Analysis
Images for quantification were acquired using a Zeiss Axiovert 200 microscope by sampling either 20 or 40 random fields in three coverslips per treatment. Pictures of negative controls were also taken at the same exposure time as the positive coverslips, and used to determine the background intensity values. Image acquisition for initial experiments (Figures 4C–F) was performed by blinding the investigator to the different treatments. Positive cells were counted by eye after subtracting the background. For all other experiments, every cell per image (for all treatments) was traced and the fluorescent intensity was generated using Axiovision software. The average background intensity values from the negative controls were used to determine the fluorescence intensity cutoff value above which the cells would be considered “positive” for the antibody. A cell was considered positive for a marker if the intensity value of the fluorophore was 3 standard deviations above the mean background value determined from the negative controls. Statistical analysis was done using either one-way ANOVA with Bonferroni’s (for comparisons of three to five groups) or Dunnett’s (when more than five groups, and all the treatment groups were compared to the control) multiple comparison post-tests, or using the Unpaired t-test for comparison of two groups. Parametric tests were chosen because we determined that the distributions (number of cells versus labeling intensity) of Nestin(+) cells (in mixed- and progenitor-enriched cultures); and of DCX(+) cells (in progenitor-enriched cultures) were consistent with that of a Gaussian distribution (D’Agostino–Pearson–omnibus K2, normality test, Prism; p > 0.7).
Results
CB1R is Present on Various Adult Spinal Cord Cells, Including Progenitors
Because the goal was to determine the role that CB1R plays in modulating the fate of the progenitors, the presence of the receptor was determined in our two cell populations of interest: neural progenitors and immature neurons. Nestin was used as a neural progenitor marker (Hockfield and McKay, 1985; Gritti et al., 1996; Weiss et al., 1996) and βIII tubulin as an immature neuronal marker (Lee et al., 1990; Kehl et al., 1997). The relative proportions of these populations were also assessed at two different time points, in basal growth conditions. At Day 6, the percentage of Nestin(+) cells in mixed cultures was 24% (±3 SEM, n = 8 coverslips from three separate preparations) and most were positive for the CB1R (Figures 1A,B in mixed cultures, Figure 1C, progenitor-enriched cultures). In these progenitors, CB1Rs were located on the somata (Figures 1A,C), but were also observed at the terminals of the progenitor extensions (Figure 1C, middle panel, insert). Furthermore, the progenitor cells in the mixed cultures were dividing because 8.0% (±1.5, n = 10 coverslips) co-labeled with Nestin and EdU, accounting for ~82% of all the Nestin(+) cells (Figures 1D,E).
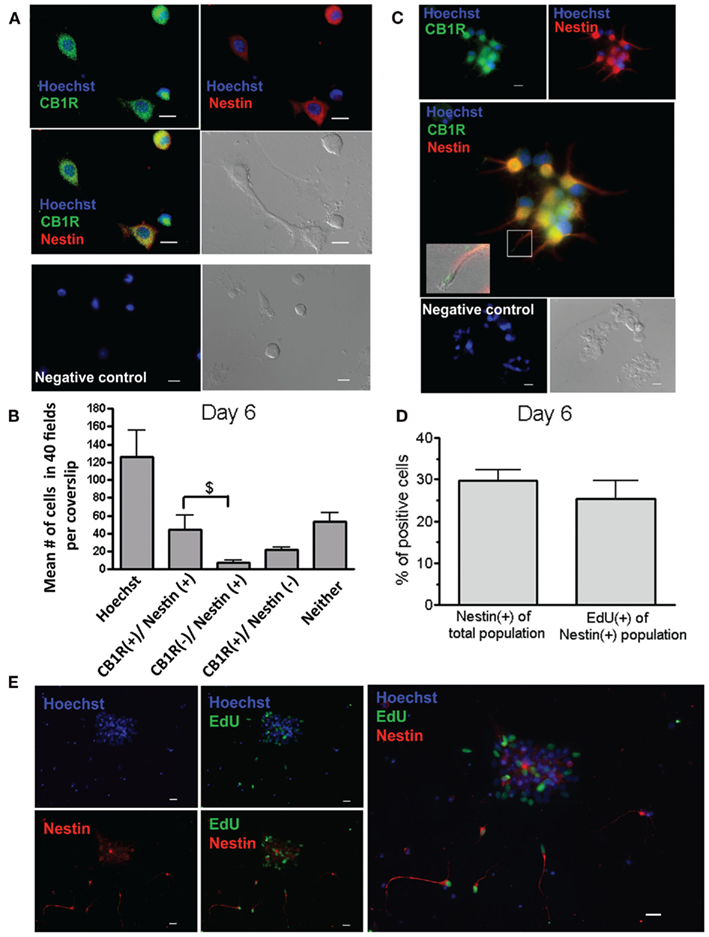
Figure 1. The cannabinoid 1 receptor is present on progenitor cells derived from adult spinal cords. (A) Mixed cultures on Day 6 immunostained with an anti-CB1R (green) and with polyclonal Nestin (red). Individual images (Top) and the merged image (middle left). The negative control, without primary antibody, is shown in the bottom panel. (B) Mean number of cells that were positive (+) for the CB1R and/or Nestin. Sixteen to twenty fields were analyzed per coverslip (n = 3 coverslips; mean + SEM). Most of the Nestin(+) cells were CB1R(+), and no significance difference was found between the number of CB1R(+)/Nestin(+) and CB1R(+)/Nestin(−) cells ($p < 0.01, One-way ANOVA, Bonferroni post test). (C) Primary neurospheres generated under proliferative conditions (adding only bFGF) for 6 days, and then plated on poly-D-lysine coated coverslips. They were immunostained with the CB1R antibody (green), and monoclonal Nestin (red). Individual images (Top) and merged image (middle). The inset in the middle panel corresponds to the area outlined with the white box. For the inset the light picture is also overlapped to facilitate visualization of the cell extension. The inset shows CB1R labeling (green) at the end of an extension from a Nestin(+) (red) cell. The negative control is shown in the bottom panel. (D) Percentage of Nestin(+) cells in the entire population and of EdU(+) cells within the Nestin(+) population in mixed cultures on Day 6. Twenty fields were analyzed per coverslip (n = 10 coverslips; mean + SEM). (E) Mixed cultures on Day 6 immunostained with anti-Nestin (red) and labeled with the mitogenic marker EdU (green). (A,C,E) The background fluorescence was subtracted from the image relative to the negative control. Nuclei were labeled with Hoechst 3392 (blue). Images were acquired with a 20× objective; scale bars = 10 μm. The image was selected to show a large number of Nestin(+) cells.
On Day 6, most of the cells (>90%) in the small cell population that expressed the immature neuronal marker βIII tubulin also expressed the CB1R (Figure 2A). The staining pattern for CB1R appeared punctate and localized to the soma (Figure 2B), and was occasionally found on the growth cones and the neurites of these immature neurons (Figure 2B, white box, Figure 2D respectively).
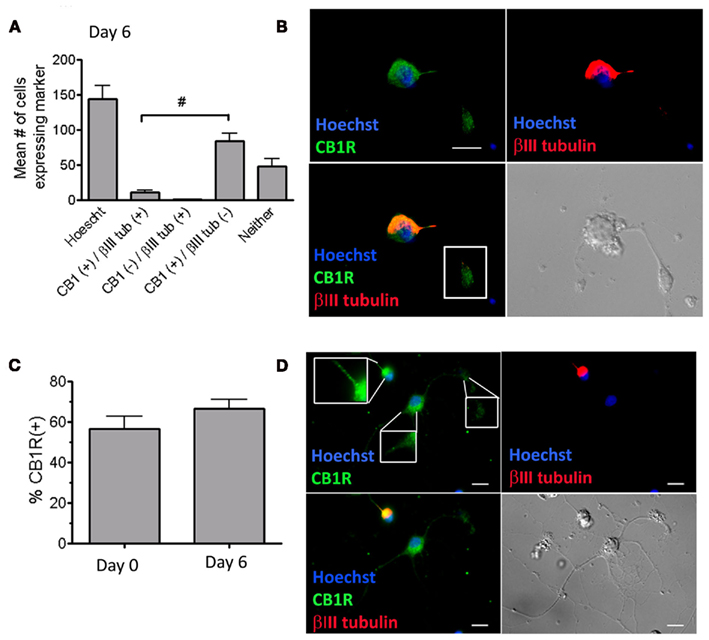
Figure 2. Cannabinoid 1 receptor is expressed on immature spinal cord-derived neurons. (A) Total number of cells that were CB1R(+) and/or βIII tubulin(+) in mixed cultures on Day 6. All of the βIII tubulin(+) cells were also CB1R(+). There were more CB1R(+)/tubulin(−) cells than CB1R(+)/tubulin(+) cells (#p < 0.001, one-way ANOVA Bonferroni post test). Twenty fields were analyzed per coverslip with a 40× objective (n = 3 coverslips; mean + SEM). (B) Mixed cultures on Day 6 immunostained with an anti-CB1R (green) and with anti-βIII tubulin (red). The terminal of the neurite of a βIII tubulin(+) cell is also CB1R(+) (white box). (C) Percentage of all cells that express the CB1R in mixed cultures. Cells were immunostained with the CB1R antibody at Day 0 (2 h after plating) and at Day 6 after culturing with growth media. There was no significant change in the% of CB1R(+) between Day 0 and Day 6 (Unpaired t-test, two tailed). Twenty fields were analyzed per coverslip (n = 3 coverslips; mean + SEM). (D) This image shows one cell that is CB1R(+)/βIII tubulin(+) (immature neuron) and another cell that is CB1R(+)/βIII tubulin(−) (which based on morphology could represent a mature neuron). The insets in the upper left panel (starting from the most left inset, and going in a clockwise direction) magnify the CB1R expression on the soma/extension of the immature neuron, the terminal of the mature neuron, and the soma/extension of mature neuron. In all cases the background fluorescence was subtracted from the image relative to the negative control, the nuclei were labeled with Hoechst 3392 (blue). (B,D) Images were acquired with a 63× objective; scale bars = 10 μm.
In mixed cultures we found that at Day 0 ~56% (±6.3 SEM, n = 3) of the cells expressed CB1R, while at Day 6 ~70% (±9.3 SEM, n = 3) of the cells expressed CB1R (Figure 2C), indicating that mature cells, immature neurons, and progenitors from the adult spinal cord express CB1R.
AM251 Induces an Increase in βIII Tubulin Positive Cells in a Concentration-Dependent, Biphasic Manner
The CB1R specific antagonist AM251 was administered to the mixed spinal cord cultures at various concentrations, and the amount of βIII tubulin(+) immature neurons cells was quantified. AM251-induced an increase in the percentage of βIII tubulin(+) cells relative to control, with the maximal increase between 10 and 30 nM (Figure 3A). At higher concentrations (>100 nM) the neurogenic effect induced by AM251 was lost (Figure 3A). AM251’s effect was also occasionally detected at higher concentrations (100–500 nM), but this is attributable to different feeding protocols, and a decrease in the drug’s potency over time (see Materials and Methods). The different percentages of βIII tubulin(+) cells did not reflect a selective cell death because the total cell number in the cultures did not change when exposed up to 3 μM AM251 (Figures 3B,E). Moreover, in the concentration range used for the experiments, AM251 did not change the percentage of MAP2(+) mature neurons, indicating that the drug treatment was not neurotoxic (Figure 3C). The typical morphology of cultured spinal cord cells can be seen in Figure 3D, in which the progenitors [Nestin(+) cells] and newly generated neurons [βIII tubulin(+) cells] have small rounded bodies that are less than 10 μm in diameter. AM251 became cytotoxic at 10 μM (Figure 3E). The neurogenic effect of AM251 appears to be biphasic within a concentration range that does not affect the total cell number and gross cellular morphology.
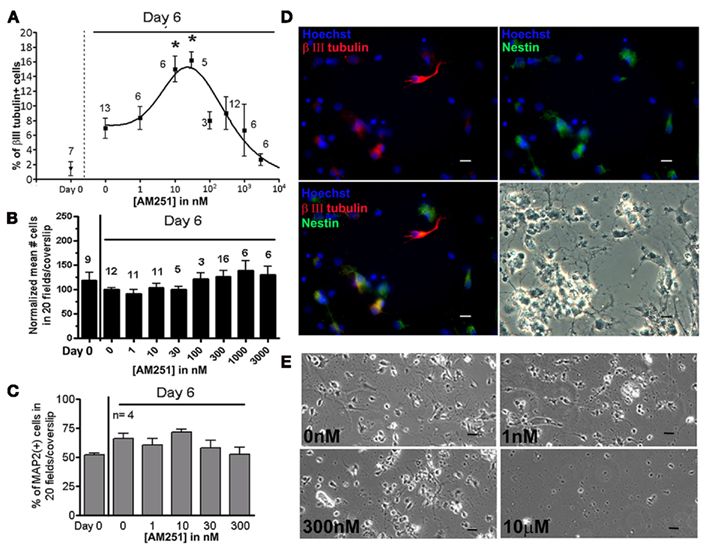
Figure 3. Biphasic concentration–response of AM251 for inducing neuronal differentiation without affecting the total number of cells. (A) In mixed cultures, cells were treated with increasing concentrations of AM251. Cells were fed every other day by replacing 75% of the culture medium. βIII tubulin(+) cells were quantified and expressed as a percentage of the total number of cells counted. Twenty to forty fields were analyzed per coverslip (n) = # coverslips from four separate experiments; mean ± SEM). Concentration–response curve was generated from four separate experiments. *p < 0.05 Between the group and the untreated group at Day 6. Using the bell-shaped curve function in Graph Pad Prism 5, the following equation was used: y = Max + [(α − Max)/(1 + 10^((εup − x)*nH1))] + [(ω − Max)/(1 + 10^((x − εDn)*nH2))], where Max represents the plateau level in the middle of the curve; α and ω represent the plateaus on the left and right sides of the curve, respectively; εup is the logEC50 and εDn is the logIC50, the concentrations that give half maximal stimulatory and inhibitory effects, respectively; and nH1 and nH2 are the Hill slopes. This curve approximates an EC50 of 7.5 nM, and an IC50 of 32 nM. (B). The mean total number of cells from 40 fields were analyzed per coverslip (40× objective); n = # coverslips from five separate experiment; mean + SEM (For each experiment the individual values were normalized to the mean value of the untreated group at Day 6). No significance difference was found between any of the treated groups and the untreated group at Day 6. (C) The percentage and MAP2(+) neurons remains constant, regardless of the concentration of AM251 used; n = 4 coverslips, except for Day 0 in which there were two coverslips. No significance difference was found between any of the treated groups and the untreated group at Day 6. For (A–C) we used One-way ANOVA, Dunnett post test. (D) Representative images of the culture with 30 nM AM251. βIII tubulin(+) immature neurons (red), Nestin(+) neural progenitors (green), and βIII tubulin(+)/Nestin(+) neuronal progenitors (yellow). Images were obtained with a 20× objective; Scale bars, 10 μm. (E) Representative images of the cultures at different concentrations of AM251 are shown. Cytotoxicity is apparent at 10 μM. Images obtained with a 10× objective; scale bars = 10 μm.
AM251 Decreases the Percentage of Nestin(+) Neural Progenitors, While Increasing the Percentage of Immature Neurons
Adult spinal cord extracts contain βIII tubulin (Figure 4A, lane 1). Consistent with the idea that the βIII tubulin population represents newly generated immature neurons is the demonstration that a proportion of them were also capable of incorporating EdU (Figure 4B). We also used Doublecortin (DCX), a marker that has recently been used in the spinal cord to identify newly generated neurons (Shechter et al., 2007, 2010; Marichal et al., 2009) and found that about half of the βIII tubulin(+) cells also co-labeled with DCX in adult rat spinal cord cultures (Figure 4C).
As expected, the βIII tubulin(+) cell population was low on Day 0 (Figures 3A and 4D). The addition of AM251-induced neuronal differentiation, as demonstrated by a significant increase in the percentage of all the cells expressing βIII tubulin from Day 0 to Day 6, (Figures 4D,E). Further characterization of these populations, revealed that AM251 produced an increase in the percentage of the βIII tubulin(+)/Nestin(−) cells and a decrease in the percentage of the βIII tubulin(−)/Nestin(+) population (Figures 4E,G). This effect was mostly abrogated by a mixed CBR agonist, WIN 55, 212-2 (Figures 4D,E,G), and a highly specific CB1R agonist ACEA (Figure 4F).
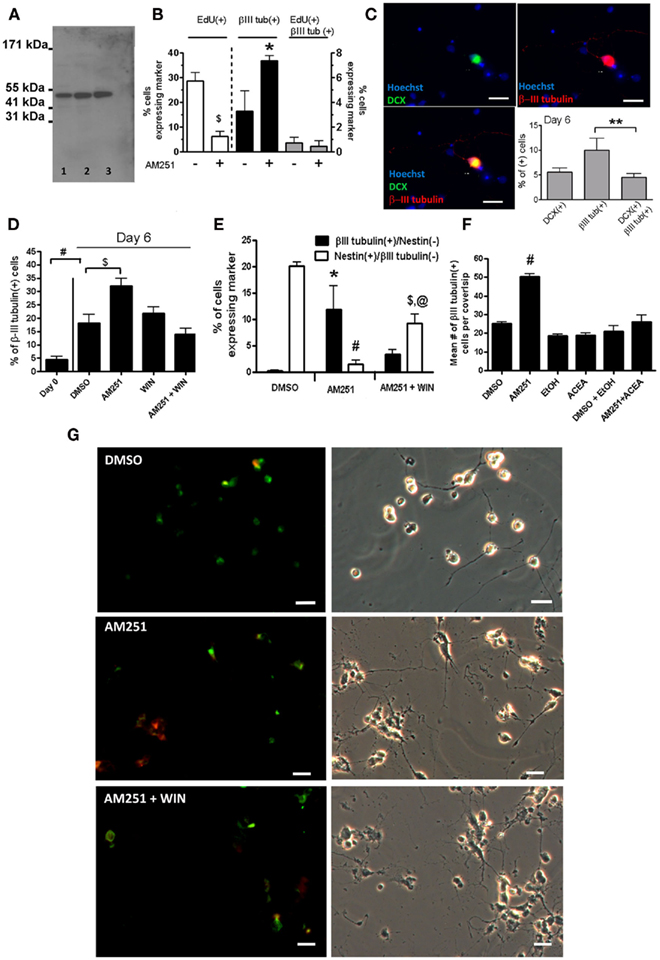
Figure 4. Blocking CB1R enhances the expression of βIII tubulin and decreases the expression of Nestin in adult spinal cord mixed cultures. (A) The western blot shows that the antibody for βIII tubulin that was used in this study, only recognizes one band in the adult spinal cord (lane 1), adult brain (lane 2) and in cultured embryonic hippocampal cells (lane 3) at the molecular weight expected for βIII tubulin (50 kDa). (B) Adult spinal cord cultures were treated with 1 μM of EdU between Days 1 and 2, with or without 100 nM AM251. The cells were fixed on Day 6. The low proportion of βIII tubulin(+)/EdU(+) cells likely reflects the small proportion of cells that are undergoing division between Day 1 and Day 2 ($p < 0.01,*p < 0.05 Unpaired t-test, one tailed). Ten fields were analyzed per coverslip (n = 3 coverslips; mean + SEM). (C) After 6 days in vitro under basal growth conditions, about 50% of the adult spinal cord-derived βIII tubulin immature neurons also express Doublecortin-DCX (green) (n = 3 coverslips; mean + SEM). **p < 0.10, One-way ANOVA, Bonferroni post test. (D,E) Cells were grown in either the presence of vehicle DMSO, 500 nM AM251, or 500 nM AM251 with 500 nM of WIN 55, 212-2. The cultures were fed/treated every other day by replacing 50% of the culture medium. At Day 6, cells were fixed and immunostained with anti-βIII tubulin (black bars), and with a monoclonal Nestin antibody (white bars). Forty randomly chosen fields were analyzed per coverslip (n = 6 coverslips from two separate experiments; except WIN, n = 5; mean + SEM) taken with a 20× objective. (E) The percentage of cells expressing only βIII tubulin and only Nestin at Day 6 (n = 3 coverslips) from one of the experiments used in (D,E). *p < 0.05; #p < 0.001, $p < 0.01 With respect to the control DMSO group at Day 6; and in (E) @p < 0.01 with respect to the AM251 group (one-way ANOVA, Bonferroni post test). (F) In a different experiment, the number of cells expressing βIII tubulin were counted in the entire coverslip treated with either vehicle 0.2% DMSO, Absolute Ethanol, 100 nM AM251, or 10 nM ACEA; n = 3 mean + SEM for all the groups, except for AM251 in which there were 2 coverslips; mean + range. #p < 0.001 With respect to the DMSO group (one-way ANOVA, Dunnett post test). (G) Representative images of cells at Day 6 grown in either the presence of vehicle DMSO, 500 nM AM251, or 500 nM AM251 with 500 nM of WIN 55, 212-2. Stained with anti-βIII tubulin (red), and with a polyclonal Nestin antibody (green). Scale bars = 20 μm.
Global Deletion of CB1R Mimics Pharmacological Inhibition
Cultures from wild type (CB1+/+) and CB1R knock-out (CB1−/−) animals on Day 0 indicated that DCX was expressed in 2.1% (±0.8%) of cells in CB1+/+ cultures versus 26.2% (±5.3%) of cells in CB1−/− cultures, (n = 9 coverslips, n = 3 mice, p < 0.0004; Figures 5A,B left panels). Furthermore, the mean number of DCX(+) cells was significantly different between the genotypes (at Day 0; CB1+/+: 3 ± 2 cells versus CB1−/−: 35 ± 6 cells, p < 0.01). The difference in percentage did not reflect a difference in cell attachment of acutely isolated cells, or on survival within 2 h of plating because the mean number of total cells was comparable between the two genotypes (Figure 5C, left panel).
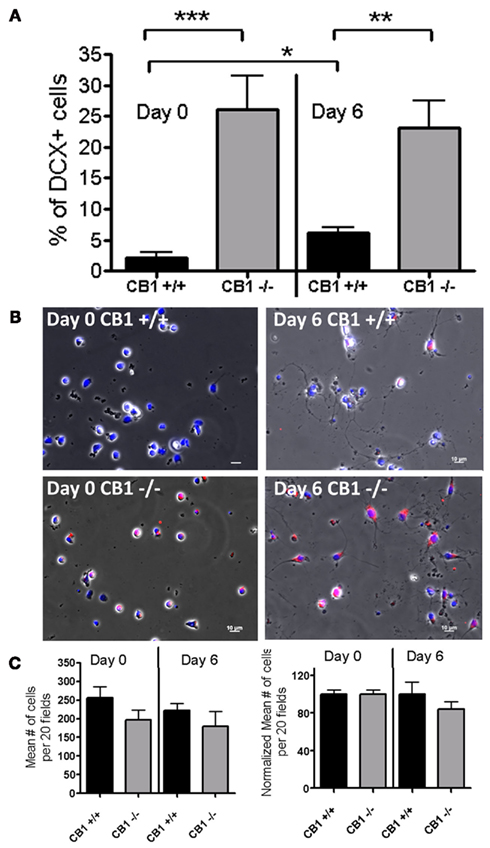
Figure 5. Comparison of percentages of DCX(+) cells at Day 0 and Day 6 between CB1+/+ and CB1−/−spinal cord cultures. (A) Percentage of DCX(+) cells in mixed cultures derived from CB1+/+ (wild type, Black bars) and CB1−/− (CB1R knock-out, Gray bars) animals. Twenty fields per coverslip; n = 9 coverslips from three mice per genotype. Significant differences between CB1+/+ and CB1−/− groups are evident at both time points. Under basal growth conditions, there was a modest increase in the percentage of DCX(+) cells in CB1+/+ cultures from Day 0 to Day 6, whereas in CB1−/− cultures the high percentages of DCX(+) cells remained unchanged during the same period. *p < 0.003, **p < 0.0003, ***p < 0.0004 (Unpaired t-test, two tailed). Twenty fields were analyzed per coverslip (n = 9 coverslips, from three different animals; mean + SEM). (B) Typical morphology of spinal cord cells at Day 0 (left panels), 2 h after plating-small rounded somata, with occasional extensions, and of spinal cord cells at Day 6 (right panels) with growth media. Nuclei (blue); immunostained with anti-DCX (red) and the nuclei stained with Hoechst 3392. At Day 0, a field of CB1+/+ cultures showing no DCX(+) cells (top left panel) while a field in CB1−/− cultures showing many DCX(+) cells (bottom left panel). At Day 6, a field of CB1+/+ cultures showing a few DCX(+) (top right panel) and a field in CB1−/− cultures showing a large number of DCX(+) (bottom left panel). All images are merges of Hoechst/DCX/DIC light picture, and were corrected for background. Images obtained with 20× objective; Scale bars = 10 μm. (C) Average number of total cells per genotype on Day 0 and Day 6 quantified as the mean number of Hoechst+ cells in 20 fields per coverslip; n = 12 and 11 coverslips for Day 0 and Day 6, respectively, from three mice per genotype. Left panel shows the raw data (Mean # of cells per 20 fields). The right panel shows the same data normalized to its mean value at Day 0 (for each experiment). Whether using the raw data or the normalized data, no significant difference was found in the number of cells between Day 0 and Day 6 in either genotype (Unpaired t-test, two tailed).
On Day 6, with basal growth conditions (growth media only), the percentage of cells expressing DCX was, again, higher in the CB1−/− cultures compared to CB1+/+ cultures (23.1 ± 4.3% versus 6.1 ± 0.8% SEM.; n = 9 coverslips for each genotype, n = 3 separate mice; p < 0.0003; Figure 5A right panels). Like in Day 0 cultures, this difference in percentage did not reflect a difference in cell survival over the culturing period because the mean number of cells was comparable between the two genotypes (Figure 5C left panel). Furthermore, the same significant difference in the mean number of DCX cells was observed between genotypes on Day 6 (Day 6 CB1+/+: 7 ± 1 cells versus Day 6 CB1−/−: 27 ± 4 cells). As previously reported (Shechter et al., 2007, 2010; Marichal et al., 2009) the adult spinal cord slices from wild type animals had DCX(+) cells (Figure 6 top). In addition, we found that the medial regions (next to the central canal) of spinal cord slices derived from CB1−/− mice had significantly higher levels of DCX(+) cells compared to those derived from the CB1+/+ mice (Figure 6). Collectively, the data show that neuronal differentiation is not only enhanced by antagonism/inverse agonism, but also as a result of a global deletion of CB1R.
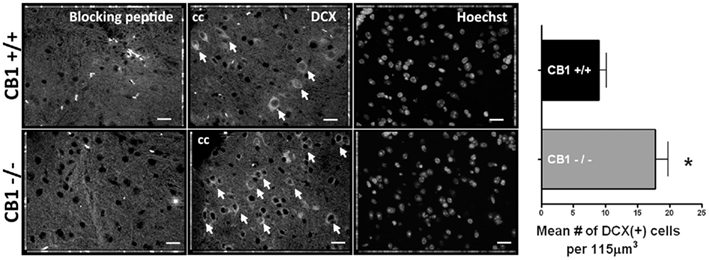
Figure 6. Spinal cords derived from CB1−/− have more DCX(+) cells compared to those derived form CB+/+ animals. Spinal cord sections (6 μm thick) were treated with anti-DCX in the presence (first panels) or absence (middle panels) of the blocking peptide. The third panels show Hoechst nuclear staining for the middle images. Images were acquired in the medial region of the spinal cord (next to the central canal), with a 40× objective by using the Zeiss ApoTome system, and represent three (1 μm thick) compressed consecutive images. Scale bars = 20 μm, cc = central canal. Graph: mean number of DCX(+) cells per 115 μm3; n = 6 measurements (from three slices); and eight measurements (from four slices) of CB1+/+ and CB1−/− mice.
Neuronal Differentiation Induced by AM251 is Reversed by the Voltage-Dependent Sodium Channel Blocker Tetrodotoxin (TTX)
Since there have been many studies characterizing CB1R’s neuromodulatory role, it was hypothesized that our observed effect mediated by AM251 may be due, in part, to the drug’s ability to facilitate neurotransmitter release in the spinal cord cultures, which affects neuronal activity in vitro. If AM251’s facilitation of neurotransmitter release drives neuronal differentiation, then blocking neuronal activity may abrogate AM251’s effect. This hypothesis was tested in wild type cultures treated with AM251, with and without TTX (1 μM), and any increase in the DCX(+) cell number induced by AM251 was expected to be abolished by TTX. Treatment with TTX was started at Day 0, to ensure that neuronal activity would be inhibited throughout the period that the cells were exposed to AM251. On Day 6, AM251 caused a significant increase in the percentage of DCX(+) cells compared to Day 6 DMSO controls (Figure 7A) which did not occur in the presence of TTX (Figure 7A). The percentage changes did not reflect differences in total cell numbers, since they are comparable across treatment groups on Day 6 (Figures 7B,C).
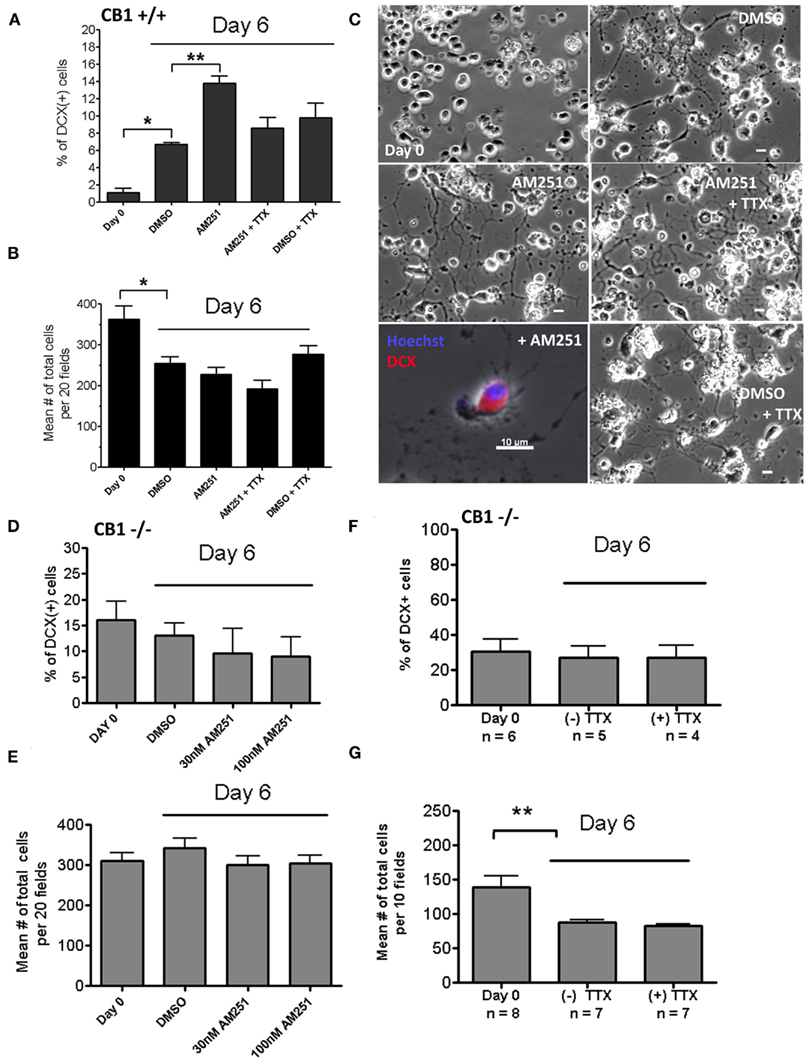
Figure 7. In CB1+/+, but not in CB1−/− cultures, AM251 induces neuronal differentiation which is blocked by the addition TTX. (A) AM251 (30 nM) significantly increased the percentage of DCX(+) cells, which was blocked by co-treatment with TTX (1 μM); *p < 0.05, **p < 0.01 with respect to the control DMSO group at Day 6. (B) The mean number of cells was determined for Day 0 and for every condition on Day 6. In this experiment there was a significant decrease in total number of cells between Day 0 to Day 6 for all treatments (*p < 0.05; but see Figure 5C and text), there were no significant differences between the control DMSO group and any of the treated groups at Day 6. (A,B) Twenty random fields were analyzed per coverslip; n = 3 coverslips; mean + SEM. (C) Images of cultures with different treatments. Chronic TTX (1 μM) does not appear toxic to adult spinal cord cultures. 10× Objective; Scale bars = 10 μm. Bottom left panels shows a DCX(+) cell at a higher magnification (40× objective). (D,E) AM251 does not significantly change the percentage of DCX(+) cells (D) neither the total number of cells (E) in CB1−/− spinal cord cultures. Twenty random fields were analyzed per coverslip; n = 3 coverslips; mean + SEM. (F,G) A total of 10 fields per each coverslip (n) were analyzed. (F) The percentage of DCX(+) cells remains unchanged in the presence of the Na+ channel blocker TTX(1 μM). (G) The total number of cells was not significantly different among treatments. Data generated from three CB1−/− mice. In this experiment there was a significant decrease in the total number of cells between Day 0 to Day 6 (**p < 0.01; but see Figure 5C and text). For (A–G) we used One-way ANOVA, Bonferroni post test.
While AM251 was able to induce an increase in the number of DCX(+) cells in CB1+/+ cultures (Figure 7A), it was not able to do so in CB1−/− cultures (Figure 7D), supporting the specificity of AM251’s effect via modulation of CB1R. Moreover, the high level of DCX(+) cells in CB1−/− cultures was not affected by treatment with TTX (Figure 7F). There was no significant change in the total number of cells on Day 6, with or without treatment (Figure 7G). Though in individual experiments, the total cell number from Day 0 to Day 6 can show either no change or a decrease (e.g., Figures 7B,G but not Figure 7E), the pooled data from three separate experiments showed that there was no significant change in the total cell number from Day 0 to Day 6 in either genotype (Figure 5C). We consistently observed, however, that CB1+/+ cultures have a lower % of DCX(+) cells at Day 0 and at Day 6 than CB1−/− cultures (Figure 5A).
We speculate that since at Day 0, there are very high levels of DCX(+) cells (and are therefore already committed to a neuronal fate), neuronal activity changes induced by administration of TTX in vitro does not affect the differentiation of the progenitor cells.
AM251 does not Induce Neuronal Differentiation in Spinal Cord Cultures Enriched for Progenitor Cells
It is not clear how AM251 exerts its apparent pro-neurogenic effect. CB1R is present on the Nestin(+) progenitor cells, but also on other mature spinal cord cells. It is possible that AM251 modulates the fate of the progenitors by directly antagonizing CB1R on the progenitors, or as an indirect consequence of blocking CB1Rs on mature spinal cord cells. The latter was suggested by the experiments in which blocking neuronal activity with TTX abrogated AM251’s neurogenic effect (Figure 7A). To further investigate the contribution of non-progenitor cells in neuronal differentiation mediated by AM251, we tested the action of AM251 in progenitor-enriched cultures generated with bFGF (as described in Materials and Methods).
Enrichment of adult spinal cord-derived progenitor cells was confirmed by the expression of Nestin, and the incorporation and co-labeling with the proliferation marker EdU. Compared to mixed cultures, enrichment using bFGF raised the percentage of Nestin(+) cells to ~70% (Figure 8A). These progenitors were actively dividing because ~60% of the cells that were Nestin(+) cells also co-labeled with EdU (Figure 8A).
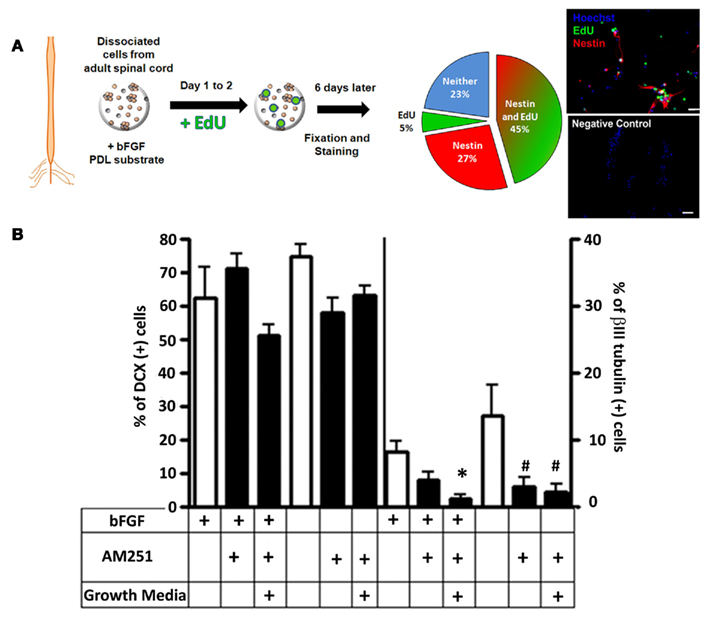
Figure 8. Neuronal differentiation by AM251 in progenitor-enriched cultures. The extent of neuronal differentiation induced by AM251 was tested in progenitor-enriched cultures grown with substrate (attached cells) because this facilitated and expedited the generation, immunostaining, and quantification of the progenitor cells. First, the freshly dissociated cells were grown only in the presence of bFGF (20 ng/ml) in Neurobasal A complete media for 6 days to enrich the culture for progenitors. Following the enrichment period, bFGF was either kept or removed from the media, and the effect of AM251(100 nM) was tested by using either the Neurobasal A complete media or the “growth media” used in the “mixed” cultures (A) bFGF enriches for Nestin(+) and Nestin(+)/EdU(+) adult spinal cord progenitor cells. PDL, poly-D-lysine. Right-top panel: an image depicting cells that incorporated EdU (green), and expressed Nestin (red). Right-bottom panel: negative control, without primary antibody. Hoechst 3392 labeled nuclei (blue). 20× Objective; Scale bars, 20 μm. (B) Relative amounts of DCX (left panel) and βIII tubulin (right panel) expressing cells under the various growth conditions. Table below graph indicates with a small “+” whether a certain drug or growth treatment was present. *p < 0.05; #p < 0.01 With respect to their corresponding control group (one-way ANOVA, Bonferroni post test).
Under control conditions (either ±bFGF, but no drugs), the progenitor-enriched cultures contained ~60–80% DCX(+) cells (Figure 8B, left panel, open bars). The levels of βIII tubulin(+) cells were lower (Figure 8B, right panel, open bars), but comparable to those in mixed cultures, indicating that bFGF itself enriches for DCX(+) neuronal progenitor cells. Addition of AM251 and/or growth media (see Materials and Methods) did not significantly change the DCX levels (Figure 8B, left panel, black bars), but decreased the amount of cells expressing βIII tubulin (Figure 8B, right panel, black bars). Taken together, the addition of AM251 did not induce neuronal differentiation under proliferative or non-proliferative conditions (±bFGF, respectively) in progenitor-enriched cultures. The results obtained here indicate that concentrations of AM251 that were able to promote neuronal differentiation in mixed spinal cord cultures, were not able to do so in progenitor-enriched cultures.
Discussion
Using the highly specific CB1R antagonist AM251 in mixed spinal cord cultures containing neurons, glia, and neural progenitors, a significant increase in the number and percentage of immature neurons was observed in a concentration-dependent and biphasic manner. The neurogenic response elicited by AM251 was blocked by the presence of the CB1R agonists WIN 55, 212-2, or ACEA, and also of TTX. This neurogenic action of AM251 was not observed in progenitor-enriched cultures, even when AM251 was used in the presence of the growth medium used in the mixed cultures. Both in spinal cord slices and in acutely isolated mixed cultures, those derived from CB1R knock-out (CB1−/−) mice consistently showed a higher number of cells expressing immature neuronal markers compared to wild type (CB1+/+). This result is indicative of a higher baseline of constitutive neurogenesis in the spinal cords of CB1−/− mice. Moreover, AM251 did not further increase the number and percentage of immature neurons in CB1−/− cultures, demonstrating the specificity of AM251 for the CB1R in our observed effect. Therefore, the data from two different rodent species, using both pharmacology and genetic techniques suggest that antagonism or absence of CB1R results in enhanced neuronal differentiation in the adult spinal cord.
The possibility of neuronal activity as a player in neuronal differentiation induced by AM251 was investigated by using TTX. The rationale for these experiments was based on the known inhibitory effects of CB1Rs at pre-synaptic sites of the CNS by reducing the probability of neurotransmitter release (Schlicker and Kathmann, 2001). Therefore, binding of AM251 to CB1Rs on pre-synaptic sites, or the absence of CB1R (using CB1−/− mice) could facilitate neurotransmitter release, and therefore modulate neuronal activity. The proposed change in overall neuronal activity by AM251 may ultimately enhance neuronal differentiation in the mixed spinal cord cultures. To test the idea that sodium channel (Nav)-dependent neuronal activity is necessary for AM251’s effect in the mixed cultures, we chronically blocked this activity by using TTX from Day 0 of culture. Because TTX was able to mostly block the effect of AM251, it is likely that Nav-dependent neuronal activity is necessary for the neurogenic action of AM251 in the mixed spinal cord cultures. The idea that neuronal activity and neurotransmitters drive progenitor differentiation is not new. Local circuitry drives activity dependent neuronal differentiation – reviewed by Vaidya et al. (2007). For example, type 2 progenitor cells in the hippocampus [Nestin(+)/GFAP(−)] are depolarized by GABA [because of the high (Cl−) inside the progenitors], and this drives the progenitors to differentiate into neurons (Tozuka et al., 2005). These results support the view that the neurogenic action of AM251 may involve enhancement of spinal cord neuronal activity.
To our knowledge, this is the first study to address and demonstrate modulation of adult spinal cord progenitor cell fate by the endocannabinoid system (eCB). Previously, many studies have addressed the role of the eCB system during development and adult neurogenesis in the brain. Using rodent models, components of the endocannabinoid system were discovered in embryonic (Rueda et al., 2002; Aguado et al., 2005), postnatal, and adult (Aguado et al., 2006; Molina-Holgado et al., 2007) brain neural progenitor cells. Interestingly, it appears that CB1R activation promotes neural progenitor proliferation in the brain, but the role in neurogenesis is less clear. The confusion mostly results because the separation between the effects on progenitor proliferation and neurogenesis has not always been made. The presence of actively dividing cells within a neurogenic niche does not necessitate neurogenesis because not all the proliferating cells become neurons (Jin et al., 2003; Merkle et al., 2004; Steiner et al., 2004). The study of Jin et al. (2004) suggested that there was defective neurogenesis in CB1−/− mice compared to CB1+/+ mice, but the authors equated decreased BrdU (5-Bromo-2-deoxyurdine) incorporation with decreased neurogenesis without quantifying co-expression with neuronal markers. In another study, CB1R activation was concluded to promote neurogenesis because of increased hippocampal proliferation, even when there was no net change in the amount of new neurons (Jiang et al., 2005). However, using NeuN as a neuronal marker and BrdU as a proliferation marker, several other studies have demonstrated that treatment with CB1R agonists decreased the number of these co-labeled hippocampal cells, but increased the number of BrdU(+)/NeuN(−) hippocampal cells (Rueda et al., 2002; Aguado et al., 2006; Galve-Roperh et al., 2006) indicative of increased proliferation without subsequent differentiation toward a neuronal fate.
Moreover, the numerous eCB system components may affect the various adult brain progenitor populations differently. In vivo, CB1Rs and Fatty Acid Amide Hydrolase, the anandamide degrading enzyme, are highly expressed in type 1, but not in type 2, hippocampal progenitors (Aguado et al., 2006). Another recent study demonstrated the exact opposite staining pattern; CB1R was preferentially expressed in type 2/DCX(+) cells, suggesting that the receptor may have a role in neuronal differentiation and migration of the newly formed neuron (Wolf et al., 2010). Though clarification through additional studies must be made to reconcile different interpretations and/or results, these findings suggest that there is also a need to consider the separate progenitor populations to understand how CB1R modulates them in the context of adult brain neurogenesis.
Cannabinoid 1 receptor may also modulate neurogenesis differently under various patho-physiological contexts (Aguado et al., 2007; Rivera et al., 2011). For example, simultaneous changes in growth factors obscure the actual neurogenic action of cannabinoids. Kainate induced excitotoxicity in vivo lead to an increase in the number of BrdU(+)/NeuN(+) cells which were reduced in CB1−/− mice, but this treatment also results in an increase in the expression of various growth factors (bFGF, BDNF, and EGF) both in CB1+/+ and in CB1−/− mice (Aguado et al., 2007). As indicated by the authors, CB1R’s role on neurogenesis appears to be sometimes difficult to separate from that mediated by growth factors. Also, AM251 is able to promote neurogenesis in the Sub-Ventricular Zone of obese, but not normal rats (Rivera et al., 2010).
Compared to the adult brain, the adult spinal cord progenitor niche is not as well defined. There are progenitor cells scattered throughout the spinal cord parenchyma and in the central canal (Johansson et al., 1999; Ohori et al., 2006; Meletis et al., 2008; Hamilton et al., 2009). The endocannabinoid system has not been as extensively studied in the spinal cord as it has in the brain. Only recently have studies demonstrated the presence and critical roles of the endocannabinoid system in the spinal cord for the execution of movement and for somatosensory information processing (Marsicano et al., 2003; Kettunen et al., 2005; Galve-Roperh et al., 2008; Garcia-Ovejero et al., 2009). Following injury, neurogenesis in the adult spinal cord remains a challenge mostly because the spinal cord environment favors glial differentiation (Barnabe-Heider et al., 2010; Wang et al., 2011). There is some evidence for neurogenesis [presence of DCX(+)/BrdU(+) cells] in the intact adult spinal cord, with a preferential dorsal gray matter distribution and GABAergic phenotype; however, the role of these immature neurons, and their long term fate are not well understood (Shechter et al., 2007, 2010). We found that the spinal cord slices derived from CB1−/− mice have a significantly higher levels of DCX(+) cells compared to those derived from the CB1+/+ mice, indicative of enhanced neuronal differentiation in CB1−/− spinal cords.
Our study has interesting implications for spinal cord injury because of the potential pharmacotherapeutic interventions with CB1R antagonists for the replacement of damaged neurons. Our data also suggest that the elevated levels of endocannabinoids that have been previously detected in the adult spinal cord following injury (Petrosino et al., 2007; Garcia-Ovejero et al., 2009) could contribute to the non-neurogenic environment. Moreover, the high levels of DCX (+) cells in the spinal cords of CB1−/− mice are intriguing. Additional studies are needed to elucidate the overall distribution and properties of these cells in vivo as they may be contributing to the hypoalgesic or hypoactive phenotypes of the knock-out mice (Zimmer et al., 1999).
Taken together, the results demonstrate, for the first time, that CB1R is present on adult spinal cord-derived Nestin(+) progenitor cells when they are grown under enriching conditions, or when they are grown in the presence of other spinal cord cells. Treatment of spinal cord cultures with AM251 induces neuronal differentiation in a CB1R specific manner. Neuronal activity is partly necessary for AM251’s effect, as TTX abrogates the effect on neuronal differentiation suggestive of neurotransmitter involvement. Interestingly, this work is also the first demonstration of high levels of immature neurons in the adult spinal cords from CB1R knock-out (CB1−/−) mice compared to wild type both in vivo and in vitro, in accordance with the idea that the presence of CB1R and its activation with exogenous or endogenous ligands inhibit the expression of immature neuronal markers. Future experiments will characterize the distribution and properties of the immature neurons in the CB1−/− spinal cords, and whether CB1R antagonists can promote neurogenesis in vivo in normal and injured spinal cords.
Conflict of Interest Statement
The authors declare that the research was conducted in the absence of any commercial or financial relationships that could be construed as a potential conflict of interest.
Acknowledgments
Special thanks to Dr. Andreas Zimmer, Universität zu Bonn, Germany for providing the CB1 transgenic mice, to Dr. Rui Costa from the Instituto Gulbenkian de Ciencia, Portugal for the genotyping protocol, Dr. Zsuzsanna Sidló for her suggestions regarding cannabinoid receptor drugs, to Dr. Margaret Rice, Dr. Helen Scharfman, and Dr. Elaine Wilson for helpful suggestions regarding experiments, to Dr. Monica Norcini, Dr. Jhon-Jairo Sutachan, Dr. Jin Zhang, and Dr. Fang Xu for technical assistance, and to the Anesthesiology Department at NYU Langone Medical Center for their support. We would like to thank personnel in the NYULMC Experimental Pathology Shared Resource -Histopathology, (which is partially supported by the NYU Cancer Institute Center Support Grant 5P30CA0016087) for cutting the spinal cord sections.
References
Aguado, T., Monory, K., Palazuelos, J., Stella, N., Cravatt, B., Lutz, B., Marsicano, G., Kokaia, Z., Guzmán, M., and Galve-Roperh, I. (2005). The endocannabinoid system drives neural progenitor proliferation. Faseb J. 19, 1704–1706.
Aguado, T., Palazuelos, J., Monory, K., Stella, N., Cravatt, B, Lutz, B., Marsicano, G., Kokaia, Z., Guzmán, M., and Galve-Roperh, I. (2006). The endocannabinoid system promotes astroglial differentiation by acting on neural progenitor cells. J. Neurosci. 26, 1551–1561.
Aguado, T., Romero, E., Monory, K., Palazuelos, J., Sendtner, M., Marsicano, G., Lutz, B., Guzmán, M., and Galve-Roperh, I. (2007). The CB1 cannabinoid receptor mediates excitotoxicity-induced neural progenitor proliferation and neurogenesis. J. Biol. Chem. 282, 23892–23898.
Barnabe-Heider, F., Goritz, C., Sabelström, H., Takebayashi, H., Pfrieger, F. W., Meletis, K., and Frisén, J. (2010). Origin of new glial cells in intact and injured adult spinal cord. Cell Stem Cell 7, 470–482.
Costa, B., Trovato, A. E., Colleoni, M., Giagnoni, G., Zarini, E., and Croci, T. (2005). Effect of the cannabinoid CB1 receptor antagonist, SR141716, on nociceptive response and nerve demyelination in rodents with chronic constriction injury of the sciatic nerve. Pain 116, 52–61.
El Manira, A., and Kyriakatos, A. (2010). The role of endocannabinoid signaling in motor control. Physiology (Bethesda) 25, 230–238.
Galve-Roperh, I., Aguado, T., Palazuelos, J., and Guzmán, M. (2007). The endocannabinoid system and neurogenesis in health and disease. Neuroscientist 13, 109–114.
Galve-Roperh, I., Aguado, T., Palazuelos, J, and Guzmán, M. (2008). Mechanisms of control of neuron survival by the endocannabinoid system. Curr. Pharm. Des. 14, 2279–2288.
Galve-Roperh, I., Aguado, T., Rueda, D., Velasco, G., and Guzmán, M. (2006). Endocannabinoids: a new family of lipid mediators involved in the regulation of neural cell development. Curr. Pharm. Des. 12, 2319–2325.
Garcia-Ovejero, D., Arevalo-Martin, A., Petrosino, S., Docagne, F., Hagen, C., Bisogno, T., Watanabe, M., Guaza, C., Di Marzo, V., and Molina-Holgado, E. (2009). The endocannabinoid system is modulated in response to spinal cord injury in rats. Neurobiol. Dis. 33, 57–71.
Gritti, A., Parati, E. A., Cova, L., Frolichsthal, P., Galli, R., Wanke, E., Faravelli, L., Morassutti, D. J., Roisen, F., Nickel, D. D., and Vescovi, A. L. (1996). Multipotential stem cells from the adult mouse brain proliferate and self-renew in response to basic fibroblast growth factor. J. Neurosci. 16, 1091–1100.
Hamilton, L. K., Truong, M. K., Bednarczyk, M. R., Aumont, A., and Fernandes, K. J. (2009). Cellular organization of the central canal ependymal zone, a niche of latent neural stem cells in the adult mammalian spinal cord. Neuroscience 164, 1044–1056.
Hilario, M. R., Clouse, E., Yin, H. H., and Costa, R. M. (2007). Endocannabinoid signaling is critical for habit formation. Front. Integr. Neurosci. 1:6. doi:10.3389/neuro.07.006.2007
Hill, M. N., Kambo, J. S., Sun, J. C., Gorzalka, B. B., and Galea, L. A. (2006). Endocannabinoids modulate stress-induced suppression of hippocampal cell proliferation and activation of defensive behaviours. Eur. J. Neurosci. 24, 1845–1849.
Hockfield, S., and McKay, R. D. (1985). Identification of major cell classes in the developing mammalian nervous system. J. Neurosci. 5, 3310–3328.
Horky, L. L., Galimi, F., Gage, F. H., and Horner, P. J. (2006). Fate of endogenous stem/progenitor cells following spinal cord injury. J. Comp. Neurol. 498, 525–538.
Horner, P. J., Power, A. E., Kempermann, G., Kuhn, H. G., Palmer, T. D., Winkler, J., Thal, L. J., and Gage, F. H. (2000). Proliferation and differentiation of progenitor cells throughout the intact adult rat spinal cord. J. Neurosci. 20, 2218–2228.
Jiang, W., Zhang, Y., Xiao, L., Van Cleemput, J., Ji, S. P., Bai, G., and Zhang, X. (2005). Cannabinoids promote embryonic and adult hippocampus neurogenesis and produce anxiolytic- and antidepressant-like effects. J. Clin. Invest. 115, 3104–3116.
Jin, K., Xie, L., Childs, J., Sun, Y., Mao, X. O., Logvinova, A., and Greenberg, D. A. (2003). Cerebral neurogenesis is induced by intranasal administration of growth factors. Ann. Neurol. 53, 405–409.
Jin, K., Xie, L., Kim, S. H., Parmentier-Batteur, S., Sun, Y., Mao, X. O., Childs, J., and Greenberg, D. A. (2004). Defective adult neurogenesis in CB1 cannabinoid receptor knockout mice. Mol. Pharmacol. 66, 204–208.
Johansson, C. B., Momma, S., Clarke, D. L., Risling, M., Lendahl, U., and Frisén, J. (1999). Identification of a neural stem cell in the adult mammalian central nervous system. Cell 96, 25–34.
Kehl, L. J., Fairbanks, C. A., Laughlin, T. M., and Wilcox, G. L. (1997). Neurogenesis in postnatal rat spinal cord: a study in primary culture. Science 276, 586–589.
Kettunen, P., Kyriakatos, A., Hallén, K., and El Manira, A. (2005). Neuromodulation via conditional release of endocannabinoids in the spinal locomotor network. Neuron 45, 95–104.
Lee, M. K., Tuttle, J. B., Rebhun, L. I., Cleveland, D. W., and Frankfurter, A. (1990). The expression and posttranslational modification of a neuron-specific beta-tubulin isotype during chick embryogenesis. Cell Motil. Cytoskeleton 17, 118–132.
Marichal, N., Garcia, G., Radmilovich, M., Trujillo-Cenóz, O., and Russo, R. E. (2009). Enigmatic central canal contacting cells: immature neurons in “standby mode”? J. Neurosci. 29, 10010–10024.
Marsicano, G., Goodenough, S., Monory, K., Hermann, H., Eder, M., Cannich, A., Azad, S. C., Cascio, M. G., Gutiérrez, S. O., van der Stelt, M., López-Rodriguez, M. L., Casanova, E., Schütz, G., Zieglgänsberger, W., Di Marzo, V., Behl, C., and Lutz, B. (2003). CB1 cannabinoid receptors and on-demand defense against excitotoxicity. Science 302, 84–88.
Meletis, K., Barnabe-Heider, F., Carlén, M., Evergren, E., Tomilin, N., Shupliakov, O., and Frisén, J. (2008). Spinal cord injury reveals multilineage differentiation of ependymal cells. PLoS Biol. 6, e182. doi:10.1371/journal.pbio.0060182
Merkle, F. T., Tramontin, A. D., García-Verdugo, J. M., and Alvarez-Buylla, A. (2004). Radial glia give rise to adult neural stem cells in the subventricular zone. Proc. Natl. Acad. Sci. U.S.A. 101, 17528–17532.
Molina-Holgado, F., Rubio-Araiz, A., García-Ovejero, D., Williams, R. J., Moore, J. D., Arévalo-Martín, A., Gómez-Torres, O., and Molina-Holgado, E. (2007). CB2 cannabinoid receptors promote mouse neural stem cell proliferation. Eur. J. Neurosci. 25, 629–634.
Montoya, G. J., Sutachan, J. J., Chan, W. S., Sideris, A., Blanck, T. J., and Recio-Pinto, E. (2009). Muscle-conditioned media and cAMP promote survival and neurite outgrowth of adult spinal cord motor neurons. Exp. Neurol. 220, 303–315.
Ohori, Y., Yamamoto, S., Nagao, M., Sugimori, M., Yamamoto, N., Nakamura, K., and Nakafuku, M. (2006). Growth factor treatment and genetic manipulation stimulate neurogenesis and oligodendrogenesis by endogenous neural progenitors in the injured adult spinal cord. J. Neurosci. 26, 11948–11960.
Pernia-Andrade, A. J., Kato, A., Witschi, R., Nyilas, R., Katona, I., Freund, T. F., Watanabe, M., Filitz, J., Koppert, W., Schüttler, J., Ji, G., Neugebauer, V., Marsicano, G., Lutz, B., Vanegas, H., and Zeilhofer, H. U. (2009). Spinal endocannabinoids and CB1 receptors mediate C-fiber-induced heterosynaptic pain sensitization. Science 325, 760–764.
Petrosino, S., Palazzo, E., de Novellis, V., Bisogno, T., Rossi, F., Maione, S., and Di Marzo, V. (2007). Changes in spinal and supraspinal endocannabinoid levels in neuropathic rats. Neuropharmacology 52, 415–422.
Rivera, F. J., Steffenhagen, C., Kremer, D., Kandasamy, M., Sandner, B., Couillard-Despres, S., Weidner, N., Küry, P., and Aigner, L. (2010). Deciphering the oligodendrogenic program of neural progenitors: cell intrinsic and extrinsic regulators. Stem Cells Dev. 19, 595–606.
Rivera, P., Romero-Zerbo, Y., Pavón, F. J., Serrano, A., López-Ávalos, M. D., Cifuentes, M., Grondona, J. M., Bermúdez-Silva, F. J., Fernández-Llebrez, P., de Fonseca, F. R., Suárez, J., and Pérez-Martín, M. (2011). Obesity-dependent cannabinoid modulation of proliferation in adult neurogenic regions. Eur. J. Neurosci. 33, 1577–1586.
Rueda, D., Navarro, B., Martinez-Serrano, A., Guzman, M., and Galve-Roperh, I. (2002). The endocannabinoid anandamide inhibits neuronal progenitor cell differentiation through attenuation of the Rap1/B-Raf/ERK pathway. J. Biol. Chem. 277, 46645–46650.
Schlicker, E., and Kathmann, M. (2001). Modulation of transmitter release via presynaptic cannabinoid receptors. Trends Pharmacol. Sci. 22, 565–572.
Shechter, R., Baruch, K., Schwartz, M., and Rolls, A. (2010). Touch gives new life: mechanosensation modulates spinal cord adult neurogenesis. Mol. Psychiatry 16, 342–352.
Shechter, R., Ziv, Y., and Schwartz, M. (2007). New GABAergic interneurons supported by myelin-specific T cells are formed in intact adult spinal cord. Stem Cells 25, 2277–2282.
Shihabuddin, L. S. (2008). Adult rodent spinal cord-derived neural stem cells: isolation and characterization. Methods Mol. Biol. 438, 55–66.
Shihabuddin, L. S., Horner, P. J., Ray, J., and Gage, F. H. (2000). Adult spinal cord stem cells generate neurons after transplantation in the adult dentate gyrus. J. Neurosci. 20, 8727–8735.
Shihabuddin, L. S., Ray, J., and Gage, F. H. (1997). FGF-2 is sufficient to isolate progenitors found in the adult mammalian spinal cord. Exp. Neurol. 148, 577–586.
Steiner, B., Kronenberg, G., Jessberger, S., Brandt, M. D., Reuter, K., and Kempermann, G. (2004). Differential regulation of gliogenesis in the context of adult hippocampal neurogenesis in mice. Glia 46, 41–52.
Tozuka, Y., Fukuda, S., Namba, T., Seki, T., and Hisatsune, T. (2005). GABAergic excitation promotes neuronal differentiation in adult hippocampal progenitor cells. Neuron 47, 803–815.
Vaidya, V. A., Vadodaria, K. C., and Jha, S. (2007). Neurotransmitter regulation of adult neurogenesis: putative therapeutic targets. CNS Neurol. Disord. Drug Targets 6, 358–374.
Wang, Y., Cheng, X., He, Q., Zheng, Y., Kim, D. H., Whittemore, S. R., and Cao, Q. L. (2011). Astrocytes from the contused spinal cord inhibit oligodendrocyte differentiation of adult oligodendrocyte precursor cells by increasing the expression of bone morphogenetic proteins. J. Neurosci. 31, 6053–6058.
Weiss, S., Dunne, C., Hewson, J., Wohl, C., Wheatley, M., Peterson, A. C., and Reynolds, B. A. (1996). Multipotent CNS stem cells are present in the adult mammalian spinal cord and ventricular neuroaxis. J. Neurosci. 16, 7599–7609.
Wilson, R. I., and Nicoll, R. A. (2002). Endocannabinoid signaling in the brain. Science 296, 678–682.
Wolf, S. A., Bick-Sander, A., Fabel, K., Leal-Galicia, P., Tauber, S., Ramirez-Rodriguez, G., Müller, A., Melnik, A., Waltinger, T. P., Ullrich, O., and Kempermann, G. (2010). Cannabinoid receptor CB1 mediates baseline and activity-induced survival of new neurons in adult hippocampal neurogenesis. Cell Commun. Signal 8, 12.
Keywords: CB1R, adult spinal cord cultures, neuronal differentiation
Citation: Sideris A, Bekker T, Chan WS, Montoya-Gacharna JV, Blanck TJJ and Recio-Pinto E (2012) A role for the cannabinoid 1 receptor in neuronal differentiation of adult spinal cord progenitors in vitro is revealed through pharmacological inhibition and genetic deletion. Front. Neurosci. 6:4. doi: 10.3389/fnins.2012.00004
Received: 15 November 2011;
Accepted: 08 January 2012;
Published online: 24 January 2012.
Edited by:
Steven L. Roberds, Tuberous Sclerosis Alliance, USAReviewed by:
Li Zhang, NIAA-NIH, USAJason B. Wu, Cedars-Sinai Medical Center, USA
Riikka Äänismaa, University of Tampere, Finland
Copyright: © 2012 Sideris, Bekker, Chan, Montoya-Gacharna, Blanck and Recio-Pinto. This is an open-access article distributed under the terms of the Creative Commons Attribution Non Commercial License, which permits non-commercial use, distribution, and reproduction in other forums, provided the original authors and source are credited.
*Correspondence: Esperanza Recio-Pinto, New York University Langone Medical Center, 550 1st Avenue, Tisch Hospital, HE-438, New York, NY 10016, USA. e-mail:ZXNwZXJhbnphLnJlY2lvLXBpbnRvQG55dW1jLm9yZw==