


- School of Psychology and Psychiatry, Monash University, Melbourne, VIC, Australia
The Iowa Gambling Task (IGT) is in many respects the gold standard for demonstrating decision making in drug using groups. However, it is not clear how basic task properties such as the frequency and magnitude of rewards and losses affect choice behavior in drug users and even in healthy players. In this study, we used a variant of the IGT, the Soochow Gambling Task (SGT), to observe choice behavior in opiate users and healthy decision makers in a task where reward frequency is not confounded with the long-term outcome of each alternative. In both opiate users (n = 26) and healthy controls (n = 27), we show that reward frequency strongly influences choice behavior in the IGT and SGT. Neither group showed a consistent preference across tasks for alternatives with good long-term outcomes, but rather, subjects appeared to prefer alternatives that win most frequently. We interpret this as evidence to suggest that healthy players perform better than opiate users on the IGT because they are able to utilize gain–loss frequencies to guide their choice behavior on the task. This challenges the previous notion that poorer performance on the IGT in drug users is due to an inability to be guided by future consequences.
Introduction
Illicit drug use is a “risky” activity associated with negative consequences such as family and work disruption, overdose, addiction, and accidents from intoxication. Given such risks, an important question is why some people engage in this behavior. This question has prompted research into the thought processes underlying decisions under risk in drug users. Many findings indicate that drug users, when viewed as a group, are more sensitive to a range of rewarding stimuli and also less sensitive to loss (Rogers and Robbins, 2001; Bechara, 2005). In addition, drug users appear to have difficulty learning from past negative experiences to make more beneficial decisions in the future (Grant et al., 2000; Ersche et al., 2005; Brand et al., 2008). Of course, decisions involving risk are highly variable, and the type, value, and likelihood of rewards and losses can all influence choice. Thus, to understand why drug users take more risks, it is necessary to describe how factors related to learning, reward, and loss influence choice behavior. To this end, laboratory decision tasks allow a level of control not possible in the “real world,” and several tasks are now widely used to study decisions under risk in drug users (CGT: Rogers et al., 1999; IGT: Bechara and Damasio, 2002; BART: Lejuez et al., 2002).
The Iowa Gambling Task (IGT; Bechara et al., 1997) is arguably the most popular decision task used in studies of clinical samples. Players choose from four “decks of cards” over a series of trials, with each selection resulting in a monetary reward and occasionally a monetary loss. A key feature of this task is that unbeknownst to the player, the decks vary in their win/loss frequencies and final outcomes. Players must make selections, experience the outcomes, and then develop their preferences through this experience. For a player to finish the IGT with a positive balance, the player must overcome an initial preference for decks that have large gains but large losses (with overall net losses), and switch their preference to decks that have relatively small rewards but less severe losses, ending with an overall net gain.
A typical finding in the IGT literature is that both drug users and healthy non-users prefer decks with net losses in the beginning stages of the task, but only healthy non-users shift their preference to the decks with the net gains as the task progresses (Bechara and Damasio, 2002; Stout et al., 2004, 2005). This finding suggests that drug users (unlike non-users) fail to learn from experience that the decks with large gains actually yield even larger losses, resulting in the negative expected value of the losing IGT decks. Instead, they continue to show a preference for losing decks either because they over-attend to the frequent large gains and under-attend to large losses, or because they are not attracted to the decks in which gains (and losses) are both smaller (Grant et al., 2000; Ersche et al., 2005).
To date, the most common method for analyzing IGT performance is by combining selections from decks with negative expected value (decks A and B) and decks with positive expected value (decks C and D; Bechara et al., 1994; Grant et al., 2000). However, pairing decks in this way obscures the influence of win frequency on IGT performance, because decks within each pairing differ in terms of win frequency. This issue was first described by (Chiu et al., 2008). In studies where IGT decks have been analyzed individually, drug users and non-users show a clear preference for decks with high frequency wins (Verdejo-Garcia et al., 2007). Drug users perform poorly because they prefer the high frequency win deck with higher risk (Deck B). Non-users start the task preferring this same deck, but as the task progresses, they typically shift their preference to the other high frequency win deck, which has relatively lower wins on every selection but also lower magnitude losses. So, although drug users and controls appear to prefer frequent win decks in the IGT, it is difficult to gage the strength of this factor’s influence on decision making in each group because players have the option to switch from a high frequency win deck with negative expected value to a high frequency win deck with positive expected value. Would healthy decision makers develop a preference for decks with positive expected value in the IGT if a high frequency win alternative was not available?
To clarify the relative importance of expected value and win frequency on healthy decision makers’ choices, Chiu et al. (2008) designed the Soochow Gambling Task (SGT). The key difference between the SGT and IGT is that both SGT decks with positive expected values have lower frequency wins than decks with negative expected values. Thus, in the SGT there is a negative correlation between expected value and win frequency which enables studying the relative influence of each factor on performance of the task. The selection patterns observed by Chiu et al. (2008) show that healthy players had no preference for decks with positive expected value, but rather, they preferred decks with high frequency wins despite those decks having negative expected value. In the SGT at least, healthy decision makers make what would be considered poor decisions overall, and win frequency appears to be a stronger influence than expected value. Applying the same interpretation to these findings as has been applied numerous times to the IGT; healthy decision makers appear insensitive to future consequences (Ahn et al., 2008; Chiu et al., 2008).
Why do healthy decision makers prefer high frequency win decks in the IGT and SGT? Research comparing descriptive and experienced based choices may provide some clues. In contrast to descriptive choices, where decision makers tend to overvalue low probability outcomes, decision makers tend to undervalue low probability outcomes when their decisions are based on feedback from past outcomes (Barron and Leider, 2009; Barron and Leider, 2009). That is, for experienced based choices, decision makers tend to prefer alternatives with a higher chance of being rewarded, even when the magnitude of the reward is smaller (Barron and Erev, 2003; see Rakow and Newell, 2010 for review). This may explain the pattern observed in the IGT and SGT, where both drug users and controls appear to prefer decks with the highest probability of winning (i.e., high frequency win decks). In the IGT, one high frequency win deck, Deck B, has negative expected value and the other, Deck D, has positive expected value. In the SGT, both high frequency win decks have negative expected value, which may explain why healthy players fail to develop a preference for decks with positive expected value as the task progresses.
Thus, the SGT can help to clarify the relative importance of factors such as expected value, win frequency and wins/loss magnitude on drug users’ choices. And, given the difficulty of disentangling the influence of expected value, win frequency and sensitivity to risk in the IGT, a study that includes both the IGT and SGT will improve the accuracy in interpreting differences between drug users and non-users and broaden the available data upon which to base interpretations of decision characteristics in drug users. To maximize the possibility of seeing differences between drug users and controls in these two tasks, we examined opiate users in outpatient treatment rather than a group of milder drug users from the community. In both the IGT and SGT, we expected drug users to prefer high frequency win decks with high magnitude wins and losses, yielding overall losses in the IGT and in the SGT.
Material and Methods
Subjects
We recruited 26 drug users (M = 34.23 years, SD = 8.79; male, 21) from Turning Point Alcohol and Drug Centre, a community outpatient service in inner Melbourne. These participants were either currently using illicit opiates (e.g., heroin) and/or taking prescribed opiate substitution medication (methadone, buprenorphine). Participants were asked to abstain from illicit drugs and alcohol for 12 h prior to the testing session (excluding opiate substitution medication). If participants reported using alcohol or drugs less than 12 h before the test session, or had a blood alcohol level reading above 0.05 mg/kg on arrival, their test session was postponed for at least 1 day. Test sessions were postponed for at least 2 days if participants arrived in a visibly intoxicated state or if they were experiencing acute withdrawal symptoms. We also recruited 27 control participants (M = 35 years, SD = 10.44; male, 22) using fliers and newspaper advertisements. Control participants had not used illicit drugs in the previous 6 months, had no history drug or alcohol problems, and had a blood alcohol level <0.05 mg/kg confirmed on arrival to the test session. Screening questions were used to ensure that participants from both groups had no history of psychosis. All participants provided written informed consent, and the Monash University Human Ethics Committee approved all study procedures.
Groups were matched on age, t(51) = 0.29, p = 0.77 and gender, χ2(1, N = 53) < 0.01, p = 0.95 (see Table 1), but drug users had lower education, t(51) = 2.83, p < 0.01, higher unemployment, χ2(1, N = 53) 16.89, p < 0.001 and reported more incidences of head injury requiring hospitalization compared to non-users, χ2(1, N = 53) 9.73, p < 0.01 (Table 1).
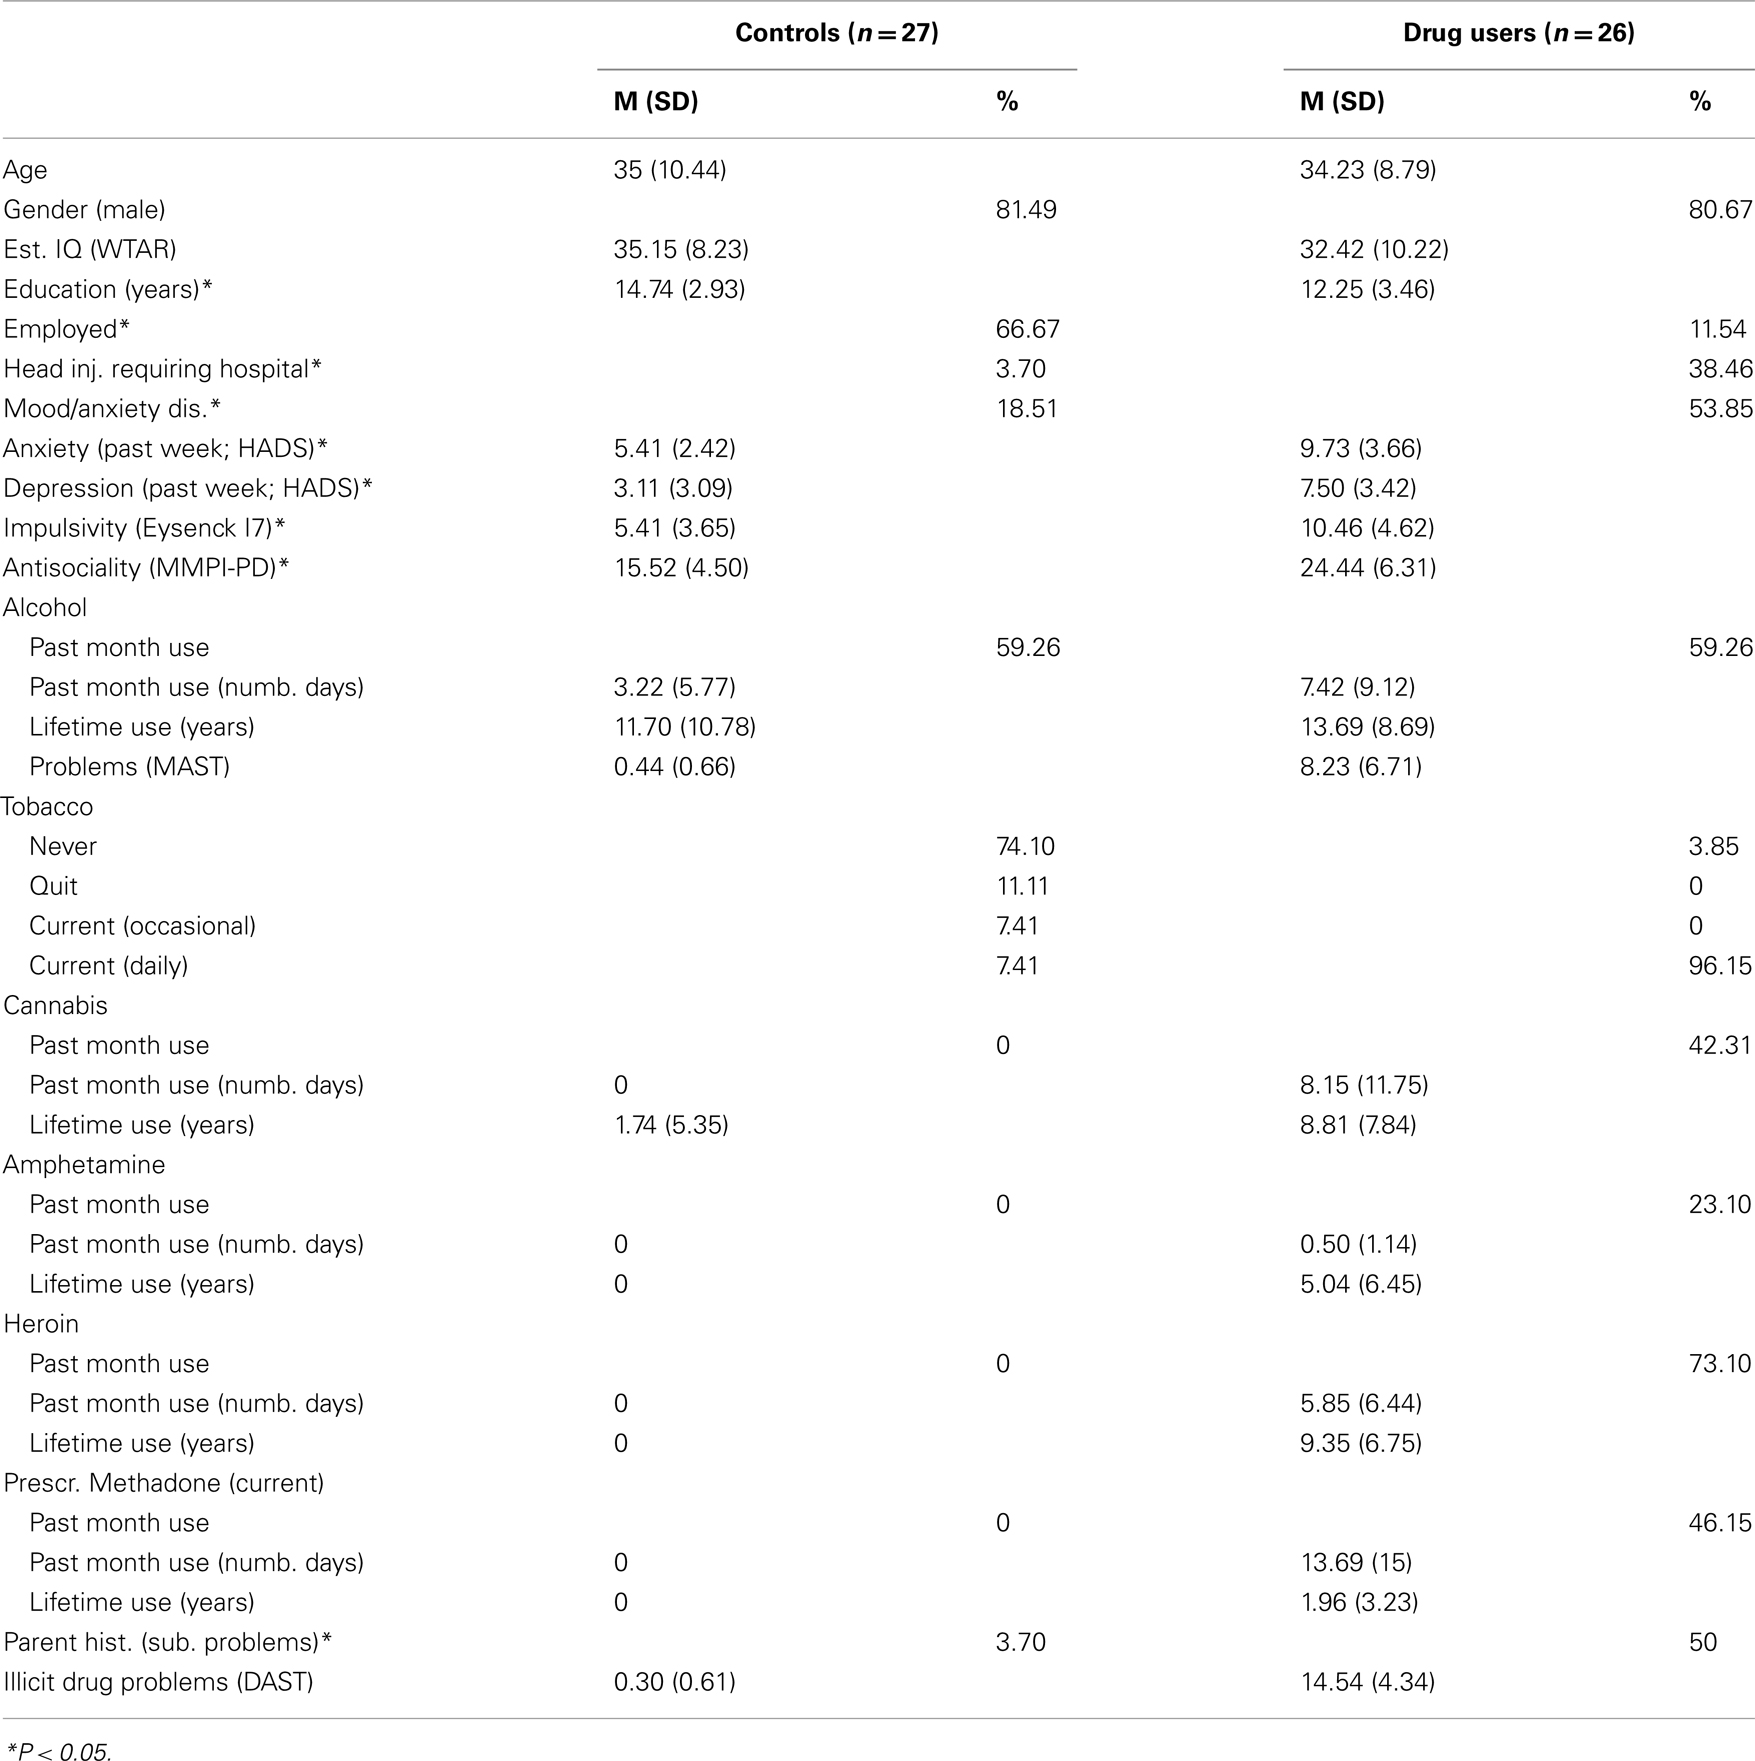
Table 1. Summary of demographic, mood, personality, and substance use variables.
Study Procedure
Participants from both groups underwent the same testing procedure in a single test session. During the initial part of the session, demographic characteristics, medical information, and substance use histories were recorded. A battery of computerized decision making tasks and a series of questionnaires followed. Testing took between 2 and 3 h for each participant, and was typically longer for drug users because their substance use histories were more extensive. Only a subset of the data collected is reported here.
Characterization of Participants
Substance use
Lifetime substance use and frequency of use over 30 days prior to testing were recorded using the drug use section of the addiction severity index (ASI; Mclellan et al., 1980). We also determined alcohol related problems over the past 12 months (e.g., health, relationship, occupational, legal) using the Michigan Alcohol Screening Test (MAST; Selzer, 1971), and illicit drug related problems using the Drug Abuse Screening Test (DAST; Skinner, 1982). The MAST and DAST probe alcohol and drug related problems over the past 12 months through a series of questions requiring a yes/no response. Parental history of substance use problems was also recorded.
As expected, the opiate user’s group scored higher on the DAST, t(51) = −16.58, p < 0.001 and MAST, t(51) = −5.89, p < 0.001 compared to the control group. They also used a range of drugs for longer and more frequently over their lifetime (including alcohol and tobacco; see Table 1) and were more likely to have a parent with a substance use problem, χ2(1, N = 53) 14.60, p < 0.001.
Estimated IQ, Mood, and Personality
We estimated participant IQ using the Wechsler Test of Adult Reading (WTAR; Wechsler, 2001). The WTAR requires participants to read a list of 50 words to the experimenter, with word difficulty increasing further down the list. The number of correctly pronounced words is a strong predictor of general IQ (Wechsler, 2001). We also determined recent symptoms of depression and anxiety over the previous week using the Hospital Anxiety and Depression Scales (HADS; Zigmond and Snaith, 1983). The HADS is self-administered and has 16 questions (8 for anxiety and 8 for depression). Each question has four response levels scored from 0 (e.g., not at all) to 3 (e.g., definitely). Total scores range from 0 to 21 for each subscale, with higher scores indicating greater anxiety/depression symptomatology. We also assessed “rash impulsivity” using the Eysenck Impulsiveness Scale of the Eysenck Impulsivity Venturesomeness and Empathy Scales (Eysenck et al., 1985). The Impulsiveness scale is self-administered, and requires participants to answer 19 yes/no questions. Scores range between 0 and 19, with higher scores indicating greater impulsive tendencies. We assessed antisocial tendencies using the Minnesota Multiphasic Personality Inventory, psychopathic deviate subscale (MMPI-PD; Butcher et al., 1989). The MMPI-PD is a self-administered questionnaire consisting of 50 true/false questions. Scores range between 0 and 50, with higher scores indicating greater antisocial tendencies.
Drug users and non-users had comparable WTAR scores, t(51) = 1.07, p = 0.29 but drug users reported higher symptoms of depression, t(51) = −4.90, p < 0.001 and anxiety, t(51) = −5.09, p < 0.001 (HADS) and were more likely to report a history of mood disorder compared to the control group, χ2(1, N = 53) 7.19, p < 0.01. Drug users also had higher self-reported impulsivity (Eysenck I7), t(51) = −4.43, p < 0.001 and higher antisociality (MMPI-PD scale), t(51) = −5.90, p < 0.001.
Decision Making Tasks: The IGT and the SGT
In the IGT (Bechara et al., 1997), players select from four “decks of cards” over a series of trials. On each trial, players receive a monetary reward or loss following their selection, with the frequency and magnitude of wins and losses differing across decks. Players are not given any information about the decks. Instead, they must learn from experience to choose from the decks that will maximize net return overall. Decks A and B have a large fixed reward ($1.00), and occasional large losses ($2.5 to 12.50). Over 10 selections, these decks return a net loss of $2.50 (Table 2). Decks C and D return a relatively small fixed reward ($0.50) compare to decks A and B, but also relatively small occasional losses ($0.25 to $2.50). Over 10 selections, these decks return a net reward of $2.50 (Table 2). Therefore, in order to finish the game on a positive balance, participants must make a higher proportion of selections from decks C and D overall.
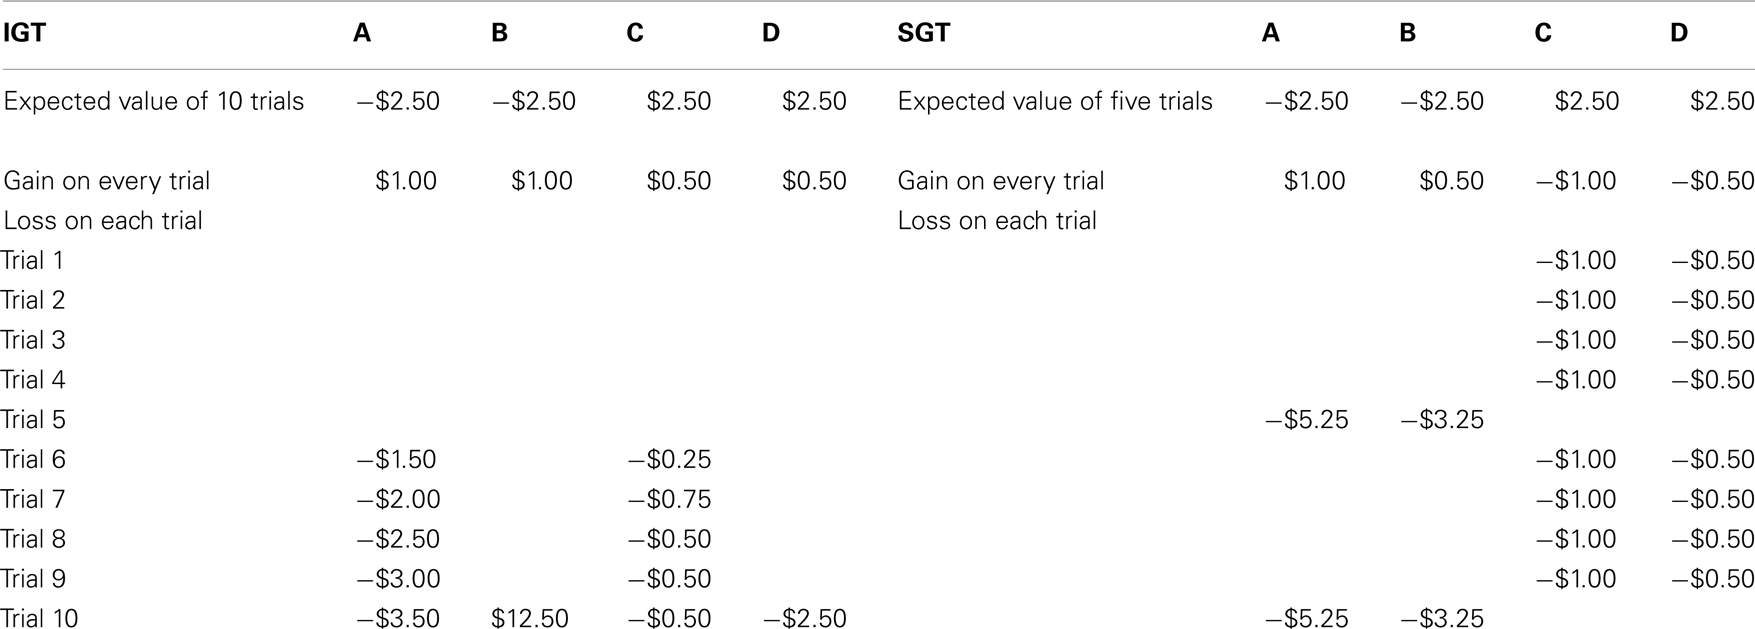
Table 2. The pay-off distributions of the Iowa Gambling Task and Soochow Gambling Task for the first 10 trials, adapted from Ahn et al. (2008).
Most studies using the IGT assess the total proportion (or number) of “good” deck selections over the course of the task to evaluate performance. However, recent findings suggest that combining decks for analysis can mask important patterns unique to each deck (Dunn et al., 2006; Yechiam et al., 2008). For this reason, we focused on individual deck selections and did not combine decks based on long-term outcome as some previous studies have. Given that changes can occur in preference as player experience the payoffs of each deck, we also analyzed changes in the mean proportion of selections from each deck a function of task progression (blocks 1–6).
The SGT (Chiu et al., 2008) is also computerized, requiring players to choose from four “decks of cards” over a series of trials. Like the IGT, players are not given any information about the decks. Two decks (A and B) have a fixed reward every selection (A, $1.00; B, $0.50) and a fixed loss every five selections (A, $5.25; B, $3.25)1. Ten selections from these decks results in a net loss of $2.50 (Table 2). The two other decks (C and D) have a fixed loss every selection (C, $1.00; D, $0.50) and a fixed reward every five selections (C, $5.25; D, $3.25). Ten selections from these decks results in a net reward of $2.50 (Table 2). Thus, unlike the IGT, decks that win frequently in the SGT (A, B) have a negative long-term value. We used the same approach to analyze SGT selections as described above for the IGT.
For both tasks, players began the game with a starting balance of $20.00 and received any money earned above this balance at the end of the task (120 trials). Players could not lose any money. The total balance was updated on-screen after every selection and players were also provided with feedback about the net change in balance every 20 trials (6 blocks). Each trial was player-initiated, and there were no time restrictions. Decks were positioned on the computer screen, from left to right, randomly across participants, and the order of tasks was counterbalanced between participants.
Statistical Analysis
Demographic, substance use, mood, and personality measures were compared between groups using two-tailed independent samples t-tests for continuous variables (e.g., age, education) and chi square tests for categorical variables (e.g., gender, employment status). We computed separate repeated measures ANOVAs for the SGT and IGT to analyze the mean proportion of selections from each deck (A, B, C, D) across the 6 task blocks (repeated measures). Group was included as a between-subjects factor in this analysis (drug users, controls). Paired samples t-tests were used to explore significant (p < 0.05) main effects of deck, and one-way ANOVAs to explore interactions between deck and group. Interaction effects involving the factor of task block were explored using repeated measures ANOVAs. Greenhouse–Geisser adjusted degrees of freedom (and p values) are reported when Mauchly’s Test of Sphericity was significant.
To further explore the influence of win frequency, magnitude, and expected value on deck preference, we also examined Pearson’s correlations between the number of selections from each deck in the IGT with the decks in the SGT across a combined sample of drug users and controls. We expected decks with similar win frequency and win/loss magnitude characteristics would be more strongly related than other decks in the same task, but not decks with the same expected values.
Results
IGT and SGT Deck Selections
We analyzed SGT selections to determine how deck preferences developed during the task in each group. We found a main effect of deck in the SGT, F(3,153) = 9.17, p < 0.001, but no interaction between deck and group, F(3,153) = 0.17, p > 0.05, deck and block, F(15,765) = 1.24, p > 0.05, or deck, block, and group, F(15,765) = 1.12, p > 0.05. This indicates that both groups developed similar preferences and did not change those preferences over the course of the task. Both groups overwhelmingly preferred high frequency win deck A (bad long-term outcome) to all other decks [deck B, t(52) = 4.58, p < 0.001, deck C, t(52) = 3.05, p < 0.01, deck D, t(52) = 5.13, p < 0.001; Figure 1]. We also found a trend for both groups to prefer high frequency win deck (deck B; bad long-term outcome) over low frequency win deck D (good long-term outcome), t(52) = 1.85, p = 0.07 (Figures 1B,D).
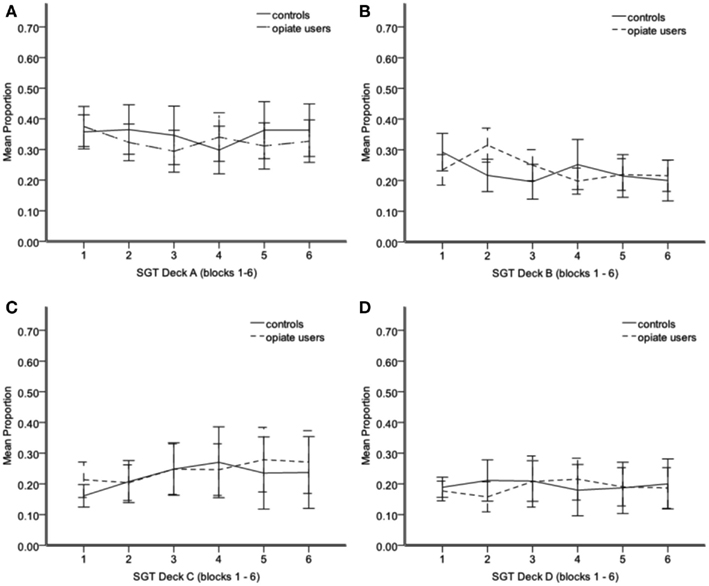
Figure 1. Mean proportion of SGT selections from deck A (A) deck B (B) deck C (C) deck D (D) from blocks 1–6. Each block = 20 trials. Error bars 95% CI. *P < 0.05.
For the IGT, our aim was to replicate previous findings (Stout et al., 2004, 2005), both in terms of initial preferences in each group (deck B) and changes in preference during the task (no change in substance users, healthy controls switch to deck D). We found a main effect of deck, F(3,153) = 25.20, p < 0.001 and an interaction between deck and group, F(3,153) = 4.58, p < 0.05, and deck, block, and group, F(15,765) = 1.66, p = 0.05. This finding replicates previous studies in that drug users and controls developed different deck preferences and that these preferences changed during task in a group specific way (Grant et al., 2000; Verdejo-Garcia et al., 2007; Verdejo-Garcia and Perez-Garcia, 2007). Interesting effects were in high frequency decks B and D. The controls made more deck D selections than opiate users F(1,52) = 5.20, p < 0.05 (Figure 2D). For controls, there was a significant increase in deck D selections across the task F(5,130) = 2.74, p < 0.05, suggesting learning in this group, whereas in opiate users there appears to be no change as the task progressed, F(5,125) = 0.52, p > 0.05. In contrast, controls made significantly fewer selections from deck B compared to opiate users F(1,52) = 6.52, p < 0.05, and although deck B selections appeared to decrease slightly across the task in controls and increase slightly in opiate users, this interaction was not significant [F(5,255) = 1.813, p > 0.05; Figure 2B]. deck A selections were comparable between groups, F(1,52) = 0.02, p > 0.05, as were deck C selections, F(1,52) = 0.44, p > 0.05 (Figures 2A,C).
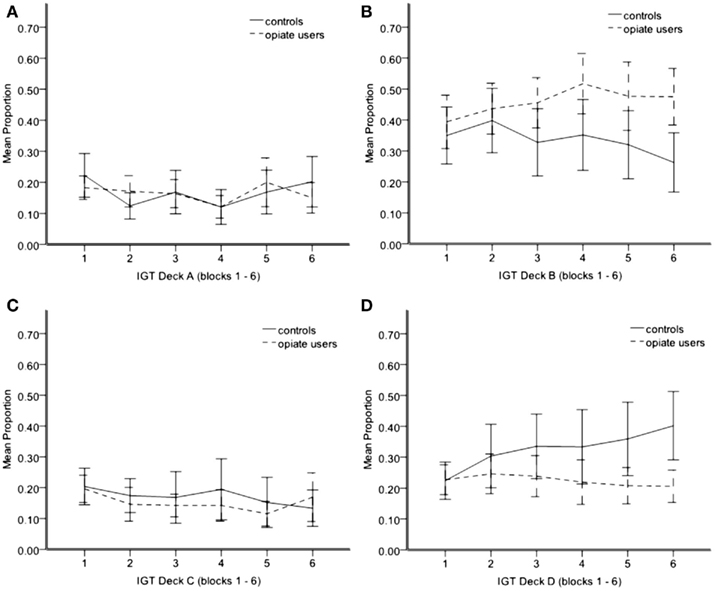
Figure 2. Mean proportion of IGT selections from deck A (A) deck B (B) deck C (C) deck D (D) from blocks 1–6. Each block = 20 trials. Error bars 95% CI. *P < 0.05.
Correlations between IGT and SGT Deck Selections
Consistent with the reasoning behind the SGT (i.e., deck expected value does not guide choice), selections from SGT decks with positive expected value (C, D “good decks”) were not associated with selections from IGT decks with positive expected value (C, D “good decks”), r(53) = 0.06, p > 0.05 (Figure 3B). In contrast, we found correlations between decks with similar win frequency and win/loss magnitude characteristics. Participants who selected more from deck A in the SGT (high frequency win, high magnitude win/loss) also tended to select more from deck B in the IGT (also high frequency win, high magnitude win/loss), r(53) = 0.251, p < 0.07 (Figure 3A). In addition, participants who selected more from SGT deck A tended to make fewer selections from IGT deck C (low win frequency, low magnitude win/loss), r(53) = −0.530, p < 0.001 (Figure 3C). However, IGT deck D selections were not related to SGT deck B selections, despite both decks being high frequency win, low magnitude win/loss, r(53) = 0.090, p > 0.05.
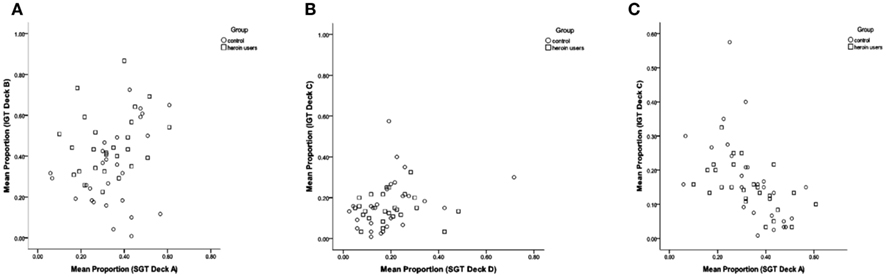
Figure 3. Scatter plots showing the association between mean proportion of IGT and SGT selections for IGT deck B and SGT deck A (A) IGT deck C and SGT deck D (B) and IGT deck C and SGT deck A (C).
Discussion
Many studies have found that drug users perform poorly in the IGT, but it is unclear how the basic properties of this task are related to choice behavior. Our aim was to identify patterns of responding across the IGT and SGT in relation to each deck’s expected value, its win frequency and win/loss magnitude. Our data indicate that opiate users and healthy controls are strongly influenced by win frequency, with both groups preferring high frequency win decks to low frequency win decks in the IGT and SGT.
Although the deck property of expected value has been the primary focus of most previous studies (Bechara et al., 1994, 1997, 2000) its influence on choice behavior was not obvious. Similar to Chiu et al. (2008) and Ahn et al. (2008), healthy controls preferred decks with positive expected value in the IGT, but negative expected value decks in the SGT. In addition, selections from decks with the same expected value were not correlated across the IGT and SGT. Thus, if expected value does influence choice behavior in healthy decision makers, as suggested in previous literature (Bechara et al., 1997), the effect does not appear to generalize from the IGT to the SGT.
One possibility raised by Chiu et al. (2008) is that controls prefer decks with positive expected value in the IGT because they do not have a lower win frequency. The SGT reveals that when behavior based on win frequency and expected value lead to different choices, win frequency is a stronger influence on choice behavior in this context (Ahn et al., 2008; Chiu et al., 2008). Our study confirms this finding and extends it to a group of drug users. Across both tasks, we found only one difference between opiate users and controls. In the SGT, both groups preferred SGT Deck A (high frequency win, high magnitude win/loss, negative expected value) and did not learn to maximize their earnings by shifting their preference to decks with positive expected value (C, D). In the IGT, both groups preferred Deck B early on (high frequency win, high magnitude win/loss, negative expected value), but only controls shifted their preference to Deck D in the later stages of the task (high frequency, low reward/loss magnitude).
To explain this pattern of results, we need to consider the win frequency and win/loss magnitude characteristics of IGT decks B and D. Deck D returns half the reward per selection compared to Deck B ($0.5 vs. $1), but has less harsh occasional losses ($2.50 vs. $12.50). Thus, it is likely that controls were motivated to shift their preference to Deck D after experiencing the large losses associated with Deck B. So why did not drug users also shift their preference from Deck B to Deck D? Previous studies suggest that drug users are more sensitive to rewarding stimuli and less sensitive to loss/punishment (Rogers and Robbins, 2001; Stout et al., 2004, 2005; Bechara, 2005). Thus drug users may have been relatively more attracted to the large rewards associated with Deck B, and less affected by this deck’s large losses. This combination would reduce the likelihood of drug users shifting their preference to a lower paying deck with the same win frequency.
To understand why controls shifted their preference in the IGT but not in the SGT, it may help to consider IGT decks again. In the IGT, when players shift from Deck B to Deck D, they forgo 50% of the reward (per selection), but also get an 80% reduction in loss. In the SGT, when players shift from Deck A to Deck B, they forgo 50% of the reward, but only get a 38% reduction in loss. We can only speculate, but it could be that players are aware of this trade-off on some level and decide that it is not worth it in the SGT. This is fundamentally different to the suggestion that healthy controls learn the expected value of decks and shift their preference accordingly. Indeed, given that decision makers have been shown to undervalue low probability alternatives in experience-based choices (Barron and Leider, 2009; Barron and Yechiam, 2009), it is not surprising that players strongly preferred alternatives in both tasks that had the highest probability of winning. Furthermore, the correlation between high frequency win decks across the IGT and SGT found in this study, suggests that the strength of this preference is robust across related decision situations. This does not appear to be the case for the factor of expected value.
Of course, this is the first study to evaluate IGT and SGT performance together in drug users, so replication in a larger, more representative sample is required. Our sample of drug users also had high levels of head injury requiring hospitalization and high levels of anxiety and depression. These characteristics could reasonably affect decision processes, particularly the evaluation of reward and loss which appear to be important processes for understanding why choice behavior differs between drug users and non-users in the IGT Nevertheless, head injury, anxiety and depression are common characteristics in this population and in many respects inseparable from drug use disorders (Rogers and Robbins, 2001). We are encouraged however by our replication of previous IGT findings in cannabis users (Fridberg et al., 2010), which indicates that our sample was not unique in terms of their decision making abilities or tendencies.
In conclusion, given the importance of tasks such as the IGT for understanding decision making in clinical samples such as those in treatment for drug use, we know surprisingly little about how the basic properties of this task influence choice behavior. Our data indicated that opiate users and healthy controls are similarly influenced by win frequency across the IGT and SGT, but appear to value wins and losses differently, at least in the IGT. This may explain divergent choice behavior observed between groups later in the IGT. Future studies should determine how individual differences in the valuation of reward and loss affect choice behavior in this context.
Conflict of Interest Statement
The authors declare that the research was conducted in the absence of any commercial or financial relationships that could be construed as a potential conflict of interest.
Acknowledgments
This study was supported by United States National Institute on Drug Abuse Grant R01 DA014119 (Julie C. Stout) and Australian Research Council Discovery Project Grant 110100696 (Julie C. Stout). We would like to thank Yip Yim Ting (Fanny) and Marcus Sellars for their assistance with data collection and data entry.
Footnote
- ^Note that in contrast to the IGT, which presents wins and losses (when they occur) separately on each trial, in the SGT, only a net win or loss is presented.
References
Ahn, W. Y., Busemeyer, J. R., Wagenmakers, E. J., and Stout, J. C. (2008). Comparison of decision learning models using the generalization criterion method. Cogn. Sci. 32, 1376–1402.
Barron, G., and Erev, I. (2003). Small feedback-based decisions and their limited correspondance to description-based decisions. J. Behav. Decis. Mak. 16, 215–233.
Barron, G., and Leider, S. (2009). The role of experience in the Gambler’s Follacy. J. Behav. Decis. Mak. 23, 117–129.
Barron, G., and Yechiam, E. (2009). The coexistence of overestimation and underweighting of rare events and the contingent recency effect. Judgm. Decis. Mak. 4, 447–460.
Bechara, A. (2005). Decision making, impulse control and loss of willpower to resist drugs: a neurocognitive perspective. Nat. Neurosci. 8, 1458–1463.
Bechara, A., Damasio, A., Damasio, H., and Anderson, S. W. (1994). Insensitivity to future consequences following damage to human prefrontal cortex. Cognition 50, 7–15.
Bechara, A., and Damasio, H. (2002). Decision-making and addiction (part I): impaired activation of somatic states in substance dependent individuals when pondering decisions with negative future consequences. Neuropsychologia 40, 1675–1689.
Bechara, A., Damasio, H., Tranel, D., and Damasio, A. R. (1997). Deciding advantageously before knowing the advantageous strategy. Science 275, 1293–1295.
Bechara, A., Tranel, D., and Damasio, H. (2000). Characterization of the decision-making deficit of patients with ventromedial prefrontal cortex lesions. Brain 123(Pt 11), 2189–2202.
Brand, M., Roth-Bauer, M., Driessen, M., and Markowitsch, H. J. (2008). Executive functions and risky decision-making in patients with opiate dependence. Drug Alcohol Depend. 97, 64–72.
Butcher, J. N., Dahlstrom, W. G., Graham, J. R., Tellegen, A. M., and Kaemmer, B. (eds). (1989). Minnesota Multiphasic Personality Inventory-2 (MMPI-2): Manual for Administration and Scoring. Minneapolis: University of Minnesota Press.
Chiu, Y. C., Lin, C. H., Huang, J. T., Lin, S., Lee, P. L., and Hsieh, J. C. (2008). Immediate gain is long-term loss: are there foresighted decision makers in the Iowa Gambling Task? Behav. Brain Funct. 4, 13.
Dunn, B. D., Dalgleish, T., and Lawrence, A. D. (2006). The somatic marker hypothesis: a critical evaluation. Neurosci. Biobehav. Rev. 30, 239–271.
Ersche, K. D., Roiser, J. P., Clark, L., London, M., Robbins, T. W., and Sahakian, B. J. (2005). Punishment induces risky decision-making in methadone-maintained opiate users but not in heroin users or healthy volunteers. Neuropsychopharmacology 30, 2115–2124.
Eysenck, S. B. G., Pearson, P. R., Easting, G., and Allsopp, J. F. (1985). Age norms for impulsiveness, venturesomeness and empathy in adults. Pers. Individ. Dif. 6, 613–619.
Fridberg, D. J., Queller, S., Ahn, W. Y., Kim, A., Bishara, A. J., Busemeyer, J. R., Porrino, L., and Stout, J. C. (2010). Cognitive mechanisms underlying risky decision-making in chronic cannabis users. J. Math. Psychol. 54, 28–38.
Grant, S., Contoreggi, C., and London, E. D. (2000). Drug abusers show impaired performance in a laboratory test of decision making. Neuropsychologia 38, 1180–1187.
Lejuez, C. W., Read, J. P., Kahler, C. W., Richards, J. B., Ramsey, S. E., Stuart, G. L., Strong, D. R., and Brown, R. A. (2002). Evaluation of a behavioral measure of risk taking: the Balloon Analogue Risk Task (BART). J. Exp. Psychol. Appl. 8, 75–84.
Mclellan, A. T., Luborsky, L., Woody, G. E., and Obrien, C. P. (1980). Improved diagnostic evaluation instrument for substance abuse patients – addiction severity index. J. Nerv. Ment. Dis. 168, 26–33.
Rakow, T., and Newell, B. R. (2010). Degrees of uncertainty: an overview and framework for future research on experienced-based choice. J. Behav. Decis. Mak. 23, 1–14.
Rogers, R. D., Everitt, B. J., Baldacchino, A., Blackshaw, A. J., Swainson, R., Wynne, K., Baker, N. B., Hunter, J., Carthy, T., Booker, E., London, M., Deakin, J. F., Sahakian, B. J., and Robbins, T. W. (1999). Dissociable deficits in the decision-making cognition of chronic amphetamine abusers, opiate abusers, patients with focal damage to prefrontal cortex, and tryptophan-depleted normal volunteers: evidence for monoaminergic mechanisms. Neuropsychopharmacology 20, 322–339.
Rogers, R. D., and Robbins, T. W. (2001). Investigating the neurocognitive deficits associated with chronic drug misuse. Curr. Opin. Neurobiol. 11, 250–257.
Selzer, M. L. (1971). Michigan Alcoholism Screening Test – quest for a new diagnostic instrument. Am. J. Psychiatry 127, 1653–1658.
Stout, J. C., Busemeyer, J. R., Lin, A. L., Grant, S. J., and Bonson, K. R. (2004). Cognitive modeling analysis of decision-making processes in cocaine abusers. Psychon. Bull. Rev. 11, 742–747.
Stout, J. C., Rock, S. L., Campbell, M. C., Busemeyer, J. R., and Finn, P. R. (2005). Psychological processes underlying risky decisions in drug abusers. Psychol. Addict. Behav. 19, 148–157.
Verdejo-Garcia, A., Benbrook, A., Funderburk, F., David, P., Cadet, J. L., and Bolla, K. I. (2007). The differential relationship between cocaine use and marijuana use on decision-making performance over repeat testing with the Iowa Gambling Task. Drug Alcohol Depend. 90, 2–11.
Verdejo-Garcia, A., and Perez-Garcia, M. (2007). Profile of executive deficits in cocaine and heroin polysubstance users: common and differential effects on separate executive components. Psychopharmacology (Berl.) 190, 517–530.
Wechsler, D. (ed.). (2001). Wechsler Test of Adult Reading (WTAR). San Antonio: The Psychological Corporation.
Yechiam, E., Kanz, J. E., Bechara, A., Stout, J. C., Busemeyer, J. R., Altmaier, E. M., and Paulsen, J. S. (2008). Neurocognitive deficits related to poor decision making in people behind bars. Psychon. Bull. Rev. 15, 44–51.
Keywords: Iowa Gambling Task, Soochow Gambling Task, choice behavior, decision-making, opiate users, drug users
Citation: Upton DJ, Kerestes R and Stout JC (2012) Comparing the Iowa and Soochow gambling tasks in opiate users. Front. Neurosci. 6:34. doi: 10.3389/fnins.2012.00034
Received: 01 December 2011; Paper pending published: 20 December 2011;
Accepted: 26 February 2012; Published online: 14 March 2012.
Edited by:
Itzhak Aharon, The Interdisciplinary Center, IsraelReviewed by:
Eric-Jan Wagenmakers, University of Amsterdam, NetherlandsEldad Yechiam, Technion Israel Institute of Technology, Israel
Copyright: © 2012 Upton, Kerestes and Stout. This is an open-access article distributed under the terms of the Creative Commons Attribution Non Commercial License, which permits non-commercial use, distribution, and reproduction in other forums, provided the original authors and source are credited.
*Correspondence: Julie C. Stout, School of Psychology and Psychiatry, Monash University, Clayton Campus, Wellington Road, Clayton, Melbourne, VIC 3800, Australia. e-mail:anVsaWUuc3RvdXRAbW9uYXNoLmVkdQ==