 Sepideh Hajipour Sardouie* and Mohammad Bagher Shamsollahi
- Biomedical Signal and Image Processing Laboratory, Department of Electrical Engineering, Sharif University of Technology, Tehran, Iran
The aim of a brain–computer interface (BCI) system is to establish a new communication system that translates human intentions, reflected by measures of brain signals such as magnetoencephalogram (MEG), into a control signal for an output device. In this paper, an algorithm is proposed for discriminating MEG signals, which were recorded during hand movements in four directions. These signals were presented as data set 3 of BCI competition IV. The proposed algorithm has four main stages: pre-processing, primary feature extraction, the selection of efficient features, and classification. The classification stage was a combination of linear SVM and linear discriminant analysis classifiers. The proposed method was validated in the BCI competition IV, where it obtained the best result among BCI competitors: a classification accuracy of 59.5 and 34.3% for subject 1 and subject 2 on the test data respectively.
Introduction
Many people with severe motor disabilities, especially those who are totally paralyzed, need communication technologies which do not require muscle control. Over the past two decades, many studies used brain signals as a basis for this new communication technology called brain–computer interface (BCI) system (Wolpaw et al., 2002; Schalk et al., 2004). The aim of a BCI system is to establish a new communication system that translates human intentions, reflected by measures of brain signals such as EEG, ECoG, and MEG, into a control signal for an output device such as a computer (Wolpaw et al., 2002; Blankertz et al., 2004). To this end, recorded brain signals must be analyzed in various manners and classified by suitable methods. There are various methods of signal classification which differ in features and classifiers. The selection of the effective features depends on the primary features, feature reduction methods, measures of feature selection, and search algorithms seeking the best feature set.
In this paper, an algorithm is proposed for discriminating MEG signals recorded during hand movements in four directions. These signals were presented as data sets 3 of BCI competition IV. The proposed algorithm has four main stages: pre-processing, primary feature extraction, the selection of efficient features, and classification. Primary features are in various types of time, frequency, and time–frequency domains. The feature selection stage consists of two substages based on classifier independent and classifier dependent measures. These measures were used to find the effective features. The classification stage was the combination of linear Support Vector Machines (linear SVM) and linear discriminant analysis (LDA) classifiers. Finally, the class labels were obtained by voting on the results of the classifiers.
The paper is organized as follows: first, a brief description of the data is provided. Then, the proposed algorithm to classify MEG signals is introduced in detail. In the next section, the results of applying the proposed algorithm on the MEG data set is presented and compared with the results from the other groups. A discussion concludes this paper.
Data Acquisition
The signals considered in this paper are directionally modulated MEG signals which were provided by the Institute of Biology I, the Bernstein Center Freiburg (both University of Freiburg) and the MEG-Center and the Institute of Medical Psychology and Behavioral Neurobiology (both University of Tübingen). The signals were provided as dataset 3 in BCI competition IV. Signals were recorded from two right-handed subjects performing wrist movements in four directions. The task of each subject was to move a joystick from a center position toward one of four targets (which were arranged in the form of a rhombus with corners pointing left, right, away from, and toward the subject’s body) using the right hand and wrist. In this procedure, the target was self-chosen by the subject. The head was stabilized and the position of the upper arm and shoulder were fixed using a pillow positioned under the elbow.
The signals were recorded from 10 MEG channels which were located above the motor areas. These signals were filtered by 0.5–100 Hz band pass filter and resampled at 400 Hz.
Trials in the data set were cut from 0.4 s before to 0.6 s after movement onset. There were 40 trials per target, so the number of labeled data for each of the two subjects was 160 trials. The goal for this data set was to predict class labels for unlabeled (test) data, which were comprised of 74 and 73 trials for subject 1 and subject 2, respectively.
Methodology
Our proposed algorithm has four main stages: pre-processing, primary feature extraction, feature selection and classification. In this section, each of these steps is described in detail. For evaluating the algorithm, the labeled data were divided into two groups. Hundred forty trials (35 trials of each class) were randomly chosen for training classifiers and named training data. Then, the proposed algorithm was applied on the remaining 20 trials which were named cross-validation data. This procedure was repeated 10 times per each classifier. Figure 1 shows the summarized flow chart of the algorithm.
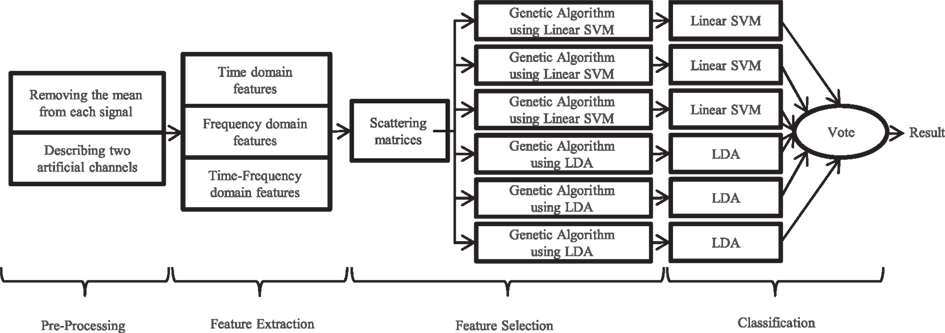
Figure 1. The summarized flow chart of the different stages of the proposed algorithm.
Pre-Processing
No specific pre-processing was done on the data. Only, the offset of each signal was adjusted to be zero by subtracting the mean value before feature extraction (except time mean feature). According to the results which were obtained in (Millan et al., 1998), defining differential channels was useful for EEG classification, so two artificial channels were defined in this paper. The first channel is the signal produced by subtraction of channels RC41 and LC41, and the second one is the subtraction of channels ZC01 and ZC02. Of the provided channels in BCI competition VI dataset 3, these channels were the only ones that were positioned symmetrically with regard to the head center. The method of defining these channels is shown in Figure 2.
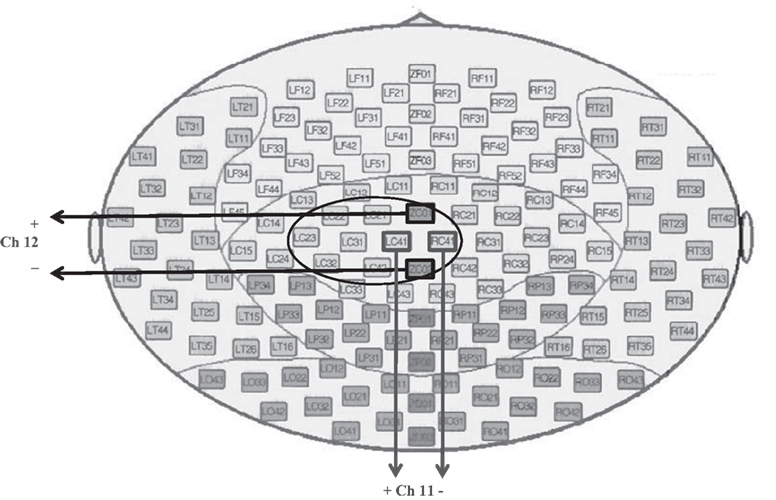
Figure 2. The method of defining two new artificial channels: channel 11 and 12.
Feature Extraction
The primary features used in the proposed algorithm can be classified into three groups (Bashashati et al., 2007): time domain features, frequency domain features and time–frequency domain ones, which are explained in detail in the following. In the feature definition, x(t) and P(ω) represent signal in time domain and its power spectrum density (PSD) respectively. Each feature was calculated for all 12 channels (10 real and 2 artificial ones).
Time domain features
The following time domain features were estimated by using all samples up to the current position.
1. Time mean.
2. Variance.
3. Autoregressive model parameters: The order of the AR model was chosen as 4, 8, 12, and 16 and the coefficients of the AR model were estimated in each case.
4. Form factor: Form factor of a signal is determined by Arbabi et al. (2005):
where ẋ and ẍ represents first and second derivatives of x respectively, and σx is the SD of x.
Frequency domain features
To estimate frequency domain features, we calculated P(ω) as the squared value of Fast Fourier Transform of that signal. The frequency domain features are as follows:
1. Signal’s energy in different frequency bands: for each signal, the amount of its energy was calculated in seven frequency bands: 2–8, 9–15, 16–22, 23–29, 30–36, 37–43, and 44–50 Hz. Then, the ratio of these values to the total energy was calculated as follows:

where Wi represents i-th frequency band. So, the nominator is energy in i-th frequency band and the denominator shows total energy. ω is the angular frequency which is defined by ω = 2πf.
2. Mean frequency: the mean frequency of a signal can be defined as follows:
3. Mode frequency: the mode frequency of a signal is the frequency which has the greatest value in the power spectrum.
4. Median frequency: the median frequency of a signal can be calculated as follows:
Time–frequency domain features
The coefficients of discrete wavelet transform with the following mother wavelets were calculated in six scales:
1. Haar
2. Daubechies2
3. Daubechies4
Then the coefficients of approximation (c0) and four levels of details (d0, d1, d2, d3) were used as the time–frequency domain features.
In this stage, for each channel, 399 features were extracted. So, the total number of the features was 4788.
Feature Selection
The feature selection process is used to prevent the accumulation of irrelevant features. Using too many overlapping features will cause poor generalization of the classifier and an increase in computational complexity. In this paper, selection of the appropriate features from the numerous features was done in two stages. In the first stage, selection was done using a classifier independent method. The goal of this stage is to find those features which can better separate related classes. A classifier dependent feature selection method was used in the second stage. It should be noted that we used these two stages because of high speed of the first and high precision of the second method (Arbabi et al., 2005).
Feature selection using classifier independent method: scattering matrices measure
In this stage, for each feature, we defined a measure based on scattering matrices (Zhang et al., 2004) to compute the ability of this feature to discriminate the classes. So we defined within-class (SW) and between-class (SB) indices for a feature x as follows:

In these equations μi and p(wi) denote the sample mean and the prior probability of class i, respectively. M is the number of the classes which was 4 for this data set. According to the definitions (5) to (8), within-class index SW represents the amount of compression of different classes in the case of feature x. Therefore, smaller values of SW represent that this feature can produce denser classes. On the other hand, between-class index SB shows the amount of scattering of different classes from each other. Consequently, larger values of SB show the ability of feature x to scatter different classes.
In this stage, we used the ratio |SB|/|SW| as an appropriate measure for feature selection. The greater ratio represents better discrimination ability of that feature. Using this measure, 200 features which had greatest values were selected.
Feature selection using classifier dependent method: genetic algorithm
The Genetic algorithm can be described as a stochastic search and optimization technique which is based on evolutionary computation. This technique was used in many studies to select best features out of brain signals for BCI applications (Garrett et al., 2003; Graimann et al., 2004). So, in our algorithm, for selecting the most appropriate features out of 200 selected features in the last stage, genetic algorithm was used.
In the execution of the genetic algorithm, 75% of the training data was randomly selected, and the classifier (which could be LDA or Linear SVM classifier) was trained using them. The result of the classification was calculated on remaining (25%) training data. This process was done 10 times and the average value of the classification errors (on remaining training data) was used as the error of genetic algorithm for each classifier. In this stage, by using genetic algorithm without the limitation of feature numbers, 50–100 features were selected. It must be mentioned that different features for each classifier were selected.
Classification
After selecting the appropriate features by using training data, these features were extracted from cross-validation data and the classification procedure was applied on these features. In this procedure, different classifiers were tested. Different features were selected for each classifier by using the proposed algorithm and the classification accuracy on cross-validation data were calculated by using these selected features. The result of the proposed algorithm on the cross-validation data showed that the linear SVM and LDA classifiers (Lotte et al., 2007) had better accuracy than other classifiers, such as quadratic and Mahalanobis classifiers. Also, they had a moderate execution time. The average execution time of the whole algorithm (with both the training and test stages), in a 3.00-GHz Pentium 4 with 1.00 GB RAM under windows XP, is 403 and 640 s for linear SVM and LDA classifiers respectively.
To achieve better accuracy on the test data, each one of these two classifiers was run three times and the generated class labels were saved. It must be mentioned that the pre-processing, feature extraction and feature selection using classifier independent method (scattering matrices measure) stages selected same features for these six executions. Therefore, only the feature selection using classifier dependent method (genetic algorithm) and classification stages must be performed separately for each run. It is clear that the difference between the obtained labels is the result of the selection of different features in the genetic algorithm stage. For each trial, the final class label was chosen by voting on the six achieved labels. In the voting stage, in case of similar classification results for two or more classes, one of these classes was randomly selected.
Results
By using all labeled data for training stage of the algorithm, the appropriate features were selected and these features were extracted from test data. Then, the class labels of the test dataset were calculated by using the voting of linear SVM and LDA classifiers. The proposed method was validated in the BCI competition IV, where it obtained the best result among BCI competitors: the classification accuracy of 59.5, 34.3, and 46.9% on the test set for subject 1, subject 2, and average respectively. Table 1 shows the classification accuracy by using the voting of linear SVM and LDA classifiers on the test dataset for two subjects.

Table 1. Classification accuracy (%) achieved by using the voting of linear SVM and LDA classifiers on the test dataset for two subjects.
Comparing the obtained accuracy with the other competitor results demonstrates that the proposed algorithm is effective for classifying MEG signals recorded during hand movements in four directions.
For more analysis on the data set 3 of BCI competition IV, each feature set were analyzed separately to show how well it performs on the training and evaluation data. To this end, for each set out of 11 feature sets which were introduced in the Section “Feature Extraction,” the classification accuracy were calculated on the labeled and unlabeled data by using two classifiers, linear SVM and LDA. For each feature set, labeled data were divided into two groups: training data which were 140 trials (35 trials in each class) randomly chosen for training classifiers and cross-validation data which were the remaining 20 trials, and classification accuracy were calculated by applying the algorithm 100 times per classifier. Then, the classification accuracy was obtained on the test data by using the true labels which were available after the competition. The classification accuracy achieved on the cross-validation and test data for each feature set, for subject 1 and 2, is shown in Tables 2 and 3 respectively.
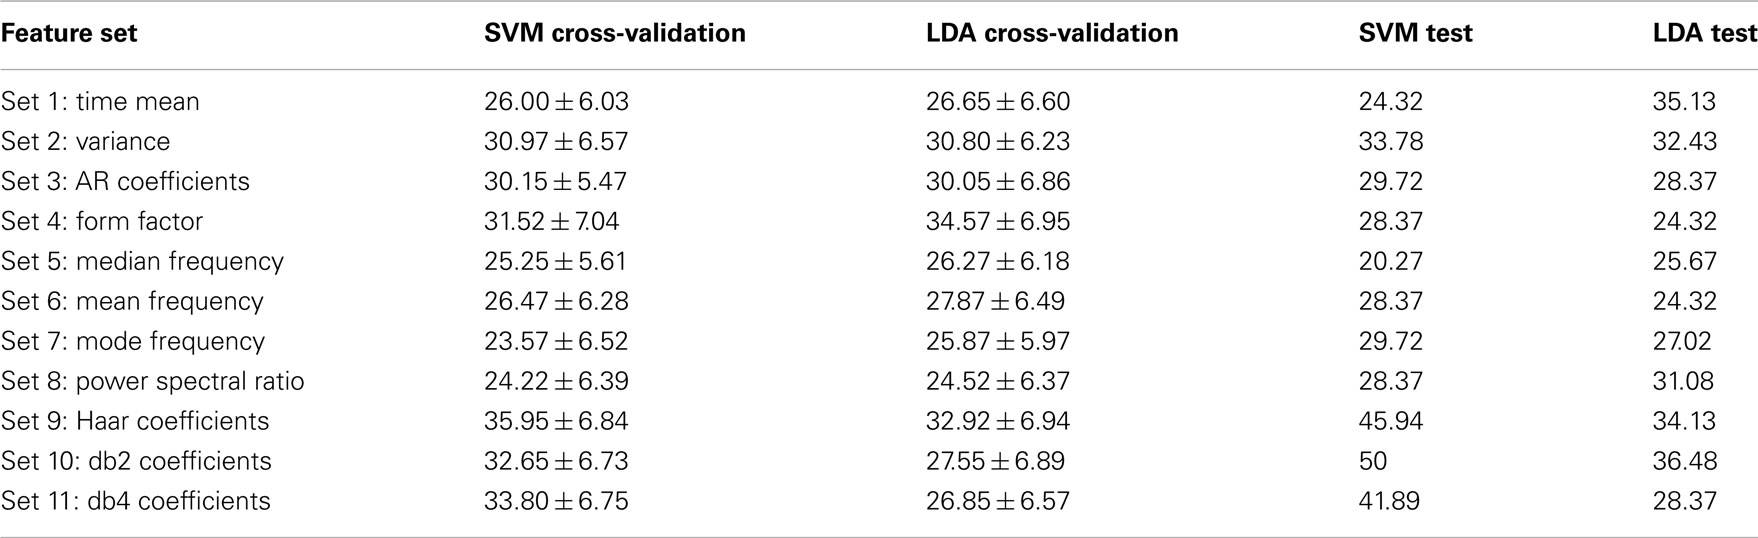
Table 2. Classification accuracy (%) achieved by using different feature sets on the cross-validation and test data for subject 1.
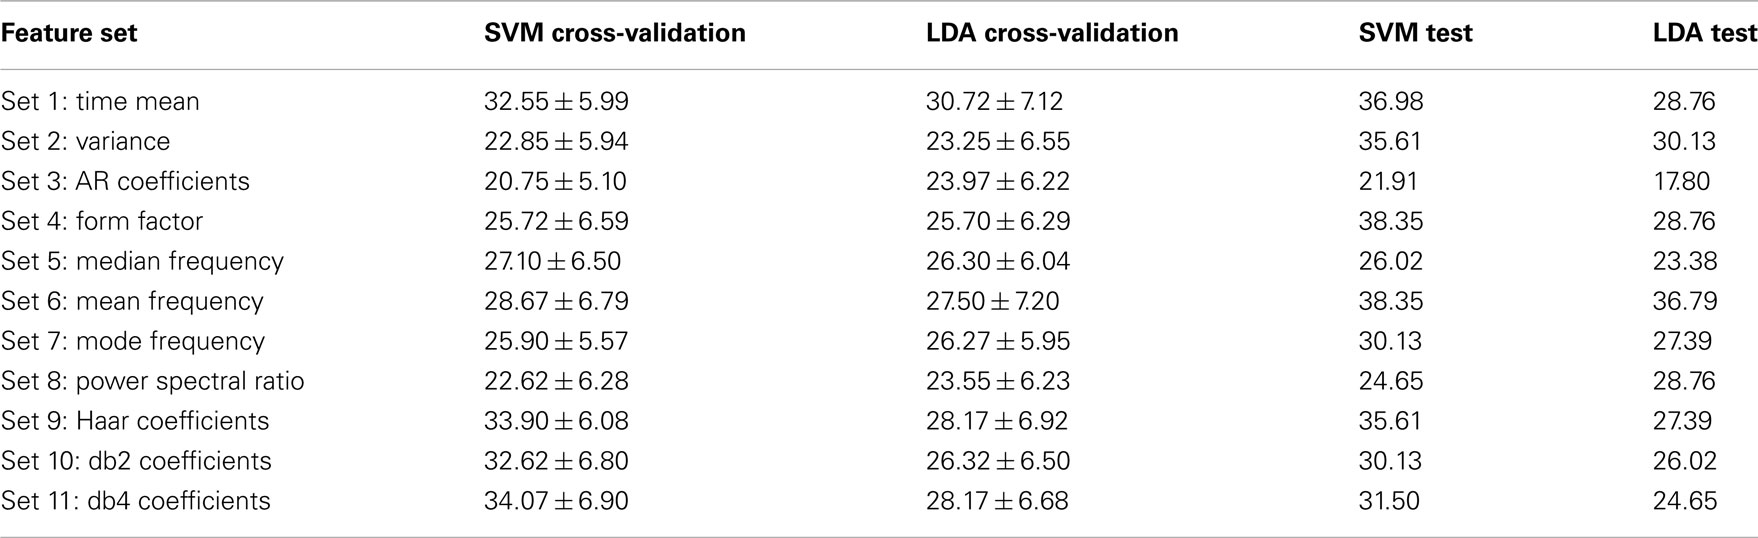
Table 3. Classification accuracy (%) achieved by using different feature sets on the cross-validation and test data for subject 2.
Comparing the results which were achieved on the cross-validation and test data for each feature set shows that there are some stable features which transfer well from training to test data, and others are unstable. For subject 1, the time–frequency domain features (sets 9, 10, and 11) and feature set 2 (variance) have better classification accuracy, on both the training and test data, in regard to the other feature sets. For subject 2, feature sets 2 and 6, which are variance and mean frequency, have better results for both classifiers. But the results achieved for the other feature sets alter from one classifier to another. For instance, for subject 2, the results of the time–frequency domain feature sets used by linear SVM classifier are convenient, but these results are not good for LDA classifier.
For further details, features which were selected by the algorithm were identified and the percent of utilization of each feature set was calculated for both subjects and both classifiers. We defined the percent of utilization for the feature fk as follows:
and we also defined the percent of utilization of a feature set as the average of the percent of utilization of all features in this set.
Figure 3 compares these results with the accuracies which were calculated for each feature set. In this figure, for each subject and each classifier, classification accuracies on the test data for each feature set are shown by using column height. The intensity of each column specifies the percent of utilization of the related feature set in the proposed algorithm. According to this figure, for subject 1, in average the feature sets which have greater accuracies are used more by the proposed algorithm. For subject 2, there is no special correlation between the used features and the greater accuracies. In general, for both subjects, the time–frequency features were used more than the other features in the feature selection stage of the proposed algorithm.
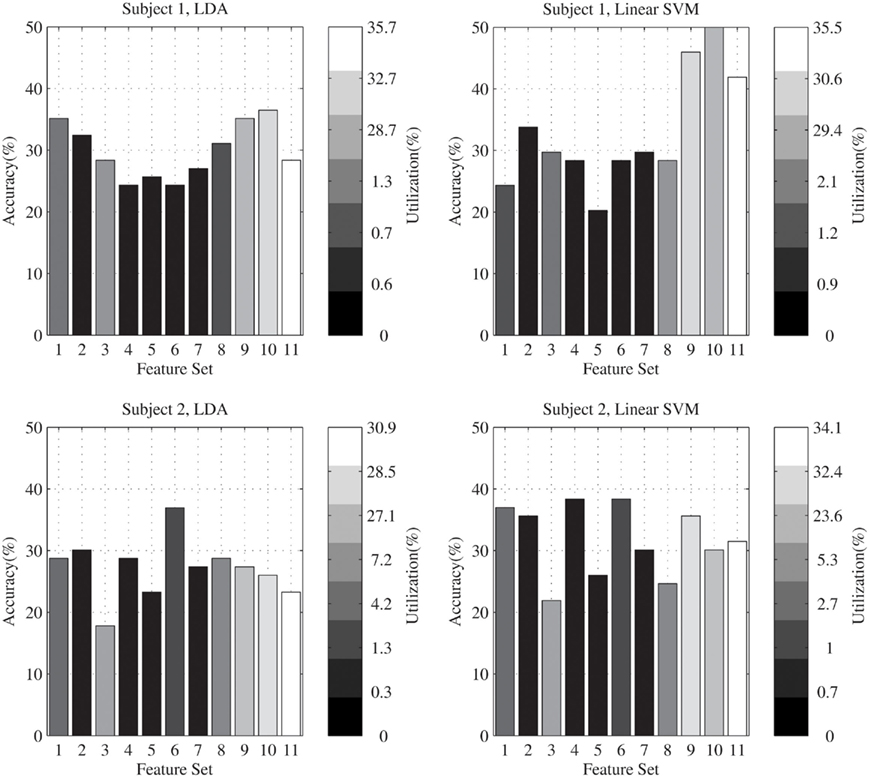
Figure 3. Comparing the percent of utilization of each feature set with the accuracies which were calculated for them.
Discussion
There are various methods, which differ mainly in the used features and classifiers, to classify brain signals. In this paper, an algorithm was proposed which tried to select the effective features to discriminate MEG signals recorded during hand movements in four directions. The proposed algorithm has four main stages: pre-processing, primary feature extraction, the selection of efficient features and classification. The classification stage was the combination of linear SVM and LDA classifiers. By applying the algorithm on the test data of data set 3 of BCI competition IV, a classification accuracy of 59.5 and 34.3% for subject 1 and 2, respectively, was achieved, which was the best result among BCI competitors.
As shown in Figure 3, the selected features are dependent to both subjects and classifiers. In general, the proposed algorithm is used to select the most efficient features from a broad range of different features. If there are features which are selected for all the subjects and classifiers, they can be used independently of the proposed algorithm. For instance, for this data set, time–frequency coefficients were stationary features which were selected in all different cases. However this was not true for most of the features. For our purpose, which is the best classification of the evaluation data, it is not important to find the most appropriate features in general; so the proposed algorithm is supposed to be an adaptive system which selects effective features for obtaining the high accuracy, in different situations, given a pre-defined broad range of several features.
The providers of the dataset 3 showed that the low frequency activity contains information about movement direction. By using low-pass filtered activity in the time domain, they obtained a high decoding accuracy of 67% on average (Waldert et al., 2008; and common/summarizing article of the BCI competition IV). We cannot directly compare these results to ours because this feature was not included in the pre-defined feature set used in this paper.
There have been many algorithms which tried to classify EEG or ECoG signals by extracting the effective features (Arbabi et al., 2005). They produced good results to discriminate these signals. In this paper, the almost identical algorithm was examined to classify MEG signals. The results show that this algorithm can be effective on discriminating MEG signals in addition to EEG and ECoG signals. Note that the proposed algorithm may not be feasible in an online application, since for example we can not determine the mean of the signal in the pre-processing step unless all samples are available. Also, running the whole processing chain three times for each classifier would not be applicable in online processing.
Conflict of Interest Statement
The authors declare that the research was conducted in the absence of any commercial or financial relationships that could be construed as a potential conflict of interest.
References
Arbabi, E., Shamsollahi, M. B., and Sameni, R. (2005). “Comparison between effective features used for the Bayesian and the SVM classifiers in BCI,” in 27th IEEE Annual Conference on Engineering in Medicine and Biology, Shanghai, 5365–5368.
Bashashati, A., Fatourechi, M., Ward, R. K., and Birch, G. E. (2007). A survey of signal processing algorithms in brain–computer interfaces based on electrical brain signals. J. Neural Eng. 4, R32–R57.
Blankertz, B., Muller, K. R., Curio, G., Vaughan, T. M., Schalk, G., Wolpaw, J. R., Schlogl, A., Neuper, C., Pfurtscheller, G., Hinterberger, T., Schroder, M., and Birbaumer, N. (2004). The BCI competition 2003: progress and perspectives in detection and discrimination of EEG single trials. IEEE Trans. Biomed. Eng. 51, 100–106.
Garrett, D., Peterson, D. A., Anderson, C. W., and Thaut, M. H. (2003). Comparison of linear, nonlinear, and feature selection methods for EEG signal classification. IEEE Trans. Neural Syst. Rehabil. Eng. 11, 141–144.
Graimann, B., Huggins, J. E., Levine, S. P., and Pfurtscheller, G. (2004). Toward a direct brain interface based on human subdural recordings and wavelet-packet analysis. IEEE Trans. Biomed. Eng. 51, 954–962.
Lotte, F., Congedo, M., Lecuyer, A., Lamarche, F., and Arnaldi, B. (2007). A review of classification algorithms for EEG-based brain–computer interfaces. J. Neural Eng. 4, R1–R13.
Millan, J. R., Mourino, J., Marciani, M. G., Babiloni, F., Topani, F., Canale, I., Heikkonen, J., and Kaski, K. (1998). “Adaptive brain interfaces for physically-disabled people,” in 20th IEEE Annual Conference on Engineering in Medicine and Biology, Hong Kong, 2008–2011.
Schalk, K. G., McFarland, D. J., Hinterberger, T., Birbaumer, N., and Wolpaw, J. R. (2004). BCI 2000: a general-purpose brain-computer interface (BCI) system. IEEE Trans. Biomed. Eng. 51, 1034–1043.
Waldert, S., Preissl, H., Demandt, E., Braun, C., Birbaumer, N., Aertsen, A., and Mehring, C. (2008). Hand movement direction decoded from MEG and EEG. J. Neurosci. 28, 1000–1008.
Keywords: BCI, MEG, feature selection, linear SVM, LDA
Citation: Hajipour Sardouie S and Shamsollahi MB (2012) Selection of efficient features for discrimination of hand movements from MEG using a BCI competition IV data set. Front. Neurosci. 6:42. doi: 10.3389/fnins.2012.00042
Received: 15 December 2011; Accepted: 14 March 2012;
Published online: 02 April 2012.
Edited by:
Michael Tangermann, Berlin Institute of Technology, GermanyReviewed by:
Clemens Brunner, Graz University of Technology, AustriaStephan Waldert, University College London, UK
Copyright: © 2012 Hajipour Sardouie and Shamsollahi. This is an open-access article distributed under the terms of the Creative Commons Attribution Non Commercial License, which permits non-commercial use, distribution, and reproduction in other forums, provided the original authors and source are credited.
*Correspondence: Sepideh Hajipour Sardouie, Biomedical Signal and Image Processing Laboratory, Department of Electrical Engineering, Sharif University of Technology, Azadi Avenue, Tehran, Iran. e-mail:c19oYWppcG91ckBlZS5zaGFyaWYuZWR1