 Linlin Liu1†
 Wen Qin
 Quan Zhang
- 1Department of Radiology and Tianjin Key Laboratory of Functional Imaging, Tianjin Medical University General Hospital, Tianjin, China
- 2Department of Radiology, Shandong Cancer Hospital Affiliated to Shandong University, Shandong Academy of Medical Sciences, Jinan, China
- 3Department of Radiology, Tianjin Medical University Metabolic Diseases Hospital, Tianjin, China
Type 2 diabetes mellitus (T2DM) is related to cognitive impairments and increased risk for dementia. Neuroimaging studies have demonstrated T2DM-related brain structural and functional changes which are partly associated to the cognitive decline. However, few studies focused on the early neuroimaging findingsin T2DM patients. In this study, a data-driven whole-brain resting state functional connectivity strength (rsFCS) methodwas used to evaluate resting functional changes in 53 T2DM patients compared with 55 matched healthy controls (HCs), and to detect the associations between the rsFCSchanges and cognitive functions in T2DM patients. The T2DM patients exhibited weaker long-range rsFCS in the right insula and weaker short-range rsFCS in the right supramarginalgyrus (SG) compared with the HCs. Additionally, seed-based functional connectivity (FC) analysis revealed weaker FC between the right insula and the bilateral superior parietal lobule (SPL), and between the right SG and the bilateral supplementary motor area (SMA)/right SPL in T2DM patientscompared with the HCs. In T2DM patients, negative correlation was found between the long-range rsFCS in the right insula and HbA1c levels; and the FC between the right SG and the bilateral SMA negatively correlated with TMT-A scores. Our results indicated that the rsFCS alteration occurredbefore obvious cognitive deficits in T2DM patients, which might be helpful for understanding the neuromechanism of cognitive declines in T2DM patients.
Introduction
Diabetes mellitus is one of the most common chronic metabolic diseases. Type 2 diabetes mellitus (T2DM) is associated with cognitive decline (Gispen and Biessels, 2000; Cheng et al., 2012), and increases risk for dementia, including vascular dementia, and Alzheimer's diseases (Janson et al., 2004; Tan et al., 2011; Haight et al., 2015). Increasing neuroimaging studies have focused on the neuromechanisms underling the cognitive impairments in T2DM patients, and T2DM-related brain structural and functional abnormalities have been revealed. For example, cerebral atrophy (De Bresser et al., 2010) and gray matter volume (GMV) reductions (Kumar et al., 2008; Moran, 2013) have been reported in patients with T2DM. Additionally, T2DM patients have also exhibited altered brain activity during working memory tasks (Ran-Ran Huang et al., 2015; Wood et al., 2016) and resting state (Chen et al., 2015a; Cui et al., 2015).
The resting state fMRI (rsfMRI) was widely used to evaluate regional brain activity and functional connectivity under disease conditions (Greicius, 2008; Barkhof et al., 2014; Liu et al., 2015a). Recently, researchers have focused on the T2DM-related brain function alteration at resting state. For example, the altered spontaneous brain activity in multiple brain regions has been revealed by both low-frequency fluctuations (ALFF; Xia et al., 2013; Cui et al., 2014; Wang C. X. et al., 2014; Zhou et al., 2014) and regional homogeneity (ReHo) studies (Cui et al., 2014; Peng et al., 2016) on T2DM patients. The ALFF and ReHo analysis are two most important methods to describe the characteristics of rsfMRI signals in the brain. ALFF algorithm is to obtain the power spectrum by Fourier transform of the fMRI data, and then calculates the low-frequency oscillation amplitude of each voxel. It is measuring the strength of neural activity at voxel level (Zang et al., 2007). While ReHo is based on the calculation of the Kendall harmonious coefficient to measure the neural synchrony between a specific voxel and its neighboring voxel (Zang et al., 2004). The independent component analysis (ICA) method contributes to separate the whole brain signal from physiological noise and automatically captures the entire network as a single major component (Greicius et al., 2003; Liu et al., 2017). By using ICA, resting state FC within default mode network (DMN) and attention network (AN) were found to be disrupted in T2DM patients (Cui et al., 2015; Xia et al., 2015a; Yang et al., 2016); and the FC alterations were found to be related to visualspatial function (Cui et al., 2015; Xia et al., 2015a) and working memory ability (Xia et al., 2015a). Seed-based resting state FC method was also used for detecting brain FC changes in T2DM patients. It is very important for FC method to select the seed, which is usually based on a priori anatomical knowledge or activation graph (Lowe et al., 2002). With Seed-based resting state FC, inconsistent results were obtained in T2DM patients. For example, Chen et al. (2014) reported that T2DM patients exhibited decreased FC between the posterior cingulate cortex (PCC) and the right middle temporal gyrus (MTG), the left occipital cortex and the left precentral region; and increased FC between the PCC and the right frontal regions. Another study by Chen et al (Chen et al., 2015b) revealed decreased FC between the thalamus and the right MTG and the cuneus in T2DM patients; and these decreased FC were associated with executive function and visualspatial ability. A study by Musen et al. (2012) demonstrated decreased FC between the PCC and the frontal, temporal regions and the bilateral thalamus in T2DM patients. Additionally, altered FC between hippocampi and wide frontal, temporal and occipital regions were also reported in T2DM patients (Zhou et al., 2010; Xia et al., 2014).
These rsfMRI studies indicated that the alterationof FC was associated with the T2DM-related cognitive decline and deepened the understanding of neuromechanisms underling the cognitive impairments in T2DM patients. However, T2DM patients enrolled in most of these studies either companied by complications such as diabetic retinopathy, nephropathy, or peripheral neuropathy (Cui et al., 2014; Chen et al., 2015b) or suffered from cognitive impairments (Chen et al., 2014, 2015a,b; Cui et al., 2014; Wang C. X. et al., 2014; Xia et al., 2014) and neuroimaging findings based on these studies could not reflect the early alterations of brain function in T2DM patients. Only one rsfMRI study by Musen et al. (2012) focused on thecognitively intact T2DM patients and demonstrated that reduced FC in several regions within DMN were earlier than occurrence of cognition decline, which indicated the neuroimaging might be used for predicting the early cognitive impairments in T2DM patients.
Furthermore, previous studies demonstrated that functional brain changes in T2DM patients were widespread across the whole brain. However, ALFF and ReHo were methods for evaluating the regional resting brain activity (Zang et al., 2004, 2007); and the resting state FC is a hypothesis-driven seed-based method and cannot be used to evaluate the FC among the whole brain (Rosazza and Minati, 2011). The resting state functional connectivity strength (rsFCS) is a data-driven method for detecting functional connectivity among the whole brain andhas been proposed to reflect intrinsic functional organization of the brain (Zhuo et al., 2014), and can be used to further examine the association between the FC and anatomical distance (Guo et al., 2015). A systematical human brain activity relied on both long- and short -range FC (Sepulcre et al., 2010). Long-range FC is the way of high metabolic and time costs to perform (Bullmore and Sporns, 2012; Liang et al., 2013), while short-range FC is the way of low metabolic and time costs (Raymond et al., 2005). Therefore, the rsFCS method is suitable for evaluating the T2DM-related brain alterations in terms of whole brain FC.
In this study, a data-driven whole-brain rsFCS method was used to evaluate the resting functional brain changes in 53 T2DM patients compared with 55 matched healthy controls (HCs). Additionally, the clusters with significant intergroup difference in rsFCS were defined as the seeds, and seed-based FC analysis was further conducted to explore the specific brain regions among which the FC changes leading to the rsFCS alterations. Correlation analysis was performed between altered FCS/FC and clinical/cognitive variables. We aimed to explore the early rsFCS alterations in T2DM patients, which may be helpful for understanding the neuromechanism of cognitive declines in T2DM patients.
Methods
Subjects
Fifty-nine right-handed T2DM patients from endocrinology department of Tianjin Medical University General Hospital and 59 matched euglycemia healthy controls (HCs) were recruited in our study. All of the patients were diagnosed as T2DM according to the 2010 criteria of the ADA (2010), and none of them had any T2DM-related complications including diabetic retinopathy, diabetic nephropathy or peripheral neuropathy. The diagnostic criteria and classification standard of retinopathy, hypoglycemia and neuropathy were all based on China Diabetes Society Special Issue Standards of care for type 2 diabetes in China-2010 version. The presence of retinopathy was ascertained using direct ophthalmoscopy performed by ophthalmologist; the peripheral neuropathy was determined by clinical examination; the nephropathy by laboratory test of microalbuminuria. All of the patients have no clinical record of severe hypoglycemia during the last 2 years, and self-reported no experience of severe hypoglycemia (such as developing a symptom of dizziness or confusion). Twenty-seven of the 59 T2DM patients controlled blood glucose with oral hypoglycemic agents; ten patients were under treatment with insulin; thirteen patients were treated with both insulin and oral hypoglycemic agents; and nine patients were treated with only moderate exercise and diet therapy.
Exclusion criteria for both groups included: (1) Mini-Mental State examination (MMSE) score <27; (2) psychiatric or neurologic disorders that could influence cognitive functions; (3) cerebrovascular accidents (screened by history and MR scan); (4) self-reported history of alcohol or substance abuse; (5) family history of dementia.
The protocol of this study was approved by the Ethical Committee of Tianjin Medical University General Hospital, and all of the participants provided written informed consent according to institutional guidelines.
Clinical Data and Neuropsychological Tests
Clinical data were collected, including weight, height, and blood pressure. Body mass index (BMI) was calculated as weight in kilograms divided by the square of height in meters. Blood pressure was measured while sitting at three different time points during the day and averaged. Blood samples were obtained after an overnight fast of at least 10 h to test the levels of fasting blood glucose (FBG), triglycerides (TG), total cholesterol (TC), low density lipoprotein cholesterol (LDL), high density lipoprotein cholesterol (HDL) and glycated hemoglobin (HbA1c).
A battery of neuropsychological tests was used to evaluate participants' general mental status and cognitive domains. The Mini-Mental State Exam (MMSE) was used to assess possible dementia (Folstein et al., 1975). The anxiety and depression were evaluated with Self-Rating Anxiety Scale (Zung, 1971) and Self-Rating Depressive Scale, respectively (Zung, 1965). The Auditory Verbal Learning Test (Rosenberg et al., 1984) was used to test short-term and long-term memory. Working memory was assessed with the forward and backward digit span tests (Powell and Hiatt, 1996). Information process speed was tested with trail making test A (TMT-A; Reitan, 2011). A modified version (Zhang et al., 2015) of the Attention Network Test reported by Fan et al. (2002) was used to evaluate attentional function. Executive function was evaluated with the Wisconsin Card Sorting Test (Grant and Berg, 1948). Raven's Standard Progressive Matrices was used to test the intelligence quotient (IQ).
MRI Data Acquisition
MRI data were acquired using a 3.0-Tesla MR scanner (Discovery MR750, GE Milwaukee, WI, USA). During scanning, foam pads and headphones were used to control head motion and decrease scanner noise as much as possible. The conventional T2 weighted images (T2WI), used to exclude the visible brain lesions, were acquired using a fast spin echo sequence with the following parameters: Repetition time (TR) = 3,400 ms, echo time (TE) = 85 ms, flip angle (FA) = 90°, field of view (FOV) = 256 mm × 256 mm, matrix = 256 × 256, slice thickness = 3 mm, slice gap = 1 mm. Sagittal three-dimensional T1-weighted images (3D-T1WI) were acquired by a brain volume (BRAVO) sequence with the following parameters: TR = 8.2 ms, TE = 3.2 ms, inversion time (TI) = 450 ms, FA = 12°, FOV = 256 mm × 256 mm, matrix = 256 × 256, slice thickness = 1 mm, no gap, and 188 sagittal slices. Resting-state functional BOLD images were acquired using a gradient-echo single shot echo planar imaging sequence with the following parameters: TR/TE = 2,000/45 ms, FOV = 220 mm × 220 mm, matrix = 64 × 64, FA = 90°, slice thickness = 4 mm, gap = 0.5 mm, 32 interleaved transverse slices, and 180 volumes. During fMRI scanning, all of participants were required to keep their eyes closed, relax, move as little as possible, think of nothing in particular, and not fall asleep during the fMRI scans. Before each fMRI acquisition, ten dummy scans were performed to allow the fMRI signals to reach a steady state.
Data Preprocessing and Metrics Calculations
Resting-state fMRI data were preprocessed using Statistical Parametric Mapping software (SPM8; http://www.fil.ion.ucl.ac.uk/spm). The first 10 volumes of each participant were deleted to allow the signal to reach equilibrium. The 170 remaining volumes were preprocessed with the following steps: correcting acquisition time delay between slices, head motion correction, regressing out nuisance covariates, temporal filtering (0.01–0.08 Hz), and normalization. The images were not smoothed so as to avoid introducing artificial local spatial correlation (Liu et al., 2015b). Nuisance covariates included six motion parameters, their first time derivations, and average BOLD signals of the cerebral spinal fluid and white matter. The global mean signal was not regressed out from the data (Hahamy et al., 2014). Next, the individual structural images were linearly registered to the mean functional images; the structural images were then linearly co-registered to Montreal Neurological Institute (MNI) space. Finally, each filtered functional volume was spatially normalized to MNI space using co-registration parameters and resampled into a voxel size of 3 × 3 × 3 mm3. Six T2DM patients and four HCs were excluded because of obvious head movement of larger than 2 mm translation in any axis or 2° rotation in any axis during fMRI scanning. Finally, the data from 53 T2DM patients and 55 HCs were included in analysis.
Whole-brain FC analysis were performed for the preprocessed data, and Pearson's correlation coefficients were calculated between the time series of each voxel and the other voxels within a whole brain gray matter mask (SPM8's gray matter probability template with a threshold of >0.3) (Feng et al., 2015), and a FC matrix was obtained for each participant. Because of the issue related to negative correlations on FC remains controversial (Murphy et al., 2009; Chai et al., 2012), we only performed analysis on long- and short-range positive rsFCS. Consistent with the previous study (Wang L. et al., 2014), a threshold of 0.2 was used to eliminate weak correlations possibly arising from signal noise. Then, the FC matrix was converted in to z-score using Fisher's z transformation to improve the normality. The rsFCS for a given voxel was calculated as the sum of the connectivities (z-values) between this voxel and all other voxels. Based on the anatomical distance, the rsFCS was divided into long- and short-range rsFCS (Guo et al., 2015). The long-range rsFCS of a given voxel was defined as the sum of the connectivities (z-values) between this voxel and other voxels with Euclidean distance of >75 mm from the MNI coordinate of this voxel, while the short-range rsFCS of a voxel was defined as the sum of the connectivities (z-values) with Euclidean distances of <75 mm (Achard et al., 2006; He et al., 2007). Finally, long- and short-range rsFCS maps were spatially smoothed using a Gaussian kernel of full-width at half-maximum (FWHM) of 6 mm. To determine whether the stability of rsFCS analysis was affected by the selection of correlation thresholds (0.2), rsFCS maps were also calculated based on two additional correlation thresholds (0.1 and 0.3).
To further examine the validity of the findings in the rsFCS analysis, a seed-based FC analysis was conducted. The seed was established as a sphere (6 mm in diameter) region of interest (ROI) centering at the peak coordinate of each cluster with a significant intergroup difference in long- or short-rang rsFCS. Pearson correlations were performed in each participant between the seed ROI and the other voxels within the gray matter masks. And then, a Fisher z-transform was applied to improve the normality of the correlation coefficients.
Previous study reported that GMV changes impact the FC (Bäuml et al., 2014; Kraus et al., 2014). Therefore, intergroup comparisons in GMV were also performed in this study. Three-dimension T1WI data were preprocessed using VBM8 tool-box (http://dbm.neuro.uni-jena.de/vbm/) of the SPM8 (Well-come Department of Imaging Neuroscience, London, UK; available at http://www.fil.ion.ucl.ac.uk/spm/software/spm8) implemented on MATLAB R2010a (Math Works Inc., Sherborn, MA, USA). First, brain tissues were segmented into gray matter, white matter, and cerebral spinal fluid and the gray matter segments were normalized to the MNI template by diffeomorphic anatomical registration through exponentiated lie algebra (DARTEL). The normalized GM segments were then modulated by dividing the Jacobian of the warp field to correct for local expansion or contraction (Liu et al., 2012). Finally, modulated gray matter images were smoothed with an isotropic Gaussian kernel of 8 mm full-width at half maximum.
Statistical Analysis
SPSS 21.0 (SPSS, Inc, Chiago.IL) was used to conduct the statistical analysis. Kolmogorov-Smirnovb test was performed to test normality of the demographic and clinical variables. For the normally distributed variables, the two-tailed independent samples t-tests were used. Non-normally distributed data were evaluated using the Mann-Whitney U-test. A chi-squared (χ2) test was used to assess intergroup difference in gender. The significant level was set as P < 0.05.
Voxel-wise two-sample t-test embedded in SPM8 was performed to exam the intergroup differences in the long- and short-range rsFCS after controlling for gender, age and years of education. Moreover, the same statistical steps were applied to rsFCS maps at the thresholds of 0.1 and 0.3.
The intergroup differences in the seed-based FC were tested using voxel-wise two-sample t-test embedded in SPM8 after controlling for age, gender and years of education (P < 0.05, AlphaSim correction). The clusters with intergroup difference in FC were also established as ROIs.
The ROI-based partial correlation analyses were conducted between rsFCS/FC and clinical/cognitive variables in the T2DM and HCs groups after controlling for age, gender and years of education. The significant level was set as P < 0.05. Bonferroni correction was used to control the multiple comparisons. Besides, the differences in correlation coefficients between the two groups were also assessed by z-test (P < 0.05, uncorrected).
The intergroup difference in GMV within whole brain was tested using voxel-based two-sample t-test embedded in SPM8 after controlling for age, gender and years of education.
Multiple comparisons correction for the intergroup compasions of rsFCS, seed-based FC and the GMV were performed using a Monte Carlo simulation (AlphaSim program in REST software, http://www.restfmri.net. Parameters: individual voxel P = 0.001, 1,000 simulations, smoothing kernel estimated using the T map, edge connected; with a global gray matter mask).
Results
Demographics and Clinical Results
Demographic, clinical and cognitive information of the T2DM patients and HCs are listed in Table 1. There were no significant intergroup differences in demographics or cognitive performance (P > 0.05). Compared with the controls, the patients had increased FBG (P < 0.001) and HbA1c (P < 0.001) levels.
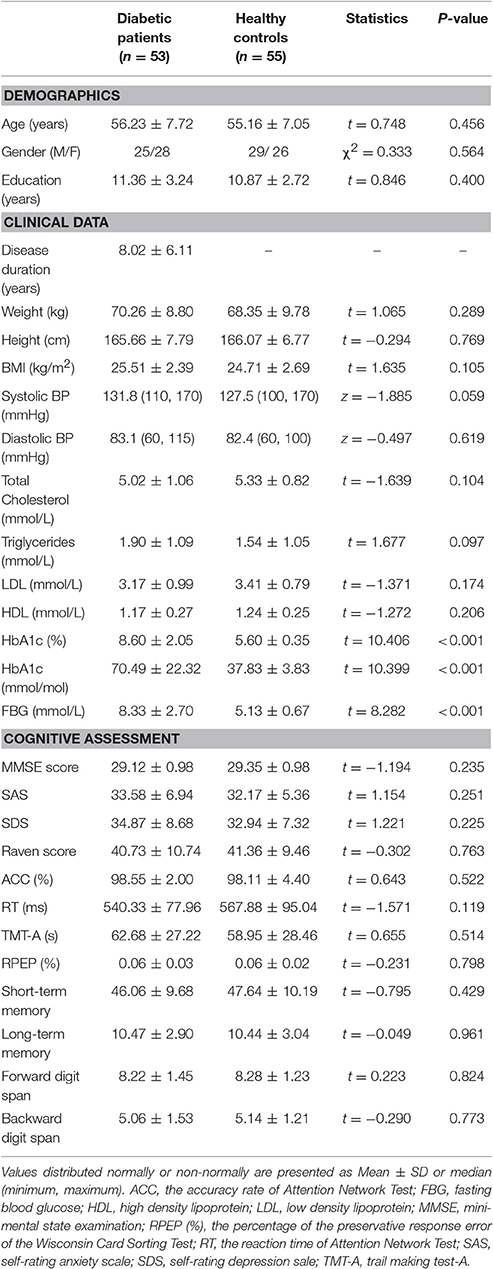
Table 1. Demographics, clinical data, cognitive assessment.
Intergroup Differences in rsFCS
Compared with the HCs, the T2DM patients exhibited weaker long-range rsFCS in the right insula(AlphaSim correction, cluster >40, cluster level P < 0.05), and weaker short-range rsFCS in the right supramarginalgyrus (SG) (AlphaSim correction, cluster >48, cluster level P < 0.05) after controlling for the age, gender and years of education (Table 2, Figure 1). These results were further verified to be reliable with the rsFCS analysis at the thresholds of 0.1 and 0.3 (Figure 2). The brain regions with significant intergroup difference in global-range rsFCS are highly overlapped with those in long-/short-range rsFCS (please see Supplementary Material).
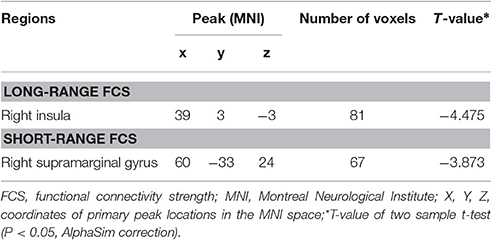
Table 2. Brain regions with weaker long-and short-range FCS in T2DM.
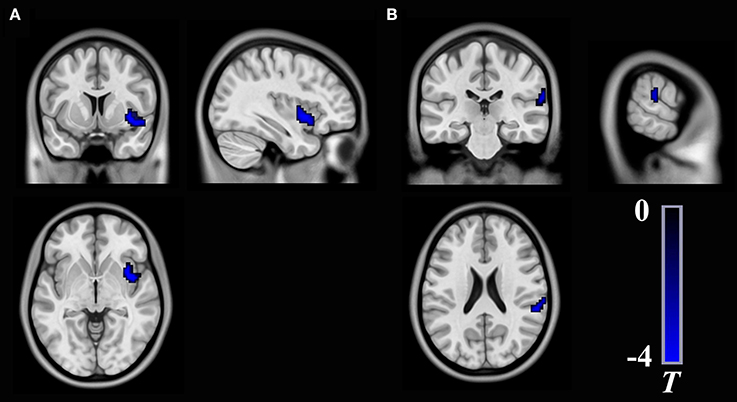
Figure 1. Brain regions show significant differences in long-range rsFCS (A) and short-range rsFCS (B) between T2DM patients and healthy controls. The color regions represent weaker rsFCS in patients with T2DM. The color bar indicates the T-value from two-sample t-tests. rsFCS, resting state functional connectivity strength.
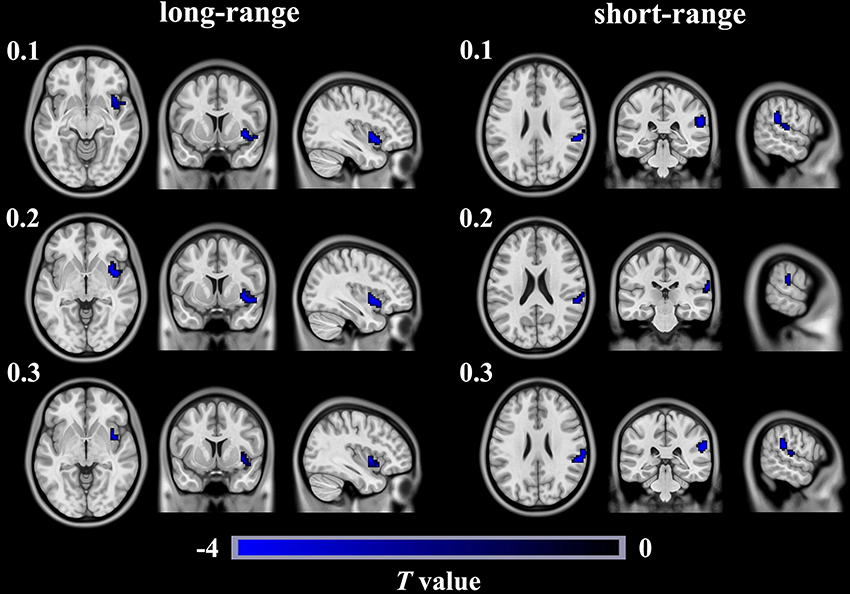
Figure 2. Brain regions show significant differences in long- and short- rangersFCS between T2DM patients and healthy controls in different thresholds of 0.1, 0.2, and 0.3. The color regions represent weaker long- or short- range rsFCS inpatients with T2DM than in healthy controls. The color bar indicates the T-value from two-sample t-tests. rsFCS, resting statefunctional connectivity strength.
Intergroup Differences in Seed-Based FC
As shown in Table 3 and Figure 3, the FC between the right insula and the left postcentral/precentral gyrus, the left superior parietal lobule (SPL) and right postcentral gyrus/SPL (long-range FC) decreased in T2DM patients compared with the HCs (AlphaSim correction, cluster >18, cluster level P < 0.05). Additionally, the T2DM patients have decreased FC between the right SG and the bilateral supplementary motor area (SMA), the right postcentralgyrus and the right SPL (short-range FC) (AlphaSim correction, cluster >21, cluster level P < 0.05).
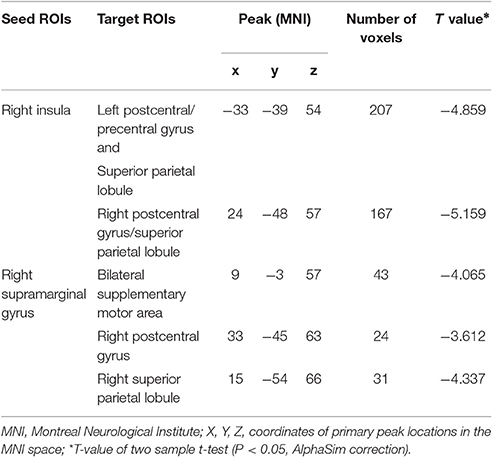
Table 3. Brain regions with decreased seed-based functional connectivity in T2DM.
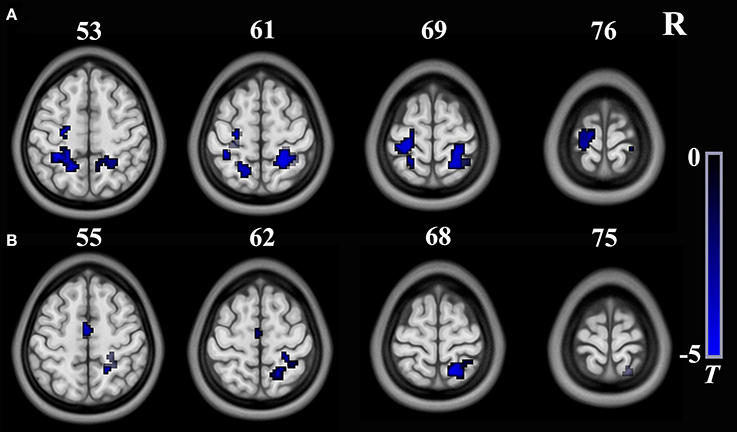
Figure 3. Brain regions show significant intergroup differences in seed-based FC. (A) The seed is the right insula from long-range rsFCS comparison; (B) The seed is theright supermarginal gyrus from short-range rsFCS comparison. The color regions represent decreased FC in patients. The color bar indicates the T-value from two-sample t-tests. FC, functional connectivity; rsFCS, resting state functional connectivity strength.
Correlations between the rsFCS/Seed-Based FC and Clinical/Cognitive Variables
There were no significant correlations between the rsFCS/seed-based FC and clinical/cognitive variables in the HCs (P > 0.05). Significant negative correlation was found between the long-range rsFCS of the right insula and HbA1c levels in T2DM patients (r = −0.361, P = 0.046; Figure 4). There was no significant difference in correlation coefficients between the two groups (z = 1.12, P = 0.263). Besides, there were no correlations between rsFCS and cognitive variables. The FC between the right SG and the bilateral SMA negatively correlated with TMT-A scores in T2DM patients (r = −0.436, P = 0.014; Figure 5). Moreover, the coefficient of the T2DM patients was lower than that of the healthy controls (z = −2, P = 0.046). However, when Bonferroni correction was performed for multiple comparisons, no correlation survived.
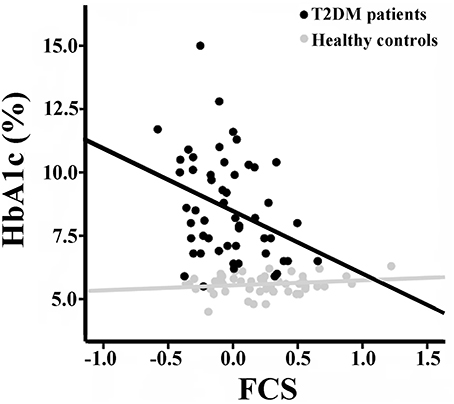
Figure 4. Correlation between the long-range rsFCS of right insula and HbA1c inboth groups. There is significant negative correlation in T2DM patients (r = −0.361, p = 0.046), but no correlation in healthy controls (r = 0.155, p = 0.327). There was no significant difference in correlation coefficients between the two groups (z = 1.12, P = 0.263). rsFCS, resting state functional connectivity strength.
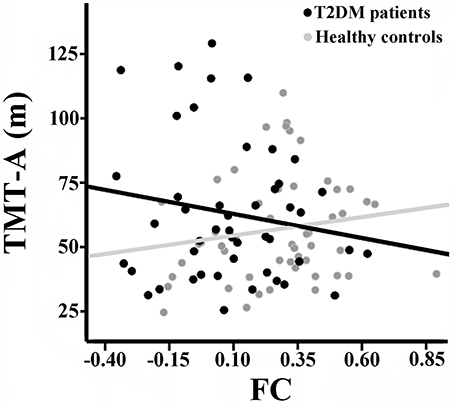
Figure 5. Correlation between TMT-A scores and the FC of the right SG with bilateral SMA in the two groups. There is significant negative correlation in T2DM patients (r = −0.436, p = 0.014), but no correlation in healthy controls (r = 0.071, p = 0.632). There was significant intergroup difference in the correlation coefficients (z = −2, P = 0.046). FC, functional connectivity strength; SG, supramarginal gyrus; SMA, supplementary motor area.
Intergroup Differences in GM Volumes
Voxel-wise comparisons revealed no significant difference in GMV within the whole brain between the two groups (AlphaSim correction, cluster >230, cluster level P < 0.05).
Discussion
So far as we know, this is the first study to investigate both long-range and short-range rsFCS in patients with T2DM. The T2DM patients exhibited weaker long-range rsFCS in the right insula and weaker short-range rsFCS in the right SG. Seed-based FC analysis revealed weaker FC between the right insula and the left postcentral/precentral gyrus, the left SPL and right postcentral gyrus/SPL, and between the right SG and the bilateral SMA, the right postcentral gyrus and the right SPL in the T2DM patients. In the T2DM patients, the long-range rsFCS in the right insula was negatively correlated with HbA1c levels; and the FC between the right SG and the bilateral SMA was negatively correlated with TMT-A scores.
Long-Range rsFCSalteration in T2DM Patients
In our results, the T2DM patients exhibited weaker long-range rsFCS in the right insula, and weaker FC between the right insula and the left postcentral/precentral gyrus, the left SPL and the right postcentral gyrus/SPL. The insula plays a crucial role in many cognitive functions, such as time processing (Kosillo and Smith, 2010), recognition memory (Bermudez-Rattoni, 2014), decision making (Smith et al., 2014) and speech production (Ackermann and Riecker, 2010). Previous studies have shown that the anterior insula is a central area for controlling human high-level cognition, such as attention processing (Brass and Haggard, 2010; Menon and Uddin, 2010; Nelson et al., 2010). The postcentral gyrus belongs to the somatosensory cortex, which participates in somatosensory stimulus processing, and involves attention processing by cooperating with the insula (Chen et al., 2010). Right anterior insula and precentral gyrus/SPL were also activated during performing attention task (Touroutoglou et al., 2012). Additionally, anterior insula cortex and somatosensory cortices are also involved in top-down and bottom-up information integration (Gu et al., 2013). Our study revealed the rsFCS in the right insula was negatively correlated with the HbA1c levels in T2DM patients, although cannot survived the multiple comparisons correction, which means higher level of blood glucose impacts the insular rsFCS. The correlation between the HbA1c levels and brain FC has also been reported in another study (Xia et al., 2015b). Although, previous studies have reported that high HbA1c levels correlated with cognition decline in T2DM patients (Allen et al., 2004; Zhou et al., 2010; Hui et al., 2015), ourT2DM patients exhibited no obvious cognitive impairments, which demonstrated that the rsFCS alteration in the right insula occurred before the obvious cognitive decline in T2DM patients. Therefore, it is plausible to speculate that the T2DM patients would exhibit impairments in insula-related cognitive functions with disease's development and occurrence of poor blood glucose control.
Short-Range rsFCSalteration in T2DM Patients
As an important part of inferior parietal lobule, SG is considered to be a pivotal joint area of the temporal, parietal, and occipital lobes (Hagmann et al., 2008). SG is involved in various cognitive processes, particularly in memory, language and attention (Deschamps et al., 2014; Humphreys and Ralph, 2015). In our study, weaker short-range rsFCS was observed in the right SG, which was attributed to the reduced FC between the right SG and the bilateral SMA, the right postcentral gyrus/SPL. A previous research showed that the SG had positive connectivity with SMA, postcentral gyrus and SPL in healthy volunteers and these areas were involved in sensorimotor processing and visual attention (Zhang and Li, 2014). Another study showed that in healthy people, the activation of SPL was correlated with attention switching ability in a distractor condition (Bledowski et al., 2004). Additionally, SG and SMA were activated during visual attention tasks (Linden et al., 1999) and the SPL mediated the selection biases in visual search tasks in healthy subjects (Pollmann et al., 2003). Liang et al. (2012) had also revealed decreased connectivity between SG and SPL in patients with mild cognitive impairment, which was related to attention regulation impairment. These studies demonstrated that the SG and its connectivity with SMA and SPL have important role in attention processing. Previous studies have shown that cognitive decline in patients with T2DM is mainly manifested in information-processing speed, memory, executive function and attention (Gregg et al., 2000; Hassing et al., 2004; Kanaya et al., 2004). In our study, significant negative correlation was observed between the TMT-A scores and the FC of the SG with the bilateral SMA (uncorrected). The TMT is a test of visual conceptual and visuo-motor tracking, and the TMT-A purportedly measures attention and visual search and motor function (Crowe, 1998). Our correlation results possibly indicated that altered FC of the SG with the bilateral SMA was associated with the performance of attention and visual search and motor function in T2DM patients.
Here we noticed that no correlation was found between rsFCS index and cognitive assessment, which may partially attribute to the different algorithm of rsFCS and FC. For the rsFCS algorithm, it is a summation of the connections between a given voxel and all other voxels. And for the FC, it evaluates the connection between the seed area and other voxels. FCS and FC reflect the different properties and different dimensions of functional connectivity. The correlations between the FC and imaging index may not exist between the FCS and imaging measures. Additionally, altered rsFCS may not have the direct associations with the imaging measures.
In this study, the T2DM patients exhibited weaker long- and short-range rsFCS. Previous researches have demonstrated that the long-range FC provides quick link between remote brain regions (Achard et al., 2006), and plays vital role in conducting cognitive function by traveling across multiple modules and realizing the information integration (He et al., 2008; Bullmore and Sporns, 2012). Different from the long-range FC, the short-range FC is lower metabolic and time costs so that predicted stronger functional connectivity between neighboring brain regions (Raymond et al., 2005). In a study by Dai et al. (2015) reported that long-range FC is easy to be damaged in patients with Alzheimer's disease. However, our results demonstrated T2DM patients had both long- and short-range rsFCS alterations and did not exhibit dominant long-range rsFCS change like that in Alzheimer's disease. Given long- and short-range FC have different physiological basis and functions, the difference between our and Dai's results might be attribute to the different pathophysiological basis of the two diseases.
There are still some notable limitations. First, this study is a cross-sectional study, which could not monitor the dynamic alterations in cognitive functions of the T2DM patients. A follow up study would be necessary to evaluate the value of rsFCS in predicting the cognitive decline in T2DM patients. Second, the neuropsychological tests used in this study were not comprehensive and sensitive enough and may cannot detect some subtle cognitive impairments. Third, the long- and short-range rsFCS cut off point of 75 mm is arbitrary to some extent. Finally, the T2DM patients in our study received treatment with different methods; treatment-related effect should be noted as a limitation.
Conclusion
To the best of our knowledge, this is the first study to evaluate the long- and short-range rsFCS among whole gray matter in T2DM patients. The T2DM patients exhibited weaker long-range rsFCS in the right insula and weaker short-range rsFCS in the right SG. Our results indicate that the rsFCS alteration occurs before obvious cognitive deficits and may be helpful for understanding the neuromechanism of cognitive declines in T2DM patients.
Author Contributions
LL, YZ, and QZ designed research; LL, YZ, WQ, SL, and QZ performed research; LL and YZ were involved in the clinical assessment; LL, YZ, WQ, and QZ analyzed data; LL, YZ, WL, and QZ wrote the paper.
Conflict of Interest Statement
The authors declare that the research was conducted in the absence of any commercial or financial relationships that could be construed as a potential conflict of interest.
Acknowledgments
This work was supported by the Natural Science Foundation of Tianjin, China (17JCZDJC36300).
Supplementary Material
The Supplementary Material for this article can be found online at: http://journal.frontiersin.org/article/10.3389/fnins.2017.00390/full#supplementary-material
References
Achard, S., Salvador, R., Whitcher, B., Suckling, J., and Bullmore, E. (2006). A resilient, low-frequency, small-world human brain functional network with highly connected association cortical hubs. J. Neurosci. 26, 63–72. doi: 10.1523/JNEUROSCI.3874-05.2006
Ackermann, H., and Riecker, A. (2010). The contribution(s) of the insula to speech production: a review of the clinical and functional imaging literature. Brain Struct. Funct. 214, 419–433. doi: 10.1007/s00429-010-0257-x
Allen, K. V., Frier, B. M., and Strachan, M. W. J. (2004). The relationship between type 2 diabetes and cognitive dysfunction: longitudinal studies and their methodological limitations. Eur. J. Pharmacol. 490, 169–175. doi: 10.1016/j.ejphar.2004.02.054
American Diabetes Association. (2010). Diagnosis and classification of diabetes mellitus. Diabetes Care 33, S42–S47. doi: 10.2337/dc10-S062
Barkhof, F., Haller, S., and Rombouts, S. A. (2014). Resting-state functional MR imaging: a new window to the brain. Radiology 272, 29–49. doi: 10.1148/radiol.14132388
Bäuml, J. G., Daamen, M., Meng, C., Neitzel, J., Scheef, L., Jaekel, J., et al. (2014). Correspondence between aberrant intrinsic network connectivity and gray-matter volume in the ventral brain of preterm born adults. Cereb. Cortex 25, 569–570. doi: 10.1093/cercor/bhu133
Bermudez-Rattoni, F. (2014). The forgotten insular cortex: its role on recognition memory formation. Neurobiol. Learn. Mem. 109, 207–216. doi: 10.1016/j.nlm.2014.01.001
Bledowski, C., Prvulovic, D., Goebel, R., Zanella, F. E., and Linden, D. E. J. (2004). Attentional systems in target and distractor processing: a combined ERP and fMRI study. Neuroimage 22, 530–540. doi: 10.1016/j.neuroimage.2003.12.034
Brass, M., and Haggard, P. (2010). The hidden side of intentional action: the role of the anterior insular cortex. Brain Struct. Funct. 214, 603–610. doi: 10.1007/s00429-010-0269-6
Bullmore, E., and Sporns, O. (2012). The economy of brain network organization. Nat. Rev. Neurosci. 13, 336–349. doi: 10.1038/nrn3214
Chai, X. J., Castañón, A. N., Ngür, D., and Whitfield-Gabrieli, S. (2012). Anticorrelations in resting state networks without global signal regression. Neuroimage 59, 1420–1428. doi: 10.1016/j.neuroimage.2011.08.048
Chen, T. L., Babiloni, C., Ferretti, A., Perrucci, M. G., Romani, G. L., Rossini, P. M., et al. (2010). Effects of somatosensory stimulation and attention on human somatosensory cortex: an fMRI study. Neuroimage 53, 181–188. doi: 10.1016/j.neuroimage.2010.06.023
Chen, Y.-C., Jiao, Y., Cui, Y., Shang, S.-A., Ding, J., Feng, Y., et al. (2014). Aberrant brain functional connectivity related to insulin resistance in type 2 diabetes: a resting-state fMRI study. Diabetes Care 37, 1689–1696. doi: 10.2337/dc13-2127
Chen, Y. C., Xia, W., Qian, C., Ding, J., Ju, S., and Teng, G. J. (2015b). Thalamic resting-state functional connectivity: disruption in patients with type 2 diabetes. Metab. Brain Dis. 30, 1227–1236. doi: 10.1007/s11011-015-9700-2.
Chen, Y. C., Liu, Z., Zhang, J., Tian, G., Li, L., Zhang, S., et al. (2015a). Selectively Disrupted Functional Connectivity Networks in Type 2 Diabetes Mellitus. Front. Aging Neurosci. 7:233. doi: 10.3389/fnagi.2015.00233
Cheng, G., Huang, C., Deng, H., and Wang, H. (2012). Diabetes as a risk factor for dementia and mild cognitive impairment: a meta−analysis of longitudinal studies. Intern. Med. J. 42, 484–491. doi: 10.1111/j.1445-5994.2012.02758.x
Crowe, S. F. (1998). The differential contribution of mental tracking, cognitive flexibility, visual search, and motor speed to performance of parts A and B of trail making test. J. Clin. Psychol. 54, 585–591. doi: 10.1002/(SICI)1097-4679(199808)54:5<585::AID-JCLP4>3.0.CO;2-K
Cui, Y., Jiao, Y., Chen, H.-J., Ding, J., Luo, B., Peng, C.-Y., et al. (2015). Aberrant functional connectivity of default-mode network in type 2 diabetes patients. Eur. Radiol. 25, 3238–3246. doi: 10.1007/s00330-015-3746-8
Cui, Y., Jiao, Y., Chen, Y. C., Wang, K., Gao, B., Wen, S., et al. (2014). Altered spontaneous brain activity in type 2 diabetes: a resting-state functional MRI study. Diabetes 63, 749–760. doi: 10.2337/db13-0519
Dai, Z., Yan, C., Li, K., Wang, Z., Wang, J., Cao, M., et al. (2015). Identifying and mapping connectivity patterns of brain network hubs in Alzheimer's Disease. Cereb. Cortex 25, 3723–3742. doi: 10.1093/cercor/bhu246
De Bresser, J., Tiehuis, A. M., Van Den Berg, E., Reijmer, Y. D., Jongen, C., Kappelle, L. J., et al. (2010). Progression of cerebral atrophy and white matter hyperintensities in patients with type 2 diabetes. Diabetes Care 33, 1309–1314. doi: 10.2337/dc09-1923
Deschamps, I., Baum, S. R., and Gracco, V. L. (2014). On the role of the supramarginal gyrus in phonological processing and verbal working memory: evidence from rTMS studies. Neuropsychologia 53, 39–46. doi: 10.1016/j.neuropsychologia.2013.10.015
Fan, J., McCandliss, B. D., Sommer, T., Raz, A., and Posner, M. I. (2002). Testing the efficiency and independence of attentional networks. J. Cogn. Neurosci. 14, 340–347. doi: 10.1162/089892902317361886
Feng, L., Zhu, C., Wang, Y., Guo, W., Li, M., Wang, W., et al. (2015). Disrupted cortical hubs in functional brain networks in social anxiety disorder. Clin. Neurophysiol. 126, 1711–1716. doi: 10.1016/j.clinph.2014.11.014
Folstein, M. F., Folstein, S. E., and McHugh, P. R. (1975). “Mini-mental state”: a practical method for grading the cognitive state of patients for the clinician. J. Psychiatr. Res. 12, 189–198. doi: 10.1016/0022-3956(75)90026-6
Gispen, W. H., and Biessels, G.-J. (2000). Cognition and synaptic plasticity in diabetes mellitus. Trends Neurosci. 23, 542–549. doi: 10.1016/S0166-2236(00)01656-8
Grant, D. A., and Berg, E. A. (1948). A behavioral analysis of degree of reinforcement and ease of shifting to new responses in a Weigl-type card-sorting problem. J. Exp. Psychol. 38, 404–411. doi: 10.1037/h0059831
Gregg, E. W., Yaffe, K., Cauley, J. A., Rolka, D. B., Blackwell, T. L., Narayan, K. M., et al. (2000). Is diabetes associated with cognitive impairment and cognitive decline among older women? Study of Osteoporotic Fractures Research Group. Arch. Intern. Med. 160:174. doi: 10.1001/archinte.160.2.174
Greicius, M. (2008). Resting-state functional connectivity in neuropsychiatric disorders. Curr. Opin. Neurol. 21, 424–430. doi: 10.1097/WCO.0b013e328306f2c5
Greicius, M. D., Krasnow, B., Reiss, A. L., and Menon, V. (2003). Functional connectivity in the resting brain: a network analysis of the default mode hypothesis. Proc. Natl. Acad. Sci. U.S.A. 100, 253. doi: 10.1073/pnas.0135058100
Gu, X., Hof, P. R., Friston, K. J., and Fan, J. (2013). Anterior insular cortex and emotional awareness. J. Comp. Neurol. 521, 3371–3388. doi: 10.1002/cne.23368
Guo, W., Liu, F., Chen, J., Wu, R., Zhang, Z., Yu, M., et al. (2015). Decreased long- and short-range functional connectivity at rest in drug-naive major depressive disorder. Aust. N. Z. J. Psychiatry. 50, 763–769. doi: 10.1177/0004867415577978
Hagmann, P., Cammoun, L., Gigandet, X., Meuli, R., Honey, C. J., Wedeen, V. J., et al. (2008). Mapping the Structural Core of Human Cerebral Cortex. PLoS Biol. 6:e159. doi: 10.1371/journal.pbio.0060159
Hahamy, A., Calhoun, V., Pearlson, G., Harel, M., Stern, N., Attar, F., et al. (2014). Save the Global: global signal connectivity as a tool for studying clinical populations with functional magnetic resonance imaging. Brain Connect. 4, 395–403. doi: 10.1089/brain.2014.0244
Haight, T. J., Bryan, R. N., Erus, G., Davatzikos, C., Jacobs, D. R., D'esposito, M., et al. (2015). Vascular risk factors, cerebrovascular reactivity, and the default-mode brain network. Neuroimage 115, 7–16. doi: 10.1016/j.neuroimage.2015.04.039
Hassing, L. B., Grant, M. D., Hofer, S. M., Pedersen, N. L., Nilsson, S. E., Berg, S., et al. (2004). Type 2 diabetes mellitus contributes to cognitive decline in old age: a longitudinal population-based study. J. Int. Neuropsychol. Soc. 10, 599–607. doi: 10.1017/S1355617704104165
He, Y., Chen, Z. J., and Evans, A. C. (2007). Small-world anatomical networks in the human brain revealed by cortical thickness from MRI. Cereb. Cortex 17, 2407–2419. doi: 10.1093/cercor/bhl149
He, Y., Wang, J., Wang, L., Chen, Z. J., Yan, C., Yang, H., et al. (2008). Uncovering intrinsic modular organization of spontaneous brain activity in humans. PLoS ONE 4:e5226. doi: 10.1371/journal.pone.0005226
Hui, Z., Ying, H., Bradley, M., Peter, N., William, M., Jue, Z., et al. (2015). Intranasal insulin enhanced resting-state functional connectivity of hippocampal regions in type 2 diabetes. Diabetes 64, 1025–1034. doi: 10.2337/db14-1000
Humphreys, G. F., and Ralph, M. A. L. (2015). Fusion and fission of cognitive functions in the human parietal cortex. Cereb. Cortex 25, 393–399. doi: 10.1093/cercor/bhu198
Janson, J., Laedtke, T., Parisi, J. E., O'Brien, P., Petersen, R. C., and Butler, P. C. (2004). Increased risk of type 2 diabetes in Alzheimer disease. Diabetes 53, 474–481. doi: 10.2337/diabetes.53.2.474
Kanaya, A. M., Barrett-Connor, E., Gildengorin, G., and Yaffe, K. (2004). Change in cognitive function by glucose tolerance status in older adults: a 4-year prospective study of the Rancho Bernardo study cohort. Arch. Intern. Med. 164:1327. doi: 10.1001/archinte.164.12.1327
Kosillo, P., and Smith, A. T. (2010). The role of the human anterior insular cortex in time processing. Brain Struct. Funct. 214, 623–628. doi: 10.1007/s00429-010-0267-8
Kraus, C., Ganger, S., Losak, J., Hahn, A., Savli, M., Kranz, G. S., et al. (2014). Gray matter and intrinsic network changes in the posterior cingulate cortex after selective serotonin reuptake inhibitor intake. Neuroimage 84, 236–244. doi: 10.1016/j.neuroimage.2013.08.036
Kumar, A., Haroon, E. C., Pham, D., Ajilore, O., Rodriguez, G., and Mintz, J. (2008). Gray matter prefrontal changes in type 2 diabetes detected using MRI. J. Mag. Reson. Imaging 27, 14–19. doi: 10.1002/jmri.21224
Liang, P., Wang, Z., Yang, Y., and Li, K. (2012). Three subsystems of the inferior parietal cortex are differently affected in mild cognitive impairment. J. Alzheimers Dis. 30, 475–487. doi: 10.3233/JAD-2012-111721
Liang, X., Zou, Q., He, Y., and Yang, Y. (2013). Coupling of functional connectivity and regional cerebral blood flow reveals a physiological basis for network hubs of the human brain. Proc. Natl. Acad. Sci. 110, 1929–1934. doi: 10.1073/pnas.1214900110
Linden, D., Prvulovic, D. E., Vollinger, M., Zanella, F., Goebel, R., and Dierks, T. (1999). The functional neuroanatomy of target detection: an fMRI study of visual and auditory oddball tasks. Cereb. Cortex 9, 815–823. doi: 10.1093/cercor/9.8.815
Liu, F., Guo, W., Fouche, J. P., Wang, Y., Wang, W., Ding, J., et al. (2015a). Multivariate classification of social anxiety disorder using whole brain functional connectivity. Brain Struct. Funct. 220, 101–115. doi: 10.1007/s00429-013-0641-4
Liu, F., Guo, W., Yu, D., Gao, Q., Gao, K., Xue, Z., et al. (2012). Classification of different therapeutic responses of major depressive disorder with multivariate pattern analysis method based on structural MR scans. PLoS ONE 7:e40968. doi: 10.1371/journal.pone.0040968
Liu, F., Wang, Y., Li, M., Wang, W., Li, R., Zhang, Z., et al. (2017). Dynamic functional network connectivity in idiopathic generalized epilepsy with generalized tonic-clonic seizure. Hum. Brain Mapp. 38, 957–973. doi: 10.1002/hbm.23430
Liu, F., Xie, B., Wang, Y., Guo, W., Fouche, J. P., Long, Z., et al. (2015b). Characterization of post-traumatic stress disorder using resting-state fMRI with a multi-level parametric classification approach. Brain Topogr. 28, 1–17. doi: 10.1007/s10548-014-0386-2
Lowe, M. J., Phillips, M. D., Lurito, J. T., Mattson, D., Dzemidzic, M., and Mathews, V. P. (2002). Multiple sclerosis: low-frequency temporal blood oxygen level-dependent fluctuations indicate reduced functional connectivity initial results. Radiology 224, 184–192. doi: 10.1148/radiol.2241011005
Menon, V., and Uddin, L. Q. (2010). Saliency, switching, attention and control: a network model of insula function. Brain Struct. Funct. 214, 655–667. doi: 10.1007/s00429-010-0262-0
Moran, C. (2013). Brain Atrophy in Type 2 Diabetes. Diabetes Care 36, 4036–4042. doi: 10.2337/dc13-0143
Murphy, K., Birn, R. M., Handwerker, D. A., Jones, T. B., and Bandettini, P. A. (2009). The impact of global signal regression on resting state correlations: are anti-correlated networks introduced? Neuroimage 44, 893–905. doi: 10.1016/j.neuroimage.2008.09.036
Musen, G., Jacobson, A. M., Bolo, N. R., Simonson, D. C., Shenton, M. E., McCartney, R. L., et al. (2012). Resting-state brain functional connectivity is altered in type 2 diabetes. Diabetes 61, 2375–2379. doi: 10.2337/db11-1669
Nelson, S. M., Dosenbach, N. U. F., Cohen, A. L., Wheeler, M. E., Schlaggar, B. L., and Petersen, S. E. (2010). Role of the anterior insula in task-level control and focal attention. Brain Struct. Funct. 214, 669–680. doi: 10.1007/s00429-010-0260-2
Peng, J., Qu, H., Peng, J., Luo, T. Y., Lv, F. J., Chen, L., et al. (2016). Abnormal spontaneous brain activity in type 2 diabetes with and without microangiopathy revealed by regional homogeneity. Eur. J. Radiol. 85, 607–615. doi: 10.1016/j.ejrad.2015.12.024
Pollmann, S., Weidner, R., Humphreys, G. W., Olivers, C. N. L., Müller, K., Lohmann, G., et al. (2003). Separating distractor rejection and target detection in posterior parietal cortex—an event-related fMRI study of visual marking. Neuroimage 18, 310–323. doi: 10.1016/S1053-8119(02)00036-8
Powell, D. H., and Hiatt, M. D. (1996). Auditory and visual recall of forward and backward digit spans. Percept. Mot. Skills 82, 1099–1103. doi: 10.2466/pms.1996.82.3c.1099
Ran-Ran Huang, M. D., Bao-Hui Jia, M. D., Lei, X. M., Phd, S.-H. M. M., Jing-Jing Yin, M. D., Zong-Bo Sun, M. D., et al. (2015). Spatial working memory impairment in primary onset middle-age type 2 diabetes mellitus: an ethology and BOLD-fMRI study. J. Mag. Reson. Imaging 43, 75–87. doi: 10.1002/jmri.24967
Raymond, S., John, S., Coleman, M. R., Pickard, J. D., David, M., and Ed, B. (2005). Neurophysiological architecture of functional magnetic resonance images of human brain. Cereb. Cortex 15, 1332–1342. doi: 10.1093/cercor/bhi016
Reitan, R. M. (2011). Validity of the trail making test as an indicator of organic brain damage. Percept. Motor Skills 8, 271–276. doi: 10.2466/pms.1958.8.3.271
Rosazza, C., and Minati, L. (2011). Resting-state brain networks: literature review and clinical applications. Neurol. Sci. 32, 773–785. doi: 10.1007/s10072-011-0636-y
Rosenberg, S. J., Ryan, J. J., and Aurelio, P. (1984). Rey auditory-verbal learning test performance of patients with and without memory impairment. J. Clin. Psychol. 40, 785–787. doi: 10.1002/1097-4679(198405)40:3<785::AID-JCLP2270400325>3.0.CO;2-4
Sepulcre, J., Liu, H., Talukdar, T., Martincorena, I., Yeo, B. T. T., and Buckner, R. L. (2010). The organization of local and distant functional connectivity in the human brain. PLoS Comput. Biol. 6:e1000808. doi: 10.1371/journal.pcbi.1000808
Smith, A. R., Steinberg, L., and Chein, J. (2014). The role of the anterior insula in adolescent decision making. Dev. Neurosci. 36, 196–209. doi: 10.1159/000358918
Tan, Z. S., Beiser, A. S., Fox, C. S., Au, R., Himali, J. J., Debette, S., et al. (2011). Association of metabolic dysregulation with volumetric brain magnetic resonance imaging and cognitive markers of subclinical brain aging in middle-aged adults the framingham offspring study. Diabetes Care 34, 1766–1770. doi: 10.2337/dc11-0308
Touroutoglou, A., Hollenbeck, M., Dickerson, B. C., and Barrett, L. F. (2012). Dissociable large-scale networks anchored in the right anterior insula subserve affective experience and attention. Neuroimage 60, 1947–1958. doi: 10.1016/j.neuroimage.2012.02.012
Wang, C. X., Fu, K. L., Liu, H. J., Xing, F., and Zhang, S. Y. (2014). Spontaneous brain activity in type 2 diabetics revealed by amplitude of low-frequency fluctuations and its association with diabetic vascular disease: a resting-state FMRI study. PLoS ONE 9:e108883. doi: 10.1371/journal.pone.0108883
Wang, L., Dai, Z., Peng, H., Tan, L., Ding, Y., He, Z., et al. (2014). Overlapping and segregated resting-state functional connectivity in patients with major depressive disorder with and without childhood neglect. Hum. Brain Map. 35, 1154–1166. doi: 10.1002/hbm.22241
Wood, A. G., Chen, J., Christopher, M., Thanh, P., Richard, B., Kimberley, C., et al. (2016). Brain activation during memory encoding in Type 2 diabetes mellitus: a discordant twin pair study. J. Diabetes Res. 2016, 1–10. doi: 10.1155/2016/3978428
Xia, W., Zhang, B., Yang, Y., Wang, P., Yang, Y., and Wang, S. (2014). Poorly controlled cholesterol is associated with cognitive impairment in T2DM: a resting-state fMRI study. Lipids Health Dis. 14:47. doi: 10.1186/s12944-015-0046-x
Xia, W., Wang, S., Rao, H., Spaeth, A. M., Wang, P., Yang, Y., et al. (2015a). Disrupted resting-state attentional networks in T2DM patients. Sci. Rep. 5:11148. doi: 10.1038/srep11148
Xia, W., Wang, S., Spaeth, A. M., Rao, H., Wang, P., Yang, Y., et al. (2015b). Insulin resistance-associated interhemispheric functional connectivity alterations in T2DM: a resting-state fMRI Study. Biomed. Res. Int. 2015, 1–9. doi: 10.1155/2015/719076
Xia, W., Wang, S., Sun, Z., Bai, F., Zhou, Y., Yang, Y., et al. (2013). Altered baseline brain activity in type 2 diabetes: a resting-state fMRI study. Psychoneuroendocrinology 38, 2493–2501. doi: 10.1016/j.psyneuen.2013.05.012
Yang, S. Q., Xu, Z. P., Xiong, Y., Zhan, Y. F., Guo, L. Y., Zhang, S., et al. (2016). Altered intranetwork and internetwork functional connectivity in Type 2 diabetes mellitus with and without cognitive impairment. Sci. Rep. 6:32980. doi: 10.1038/srep32980
Zang, Y. F., He, Y., Zhu, C. Z., Cao, Q. J., Sui, M. Q., Liang, M., et al. (2007). Altered baseline brain activity in children with ADHD revealed by resting-state functional MRI. Brain Dev. 29, 83–91. doi: 10.1016/j.braindev.2006.07.002
Zang, Y., Jiang, T., Lu, Y., He, Y., and Tian, L. (2004). Regional homogeneity approach to fMRI data analysis. Neuroimage 22, 394–400. doi: 10.1016/j.neuroimage.2003.12.030
Zhang, S., and Li, C. S. R. (2014). Functional clustering of the human inferior parietal lobule by whole-brain connectivity mapping of resting-state functional magnetic resonance imaging signals. Brain Connect. 4, 53–69. doi: 10.1089/brain.2013.0191
Zhang, Y., Du, G., Yang, Y., Qin, W., Li, X., and Zhang, Q. (2015). Higher integrity of the motor and visual pathways in long-term video game players. Front. Hum. Neurosci. 9:98. doi: 10.3389/fnhum.2015.00098
Zhou, H., Lu, W., Shi, Y., Bai, F., Chang, J., Yuan, Y., et al. (2010). Impairments in cognition and resting-state connectivity of the hippocampus in elderly subjects with type 2 diabetes. Neurosci. Lett. 473, 5–10. doi: 10.1016/j.neulet.2009.12.057
Zhou, X., Zhang, J., Chen, Y., Ma, T., Wang, Y., Wang, J., et al. (2014). Aggravated cognitive and brain functional impairment in mild cognitive impairment patients with type 2 diabetes: a resting-state functional MRI study. J. Alzheimers Dis. 41, 925–935. doi: 10.3233/JAD-132354
Zhuo, C., Zhu, J., Qin, W., Qu, H., Ma, X., Tian, H., et al. (2014). Functional connectivity density alterations in schizophrenia. Front. Behav. Neurosci. 8:404. doi: 10.3389/fnbeh.2014.00404
Zung, W. W. (1965). A self-rating depression scale. Arch. Gen. Psychiatry 12, 63–70. doi: 10.1001/archpsyc.1965.01720310065008
Keywords: type 2 diabetes mellitus, resting state functional connectivity strength, insula, supramarginalgyrus, fMRI
Citation: Liu L, Li W, Zhang Y, Qin W, Lu S and Zhang Q (2017) Weaker Functional Connectivity Strength in Patients with Type 2 Diabetes Mellitus. Front. Neurosci. 11:390. doi: 10.3389/fnins.2017.00390
Received: 22 October 2016; Accepted: 22 June 2017;
Published: 07 July 2017.
Edited by:
Åke Sjöholm, Gävle Hospital, SwedenReviewed by:
Xin Di, New Jersey Institute of Technology, United StatesEelco Van Duinkerken, VU University Medical Center, Netherlands
Copyright © 2017 Liu, Li, Zhang, Qin, Lu and Zhang. This is an open-access article distributed under the terms of the Creative Commons Attribution License (CC BY). The use, distribution or reproduction in other forums is permitted, provided the original author(s) or licensor are credited and that the original publication in this journal is cited, in accordance with accepted academic practice. No use, distribution or reproduction is permitted which does not comply with these terms.
*Correspondence: Quan Zhang, emhhbmdxdWFuMDkxMkAxNjMuY29t
†These authors have contributed equally to this work.