 Chunmei Li1
 Min Chen1*
 Xuna Zhao2Rui Wang1
 Haibo Chen3Wen Su3Shuhua Li3Baohui Lou1Guodong Song1Shuai Zhang1Jintao Zhang1
 Jinyuan Zhou2
- 1Department of Radiology, Beijing Hospital, National Center of Gerontology, Beijing, China
- 2Department of Radiology, Johns Hopkins University, Baltimore, MD, United States
- 3Department of Neurology, Beijing Hospital, National Center of Gerontology, Beijing, China
The early diagnosis of Parkinson's disease (PD) and the accurate evaluation of disease severity are crucial for intervention and treatment in PD patients. In this study, we applied chemical exchange saturation transfer (CEST) imaging to patients at different stages of PD and explored the clinical value of the CEST signal loss of the substantia nigra as an imaging biomarker of PD. The measured CEST signal intensities (including amide proton transfer-weighted or APTw, and total CEST or CESTtotal) of the substantia nigra in PD patients showed a significantly decreased tendency with PD progression. Compared to normal controls, the APTw and CESTtotal intensities of PD patients significantly decreased at both the early and advanced or late stages. These APTw and CESTtotal values of the substantia nigra were also significantly lower in advanced or late stage PD patients than in early stage PD patients. For PD patients with unilateral symptoms, the APTw and CESTtotal values in the substantia nigra on the affected side were significantly lower than those in normal controls. Both the APTw and CESTtotal values of PD were significantly correlated with the severity of disease and disease duration. Our findings suggest that the CEST MRI signal of the substantia nigra is a potential imaging biomarker for the diagnosis and monitoring of the severity of PD.
Introduction
Parkinson's disease (PD) is a common progressive neurodegenerative disease characterized by the loss of dopaminergic neurons in the substantia nigra (Fearnley and Lees, 1991). Currently, the diagnosis of PD is mainly based on the clinical manifestations. Therefore, the accuracy of the diagnosis is often unsatisfactory, even for experienced movement-disorder specialists (Hughes et al., 1992; Tolosa et al., 2006). The situation is even worse for patients at the early stage of PD, when the clinical manifestations can be atypical. However, the early detection of PD would make early intervention possible, which may greatly improve the prognosis for PD patients. In addition to the diagnosis, monitoring disease severity, which plays an important role in disease-modifying therapy, is also crucial for PD patients. Consequently, it is essential to find a novel, reliable method for PD diagnosis and severity evaluation.
Previous studies have indicated that the dopaminergic neuron loss in the substantia nigra has a strong correlation with the progressive clinical manifestations of PD (Ma et al., 1997), which makes substantia nigra imaging a promising biomarker for the diagnosis and severity evaluation in PD patients. With the rapid development of medical imaging techniques, various novel MR techniques have been used in the PD research focused on the substantia nigra, including diffusion tensor imaging (Kim et al., 2013; Aquino et al., 2014; Du et al., 2014), susceptibility-weighted imaging (Cosottini et al., 2014; He et al., 2015), functional MR imaging (Ellmore et al., 2013; Manza et al., 2016), and MR spectroscopy (Zhou et al., 2014; Seraji-Bozorgzad et al., 2015). However, in clinic no reliable in vivo MR biomarkers have been found, as yet, for PD diagnosis and severity evaluation.
Recently, a new class of MRI contrast, termed chemical exchange saturation transfer (CEST) (Ward et al., 2000), has been proposed. CEST imaging is a new molecular MRI method that allows detection of low-concentration chemicals with exchangeable protons through the water signal (Zhou and Van Zijl, 2006; Sherry and Woods, 2008). Based on the CEST approach, Zhou et al. have proposed a technique called amide proton transfer (APT) imaging (Zhou et al., 2003), which can generate image contrast based on endogenous cellular proteins and peptides in tissue. In recent years, different groups have performed a number of clinical investigations, ranging from neoplastic disorders [in the brain (Zhou et al., 2013b; Togao et al., 2014; Jiang et al., 2016), prostate (Jia et al., 2011), breast (Dula et al., 2013), and neck (Yuan et al., 2014)] to non-oncologic diseases [such as cerebral ischemia (Sun et al., 2007; Tietze et al., 2014; Harston et al., 2015), epilepsy (Davis et al., 2015), and pediatric brain development and delay (Zhang et al., 2016)]. In our recent work, it was revealed that the CEST/APT signals in the substantia nigra were decreased (Li et al., 2014), especially for the advanced stage of PD. Although we found the potential of CEST/APT in the detection and classification of PD patients firstly, there are still some issues need further investigation, such as the correlation between CEST/APT and PD severity.
The aim of this study was to assess the potential of using the CEST/APT signal in the substantia nigra as a biomarker in the diagnosis and evaluation of PD progression. We classified patients according to the H&Y scale and the disease duration, and analyzed the CEST/APT signal intensity changes of PD patients at different stages. We also assessed the CEST/APT signal intensity in the bilateral substantia nigra of PD patients with unilateral symptoms. In addition, we evaluated the correlations between CEST/APT signal intensity in the substantia nigra and the severity of PD, quantified by several different clinical scales.
Materials and Methods
Subjects
Sixty-one PD patients (34 men and 27 women; mean age 63 years) and 24 normal controls (13 men and 11 women; mean age 65 years) were enrolled in this study. For the PD group, an experienced movement-disorders specialist (15 years of experience) made the diagnosis of PD according to published criteria (Hughes et al., 1992, 2001). All the patients fulfilled the United Kingdom Parkinson's Disease Society brain bank diagnostic criteria. They were evaluated with the H&Y scale, the unified Parkinson's disease rating scale (UPDRS), the Mini-Mental State Examination (MMSE), the Hamilton Depression Scale (HAMD), and the Hamilton Anxiety Scale (HAMA) by the same movement-disorder specialist, while their medications were stopped for at least 12 h.
The exclusion criteria for this study were: a history of head trauma; central nervous system infection; exposure to anti-dopaminergic drugs; other neurologic or psychiatric diseases; or a structural lesion or hydrocephalus on brain magnetic resonance images. This study was approved by the Institutional Review Board of Beijing Hospital (registration number: 2015BJYYEC-006-01). Written, informed consent was obtained from each subject.
MRI Protocol
MR imaging was performed on a 3 Tesla MRI system (Achieva 3T; Philips Medical Systems, Best, The Netherlands), using an eight-channel sensitivity-encoding coil for reception. Pencil beam second-order shimming was employed. For the PD patients, MR images were acquired shortly after the neurological assessment. For both the PD patients and normal controls, routine images, including axial T2-weighted, T1-weighted, and fluid-attenuated inversion recovery (FLAIR), were first obtained to confirm that there was no structural abnormality.
The CEST/APT imaging sequence was based on a pseudo-continuous wave, off-resonance RF irradiation and a single-shot, turbo-spin-echo readout. The parameters were as follows: repetition time = 3,000 ms; turbo-spin-echo factor = 54; field of view = 230 × 221 mm; matrix = 105 × 100 (reconstructed to be 400 × 400); slice thickness = 6 mm. A transverse slice that included the midbrain was acquired. The slice with substantia nigra on FLAIR images was picked out and CEST/APT image of the same slice would be acquired. A pseudo-continuous wave RF irradiation (saturation duration = 200 ms × 4; inter-pulse delay, 10 ms; power level = 2 μT) and a multi-offset, multi-acquisition CEST/APT imaging protocol (Li et al., 2014) were used. The 31 offsets were 0, ±0.25, ±0.5, ±0.75, ±1 (2), ±1.5 (2), ±2 (2), ±2.5 (2), ±3 (2), ±3.25 (2), ±3.5 (8), ±3.75 (2), ±4 (2), ±4.5, ±5, ±6 ppm (the values in parentheses represented the number of acquisitions, which was 1, if not specified). For signal normalization, an unsaturated image was obtained. The acquisition time of the CEST/APT image scan was about 3 min.
Data Processing
The Interactive Data Language (IDL, ITT Visual Information Solutions, Boulder, CO, USA) was used for image analysis. The measured magnetization transfer spectra were corrected for B0 field inhomogeneity effects on a pixel-by-pixel basis. CEST/APT imaging was calculated by the magnetization transfer ratio (MTR = 1-Ssat/S0) asymmetry (MTRasym) analysis with respect to the water resonance (Ssat and S0 represent the signal intensities with and without selective RF irradiation, respectively, plotted as a function of saturation frequency offset, relative to water). The calculated APTw images were called APT-weighted (APTw) images (Zhou et al., 2013a; Heo et al., 2016a,b). Meanwhile, the total CEST signal intensity, CESTtotal, was defined as the integral of the MTRasym spectrum in the range of 0–4 ppm.
Two radiologists (CL and RW, who had 6 and 11 years of experience in neurological imaging, respectively) performed the quantitative image analysis for PD patients and normal controls. The FLAIR images were used as the anatomical reference to draw regions of interest on the whole substantia nigra regions on M0 map (Figure 1). Besides, we assessed the normal-appearing white matter (NAWM) of the occipital lobe in the midbrain to determine whether there existed changes in CEST signals between PD patients and normal controls.
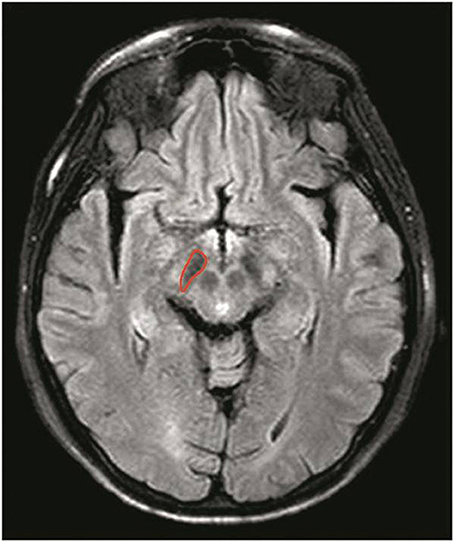
Figure 1. Example of the definition of the region of interest for quantitative analysis of the substantia nigra. The FLAIR images were used as the anatomical reference when drawing regions of interest on the whole substantia nigra regions on M0 map.
Statistical Analysis
All data were analyzed using the statistical package SPSS16.0. Sixty-one PD patients were divided into two groups with two different classifications: (I) based on the H&Y scale—the early stage (H&Y scale ≤ 2) and the advanced stage (H&Y scale ≥ 2.5); (II) based on the disease duration—the early stage (disease duration ≤ 3 year) and the late stage (disease duration > 3 years). The age and sex differences among normal controls and two PD groups were tested by ANOVA and χ2 test, respectively, and there was no significance between groups (P > 0.05).
For PD patients with unilateral symptoms, we defined the contralateral side of symptoms as the affected side and the ipsilateral side as the unaffected side. The CEST/APT imaging intensities of the affected side were recorded as a sample in the PD group, while those of the unaffected side were not included. For patients with bilateral symptoms, the CEST/APT imaging intensities of both sides were recorded as two separate samples in the PD group. The average CEST/APT imaging intensities (APTw and CESTtotal) and corresponding 95% confidence intervals were calculated for the substantia nigra of PD patients at different stages. One-way ANOVA was used to compare the CEST signal differences among normal controls and PD patients at different stages. We further analyzed whether there were differences among the normal controls, affected side, and unaffected side with one-way ANOVA, specifically for PD patients with unilateral symptoms. Correlation analysis was performed for the CEST signal of the substantia nigra and clinical assessment, including the H&Y scale, the UPDRS, the MMSE, the HAMD, and the HAMA. For the UPDRS, correlations between the CEST signal of the substantia nigra and UPDRS-I (relating to mind, behavior, and emotion), UPDRS-II (relating to the activities of daily living), UPDRS-III (relating to motor complications), UPDRS-IV (relating to treatment complications), and UPDRS-V (relating to other complications) were also calculated. The level of significance was set at P < 0.05. UPDRS-II, the UPDRS-III, and the UPDRS-IV measure the activities of daily living, motor complications, and treatment complications.
Results
Z spectrum and MTRasym spectrum
Figure 2 compares the average Z spectra of three groups in the substantia nigra, which were based on the classification of H&Y scale and the classification of disease duration. The average Z spectrum was highest for the normal controls and lowest for the advanced/late stage PD patients. Figure 3 compares the average MTRasym spectra of three groups in the substantia nigra, which were based on the classification of H&Y scale and the classification of disease duration. The APTw value (MTRasym at 3.5 ppm) was highest for the normal controls and lowest for the advanced/late stage PD patients.
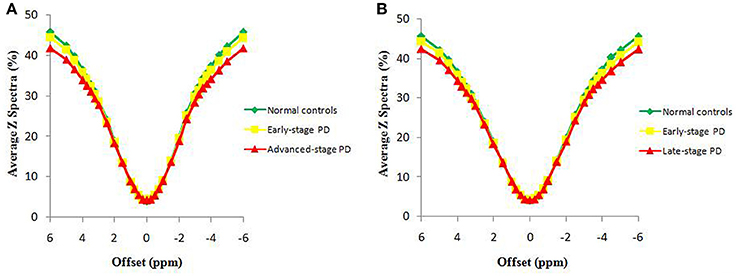
Figure 2. The average Z spectra of the substantia nigra for three groups, based on the classification of H&Y scale (A) and based on the classification of disease duration (B).
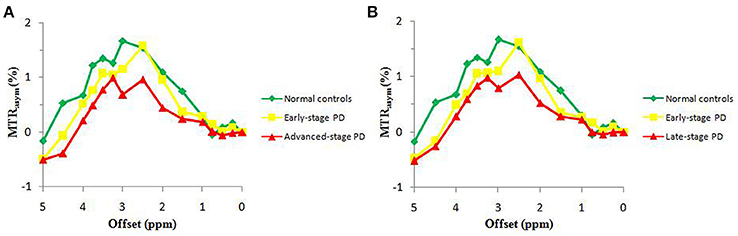
Figure 3. The average MTRasym spectra of the substantia nigra for three groups, based on the classification of H&Y scale (A) and based on the classification of disease duration (B).
Diagnosing PD with the CEST/APT signal
Based on the classification based on the H&Y scale, 55 samples from 38 patients at the early stage of PD were acquired. For the unilateral symptoms group (21 patients), we select one sample on the contralateral substantia nigra of symptoms (21 samples); for the bilateral symptoms group (17 patients), we selected two samples on the bilateral substantia nigra (34 samples). Forty-six samples from 23 patients at the advanced stage were also acquired (no patients with unilateral symptoms). The results are shown in Figure 4 and Table 1.
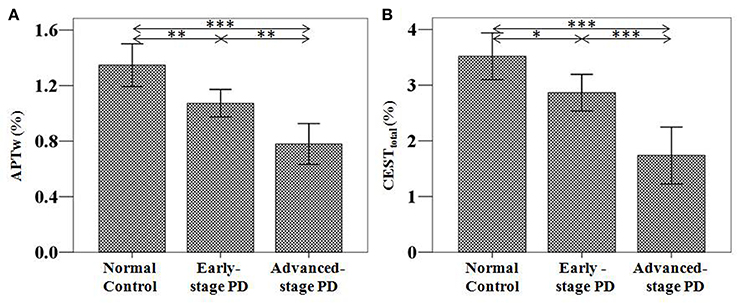
Figure 4. APTw (A) and CESTtotal (B) values of the substantia nigra for normal controls (n = 24) and PD patients at different stages (grouped by the H&Y scale) (n = 38 for early-stage and n = 23 for advanced-stage). The APTw and CESTtotal values of the substantia nigra for normal controls, early-stage, and advanced-stage PD patients were (1.35 ± 0.15) and (3.52 ± 0.42)%, (1.07 ± 0.10) and (2.87 ± 0.34)%, (0.78 ± 0.15) and (1.74 ± 0.52)%, respectively. Both showed a gradual decrease with disease progression. *P < 0.05; **P < 0.01; ***P < 0.001.
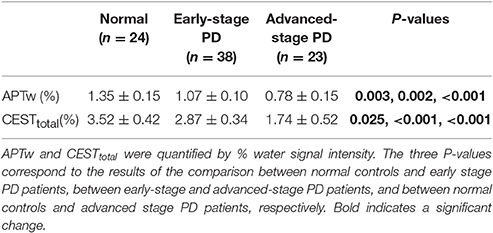
Table 1. APTw and CESTtotal values (mean ± 95% CI) of the substantia nigra for normal controls and Parkinson's disease (PD) patients at different stages (classification according to the H&Y scale).
Based on the classification based on disease duration, 46 samples from 32 patients at the early stage were acquired. For the unilateral symptoms group (18 patients), we select one sample on the contralateral substantia nigra of symptoms (18 samples); for the bilateral symptoms group (14 patients), we selected two samples on the bilateral substantia nigra (28 samples). Fifty-five samples from 29 patients at the advanced stage were also acquired (three samples from the three patients with unilateral symptoms; 52 samples for other 26 patients with bilateral symptoms). The results are shown in Figure 5 and Table 2.
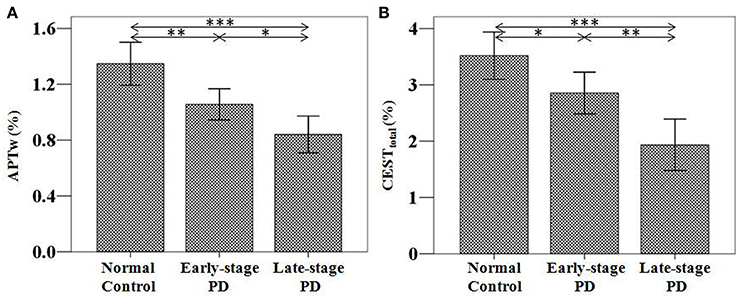
Figure 5. APTw (A) and CESTtotal (B) values of the substantia nigra for normal controls (n = 24) and PD patients at different stages (grouped by disease duration) (n = 32 for early-stage and n = 29 for late-stage). The APTw and CESTtotal values of the substantia nigra for normal controls, early-stage, and late-stage PD patients were (1.35 ± 0.15) and (3.52 ± 0.42)%, (1.06 ± 0.11) and (2.85 ± 0.37)%, (0.84 ± 0.13) and (1.93 ± 0.46)%, respectively. Both showed a gradual decrease with disease progression. *P < 0.05; **P < 0.01; ***P < 0.001.
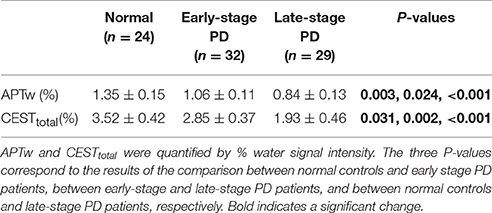
Table 2. APTw and CESTtotal values (mean ± 95% CI) of the substantia nigra for normal controls and Parkinson's disease (PD) patients at different stages (classification according to disease duration).
Both the APTw and CESTtotal values were able to differentiate PD patients from normal controls, regardless of the PD stage (the early stage or the advanced/late stage). In addition, both APTw and CESTtotal values of the substantia nigra gradually decreased with disease progression, regardless of which classification (the H&Y scale or disease duration) was used.
Figure 6 shows the typical APTw and FLAIR images of a normal control (male, 54 years old), an early stage PD patient (female, 67 years old, H&Y scale of 2, disease duration of 2 years), and a advanced/late stage PD patient (female, 46 years old, H&Y scale of 3, disease duration of 6 years). On the APTw images, the substantia nigra (black arrows) showed intermediate punctate hyperintensity for the normal control, iso-intensity for the early stage PD patient, and mild hypointensity for the advanced/late stage PD patient. On the FLAIR images, there was no obvious difference in the substantia nigra areas (black arrow) of these three cases.
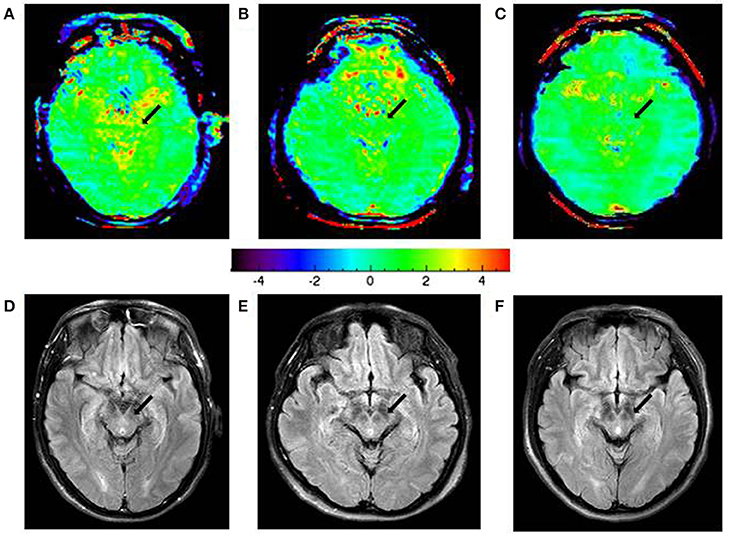
Figure 6. APTw images and FLAIR images of a typical normal control (A,D), an early-stage PD patient (B,E), and an advanced/late-stage PD patient (C,F). The APTw intensities in the substantia nigra (black arrows) were lower in PD patients (green color at the early stage, light blue color at the advanced/late stage) than in the normal controls (scattered yellow color).
The APTw and CESTtotal values of the occipital NAWM are shown in Tables 3, 4. It is due to the presence of the confounding factors relating to that the APTw values in the NAWM area were negative (Zhou et al., 2013a). No significant differences for these two parameters were found between PD patients and normal controls.
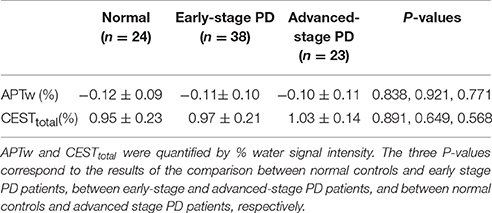
Table 3. APTw and CESTtotal values (mean ± 95% CI) of the occipital NAWM for normal controls and Parkinson's disease (PD) patients at different stages (classification according to the H&Y scale).
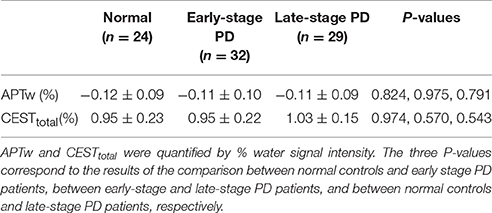
Table 4. APTw and CESTtotal values (mean ± 95% CI) of the occipital NAWM for normal controls and Parkinson's disease (PD) patients at different stages (classification according to disease duration).
Differentiating PD at Different Stages with the CEST/APT signal
We further compared the CEST/APT differences between early-stage PD patients and advanced or late-stage patients. With disease progression (from the early stage to the advanced or late stage), the CEST signal intensities of the substantia nigra significantly decreased, as expected, regardless of which classification was used, which indicated the potential of CEST/APT imaging to differentiate PD patients at different stages.
CEST/APT Signal Features for Patients with Unilateral Symptoms
The CEST/APT imaging intensities of the affected side and unaffected side are compared in Figure 7. Compared to normal controls, both the APTw and CESTtotal values in the substantia nigra of the affected side were significantly lower [APTw: (1.10 ± 0.11)%; P = 0.027; CESTtotal: (2.43 ± 0.38)%; P = 0.001]. The APTw and CESTtotal values in the substantia nigra of the unaffected side seemed to be lower than normal controls, but the differences were not significant [APTw: (1.20 ± 0.15)%; P = 0.315; CESTtotal: (2.86 ± 0.46)%; P = 0.081]. The APTw and CESTtotal values in the substantia nigra of the affected side seemed to be lower than unaffected side, but the differences were not significant (APTw: P = 0.526; CESTtotal: P = 0.303).
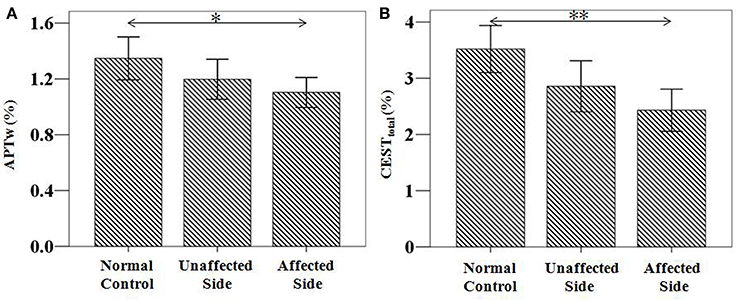
Figure 7. APTw and CESTtotal values of the substantia nigra for patients with unilateral symptoms (n = 21). Both showed a significant decrease in the affected side [APTw: (1.10 ± 0.11)%; P = 0.027; CESTtotal: (2.43 ± 0.38)%; P = 0.001], compared to normal controls [APTw: (1.35 ± 0.15)%; CESTtotal: (3.52 ± 0.42)%]. *P < 0.05; **P < 0.01.
Correlations between the CEST/APT Signal and Severity Evaluation
The severity evaluation of PD is commonly based on multiple scale ratings of different aspects, including the H&Y scale, the UPDRS, disease duration, the MMSE, the HAMD, and the HAMA. The H&Y scale and the UPDRS reflect the overall severity of PD, while the MMSE, the HAMD, and the HAMA mainly reflect the mental status of PD patients. We performed a correlation analysis of the CEST/APT signal with different clinical scales. Both the APTw and CESTtotal values of the substantia nigra showed significant negative correlations with the H&Y scale, the UPDRS, and disease duration (Table 5). The APTw values also showed a significant negative correlation with UPDRS-III, and the CESTtotal values also showed significant negative correlations with the UPDRS-II, UPDRS-III, and UPDRS-IV. Neither the APTw nor CESTtotal values showed significant correlations with the MMSE, the HAMD, or the HAMA.
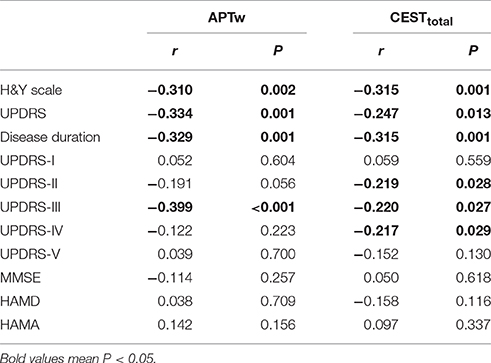
Table 5. Correlation results between the substantia nigra CEST/APT signals and the clinical evaluation.
Discussion
In this study, we investigated the potential of CEST/APT imaging for the diagnosis of PD and the evaluation of disease severity. We quantified the CEST/APT signal intensities of PD patients at different stages and compared the results with normal controls. We classified PD patients into two groups, based on the H&Y scale and based on disease severity, one of which has been used in a previous study (Li et al., 2014), namely, the H&Y stages (early stage, H&Y stages ≤ 2 vs. advanced stage, H&Y stages ≥ 2.5). Our present results revealed the efficiency of CEST/APT signal intensities in the detection of PD, even at the early stage of the disease. This is somewhat different from the previous study, which showed no significant difference between early PD patients and normal controls. Two major factors may explain this difference. The first factor is that we excluded the data from the unaffected side of PD patients with unilateral symptoms, which may have counterbalanced the decrease in CEST/APT signal intensities in PD patients at the early stage, as these decreases may not be as significant as those of the affected side. The comparisons among normal controls with the affected side and the unaffected side of PD patients in our study have clearly confirmed this point, which will be discussed later. The second factor may be the larger sample number in the present study, which may make the differences more obvious and consistent. Notably, we also further classified PD patients based on a different standard—disease duration (early stage, disease duration ≤ 3 year vs. late stage, disease duration > 3 years). This classification is more practical in the clinic, because the H&Y stages require the professional evaluation of neurologists, while the disease duration information can be more easily acquired from the patients. The results showed that, compared with normal controls, PD patients showed significantly lower CEST/APT intensities, regardless of the stage of PD. The results indicated that the clinical use of CEST/APT imaging in the diagnosis of PD would not be influenced by the H&Y stage or the disease duration. Thus, the CEST/APT signals of the substantia nigra may be used as a potential biomarker in the diagnosis of PD. Such results may be ascribed to the substantia nigra dopaminergic cell loss in PD patients, which would unavoidably decrease the CEST-detectable mobile proteins and peptides and other biomolecules in the substantia nigra.
Besides the substantia nigra, we also assessed one more region, the occipital NAWM at the slice of midbrain, which is probably not affected by PD. We did this to examine whether the CEST/APT signal loss is specific for the substantia nigra or the signal changes in other brain regions can also show similar trends. The results (Tables 3, 4) showed that the CEST/APT signals are stable in the NAWM in the different groups.
It is important to note that the significantly reduced CESTtotal and APTw values were observed in the substantia nigra in the early-stage patients (H&Y stages ≤ 2 or disease duration ≤ 3 year). As mentioned previously, the early diagnosis of PD would play an important part in the management of PD patients, while early diagnosis is still challenging in the clinic, to date. Our results show the capability of CEST/APT as a biomarker in the early diagnosis of PD, which may assist in early intervention for PD patients.
When we compared the CEST signals in the substantia nigra between the normal controls, the affected side of PD, and the unaffected side of PD, we found that both the affected side and unaffected side showed lower CEST signals, particularly the affected side. Our results in the present study reflect the different degree of CEST signal decrease for the affected side and the unaffected side. When the unilateral symptoms progress to bilateral symptoms, the CEST signal intensities decrease aggravatingly. As mentioned previously, the CEST signal decrease in the substantia nigra may be attributable to the dopamine neuron loss. Our results in the present study may reflect the different degree of dopamine neuron loss between the affected and unaffected sides. When the dopamine neuron loss progresses in the unaffected side to a certain point, the unilateral symptoms may progress to bilateral symptoms. Such a result indicated that CEST signals would provide promising information in monitoring the progression of PD, from the preclinical stage to the clinical stage. However, we should notice that no significant differences were found between the affected side and the unaffected side of PD, though the value of affected side seemed to be lower than the unaffected side of PD. This may be attributed to the periodic change of substantia nigra during the PD progression. Such results need to be further confirmed in the future.
Both the APTw and CESTtotal values in the substantia nigra had significantly negative correlations with the H&Y scale, the UPDRS, and disease duration, which correlated with the progression of PD. The progressively reduced CEST signal may be ascribed to the gradually decreased dopaminergic cell density in the substantia nigra, which is reflected by the worsening condition of PD patients. This may explain why the CEST signal has the potential for the overall severity evaluation of PD. Moreover, the APTw of the substantia nigra showed a significant negative correlation with the UPDRS-III, while the CESTtotal values showed negative correlations with the UPDRS-II, the UPDRS-III, and the UPDRS-IV. It is known that the UPDRS-II, the UPDRS-III, and the UPDRS-IV measure the activities of daily living, motor complications, and treatment complications, respectively. Therefore, the negative correlations between the CEST signal and the UPDRS-II, the UPDRS-III, and the UPDRS-IV may indicate the potential of CEST for the further evaluation of the sub-score of the UPDRS and provide more information for disease assessment in PD. No significant correlations were found for the CEST signals with the mental status (the MMSE, the HAMD, and the HAMA). This could be explained by the fact that the mental status of PD patients may be influenced by multiple factors, in addition to the substantia nigra changes.
The results for CESTtotal and APTw seemed very similar, but some different points were found between these two CEST metrics. For example, APTw signal differences between the early-stage PD patients and the normal controls seemed to be more obvious than the CESTtotal, indicating that “protein-based” APTw at 3.5 ppm may be more sensitive in detecting early-stage PD patients than the CESTtotal, which may derive from multiple chemical sources (mobile proteins and peptides, brain metabolites, etc., quantified by the integral of the MTRasym spectrum in the range of 0 to 4 ppm). In addition, CESTtotal may be more sensitive in differentiating early-stage patients from advanced or late-stage patients than APTw. There were also some differences for the correlation results. APTw values had a negative correlation with the UPDRS-III, while CESTtotal had negative correlations not only with the UPDRS-III, but also with the UPDRS-II and the UPDRS-IV. These results may be attributable to the different underlying meanings for these two metrics.
The decreased MTRasym spectrum of the substantia nigra for PD patients appeared at a wide offset range (Figure 3), suggesting that the APTw and CESTtotal decreases could be attributed to the loss of many kinds of water-exchanging chemicals (mobile proteins and peptides, brain metabolites, etc.) caused by the loss of dopaminergic neurons. The depletion of some chemicals with fast-exchanging protons, such as dopamine and glutamate, may also reduce the whole MTRasym spectrum as a result of the wide saturation width. However, the detection of the chemicals with fast-exchanging protons is not favorable at 3 Tesla. Therefore, the loss of dopaminergic neurons would be the more likely explanation for a decline in the whole MTRasym spectrum. The exact mechanisms for these changes in APTw and CESTtotal intensities still need to be further studied in the future.
There were some limitations to this study. First, we used a single-slice CEST/APT imaging acquisition protocol, but we attempted to include the maximum slice of the substantia nigra when selecting the scan slice. In a future study, we will increase the CEST/APT sequence coverage by using a 3D imaging acquisition sequence, which has been reported in previous studies (Zhao et al., 2013; Zhou et al., 2013b), so that the whole substantia nigra can be acquired. Also, we will be able to assess the other brain regions besides the slice of midbrain. Second, the spatial resolution of CEST/APT imaging needs improvement in future studies, so that we can describe the substantia nigra regions more precisely.
In conclusion, CEST/APT imaging is a novel MRI technique with which to detect PD patients at any disease stage. The significant APTw signal difference in the substantia nigra between early-stage PD patients and normal controls indicated the capability of CEST/APT for the early diagnosis of PD, which would make possible early intervention in PD. The correlations between the CEST signals and clinical evaluations indicated that the CEST signals can reflect disease severity. The CEST signal thus has the potential to serve as an imaging biomarker for assessing the progression of PD.
Author Contributions
CL, MC, and JZhou designed research; CL, RW, HC, WS, SL, GS, and JZhang conducted research; XZ, BL, and SZ analyzed data; CL, XZ, and JZhou wrote the manuscript. All authors read and approved the manuscript.
Conflict of Interest Statement
The authors declare that the research was conducted in the absence of any commercial or financial relationships that could be construed as a potential conflict of interest.
Acknowledgments
This study was supported by the National Natural Science Foundation of China (81401404 and 81361120392), Beijing Natural Science Foundation (7162171), and the National Institutes of Health (R01EB009731, R01CA166171, and R01NS083425). The authors thank Ms. Mary McAllister (Johns Hopkins University) for editorial assistance.
References
Aquino, D., Contarino, V., Albanese, A., Minati, L., Farina, L., Grisoli, M., et al. (2014). Substantia nigra in Parkinson's disease: a multimodal MRI comparison between early and advanced stages of the disease. Neurol. Sci. 35, 753–758. doi: 10.1007/s10072-013-1595-2
Cosottini, M., Frosini, D., Pesaresi, I., Costagli, M., Biagi, L., Ceravolo, R., et al. (2014). MR imaging of the substantia nigra at 7 T enables diagnosis of Parkinson disease. Radiology 271, 831–838. doi: 10.1148/radiol.14131448
Davis, K. A., Nanga, R. P. R., Das, S., Chen, S. H., Hadar, P. N., Pollard, J. R., et al. (2015). Glutamate imaging (GluCEST) lateralizes epileptic foci in nonlesional temporal lobe epilepsy. Sci. Transl. Med. 7:309ra161. doi: 10.1126/scitranslmed.aaa7095
Du, G., Lewis, M. M., Sterling, N. W., Kong, L., Chen, H., Mailman, R. B., et al. (2014). Microstructural changes in the substantia nigra of asymptomatic agricultural workers. Neurotoxicol. Teratol. 41, 60–64. doi: 10.1016/j.ntt.2013.12.001
Dula, A. N., Arlinghaus, L. R., Dortch, R. D., Dewey, B. E., Whisenant, J. G., Ayers, G. D., et al. (2013). Amide proton transfer imaging of the breast at 3 T: establishing reproducibility and possible feasibility assessing chemotherapy response. Magn. Reson. Med. 70, 216–224. doi: 10.1002/mrm.24450
Ellmore, T. M., Castriotta, R. J., Hendley, K. L., Aalbers, B. M., Furr-Stimming, E., Hood, A. J., et al. (2013). Altered nigrostriatal and nigrocortical functional connectivity in rapid eye movement sleep behavior disorder. Sleep 36, 1885–1892. doi: 10.5665/sleep.3222
Fearnley, J. M., and Lees, A. J. (1991). Ageing and Parkinson's disease: substantia nigra regional selectivity. Brain 114 (Pt 5), 2283–2301. doi: 10.1093/brain/114.5.2283
Harston, G. W., Tee, Y. K., Blockley, N., Okell, T. W., Thandeswaran, S., Shaya, G., et al. (2015). Identifying the ischaemic penumbra using pH-weighted magnetic resonance imaging. Brain 138, 36–42. doi: 10.1093/brain/awu374
He, N., Ling, H., Ding, B., Huang, J., Zhang, Y., Zhang, Z., et al. (2015). Region-specific disturbed iron distribution in early idiopathic Parkinson's disease measured by quantitative susceptibility mapping. Hum. Brain Mapp. 36, 4407–4420. doi: 10.1002/hbm.22928
Heo, H.-Y., Zhang, Y., Jiang, S., Lee, D.-H., and Zhou, J. (2016a). Quantitative assessment of amide proton transfer (APT) and nuclear overhauser enhancement (NOE) imaging with extrapolated semisolid magnetization transfer reference (EMR) signals: II. Comparison of three EMR models and application to human brain glioma at 3 Tesla. Magn. Reson. Med. 75, 1630–1639. doi: 10.1002/mrm.25795
Heo, H.-Y., Zhang, Y., Lee, D.-H., Hong, X., and Zhou, J. (2016b). Quantitative assessment of amide proton transfer (APT) and nuclear Overhauser enhancement (NOE) imaging with extrapolated semi-solid magnetization transfer reference (EMR) signals: application to a rat glioma model at 4.7 T. Magn. Reson. Med. 75, 137–138. doi: 10.1002/mrm.25581
Hughes, A. J., Daniel, S. E., and Lees, A. J. (2001). Improved accuracy of clinical diagnosis of Lewy body Parkinson's disease. Neurology 57, 1497–1499. doi: 10.1212/WNL.57.8.1497
Hughes, A. J., Daniel, S. E., Kilford, L., and Lees, A. J. (1992). Accuracy of clinical diagnosis of idiopathic Parkinson's disease: a clinico-pathological study of 100 cases. J. Neurol. Neurosurg. Psychiatr. 55, 181–184. doi: 10.1136/jnnp.55.3.181
Jia, G., Abaza, R., Williams, J. D., Zynger, D. L., Zhou, J. Y., Shah, Z. K., et al. (2011). Amide proton transfer MR imaging of prostate cancer: a preliminary study. J. Magn. Reson. Imaging 33, 647–654. doi: 10.1002/jmri.22480
Jiang, S., Yu, H., Wang, X., Lu, S., Li, Y., Feng, L., et al. (2016). Molecular MRI differentiation between primary central nervous system lymphomas and high-grade gliomas using endogenous protein-based amide proton transfer MR imaging at 3 Tesla. Eur. Radiol. 26, 64–71. doi: 10.1007/s00330-015-3805-1
Kim, H. J., Kim, S. J., Kim, H. S., Choi, C. G., Kim, N., Han, S., et al. (2013). Alterations of mean diffusivity in brain white matter and deep gray matter in Parkinson's disease. Neurosci. Lett. 550, 64–68. doi: 10.1016/j.neulet.2013.06.050
Li, C., Peng, S., Wang, R., Chen, H., Su, W., Zhao, X., et al. (2014). Chemical exchange saturation transfer MR imaging of Parkinson's disease at 3 Tesla. Eur. Radiol. 24, 2631–2639. doi: 10.1007/s00330-014-3241-7
Ma, S. Y., Roytta, M., Rinne, J. O., Collan, Y., and Rinne, U. K. (1997). Correlation between neuromorphometry in the substantia nigra and clinical features in Parkinson's disease using disector counts. J. Neurol. Sci. 151, 83–87. doi: 10.1016/S0022-510X(97)00100-7
Manza, P., Zhang, S., Li, C. S., and Leung, H. C. (2016). Resting-state functional connectivity of the striatum in early-stage Parkinson's disease: cognitive decline and motor symptomatology. Hum. Brain Mapp. 37, 648–662. doi: 10.1002/hbm.23056
Seraji-Bozorgzad, N., Bao, F., George, E., Krstevska, S., Gorden, V., Chorostecki, J., et al. (2015). Longitudinal study of the substantia nigra in Parkinson disease: a high-field (1) H-MR spectroscopy imaging study. Mov. Disord. 30, 1400–1404. doi: 10.1002/mds.26323
Sherry, A. D., and Woods, M. (2008). Chemical exchange saturation transfer contrast agents for magnetic resonance imaging. Annu. Rev. Biomed. Eng. 10, 391–411. doi: 10.1146/annurev.bioeng.9.060906.151929
Sun, P. Z., Zhou, J., Sun, W., Huang, J., and Van Zijl, P. C. (2007). Detection of the ischemic penumbra using pH-weighted MRI. J. Cereb. Blood Flow Metab. 27, 1129–1136. doi: 10.1038/sj.jcbfm.9600424
Tietze, A., Blicher, J., Mikkelsen, I. K., Ostergaard, L., Strother, M. K., Smith, S. A., et al. (2014). Assessment of ischemic penumbra in patients with hyperacute stroke using amide proton transfer (APT) chemical exchange saturation transfer (CEST) MRI. NMR Biomed. 27, 163–174. doi: 10.1002/nbm.3048
Togao, O., Yoshiura, T., Keupp, J., Hiwatashi, A., Yamashita, K., Kikuchi, K., et al. (2014). Amide proton transfer imaging of adult diffuse gliomas: correlation with histopathological grades. Neuro Oncol. 16, 441–448. doi: 10.1093/neuonc/not158
Tolosa, E., Wenning, G., and Poewe, W. (2006). The diagnosis of Parkinson's disease. Lancet Neurol. 5, 75–86. doi: 10.1016/S1474-4422(05)70285-4
Ward, K. M., Aletras, A. H., and Balaban, R. S. (2000). A new class of contrast agents for MRI based on proton chemical exchange dependent saturation transfer (CEST). J. Magn. Reson. 143, 79–87. doi: 10.1006/jmre.1999.1956
Yuan, J., Chen, S., King, A. D., Zhou, J., Bhatia, K. S., Zhang, Q., et al. (2014). Amide proton transfer-weighted imaging of the head and neck at 3 T: a feasibility study on healthy human subjects and patients with head and neck cancer. NMR Biomed. 27, 1239–1247. doi: 10.1002/nbm.3184
Zhang, H., Kang, H., Zhao, X., Jiang, S., Zhang, Y., Zhou, J., et al. (2016). Amide Proton Transfer (APT) MR imaging and Magnetization Transfer (MT) MR imaging of pediatric brain development. Eur. Radiol. 26, 3368–3376. doi: 10.1007/s00330-015-4188-z
Zhao, X., Wen, Z., Zhang, G., Huang, F., Lu, S., Wang, X., et al. (2013). Three-dimensional turbo-spin-echo amide proton transfer MR imaging at 3-Tesla and its application to high-grade human brain tumors. Mol. Imaging Biol. 15, 114–122. doi: 10.1007/s11307-012-0563-1
Zhou, B., Yuan, F., He, Z., and Tan, C. (2014). Application of proton magnetic resonance spectroscopy on substantia nigra metabolites in Parkinson's disease. Brain Imaging Behav. 8, 97–101. doi: 10.1007/s11682-013-9251-2
Zhou, J., and Van Zijl, P. C. (2006). Chemical exchange saturation transfer imaging and spectroscopy. Progr. NMR Spectr. 48, 109–136. doi: 10.1016/j.pnmrs.2006.01.001
Zhou, J., Hong, X., Zhao, X., Gao, J.-H., and Yuan, J. (2013a). APT-weighted and NOE-weighted image contrasts in glioma with different RF saturation powers based on magnetization transfer ratio asymmetry analyses. Magn. Reson. Med. 70, 320–327. doi: 10.1002/mrm.24784
Zhou, J., Payen, J. F., Wilson, D. A., Traystman, R. J., and Van Zijl, P. C. (2003). Using the amide proton signals of intracellular proteins and peptides to detect pH effects in MRI. Nat. Med. 9, 1085–1090. doi: 10.1038/nm907
Keywords: CEST imaging, APT imaging, biomarker, substantia nigra, Parkinson's disease
Citation: Li C, Chen M, Zhao X, Wang R, Chen H, Su W, Li S, Lou B, Song G, Zhang S, Zhang J and Zhou J (2017) Chemical Exchange Saturation Transfer MRI Signal Loss of the Substantia Nigra as an Imaging Biomarker to Evaluate the Diagnosis and Severity of Parkinson's Disease. Front. Neurosci. 11:489. doi: 10.3389/fnins.2017.00489
Received: 01 October 2016; Accepted: 17 August 2017;
Published: 31 August 2017.
Edited by:
Oscar Arias-Carrión, Hospital General Dr. Manuel Gea Gonzalez, MexicoReviewed by:
Emmanuel Brouillet, Commissariat à l'Energie Atomique et aux Energies Alternatives (CEA), FranceHong Xu, University of Pennsylvania, United States
Copyright © 2017 Li, Chen, Zhao, Wang, Chen, Su, Li, Lou, Song, Zhang, Zhang and Zhou. This is an open-access article distributed under the terms of the Creative Commons Attribution License (CC BY). The use, distribution or reproduction in other forums is permitted, provided the original author(s) or licensor are credited and that the original publication in this journal is cited, in accordance with accepted academic practice. No use, distribution or reproduction is permitted which does not comply with these terms.
*Correspondence: Min Chen, Y2hlbm1pbjYyQHlhaG9vLmNvbQ==