 Gemma Learmonth1,2*
 Francesca Felisatti2
 Numaya Siriwardena2
 Matthew Checketts2
 Christopher S. Y. Benwell1,2
 Gesine Märker1,2
 Gregor Thut1
 Monika Harvey2
- 1Centre for Cognitive Neuroimaging, Institute of Neuroscience and Psychology, University of Glasgow, Glasgow, United Kingdom
- 2School of Psychology, University of Glasgow, Glasgow, United Kingdom
Several recent studies have reported non-linear effects of transcranial direct current stimulation (tDCS), which has been attributed to an interaction between the stimulation parameters (e.g., current strength, duration) and the neural state of the cortex being stimulated (e.g., indexed by baseline performance ability, age) (see Fertonani and Miniussi, 2016). We have recently described one such non-linear interaction between current strength and baseline performance on a visuospatial attention (landmark) task (Benwell et al., 2015). In this previous study, we induced a small overall rightward shift of spatial attention across 38 participants using bi-hemispheric tDCS applied for 20 min (concurrent left posterior parietal (P5) anode and right posterior parietal (P6) cathode) relative to a sham protocol. Importantly, this shift in bias was driven by a state-dependent interaction between current intensity and the discrimination sensitivity of the participant at baseline (pre-stimulation) for the landmark task. Individuals with high discrimination sensitivity (HDS) shifted rightward in response to low- (1 mA) but not high-intensity (2 mA) tDCS, whereas individuals with low discrimination sensitivity (LDS) shifted rightward with high- but not low-intensity stimulation. However, in Benwell et al. (2015) current strength was applied as a between-groups factor, where half of the participants received 1 mA and half received 2 mA tDCS, thus we were unable to compare high and low-intensity tDCS directly within each individual. Here we aimed to replicate these findings using a within-group design. Thirty young adults received 15 min of 1 and 2 mA tDCS, and a sham protocol, each on different days, to test the concept of an interaction between baseline performance and current strength. We found no overall rightward shift of spatial attention with either current strength, and no interaction between performance and current strength. These results provide further evidence of low replicability of non-invasive brain stimulation protocols, and the need for further attempts to replicate the key experimental findings within this field.
Introduction
Transcranial direct current stimulation (tDCS) has been used as a non-invasive method of modulating neuronal excitability in both healthy and clinical groups for over 15 years (Nitsche and Paulus, 2000). However, its ability to reliably modulate activity and behavior has recently been questioned. High variability of response to tDCS is often reported, both inter-individually (when the same protocol is administered to different people) and intra-individually (when a protocol is administered to the same people on different occasions; Krause and Kadosh, 2014; López-Alonso et al., 2014; Wiethoff et al., 2014; Chew et al., 2015; Dyke et al., 2016; Horvath et al., 2016b; Tremblay et al., 2016). Additionally, prior positive results have failed to replicate (Koenigs et al., 2009; Costa et al., 2015; Horvath et al., 2016a; Vannorsdall et al., 2016) and a growing body of null results has led to uncertainty in regarding tDCS as an effective method of neuromodulation (Minarik et al., 2015; de Hollander et al., 2016; Mungee et al., 2016; Tremblay et al., 2016; Westwood et al., 2016; Nilsson et al., 2017; Seyed Majidi et al., 2017; Verhage et al., 2017). A series of meta-analyses of the tDCS literature has found no strong evidence of efficacy within any cognitive domain probed (Horvath et al., 2015a), no benefits of single-session tDCS in healthy adults (Horvath et al., 2015b) and only a small reliable effect of tDCS in the modulation of motor-evoked potentials (Horvath et al., 2015c, although see Horvath et al., 2016a for a failed replication of this small effect using behavioral outcome measures). These points of contention, coupled with a high probability of publication bias in favor of positive study outcomes, have generated debate within the electrical stimulation research community regarding the overall efficacy of this technique (see Antal et al., 2015; Horvath, 2015; Price and Hamilton, 2015).
Yet, our understanding of the tDCS mechanism has evolved in recent years, with its effects now considered to be at least partially non-linear and state-dependent (see Fertonani and Miniussi, 2016 for review). Rather than evoking a consistent anode-excitation and cathode-inhibition response, it is likely instead that the stimulation parameters selected (e.g., current strength, duration, electrode size, online vs. offline application) dynamically interact with the endogenous characteristics of the individual who is receiving stimulation (e.g., age, gender, expertise, coupled with transient fluctuations in alertness, neurochemistry etc.). Response to tDCS is further influenced by the characteristics of the task under investigation (e.g. task type, difficulty and the various cognitive strategies employed by participants; Dockery et al., 2009; Stagg et al., 2011; Berryhill and Jones, 2012; Tseng et al., 2012; Batsikadze et al., 2013; Hsu et al., 2014, 2016; Bortoletto et al., 2015; Cabral et al., 2015; Gill et al., 2015; Learmonth et al., 2015; Gözenman and Berryhill, 2016; Shen et al., 2016). This variability may be further exacerbated in clinical populations (e.g., stroke), where patients exhibit a larger degree of neural heterogeneity relative to healthy individuals. Thus, although tDCS may exert a weak effect overall, resulting in the negative outcomes reported in the aforementioned meta-analyses, the efficacy and reliability of this technique might be improved by identifying grouping variables that do reliably generate behavioral effects, and the application of individualized stimulation parameters based on these characteristics.
Our research group has recently reported a significant non-linear effect of tDCS in modulating visuospatial attention in healthy young adults (Benwell et al., 2015). Young adults tend to over-represent the left side of space relative to the right, giving rise to a small leftward bias (pseudoneglect, Bowers and Heilman, 1980) that can be quantified using the line bisection and “landmark” tasks (Milner et al., 1993). Pseudoneglect is thought to arise due to a right parieto-occipital dominance for spatial attention, resulting in an imbalanced allocation of spatial attention favoring the left hemispace (Fink et al., 2000a,b; Fink et al., 2001; Foxe et al., 2003; Çiçek et al., 2009; Thiebaut de Schotten et al., 2011; Benwell et al., 2014; Longo et al., 2015). In Benwell et al. (2015), we aimed to induce directional shifts of spatial attention by increasing neural excitability in the parietal cortex in one hemisphere, whilst simultaneously reducing excitability of the homologous region in the opposite hemisphere. To this effect, we applied 20 min of dual-hemispheric tDCS to the left and right posterior parietal cortices (P5/P6) across three within-subject sessions (i) P5-anode/P6-cathode (LA/RC), (ii) P5-cathode/P6-anode (LC/RA), and (iii) sham (30 s of counterbalanced LA/RC or LC/RA). Secondly, we hypothesized that low- and high-intensity tDCS would differentially affect behavioral response, and therefore half of the participants received low- (1 mA) and half received high-intensity (2 mA) tDCS, in a between-groups manipulation. In line with previous work by Giglia et al. (2011), we successfully induced a small overall rightward shift of visuospatial attention relative to sham using the LA/RC montage, but we did not enhance the leftward pseudoneglect bias further using the reversed (LC/RA) montage. Importantly, there was a clear interaction between current strength and the endogenous baseline discrimination sensitivity of the participant, as indexed by the landmark task. For the LA/RC condition, individuals who performed the task with high precision exhibited a left-to-right spatial attention shift in response to 1 mA stimulation but not 2 mA, and those with low baseline discrimination sensitivity exhibited the same rightward shift in response to 2 mA but not 1mA. Thus, the behavioral response to tDCS was both non-linear (a different response to 1 and 2 mA) and state-dependent (a different response based on the performance of the participant).
Nonetheless, it is imperative that these “explanatory” grouping variables are also subjected to experimental replication to test their veracity and reliability. Here we aimed to conceptually replicate Benwell et al. (2015) to determine whether the previously-reported interaction between current strength and baseline discrimination sensitivity is a robust effect. Because a between-groups design was used previously (1 and 2 mA tDCS were applied to different participants) we were unable to assess whether the two tDCS intensities elicited distinct behavioral effects within each of the individuals tested. Thus, here we selected only the P5-anode/P6-cathode (LA/RC) montage, which showed a significant effect in both Benwell et al. (2015) and Giglia et al. (2011), and applied 1, 2 mA and sham tDCS in a within-subjects design. We expected to replicate the rightward visuospatial attention shift in individuals with high discrimination sensitivity (HDS) in response to low-current (1 mA), but not high-current (2 mA) stimulation. In contrast, individuals with low discrimination sensitivity (LDS) were expected to shift rightwards in response to 2 mA, but not 1 mA tDCS.
Method
Participants
Thirty right-handed young adults (16 female, mean age = 21.43, SD = 1.87, range = 19–25) were recruited. One male participant was excluded due to poor adherence to the task (baseline curve width >3 standard deviations above the group mean). All reported normal or corrected-to-normal vision and had no contraindications to tDCS (pacemaker, seizure etc., as per Rossi et al., 2009). The study was approved by the University of Glasgow College of Science and Engineering ethics committee and written, informed consent was obtained from each participant.
tDCS
A direct current was applied using a battery-driven constant current stimulator (NeuroConn GmbH, Germany). Each experimental session involved a bi-parietal left-anode right-cathode (LA/RC) electrode montage, with the anode centered on P5 of the 10-20 International EEG system, and the cathode centered on P6. Three experimental conditions were administered in a single-blind, counterbalanced, within-subject design: (i) 1 mA tDCS for 15 min, (ii) 2 mA tDCS for 15 min, (iii) 1.5 mA tDCS for 30 s (sham protocol), all with an additional 30 s ramp-up and 30 s ramp-down period. One condition was administered per session, with ≥24 h between sessions per individual. Both carbon rubber electrodes measured 4 × 4 cm and were held in place using Ten20 conductive paste (Weaver & Co. Aurora, USA) to ensure sustained contact with the scalp. Electrode impedance was not formally assessed, but always measured <55 kΩ according to the maximum allowable limit of the tDCS device.
Landmark Task
Stimuli were presented using E-Prime 2.0 (Psychology Software Tools Inc., Pittsburgh, PA) via a Dell Precision T3400 PC and 19.5″ Sun Microsystems CRT monitor (with 1280 × 1024 pixel resolution and 100 Hz refresh rate). Viewing distance was fixed at 0.8 m using a chin rest.
The landmark task (or “tachistoscopic line bisection,” McCourt and Jewell, 1999) is a computerized, two-alternative forced-choice version of the line bisection task. The stimuli were reproduced identically to those used in Benwell et al. (2015) (Figure 1). Horizontal lines of 100% Michelson contrast, measuring 800 × 14 pixels (0.24 × 0.04 m, 17.34 × 0.29° visual angle), were presented on a gray background (luminance = 179, hue = 160). Each line was transected vertically in the center of the screen at the same position as the fixation cross, and the length of the left and right sides of the line varied across trials. Seventeen different stimuli were created: 8 where the left side was longer than the right (by 48, 42, 36, 30, 24, 18, 12, or 6 pixels), 8 where the right was longer than the left (by 48, 42, 36, 30, 24, 18, 12, or 6 pixels) and 1 where both sides were of equal length. In half of the trials the line was shaded black in the lower right/upper left quadrants, and the upper right/lower left quadrants in the remaining trials. Each of the six landmark task blocks consisted of 272 trials (17 stimuli presented 16 times each in a random order), lasting ~7 min. A centrally located fixation cross appeared for 1500 ms, followed by a landmark stimulus for 150 ms. The fixation cross then reappeared until a response was given. Participants were instructed to press either the left (right index finger) or right (right middle finger) response keys, to indicate which side of the line they perceived to be shorter.

Figure 1. Landmark task stimuli. (A) Both sides are of equal length, (B) the left side is shorter than the right by 48 pixels and (C) the right side is shorter than the left by 48 pixels.
Procedure
Participants indicated their subjective alertness on a linear scale (0 = almost asleep, 100 = fully alert) at the beginning and end of each experimental session. The tDCS electrodes were applied to the scalp and the participant was seated with their midsagittal plane aligned with the computer screen. Blocks 1 and 2 of the landmark task were completed (pre-tDCS) to assess baseline task performance (Figure 2). Stimulation was then initiated and Blocks 3 and 4 of the landmark task commenced after the 30 s ramp-up period. A direct current was maintained throughout Blocks 3 and 4 (during-tDCS) in the two “active” (1 and 2 mA) conditions, and for the first 30 s of Block 3 in the sham condition, before ramp-down. Blocks 5 and 6 were then completed post-tDCS. A questionnaire was administered at the end of each session to assess the subjective experience of receiving tDCS (headache, tingling, itching, burning, pain. Score: 1 = “Not experienced at all,” 5 = “Experienced very strongly,” modified from Brunoni et al., 2011). To test for adequate subject blinding, subjects were invited to guess which of the three sessions involved sham tDCS at the end of their final session.
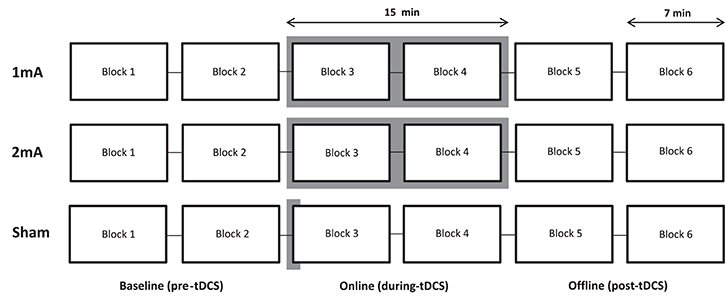
Figure 2. Experimental procedure. Each of the three conditions (1, 2 mA, and sham) was applied on a different day, ≥24 h apart, in a counterbalanced order across participants. The active stimulation period is highlighted.
Rationale for Procedural Differences between Experiments
The study design of Benwell et al. (2015) was modified for the following reasons:
(1) Electrode montage: Only the P5-a/P6-c (LA/RC) was selected for the present experiment, due to its efficacy in modulating spatial attention rightwards in Benwell et al. The P5-c/P6-a (LC/RA) montage did not enhance the leftward pseudoneglect bias previously, and was therefore not assessed further here.
(2) Within vs. between-groups design: We aimed here to compare the effects of 1 and 2 mA tDCS directly within the same individuals, rather than across different subgroups as per Benwell et al. This was intended to determine whether tDCS-induced spatial attention shifts were specific to a particular current strength within individuals, or whether both current strengths elicited the same response within each subject. Additionally, within-subject designs are generally more powerful than between-groups designs, due to reduced variance across participants.
(3) Number and duration of blocks: The number of experimental blocks was reduced from 10 in the prior study to six here, in order to improve the statistical power of the experiment. Each block was lengthened slightly in duration, with ~7 min per block, compared to 4–5 min previously. This also meant that more trials were included in the psychometric function fitting, providing a more accurate measure of spatial bias per block. Finally, 2 pre-tDCS baseline landmark task blocks were included rather than 1 used previously, to ensure a more stable measure of baseline performance.
(4) Duration of stimulation: To ensure that Blocks 3 & 4 (now 7 min each) were performed entirely during stimulation, active stimulation was reduced from 20 to 15 min. This was deemed an appropriate modification because in Benwell et al. the peak online tDCS effects occurred well within this 15 min time window (see Figure 3 in Benwell et al., 2015). In addition, due to the shorter block duration in the previous experiment (4–5 min), individuals varied in the number of blocks that they performed online and offline (i.e., during and after tDCS), with the majority finishing active stimulation during Blocks 6 or 7. Thus, this modification strengthened the demarcation between online and offline tDCS periods here, as all participants finished tDCS during Block 4.
(5) Conductive medium: Ten20 conductive paste was used to affix the electrodes to the scalp in the present experiment, compared to saline-soaked sponges used previously. This improved the contact between the electrodes and the scalp, and prevented uncontrolled distribution of the current via excess saline solution.
(6) Performance group allocation: In Benwell et al. the participants were assigned to performance groups based on their mean Block 1 curve width across the three sessions (LA/RC, LC/RA & sham). The mean curve width was calculated separately for the 1 and 2 mA groups, and participants were assigned into four subgroups accordingly (1 mA HDS, 1 mA LDS, 2 mA HDS, 2 mA LDS). Here, the curve width was first averaged across Blocks 1&2, then averaged across the three sessions (1, 2 mA & sham). Participants were assigned to the four subgroups based on the median curve width, to ensure that similar numbers were allocated to each group.
(7) Viewing distance: Due to laboratory restrictions, participants were seated 0.8 m from the computer screen during the landmark task, rather than 0.7 m as per the prior study.
(8) Sham current strength: 1.5 mA was applied here, compared to 1 or 2 mA used previously, depending on current strength group allocation.
Analyses
Landmark Task
As per Benwell et al. (2015) the percentage of trials where the left side of the horizontal line was perceived to be shorter was calculated, separately for each of the 17 different stimuli. Psychometric functions were then fitted for each landmark task block, for each individual, using a cumulative logistic function:
where μ is the point on the x-axis that corresponds to 50% left-shorter and 50% right-shorter response rate (i.e., the position along the horizontal landmark line that corresponds to where the individual perceived both sides of the line to be of equal length), x represents each of the 17 stimuli tested and s is the psychometric curve width. The point of subjective equality (PSE) and curve widths were extracted: the PSE is used to quantify spatial bias and provides a measure of the subjective midpoint of the landmark lines for each block, whereas the curve width estimates the precision of these judgements. High precision is indicated by a small (narrow) curve width and large (wide) values indicate low task precision.
Performance Group Allocation
Fifteen individuals whose mean baseline curve width was narrower than the median curve width of 6.31 were allocated to the HDS performance group, and 14 with a curve width wider than the median were allocated to the LDS group. The participant whose curve width acted as the group median value was allocated to the HDS group, given that one LDS participant was excluded due to very poor discrimination sensitivity prior to analysis.
Results
The full dataset for this study is available at https://osf.io/ydw4u/.
Subjective Alertness Questionnaire
Alertness generally reduced throughout the experiment (3 × 2 ANOVA: tDCS-intensity (1ma, 2mA, sham) × time (pre, post): effect of time [F(2, 26) = 46.73, p < 0.001)] but there was no difference between the three stimulation conditions. There was no interaction between tDCS condition and time, suggesting that general alertness did not reduce (or increase) in response to one tDCS intensity relative to the other.
tDCS Sensory Side-Effects
A series of Friedman's tests to compare the severity of each of the five sensory side-effects (headache, tingling, itching, burning, and pain) found no difference in ratings between the three stimulation conditions (min p = 0.25). Thirteen participants (44.8%) correctly guessed which of their three conditions involved the sham protocol, compared to 19 (50%) in Benwell et al., both of which are above the 33% chance level. Guess accuracy did not differ between performance groups [HDS vs. LDS: = 0.29, p = 0.59].
Baseline Landmark Task Performance
To ensure that each group exhibited a leftward (pseudoneglect) bias at baseline, one sample t-tests were performed for the baseline PSE (mean of Blocks 1 & 2), separately for the 1, 2 mA, and sham sessions. There was a numerically leftward group-level bias at baseline for all three conditions (mean 1 mA = −2.57, 2 mA = −2.24, sham = −1.33 pixels relative to the veridical midpoint of the landmark line). However, biases were only significantly different from zero (i.e., no bias) for the 1 mA [t(28) = −3.42, p = 0.002] and the 2 mA [t(28) = −3.28, p = 0.003] conditions, but were not significantly left of center for the sham condition [t(28) = −1.7, p = 0.1]. A repeated measures ANOVA did not highlight any significant differences in baseline PSEs across the three tDCS conditions [F(2, 56) = 2.0, p = 0.15]. In line with Benwell et al. (2015), the baseline PSEs were correlated across the three sessions (Figure 3), indicating a stable leftward spatial bias across testing days: 1 vs. 2 mA [Spearman's rho: r(29) = 0.61, p < 0.001], 1 mA vs. Sham [r(29) = 0.55, p = 0.002], 2 mA vs. Sham [r(29) = 0.67, p < 0.001]. Baseline curve widths were similar across the three tDCS conditions [F(2, 56) = 0.25, p = 0.78] and were also correlated across testing days, indicating a stability of task precision across sessions: 1 vs. 2 mA: r(29) = 0.61, p < 0.001, 1 mA vs. Sham: r(29) = 0.55, p = 0.002, 2 mA vs. Sham: r(29) = 0.61, p < 0.001.
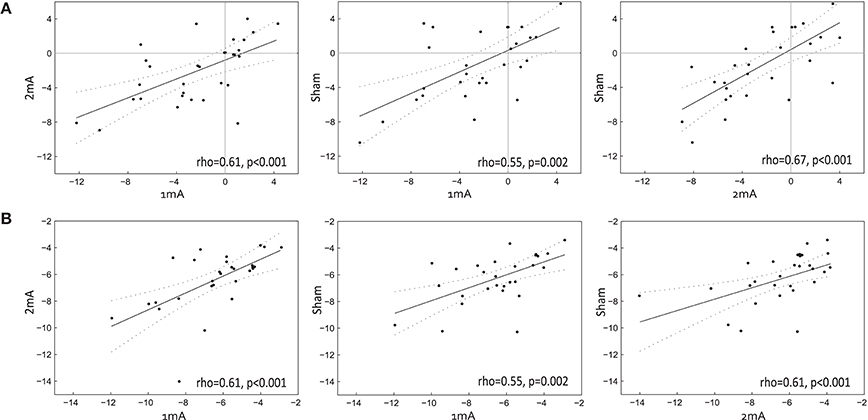
Figure 3. Baseline performance. The baseline (mean of Blocks 1&2) PSE correlations across the three tDCS conditions are shown in (A), where the axis values represent the number of pixels relative to veridical horizontal midpoint. Baseline curve width correlations are shown in (B), where the axis values represent the number of pixels. The slope and 95% confidence intervals are overlaid.
Overall tDCS Effects
Spatial Bias (PSE)
A full-factorial 3 × 6 (tDCS-intensity x Block) ANOVA performed on the spatial attention bias (PSE; Figure 4) measurements found no overall effect of tDCS intensity [F(2, 56) = 0.55, p = 0.58, ηp2 = 0.019], no PSE shifts related to experimental block [F(5, 140) = 1.58, p = 0.17, ηp2 = 0.05] and no intensity x block interaction [F(10, 280) = 0.86, p = 0.57, ηp2 = 0.03]. As per the analysis performed in Benwell et al. (2015), the data were then sham-normalized (i.e., the PSEs obtained during the sham protocol were subtracted block-by-block from the PSEs obtained during each of the two active stimulation conditions, separately for each individual). These sham-normalized data were then baseline-corrected (i.e., the mean baseline PSE (Blocks 1&2, averaged) was subtracted block-by-block from Blocks 3-6, separately for each individual). These data were then subjected to a 2 × 4 ANOVA (tDCS-intensity × Block) which found no main effects of stimulation [F(1, 28) = 0.47, p = 0.5, ηp2 = 0.017] nor block [F(1, 28) = 0.14, p = 0.94, ηp2 = 0.005] and no stimulation x block interaction [F(1, 28) = 1.34, p = 0.27, ηp2 = 0.045]. A t-test identified no difference in PSE shifts between the 1 and 2 mA tDCS conditions during the online stimulation period (mean of Blocks 3-4) [t(28) = 1.61, p = 0.12] relative to baseline, nor was there any difference in PSE shifts between the two tDCS intensities over the course of the overall experiment (online and offline: mean of Blocks 3–6) [t(28) = 0.69, p = 0.5]. This is in contrast to Benwell et al. where we identified a small overall rightward shift of spatial bias in response to the LA/RC montage relative to sham [a one sample t-test compared to zero, collapsed over both current strengths t(37) = 2.003, p = 0.052]. The same analysis performed on the present replication data, averaged over both current strengths, identified no overall rightward shift relative to sham in response to the same LA/RC montage t(28) = 1.31, p = 0.2.
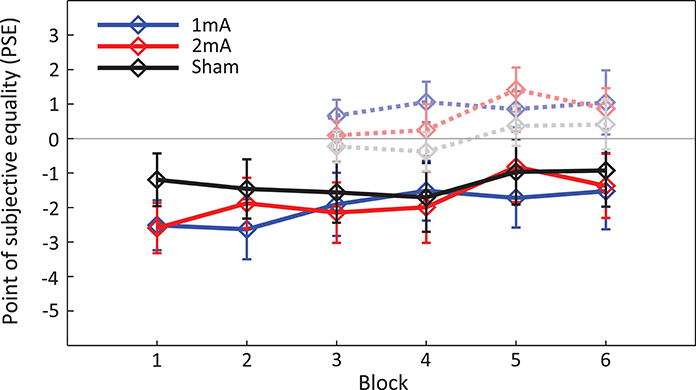
Figure 4. Grand average spatial attention bias (PSE). Solid lines represent the spatial bias (PSE) for Blocks 1–6 across all participants (± standard error of the mean). Negative values indicate a left bias and positive values a right bias. Transparent lines represent the baseline-normalized spatial bias shift for each block.
Task Precision (Curve Width)
The same analysis was then applied to the curve widths. Most notably, the 3 × 6 (tDCS-intensity × Block) ANOVA found a general reduction in task precision over the course of the experiment [F(5, 140) = 7.6, p < 0.001, ηp2 = 0.21] but this did not differ between the three stimulation conditions [Intensity × Block: F(2, 280) = 4.19, p = 0.94, ηp2 = 0.015].
Group Performance Split: Mean Baseline Performance across Experiment
Spatial Bias (PSE)
The analyses were performed again, but this time including performance group as a between-subjects factor (Figure 5). A full-factorial 3 × 6 × 2 ANOVA (tDCS-intensity × Block × Performance) on the PSE values once again found no effect of tDCS intensity [F(2, 54) = 0.65, p = 0.53, ηp2 = 0.02], no effect of Block [F(5, 135) = 1.5, p = 0.19, ηp2 = 0.5], no effects of performance group [F(1, 27) = 1.26, p = 0.27, ηp2 = 0.04] and no significant interactions. In contrast to Benwell et al. (2015), a 2 × 4 × 2 ANOVA performed on the sham-removed and baseline corrected PSE values found no interaction between tDCS intensity and baseline performance [F(1, 27) = 0.089, p = 0.77, ηp2 = 0.003] and no three-way interaction between tDCS intensity, performance and block [F(3, 81) = 0.83, p = 0.48, ηp2 = 0.03].
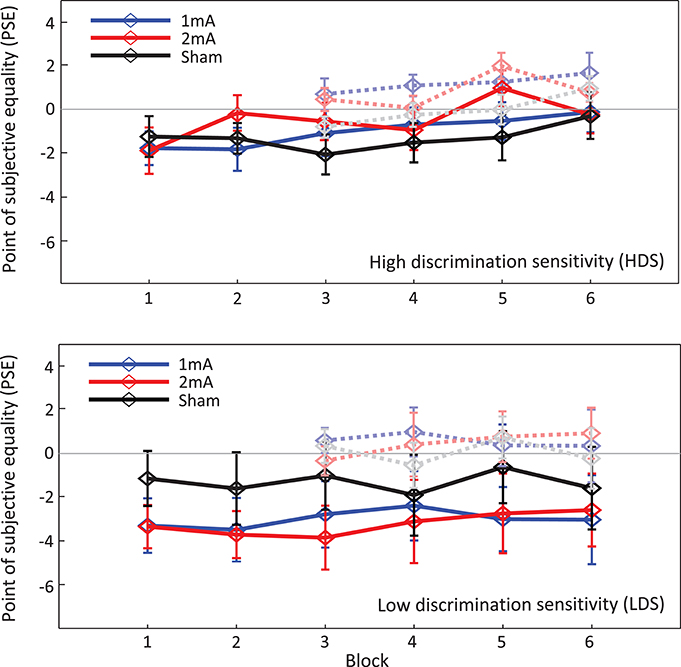
Figure 5. Grand average spatial attention bias (PSE), separated by performance group. Negative values indicate a leftward bias and positive values a rightward bias. Transparent lines represent the baseline-normalized shift of spatial bias for each block.
Finally, we assessed the PSE shifts relative to baseline during the online stimulation period (i.e., mean of blocks 3–4), in which there were no significant effects of tDCS intensity [F(1, 27) = 2.5, p = 0.13, ηp2 = 0.085], performance group [F(1, 27) = 0.25, p = 0.62, ηp2 = 0.009] and no intensity x performance interaction [F(1, 27) = 0.019, p = 0.89, ηp2 = 0.001]. Likewise, the overall change in PSE during the experiment (online and offline: mean of Blocks 3–6; Figure 6) found, in contrast to Benwell et al. (2015), that there were no significant effects of either tDCS-intensity [F(1, 27) = 0.44, p = 0.51, ηp2 = 0.16], performance group [F(1, 27) = 0.27, p = 0.61, ηp2 = 0.01] and no interaction between tDCS intensity x performance [F(1, 27) = 0.09, p = 0.77, ηp2 = 0.003].
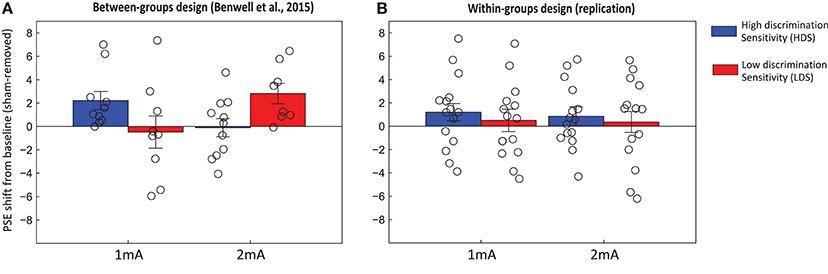
Figure 6. Mean shift of spatial bias (PSE) across Blocks 3–6, relative to baseline (Blocks 1 & 2), with Sham data extracted. Individual shifts for each participant are overlaid. Graph (A) represents the shifts observed in Benwell et al. (2015) using a between-groups design, and graph (B) shows the data from the present within-subjects design experiment.
Task Precision (Curve Width)
Due to the performance group allocation that was based on baseline curve width values, a 3 × 6 (tDCS-intensity × Block) ANOVA found a significant effect of performance group [F(1, 27) = 18.41, p < 0.001, ηp2 = 0.41], and also a Block × Performance interaction [F(5, 27) = 3.70, p = 0.004, ηp2 = 0.12]. A series of independent samples t-tests to directly compare the HDS and LDS groups, separately for each block (Blocks 3–6, baseline removed), found a between-group difference in Block 6 [t(27) = 2.09, p = 0.046]. Thus, the HDS group maintained their baseline precision throughout the experiment, whereas the LDS group had further reduced precision by Block 6 compared to baseline.
Consistency of Response to tDCS
Figure 7 illustrates the distribution of overall spatial attention shifts (mean of Blocks 3–6 relative to baseline, and sham data extracted) for each individual tested, separately for the 1 and 2 mA tDCS intensities and the LDS and HDS performance groups. Contrary to the results of Benwell et al. (2015), where all of the HDS individuals shifted rightward relative to sham with 1 mA, and all-but-one of the LDS performers shifted rightward with 2 mA, we found a high degree of variability of response to both tDCS intensities. We predicted that the majority of HDS individuals would shift rightward relative to sham with 1 mA but not, or to a lesser extent, with 2 mA. Although 10/15 HDS participants did shift rightward with 1 mA, only 7 (46.67% of total) had a larger rightward shift with 1 mA compared to 2 mA, as per our original hypothesis. Similarly, we predicted that LDS individuals would shift rightward with 2 mA but not 1 mA. We found that 8/14 of LDS participants shifted rightward with 2 mA, but only 5 (35.71% of total) shifted further right with 2 mA compared to 1 mA, as predicted.
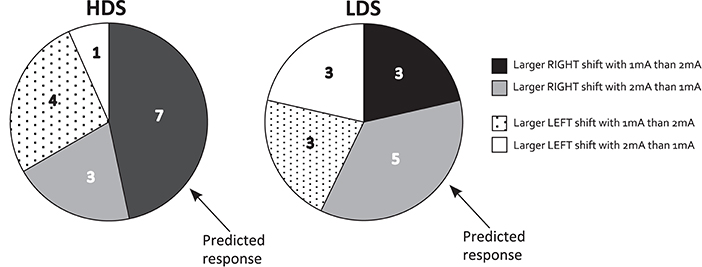
Figure 7. Distribution of behavioral response shown separately for high- and low discrimination sensitivity performance groups (HDS and LDS). The number of individuals in each performance group who exhibited left/right directional shifts of spatial attention in response to 1 and 2 mA tDCS (after baseline-correction and sham-extraction) are shown. Those conforming to the initial predictions as per Benwell et al. (2015) are highlighted.
Group Performance: Separate Performance Split for Each Condition
It is possible that by allocating participants into HDS and LDS performance groups based on average baseline performance across the three sessions, we may have failed to take into account between session variations in performance which could have contributed to our observed null effects of tDCS. Although 18/29 participants (62.1%) were allocated to the same group on all three occasions (11 HDS & 7 LDS), the remaining 11/29 (37.9%) were only allocated to the same group on 2 of 3 days. To assess this, we specifically probed spatial attention shifts in the 18 participants who were allocated consistently across the three sessions. A 2 × 2 ANOVA on the overall shifts of spatial bias from baseline (2 sham-extracted stimulation conditions × 2 performance groups) identified no overall effects of current strength [F(1, 16) = 0.061, p = 0.81, ηp2 = 0.004] nor performance group [F(1, 16) = 0.007, p = 0.93, ηp2 < 0.001] and no current strength x performance group interaction [F(1, 16) = 0.49, p = 0.5, ηp2 = 0.029]. Secondly, we then allocated participants to the HDS and LDS groups based on their mean baseline curve width for each condition separately (e.g., a participant may be a HDS performer in two of three conditions and LDS in the third). The mean spatial bias shift from baseline (Blocks 3–6 averaged) was then calculated and 95% confidence intervals were computed using 20,000 bootstrap permutations of the data. Figure 8 shows a substantial overlap of the confidence intervals for each stimulation condition and performance group, supporting the overall conclusion of no interaction between baseline performance and current strength.
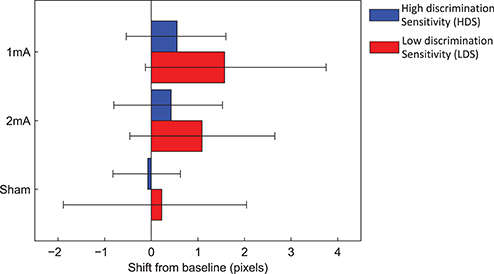
Figure 8. Mean spatial attention shifts, with performance split based on each condition separately. The mean curve width was calculated separately for each condition, and participants whose curve width fell above the mean were allocated to HDS, and below the mean to LDS. Ninety-five percentage confidence intervals are shown.
Bayesian Comparison of Studies 1&2
We then formally compared the outcomes of Studies 1 & 2 using Bayesian analysis. Based on Dienes (2014), this method takes the effect size of Study 1 into account and assesses whether a replication study is able to provide support for the null hypothesis (i.e., no evidence for a tDCS current and baseline performance interaction: a failed replication, where B < 1/3), the alternative hypothesis (i.e., evidence for an interaction: a successful replication, where B > 3) or whether the replication study is insensitive to support either hypothesis (where B >1/3 and <3).
Current Strength × Baseline Performance Interaction
In Benwell et al. we identified an interaction between baseline performance and current strength, where F(1, 34) = 8.465, p = 0.006. For Study 1 the difference in bias shifts between the good and poor performance groups (in pixels) was calculated, separately for the 1 and 2 mA conditions (1 mA HDS = 2.22, 2 mA HDS = −0.11, 1 mA vs. 2 mA difference = 2.33; 1 mA LDS = −0.48, 2 mA LDS = 2.82, 1 mA vs. 2 mA difference = −3.30). The difference of these two differences was then calculated (5.63 pixels). The same method was used for Study 2: 1 mA HDS = 1.21, 2 mA HDS = 0.85, 1 mA vs. 2 mA difference = 0.36; 1 mA LDS = 0.5, 2 mA LDS = 0.36, 1 mA vs. 2 mA difference = 0.14; difference of differences = 0.219 pixels. The standard error of Study 2 was 0.735 (based on the current × performance interaction of F = 0.089 and corrected to 0.76 due to degrees of freedom of <30, as per Dienes, 2014). A one-tailed test performed via Dienes (2008; http://www.lifesci.sussex.ac.uk/home/Zoltan_Dienes/inference/bayes_factor.swf) estimated a Bayes factor of 0.17, indicating a failed replication of the current strength × baseline performance interaction from Benwell et al. (2015).
Overall Rightward Shift in Response to LA/RC Stimulation
In Benwell et al., there was an overall rightward shift of 1.03 pixels for the LA/RC montage relative to sham [one sample t-test against zero: t(37) = 2.003, p = 0.052], but not the opposite (RA/LC) montage. In this replication study we identified a mean overall rightward shift of 0.74 pixels (SE = 0.57, corrected to 0.58), producing a Bayes factor of 1.58. The present data is therefore insensitive to enable a distinction between the theory and the null hypothesis for this secondary question.
Discussion
We aimed here to conceptually replicate our recent study (Benwell et al., 2015) in which we reported a significant non-linear effect of tDCS that was dependent on both current intensity (1 vs. 2 mA) and the baseline state of the individual (high- vs. low-discrimination sensitivity on the landmark task). The experimental design was modified in order to allow a direct comparison of the two current intensities within individuals rather than between groups. As per our previous results, we predicted that individuals with high baseline task precision (HDS) on the landmark task would exhibit a left-to-right shift of spatial attention in response to only low-dose (1 mA) P5-anodal/P6-cathodal tDCS, whereas those with low baseline precision (LDS) would exhibit the same rightward attention shift in response to only high-dose (2 mA) stimulation. In contrast, we found no overall effects of bi-parietal tDCS on spatial attention bias relative to sham, and in particular, no evidence of an interaction between tDCS intensity and baseline task performance. These results provide further evidence of the poor replicability of positive tDCS findings (Koenigs et al., 2009; Costa et al., 2015; Horvath et al., 2016a; Vannorsdall et al., 2016) and the importance of selecting an appropriate experimental design to validate these effects.
Inter-individual Variability
In contrast to both Benwell et al. (2015) and Giglia et al. (2011) we did not succeed here in replicating the overall rightward shift of spatial attention bias with a bi-parietal left P5 anode/right P6 cathode montage. Although there was indeed a small mean rightward shift relative to the sham protocol in response to both stimulation intensities, and for both performance groups (Figure 6), these shifts failed to reach significance. The Bayesian analysis of this overall rightward shift, comparing the two studies, indicates that the replication data is unfortunately insensitive to allow us to distinguish between the presence or absence of an effect (BF = 1.58), although eliciting an overall stimulation effect was not the main aim of this study. In fact, there was a high inter-individual variability of response during both tDCS protocols in this dataset which was not present in the previous study (Krause and Kadosh, 2014; López-Alonso et al., 2014; Wiethoff et al., 2014; Chew et al., 2015; Dyke et al., 2016; Horvath et al., 2016b; Tremblay et al., 2016). In Benwell et al. (Figure 6A) all of the HDS individuals who received 1 mA shifted rightward relative to sham, and similarly, all of the LDS individuals shifted rightward with 2 mA, giving rise to a convincing performance x intensity interaction. There was no such group-level consistency in the present data (Figure 6B).
Why might these differences in effects have arisen between the two datasets? One possibility is statistical error: a Type I error in Benwell et al., based on a relatively small sample size (four groups of 8–11 individuals) might have generated this statistically significant effect by chance. Indeed, our replication sample of 29 individuals here is again (admittedly) small, yet the Bayesian comparison of both studies for the interaction effect suggests that the data in Study 2 are adequately sensitive to interpret this as a failed replication (BF = 0.17). Indeed, these sample sizes are consistent with those adopted in the current non-invasive brain stimulation literature and serve to highlight the need for robust replication of outcomes with appropriately large sample sizes (Minarik et al., 2016).
Importance of Experimental Design
Only 7/15 of our HDS performers exhibited a larger rightward spatial bias shift with 1 mA than with 2 mA, and 5/14 LDS individuals exhibited a larger rightward shift with 2 mA compared to 1 mA, as per our original predictions (Figure 7). Due to the between-group design of Benwell et al., we were previously unable to probe this response across the two stimulation intensities. Therefore, in addition to highlighting the need for robust replication of non-invasive brain stimulation outcomes, these results also remind us of the importance of selecting an appropriate experimental design to probe the relationship between tDCS and modulation of behavior.
Methodological Differences between Studies
For the reasons outlined in the section Rationale for Procedural Differences between Experiments, the experimental design was modified in this conceptual replication relative to Benwell et al. (2015) with the aim of simplifying the study parameters. In particular, the reduction of the stimulation duration from 20 to 15 min could have influenced the results, however the significant effects in Benwell et al. were visible within the first 15 min of stimulation, and were also evident after just 10 min of bi-parietal stimulation in Giglia et al. (2011). Therefore we still expected to see an intensity × performance interaction using this design, if it were present.
Secondly, the increased duration of each experimental block (3–4 min in Benwell et al. vs. 7 min here) might have led to increased fatigue in our participants, caused by a higher demand on sustained attention resources. In spatial attention paradigms, decreased arousal/alertness (often driven by increased time-on-task) typically generates a reliable left-to-right shift of spatial bias (Bellgrove et al., 2004; Fimm et al., 2006; Dufour et al., 2007; Dodds et al., 2008; Benwell et al., 2013a,b; Newman et al., 2013, Benwell et al., 2017; Veniero et al., 2017). This is likely to be due to depletion of right-hemisphere lateralised ventral (sustained) attention resources which, in turn, leads to a disruption of the right dorsal (spatial) attention network (Corbetta and Shulman, 2002, 2011; Corbetta et al., 2005). However, there was no overall rightward shift of spatial bias evident here, making this explanation for the difference in outcomes unlikely.
Non-linear and State-Dependent Effects of tDCS
Whilst this data may introduce some questions regarding the reliability of the non-linear, state-dependent effect of current strength in this particular sample of individuals, it is possible that an additional set of yet-unknown variables are responsible for the failure to replicate here. Due to the large parameter space of the tDCS technique, that has yet to be fully explored and documented (Fertonani and Miniussi, 2016), it remains possible that the two sample groups differed in still more complex ways. Although the participants in the present study and in Benwell et al. (2015) were similar in terms of age (mean age = 21.43 vs. 22.9, respectively) and gender (16F/13M vs. 19F/19M), there may have been additional differences in, for example, neurochemistry, caffeine intake, and menstrual phase, all of which are prone to influence the excitability of the target neuronal populations, rendering them more (or less) amenable to the effects of stimulation. Yet without these important pieces of the puzzle we find ourselves some way short of developing a reliable means of modulating cognition and behavior using this technique.
Conclusion
We aimed to replicate our previous study (Benwell et al., 2015), where we found a non-linear, state-dependent interaction between tDCS intensity (1mA vs. 2mA) and baseline performance (high- vs. low precision) on a visuospatial attention task. A within-groups design (vs. between-groups in the previous study) identified no overall effects of tDCS on spatial bias, and no current × performance interaction. These results highlight the need for robust replication of positive tDCS results to better understand the efficacy of, and mechanisms involved in, non-invasive brain stimulation.
Author Contributions
GL conceived the study. GL, FF, NS, MC, and GM collected the data. GL, FF and NS analyzed and interpreted the data. All authors wrote the manuscript.
Funding
This work was supported by a University of Glasgow College of Science and Engineering Scholarship to GL. CB and GT are supported by a Wellcome Trust grant to GT [grant number 098434].
Conflict of Interest Statement
The authors declare that the research was conducted in the absence of any commercial or financial relationships that could be construed as a potential conflict of interest.
Acknowledgments
We would like to thank Zoltan Dienes for his helpful communication regarding the Bayesian analysis presented in this study.
References
Antal, A., Keeser, D., Priori, A., Padberg, F., and Nitsche, M. A. (2015). Conceptual and procedural shortcomings of the systematic review evidence that Transcranial Direct Current Stimulation (tDCS) generates little-to-no reliable neurophysiologic effect beyond MEP amplitude modulation in healthy human subjects: a systematic review by Horvath and co-workers. Brain Stimul. 8:846. doi: 10.1016/j.brs.2015.05.010
Batsikadze, G., Moliadze, V., Paulus, W., Kuo, M. F., and Nitsche, M. A. (2013). Partially non-linear stimulation intensity-dependent effects of direct current stimulation on motor cortex excitability in humans. J. Physiol. 591, 1987–2000. doi: 10.1113/jphysiol.2012.249730
Bellgrove, M. A., Dockree, P. M., Aimola, L., and Robertson, I. H. (2004). Attenuation of spatial attentional asymmetries with poor sustained attention. Neuroreport 15, 1065–1069. doi: 10.1097/00001756-200404290-00027
Benwell, C. S., Harvey, M., and Thut, G. (2014). On the neural origin of pseudoneglect: EEG-correlates of shifts in line bisection performance with manipulation of line length. Neuroimage 86, 370–380. doi: 10.1016/j.neuroimage.2013.10.014
Benwell, C. S. Y., Harvey, M., Gardner, S., and Thut, G. (2013a). Stimulus- and state-dependence of systematic bias in spatial attention: additive effects of stimulus-size and time-on-task. Cortex 49, 827–836. doi: 10.1016/j.cortex.2011.12.007
Benwell, C. S. Y., Keitel, C., Harvey, M., Gross, J., and Thut, G. (2017). Trial-by-trial co-variation of pre-stimulus EEG alpha power and visuospatial bias reflects a mixture of stochastic and deterministic effects. Eur. J. Neurosci. doi: 10.1111/ejn.13688. [Epub ahead of print].
Benwell, C. S. Y., Learmonth, G., Miniussi, C., Harvey, M., and Thut, G. (2015). Non-linear effects of transcranial direct current stimulation as a function of individual baseline performance: evidence from biparietal tDCS influence on lateralized attention bias. Cortex 69, 152–165. doi: 10.1016/j.cortex.2015.05.007
Benwell, C. S. Y., Thut, G., Learmonth, G., and Harvey, M. (2013b). Spatial attention: differential shifts in pseudoneglect direction with time-on-task and initial bias support the idea of observer subtypes. Neuropsychologia 51, 2747–2756. doi: 10.1016/j.neuropsychologia.2013.09.030
Berryhill, M. E., and Jones, K. T. (2012). tDCS selectively improves working memory in older adults with more education. Neurosci. Lett. 521, 148–151. doi: 10.1016/j.neulet.2012.05.074
Bortoletto, M., Pellicciari, M. C., Rodella, C., and Miniussi, C. (2015). The interaction with task-induced activity is more important than polarization: a tDCS study. Brain Stimul. 8, 269–276. doi: 10.1016/j.brs.2014.11.006
Bowers, D., and Heilman, K. M. (1980). Pseudoneglect: effects of hemispace on a tactile line bisection task. Neuropsychologia 18, 491–498. doi: 10.1016/0028-3932(80)90151-7
Brunoni, A. R., Amadera, J., Berbel, B., Volz, M. S., Rizzerio, B. G., and Fregni, F. (2011). A systematic review on reporting and assessment of adverse effects associated with transcranial direct current stimulation. Int. J. Neuropsychopharmacol. 14, 1133–1145. doi: 10.1017/S1461145710001690
Cabral, M. E., Baltar, A., Borba, R., Galvão, S., Santos, L., Fregni, F., et al. (2015). Transcranial direct current stimulation: before, during, or after motor training? Neuroreport 26, 618–622. doi: 10.1097/WNR.0000000000000397
Chew, T. A., Ho, K. A., and Loo, C. (2015). Inter-and intra-individual variability in response to anodal tDCS at varying current densities. Brain Stimul. 8:374. doi: 10.1016/j.brs.2015.01.199
Çiçek, M., Deouell, L. Y., and Knight, R. T. (2009). Brain activity during landmark and line bisection tasks. Front. Hum. Neurosci. 3:7. doi: 10.3389/neuro.09.007.2009
Corbetta, M., and Shulman, G. L. (2002). Control of goal-directed and stimulus-driven attention in the brain. Nat. Rev. Neurosci. 3, 201–215. doi: 10.1038/nrn755
Corbetta, M., and Shulman, G. L. (2011). Spatial neglect and attention networks. Annu. Rev. Neurosci. 34, 569–599. doi: 10.1146/annurev-neuro-061010-113731
Corbetta, M., Kincade, M. J., Lewis, C., Snyder, A. Z., and Sapir, A. (2005). Neural basis and recovery of spatial attention deficits in spatial neglect. Nat. Neurosci. 8:1603. doi: 10.1038/nn1574
Costa, T. L., Gualtieri, M., Barboni, M. T., Katayama, R. K., Boggio, P. S., and Ventura, D. F. (2015). Contrasting effects of transcranial direct current stimulation on central and peripheral visual fields. Exp. Brain Res. 233, 1391–1397. doi: 10.1007/s00221-015-4213-0
de Hollander, G., Labruna, L., Sellaro, R., Trutti, A., Colzato, L. S., Ratcliff, R., et al. (2016). Transcranial direct current stimulation does not Influence the speed–accuracy tradeoff in perceptual decision-making: evidence from three independent studies. J. Cogn. Neurosci. 28, 1283–1294. doi: 10.1162/jocn_a_00967
Dienes, Z. (2008). Understanding Psychology as a Science: An Introduction to Scientific and Statistical Inference. Basingstoke, UK: Palgrave Macmillan.
Dienes, Z. (2014). Using Bayes to get the most out of non-significant results. Front. Psychol. 5:781. doi: 10.3389/fpsyg.2014.00781
Dockery, C. A., Hueckel-Weng, R., Birbaumer, N., and Plewnia, C. (2009). Enhancement of planning ability by transcranial direct current stimulation. J. Neurosci. 29, 7271–7277. doi: 10.1523/JNEUROSCI.0065-09.2009
Dodds, C. M., van Belle, J., Peers, P. V., Dove, A., Cusack, R., Duncan, J., et al. (2008). The effects of time-on-task and concurrent cognitive load on normal visuospatial bias. Neuropsychology 22, 545–552. doi: 10.1037/0894-4105.22.4.545
Dufour, A., Touzalin, P., and Candas, V. (2007). Time-on-task effect in pseudoneglect. Exp. Brain Res. 176, 532–537. doi: 10.1007/s00221-006-0810-2
Dyke, K., Kim, S., Jackson, G. M., and Jackson, S. R. (2016). Intra-subject consistency and reliability of response following 2 ma transcranial direct current stimulation. Brain Stimul. 9, 819–825. doi: 10.1016/j.brs.2016.06.052
Fertonani, A., and Miniussi, C. (2016). Transcranial electrical stimulation: what we know and do not know about mechanisms. Neuroscientist. doi: 10.1177/1073858416631966. [Epub ahead of print].
Fimm, B., Willmes, K., and Spijkers, W. (2006). The effect of low arousal on visuo-spatial attention. Neuropsychologia 44, 1261–1268. doi: 10.1016/j.neuropsychologia.2006.01.027
Fink, G. R., Marshall, J. C., Shah, N. J., Weiss, P. H., Halligan, P. W., Grosse-Ruyken, M., et al. (2000a). Line bisection judgments implicate right parietal cortex and cerebellum as assessed by fMRI. Neurology 28, 1324–1331. doi: 10.1212/WNL.54.6.1324
Fink, G. R., Marshall, J. C., Weiss, P. H., and Zilles, K. (2001). The neural basis of vertical and horizontal line bisection judgments: an fMRI study of normal volunteers. Neuroimage 14, 59–67. doi: 10.1006/nimg.2001.0819
Fink, G. R., Marshall, J. C., Weiss, P. H., Shah, N. J., Toni, I., Halligan, P. W., et al. (2000b). ‘Where’ depends on ‘what’: a differential functional anatomy for position discrimination in one- versus two-dimensions. Neuropsychologia 38, 1741–1748. doi: 10.1016/S0028-3932(00)00078-6
Foxe, J. J., McCourt, M. E., and Javitt, D. C. (2003). Right hemisphere control of visuospatial attention: line bisection judgements evaluated with high-density electrical mapping and source analysis. Neuroimage 19, 710–726. doi: 10.1016/S1053-8119(03)00057-0
Giglia, G., Mattaliano, P., Puma, A., Rizzo, S., Fierro, B., and Brighina, F. (2011). Neglect-like effects induced by tDCS modulation of posterior parietal cortices in healthy subjects. Brain Stimul. 4, 294–299. doi: 10.1016/j.brs.2011.01.003
Gill, J., Shah-Basak, P. P., and Hamilton, R. (2015). It's the thought that counts: examining the task-dependent effects of transcranial direct current stimulation on executive function. Brain Stimul. 8, 253–259. doi: 10.1016/j.brs.2014.10.018
Gözenman, F., and Berryhill, M. E. (2016). Working memory capacity differentially influences responses to tDCS and HD-tDCS in a retro-cue task. Neurosci. Lett. 629, 105–109. doi: 10.1016/j.neulet.2016.06.056
Horvath, J. C. (2015). New quantitative analyses following price & hamilton's critique do not change original findings of Horvath et al. Brain Stimul. 8, 665–666. doi: 10.1016/j.brs.2015.05.001
Horvath, J. C., Carter, O., and Forte, J. D. (2016a). No significant effect of transcranial direct current stimulation (tDCS) found on simple motor reaction time comparing 15 different simulation protocols. Neuropsychologia 91, 544–552. doi: 10.1016/j.neuropsychologia.2016.09.017
Horvath, J. C., Forte, J. D., and Carter, O. (2015a). Transcranial direct current stimulation demonstrates little-to-no reliable or significant effect on any cognitive/behavioral or neurophysiologic outcome measure: a comprehensive meta-analysis. Brain Stimul. 2, 318–319. doi: 10.1016/j.brs.2015.01.034
Horvath, J. C., Forte, J. D., and Carter, O. (2015b). Quantitative review finds no evidence of cognitive effects in healthy populations from single-session transcranial direct current stimulation (tDCS). Brain Stimul. 8, 535–550. doi: 10.1016/j.brs.2015.01.400
Horvath, J. C., Forte, J. D., and Carter, O. (2015c). Evidence that transcranial direct current stimulation (tDCS) generates little-to-no reliable neurophysiologic effect beyond MEP amplitude modulation in healthy human subjects: a systematic review. Neuropsychologia 66, 213–236. doi: 10.1016/j.neuropsychologia.2014.11.021
Horvath, J. C., Vogrin, S. J., Carter, O., Cook, M. J., and Forte, J. D. (2016b). Effects of a common transcranial direct current stimulation (tDCS) protocol on motor evoked potentials found to be highly variable within individuals over 9 testing sessions. Exp. Brain Res. 234, 2629–2642. doi: 10.1007/s00221-016-4667-8
Hsu, T. Y., Juan, C. H., and Tseng, P. (2016). Individual differences and state-dependent responses in transcranial direct current stimulation. Front. Hum. Neurosci. 10:643. doi: 10.3389/fnhum.2016.00643
Hsu, T. Y., Tseng, P., Liang, W. K., Cheng, S. K., and Juan, C. H. (2014). Transcranial direct current stimulation over right posterior parietal cortex changes prestimulus alpha oscillation in visual short-term memory task. Neuroimage 98, 306–313. doi: 10.1016/j.neuroimage.2014.04.069
Koenigs, M., Ukueberuwa, D., Campion, P., Grafman, J., and Wassermann, E. (2009). Bilateral frontal transcranial direct current stimulation: failure to replicate classic findings in healthy subjects. Clin. Neurophysiol. 120, 80–84. doi: 10.1016/j.clinph.2008.10.010
Krause, B., and Kadosh, R. C. (2014). Not all brains are created equal: the relevance of individual differences in responsiveness to transcranial electrical stimulation. Front. Syst. Neurosci. 8:25. doi: 10.3389/fnsys.2014.00025
Learmonth, G., Thut, G., Benwell, C. S., and Harvey, M. (2015). The implications of state-dependent tDCS effects in aging: behavioural response is determined by baseline performance. Neuropsychologia 74, 108–119. doi: 10.1016/j.neuropsychologia.2015.01.037
Longo, M., Trippier, S., Vagnoni, E., and Lourenco, S. (2015). Right hemisphere control of visuospatial attention in near space. Neuropsychologia 70, 350–357. doi: 10.1016/j.neuropsychologia.2014.10.035
López-Alonso, V., Cheeran, B., Río-Rodríguez, D., and Fernández-del-Olmo, M. (2014). Inter-individual variability in response to non-invasive brain stimulation paradigms. Brain Stimul. 7, 372–380. doi: 10.1016/j.brs.2014.02.004
McCourt, M. E., and Jewell, G. (1999). Visuospatial attention in line bisection: stimulus modulation of pseudoneglect. Neuropsychologia 37, 843–855. doi: 10.1016/S0028-3932(98)00140-7
Milner, A. D., Harvey, M., Roberts, R. C., and Forster, S. V. (1993). Line bisection errors in visual neglect: misguided action or size distortion? Neuropsychologia 31, 39–49. doi: 10.1016/0028-3932(93)90079-F
Minarik, T., Berger, B., Althaus, L., Bader, V., Biebl, B., Brotzeller, F., et al. (2016). The importance of sample size for reproducibility of tDCS effects. Front. Hum. Neurosci. 10:453. doi: 10.3389/fnhum.2016.00453
Minarik, T., Sauseng, P., Dunne, L., Berger, B., and Sterr, A. (2015). Effects of anodal transcranial direct current stimulation on visually guided learning of grip force control. Biology 4, 173–186. doi: 10.3390/biology4010173
Mungee, A., Burger, M., and Bajbouj, M. (2016). No effect of cathodal transcranial direct current stimulation on fear memory in healthy human subjects. Brain Sci. 6:55. doi: 10.3390/brainsci6040055
Newman, D. P., O'Connell, R. G., and Bellgrove, M. A. (2013). Linking time-on-task, spatial bias and hemispheric activation asymmetry: a neural correlate of rightward attention drift. Neuropsychologia 51, 1215–1223. doi: 10.1016/j.neuropsychologia.2013.03.027
Nilsson, J., Lebedev, A. V., Rydström, A., and Lövdén, M. (2017). Direct-current stimulation does little to improve the outcome of working memory training in older adults. Psychol. Sci. 28, 907–920. doi: 10.1177/0956797617698139
Nitsche, M. A., and Paulus, W. (2000). Excitability changes induced in the human motor cortex by weak transcranial direct current stimulation. J. Physiol. 527, 633–639. doi: 10.1111/j.1469-7793.2000.t01-1-00633.x
Price, A. R., and Hamilton, R. H. (2015). A re-evaluation of the cognitive effects from single-session transcranial direct current stimulation. Brain Stimul. 8, 663–665. doi: 10.1016/j.brs.2015.03.007
Rossi, S., Hallett, M., Rossini, P. M., and Pascual-Leone, A., and Safety of TMS Consensus Group (2009). Safety, ethical considerations, and application guidelines for the use of transcranial magnetic stimulation in clinical practice and research. Clin. Neurophysiol. 120, 2008–2039. doi: 10.1016/j.clinph.2009.08.016
Seyed Majidi, N., Verhage, M. C., Donchin, O., Holland, P., Frens, M. A., and van der Geest, J. N. (2017). Cerebellar tDCS does not improve performance in probabilistic classification learning. Exp. Brain Res. 235, 421–428. doi: 10.1007/s00221-016-4800-8
Shen, B., Yin, Y., Wang, J., Zhou, X., McClure, S. M., and Li, J. (2016). High-definition tDCS alters impulsivity in a baseline-dependent manner. Neuroimage 143, 343–352. doi: 10.1016/j.neuroimage.2016.09.006
Stagg, C. J., Jayaram, G., Pastor, D., Kincses, Z. T., Matthews, P. M., and Johansen-Berg, H. (2011). Polarity and timing-dependent effects of transcranial direct current stimulation in explicit motor learning. Neuropsychologia 49, 800–804. doi: 10.1016/j.neuropsychologia.2011.02.009
Thiebaut de Schotten, M., Dell'Acqua, F., Forkel, S. J., Simmons, A., Vergani, F., Murphy, D. G., et al. (2011). A lateralized network for visuospatial attention. Nat. Neurosci. 14, 1245–1246. doi: 10.1038/nn.2905
Tremblay, S., Larochelle-Brunet, F., Lafleur, L. P., El Mouderrib, S., Lepage, J. F., and Théoret, H. (2016). Systematic assessment of duration and intensity of anodal transcranial direct current stimulation on primary motor cortex excitability. Eur. J. Neurosci. 44, 2184–2190. doi: 10.1111/ejn.13321
Tseng, P., Hsu, T. Y., Chang, C. F., Tzeng, O. J. L., Hung, D. L., Muggleton, N. G., et al. (2012). Unleashing potential: transcranial direct current stimulation over the right posterior parietal cortex improves change detection in low-performing individuals. J. Neurosci. 32, 10554–10561. doi: 10.1523/JNEUROSCI.0362-12.2012
Vannorsdall, T. D., van Steenburgh, J. J., Schretlen, D. J., Jayatillake, R., Skolasky, R. L., and Gordon, B. (2016). Reproducibility of tDCS results in a randomized trial: failure to replicate findings of tDCS-induced enhancement of verbal fluency. Cogn. Behav. Neurol. 29, 11–17. doi: 10.1097/WNN.0000000000000086
Veniero, D., Benwell, C. S. Y., Ahrens, M. M., and Thut, G. (2017). Inconsistent effects of parietal α-tACS on Pseudoneglect across two experiments: a failed internal replication. Front. Psychol. 8:952. doi: 10.3389/fpsyg.2017.00952
Verhage, M. C., Avila, E. O., Frens, M. A., Donchin, O., and van der Geest, J. N. (2017). Cerebellar tDCS does not enhance performance in an implicit categorization learning task. Front. Psychol. 8:476. doi: 10.3389/fpsyg.2017.00476
Westwood, S. J., Olson, A., Miall, R. C., Nappo, R., and Romani, C. (2016). Limits to tDCS effects in language: failures to modulate word production in healthy participants with frontal or temporal tDCS. Cortex 86, 64–82. doi: 10.1016/j.cortex.2016.10.016
Keywords: spatial attention, pseudoneglect, tDCS, plasticity, replication, bayesian analysis
Citation: Learmonth G, Felisatti F, Siriwardena N, Checketts M, Benwell CSY, Märker G, Thut G and Harvey M (2017) No Interaction between tDCS Current Strength and Baseline Performance: A Conceptual Replication. Front. Neurosci. 11:664. doi: 10.3389/fnins.2017.00664
Received: 06 September 2017; Accepted: 15 November 2017;
Published: 01 December 2017.
Edited by:
Joachim Lange, Heinrich Heine Universität Düsseldorf, GermanyReviewed by:
Toralf Neuling, University of Salzburg, AustriaTzu-Yu Hsu, Taipei Medical University, Taiwan
Copyright © 2017 Learmonth, Felisatti, Siriwardena, Checketts, Benwell, Märker, Thut and Harvey. This is an open-access article distributed under the terms of the Creative Commons Attribution License (CC BY). The use, distribution or reproduction in other forums is permitted, provided the original author(s) or licensor are credited and that the original publication in this journal is cited, in accordance with accepted academic practice. No use, distribution or reproduction is permitted which does not comply with these terms.
*Correspondence: Gemma Learmonth, Z2VtbWEubGVhcm1vbnRoQGdsYXNnb3cuYWMudWs=