 Kevin Joseph
 Soheil Mottaghi
 Olaf Christ1
 Thomas J. Feuerstein
 Ulrich G. Hofmann
- 1Section for Neuroelectronic Systems, Clinic for Neurosurgery, Medical Center- University of Freiburg, Faculty of Medicine, University of Freiburg, Freiburg, Germany
- 2Freiburg Institute for Advanced Studies, University of Freiburg, Freiburg, Germany
Modern electroceuticals are bound to employ the usage of electrical high frequency (130–180 Hz) stimulation carried out under closed loop control, most prominent in the case of movement disorders. However, particular challenges are faced when electrical recordings of neuronal tissue are carried out during high frequency electrical stimulation, both in-vivo and in-vitro. This stimulation produces undesired artifacts and can render the recorded signal only partially useful. The extent of these artifacts is often reduced by temporarily grounding the recording input during stimulation pulses. In the following study, we quantify the effects of this method, “blanking,” on the spike count and spike train statistics. Starting from a theoretical standpoint, we calculate a loss in the absolute number of action potentials, depending on: width of the blanking window, frequency of stimulation, and intrinsic neuronal activity. These calculations were then corroborated by actual high signal to noise ratio (SNR) single cell recordings. We state that, for clinically relevant frequencies of 130 Hz (used for movement disorders) and realistic blanking windows of 2 ms, up to 27% of actual existing spikes are lost. We strongly advice cautioned use of the blanking method when spike rate quantification is attempted.
IMPACT STATEMENT
Blanking (artifact removal by temporarily grounding input), depending on recording parameters, can lead to significant spike loss. Very careful use of blanking circuits is advised.
Introduction
Electrical stimulation of neuronal tissue is used to provide insights into neuronal responses (Penfield, 1958; Brindley and Lewin, 1968; McCreery et al., 1990; Tehovnik, 1996), to influence brain networks (Pezaris and Reid, 2007; Xie et al., 2014; Choi et al., 2016), and to alleviate clinically relevant symptoms of neurological disorders (Kandel et al., 2000; Tronnier et al., 2002). To evoke a response, an electrical charge is delivered via electrodes to the region of interest, as described in seminal work by Rattay (1989) and Tehovnik et al. (2006). Deep Brain Stimulation (DBS) with high frequencies (HFS), which has similar effects to lesioning (Benabid et al., 1991), but is not irreversible, has gained popularity since the 90's. It is now considered to be an effective, symptomatic treatment for diseases such as Parkinson's or Obsessive Compulsive Disorder (OCD) (Nuttin et al., 1999; Aouizerate et al., 2004; Abelson et al., 2005). HFS is understood to work by inhibiting neuronal activity in the stimulated brain region (McIntyre et al., 2004) or due to extracellular release of GABA (Hiller et al., 2007; Xie et al., 2014). HFS has also been shown to affect other neurotransmitter release (Lee et al., 2004; Deniau et al., 2010; Joseph et al., 2015).
Unfortunately, while synchronously attempting the “read-out” of neuron's electrophysiological responses during HFS, the obligatory high level of amplification leads to signal contamination or even frequent saturation of recording systems, i.e., the stimulation artifact (Hashimoto et al., 2002). The overlapping artifact may render the acquired neuronal signal difficult to analyze, which can be debilitating when neuronal spike statistics or responses are the focus of the investigation (Wagenaar and Potter, 2002).
Stimulation artifact removal techniques within recorded data has been a thriving field, where linear and non-linear filtering (Sennels et al., 1997; Parsa et al., 1998; Gnadt et al., 2003; Whittington et al., 2003, 2005) or artifact template subtraction utilizing a number of methods (Zhiyue and McCallum, 1998; Hashimoto et al., 2002; ter Braack et al., 2013) have been employed with mixed results.
Alternatively, several manufacturers of recording systems (Plexon Inc.—USA, Multi-Channel Systems—Germany) have implemented a hardware solution to prevent amplifier saturation by temporarily grounding inputs using a “blanking circuit.” The input stage of the amplifier is thus protected from saturation and even damage, with a trigger signal that marks the stimulation pulse. The amplifiers are reconnected to the circuit after a user defined a “blanking window,” based on manufacturer recommendations. It is evident that during the “blanking window,” the signal values are set to zero, thus masking valuable neuronal signals.
This protective blanking window needs to have a temporal onset at least at the start of the actual stimulus pulse and needs to cover the complete discharge period of the surrogate circuit of both the probe and electronics, which helps avoid cross talk between the stimulation and recording electrodes. This “artifact free” signal is then further analyzed for changes in LFP or spike content (Heffer and Fallon, 2008; ter Braack et al., 2013; Yi et al., 2013; Multichannel Systems, 2015; Qiu et al., 2015).
However, we caution users to exercise extreme care when using this seemingly bullet-proof method, as the chosen settings may very well have an influence on spike quantifications and indiscriminate use may introduce significant errors in real world spike count recordings for basic neuroscience (Georgopoulos et al., 1986) and neuroengineering (Serruya et al., 2002; Schwartz, 2004; Hochberg et al., 2006).
There exists a probability that the events of interest overlap with the blanking window, which could result in event loss and detrimental consequences for subsequent neurobiological conclusions, requiring additional means to validate experiments (Xie et al., 2014). The following study investigates the influence of this widely used technique from both a theoretical and experimental standpoint.
Methods
Theoretical Evaluation—Probability of Data Loss
To assess the potential impact of blanking on electrophysiological results based on spike statistics and counts, we utilize the spike probability of cells under investigation based on their interspike-interval-distribution. As previously described, spiking activity of neurons can be by a Poisson distribution and the interspike-interval-distribution (ISI) can be modeled by a Gamma distribution (Bair et al., 1994) (Figure 1). Cellular properties then define the ISI and thus variability is to be expected between consecutive spikes.
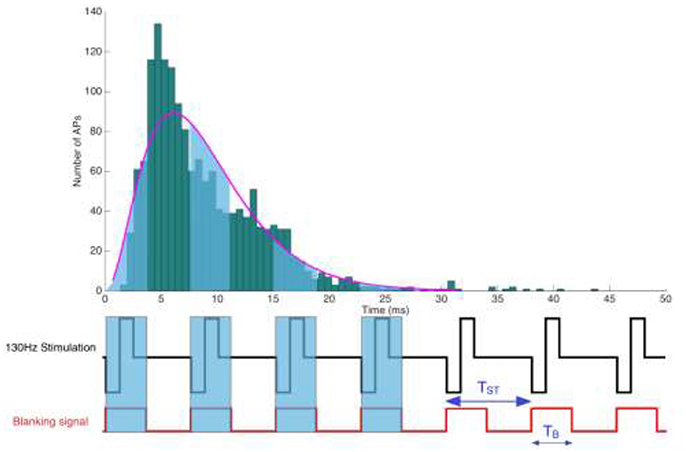
Figure 1. Illustration of a periodic rectangular stimulation pattern with a repetition period TST. (Below) Representation of a stimulation pulse train and the corresponding blanking signal, depicting its temporal extension beyond the actual stimulation pulse. Blanking windows are meant to suppress electrical signals thought to endanger sensitive amplifiers.
The stimulation pulse triggered blanking circuit is designed to not just mask the actual pulse artifact with a width of PW and a repetition frequency FST, but needs to include an additional safety margin to outlast the capacitive discharge, which could originate from either the system design or the electrode-tissue coupling. Setting the stimulation pulse width PW, a safety margin TM and the stimulation's repetition frequency FST, we seek to estimate the likelihood of a spike to fall within the blanking window TB = (PW+TM), where it will be lost.
The likelihood of a spike falling within TB is determined by the actual spiking probability of the neuron type under investigation, which is modeled by the Gamma distribution (Equation 1), defined with scale and shape parameters, a and b, respectively. The Gamma function Γ (a) and the mean value of the distribution μ are defined using Equations (2, 3).
The cumulative probability of the Gamma distribution between x1 and x2 can be calculated using Equations (4, 5). The maximal number of blanked bins Nb is determined using Equation 6, which integrates the ISI distribution of up to 99.95% of the counted events. If the number of blanked regions multiplied by the blanking window is larger than this x99.95 count, no spikes will be detected, as in Equation (7). The maximum probability of detection of non-blanked events is given by Equations (8, 9). Figure 2D illustrates blanking windows within the fitted Gamma distribution.
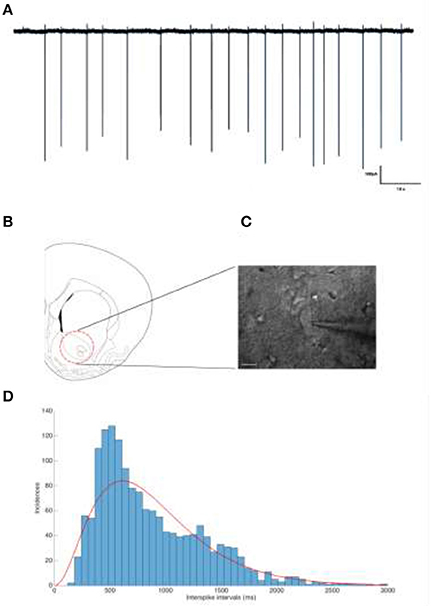
Figure 2. (A) Representative trace of a tonically firing cholinergic interneuron. The spiking frequency is ~1.12 Hz. (B) The neurons of interested were located and recorded from the nucleus accumbens. (C) IR-DIC image of a patched cholinergic interneuron. Scale bar is 20 μm. (D) Interspike interval distribution of Cholinergic interneurons show a Gamma distribution.
Then
Experimental Validation—Actual Data Loss
To validate our theoretical findings, we performed cell-attached patch clamp recordings of cholinergic interneurons from the nucleus accumbens of rats in a slice preparation. This provides high SNR recordings with action potentials easily identified, despite non-saturating stimulus artifacts (Figure 2B) providing ground truth measurements for spike detection and counts. Under these conditions, the stimulation artifact is clearly visible without obscuring the events, establishing a well-controlled test bed for the quantification of the blanking artifact. Inspite of the usage of rectangular pulses for the HFS, the non-rectangular stimulation artifact observed is as a result of effect of aliasing. Aliasing occurs when the sampling frequency is not high enough for the perfect digitization and reconstruction of the artifact. Since a rectangular pulse has infinite frequencies, it is close to impossible to increase the sampling frequency high enough to reconstruct the stimulation pulses.
Animals and Tissue Preparation
All protocols were approved by the responsible Animal Care Committee of the Regierungspräsidium Freiburg (Permit X16/02A), and all efforts were made to minimize the number of animals used, with respect to statistical constraints. Male Wistar rats (3–4 weeks old) (Janvier, France), housed in groups of 4, under standard lighting (12 h light-dark cycle), 22°C and 40% humidity were used in this study, and were allowed access to food and water ad libitum.
The rats were decapitated after an overdose of inhalation anesthetic (Forene, Baxter, USA), and the brains were quickly extracted and submerged in oxygenated ice-cold sucrose aCSF (artificial cerebrospinal fluid). Slices (300 μm) were prepared using a vibratome (VT 1200, Leica, Germany) containing the nucleus accumbens with coordinates previously described (Varatharajan et al., 2015). After incubation at 37°C for 30 min in sucrose fortified aCSF, and a resting phase of 20 min at room temperature, the slices were ready for patch clamp experiments. All experiments were carried out at 32°C, controlled by an inline heater (Multi Channel Systems, Reutlingen, Germany) (Stuart et al., 1993). Neurons were visualized at 40 × using infrared differential interference contrast (IR-DIC) video microscopy (XM-10, Olympus Corporation, Germany) (Figure 2B). Tissue slices were perfused with oxygenated aCSF containing: (in mM) 125 NaCl, 25 NaHCO3, 2.5 KCl, 1.25 NaH2PO4, 1 MgCl2, 2 CaCl2, and 25 Glucose (pH 7.4 with 5% CO2).
Electrophysiological Recordings
Recordings were carried out using a Multiclamp 700B Amplifier (Molecular Devices, USA) and the data was digitized using a CED 1401 Mark II (Cambridge Electronic devices, UK), acquired using a custom routine in IGOR Pro (Wavemetrics Inc., USA). Cholinergic interneurons from the Nucleus accumbens were chosen for their tonic firing behavior (Xie et al., 2014) (Figures 2B,C). The distribution of inter-spike-intevals of the cholinergic cells used in this study is shown in Figure 2D which can be modeled by a Gamma distribution (red line) in accordance with (Dayan and Abbott, 2001).
Slices were submerged in the recording chamber and continuously perfused (4 ml/min) with oxygenated aCSF (34°C). Recording electrodes were pulled from thick walled borosilicate glass capillaries (2.0 mm O.D. and 1.2 mm I.D), filled with 150 mM NaCl (3–5 MΩ) (Perkins, 2006). To prevent clogging of the electrode tip while approaching targeted cells, a positive pressure was applied (40 mbar). Once a dimple was observed on the cell membrane surface, the pressure was released and a GΩ seal was seen to form almost instantly. If not, light suction pulses were applied until the seal was obtained. To prevent artificial depolarization of the cell membrane, the voltage was clamped such that a 0 μA holding current was maintained, as described previously (Perkins, 2006). Action potentials could be observed almost instantaneously, a feature to be expected from tonically firing cholinergic interneurons (Figure 2A).
Electrical Stimulation
Bipolar platinum-iridium (Pt/Ir) electrodes (GBCBG30, FHC Inc., Maine) with a central cathode (Diameter: 75 μm, Area: 0.0062 mm2) and a concentric anode were used for stimulation at a distance of 500 μm from the cell soma. The stimulation was carried out either using a commercially available PlexStim (Plexon Inc., USA) or a stimulator developed in-house (Mottaghi and Hofmann, 2015; Mottaghi et al., 2015) used to generate biphasic electrical stimuli with amplitude of 12 μA.
Stimulation parameters were chosen based on therapeutic High Frequency Stimulation (HFS) as described previously (Varatharajan et al., 2015). Both stimulators were used in charge-balanced mode and the pulse width was controlled on-line with an oscilloscope (TPS2012, Tektronix, Switzerland) in parallel to the electrode. Stimulation runs of 100 s each were performed with a constant stimulation current of 12 μA, at a distance of 500 μm. Stimulation produces a visible artifact in the cell-attached extracellular recordings, despite the charge balanced stimulation (Figure 3A).
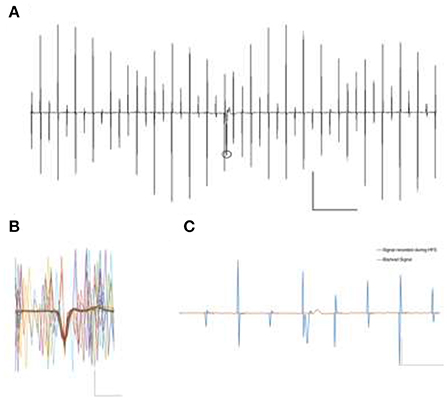
Figure 3. (A) Signal contamination during the application of 130 Hz electrical rectangular waveform stimulation. Stimulation parameters were biphasic, 130 Hz, 12 μA, 65 μs pulse window. The circle represents a detected event in spite of contaminating artifact. Scale X: 500 pA, Y:20 μs. (B) Overlay of some possible occurrences of stimulation artifacts, in themselves not able to veil the prominent spike Example trace of intrinsic firing spikes under the depicted cell-attached patch clamp recording. Scale X: 500 pA, Y:1 μs. (C) Stimulation contaminated cell attached spike recording. A blanking window of 1.5 ms very effectively removes all the stimulation artifacts but obviously shrouds parts of the spike as well (red line). Automated spike detection was then ineffective to detect the clipped spike in the blanked signal. Scale X: 500 pA, Y: 5 μs.
Experimental Paradigm
Experimental runs were divided into phases of 100 s each. Spike detection and counting was carried out offline in Matlab (Mathworks, USA) by an algorithm taking spike shapes into account. The algorithm is based on the detection of three main features of recorded events i.e., amplitude, rise-fall slopes, and the peak shape, defined during baseline recording. Based on arbitrarily chosen, overlapping signal windows, the algorithm detects potential events of interest despite artifact contamination by using the previously defined parameters. It then counts and archives the detected events for further statistical analysis. After each detection step, the event count was quantified and confirmed by a blinded user to be compared against the detected events. Figure 3B illustrates a detected event during the high frequency stimulation phase and an overlay of 67 distinct event contaminations to visualize possible artifact positions relative to the spikes. After baseline recordings (100 s), the cells were stimulated for 100 s and then allowed to rest for 300 s before further experiments were carried out. Each cell was measured in triplicate.
Results
The cell attached recording technique was chosen to obtain the best signal-to-noise ratio for action potentials despite ongoing electrical stimulation, yet did not protect against contamination. Even charge-balanced stimulation pulses frequently overlap action potentials with substantial amplitude (Figures 3A,B).
Signal deterioration, however, is worsened by setting all signal values to zero for the duration of the blanking window TB, as can be seen with an exemplary spike in Figure 3C. It illustrates the successful removal of the stimulation artifacts at the cost of a clear change in event parameters due to the inconsiderate use of the blanking mechanism. Such distorted events are generally not detected by baseline-oriented methods like the one utilized here.
As the above theoretical considerations illustrate, the usage of a blanking window will result in event loss, as given by Equation (9) (Figure 5). The event loss for different blanking window widths is dependent on the stimulation/blanking frequency (Figures 4A,B). The most commonly used blanking window of 2 ms leads to a spike loss rate of up to 30 %, at therapeutically relevant frequencies. Wider blanking windows, motivated by sensitive amplifiers with longer saturation periods, clearly aggravates the situation and event loss may reach up to 80%.
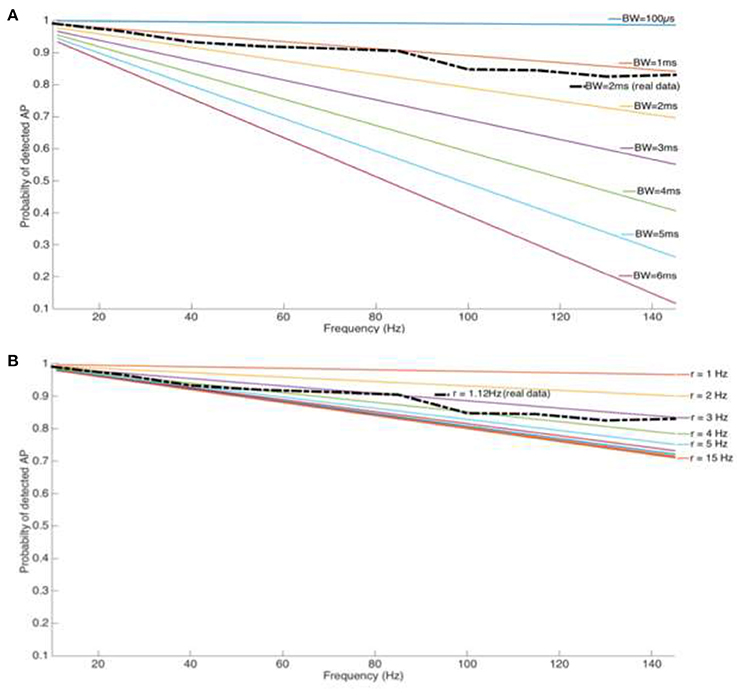
Figure 4. (A) Loss of spike count for a tonic firing cell type (Cholinergic interneuron from the Nucleus Accumbens) and stimulation pulse width Pw but increasing blanking window length and stimulation frequency. (B) Loss of spike count for a reasonable blanking window (Tb = 2 ms) and increasing stimulation frequency and spike rate.
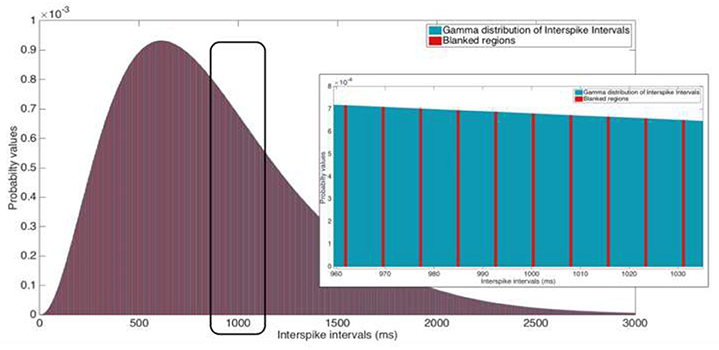
Figure 5. Illustration of a 2 ms blanking window suppressing 130 Hz stimulation. Inset: Zoomed view of the ISI that ranges from 960 to 1,035 ms. Ordinate scales are equal for both the ISI distribution and the inset image.
Any potential loss in event counts is influenced by electrophysiological properties of the cells under investigation, given by their firing rates. Although intuitive, the percentage of lost events is directly proportional to the spike rate. However, for cell types with a spike rate >3 Hz, the loss is independent of the spike rate and is influenced by the stimulation frequency alone. The length of the blanking window and the intrinsic mean of cells' spiking rate are two parameters that play an important role in detectable spikes while recording during electrical stimulation with blanking system on.
Figure 4A depicts a comparison of the blanking window over a range of 200 μs−6 ms, while Figure 4B illustrates a scenario with spiking rates from 1 to 15 Hz. A real life situation is overlaid on both figures with an average spiking rate of r = 1.12 Hz found from the cholinergic cells in this study, and blanking windows of 2 ms as a commonly used parameter (dashed-line).
Discussion and Conclusion
When it comes to utilizing electrical stimulation in the nervous system, electrophysiological recordings from an increasing number of neurons and an increasing number of experimental settings are in danger of being corrupted by the infamous stimulation artifact. The currently used gold standard of blanking the recording system during stimulation pulses to make the amplifiers invulnerable against saturation and potential damage may very well-introduce unexpected errors in precision analysis and reconstruction. Starting from theoretical considerations, we urge to a very cautious and well-reflected use of blanking as it inadvertently introduces loss of information by shrouding perfectly well-defined spikes relevant for statistics.
Even though it seems evident that the usage of any type of blanking circuit in real spike recordings is to be with great caution and its effects need to be studied prior to use, this report is, to our knowledge, the first one to quantify the detrimental effect blanking may have with respect to the actual event counts at clinically relevant stimulation frequencies. We approached this quantification by the known theoretical description of firing activity based on neuronal interspike-interval histograms. Blanking nullifies the very histogram bins, which coincide with the blanking window period and width within this distribution. As the histogram can be modeled by a Gamma function, it is possible to estimate the number of spikes affected, depending on the window width TB, its frequency FST and the average firing rate R, of the cell type under consideration. As the Gamma function is not limited in time, we restrict calculations to the 99.95 percentile and have to report on loosing up to 27% of spikes with a quite common blanking window of 2 ms and therapeutically relevant 130 Hz stimulation.
In order to validate our theoretical evaluation, we used high SNR data from cell attached recordings of cholinergic interneurons from the nucleus accumbens of rats. They were collected in context of a critical re-assessment of the effects of HFS in slices (Xie et al., 2014) and corroborate the theoretical results of substantial spike loss by blanking within the error margins of our automated spike detector.
In laboratory settings, where the mechanism of action is being explored, alternative stimulation modalities such as optogenetic stimulation can be used, even at high frequencies, to examine the effects on firing rates (Deisseroth, 2015; Huidobro et al., 2017, 2018). However, even this modality comes with its own difficulties and traps (Ayling et al., 2009; Cardin et al., 2009; Han et al., 2009).
In conclusion, we urge establishing confidence in spike statistics obtained during electrical stimulation by taking independent safeguards like pharmacological controls and careful experimental design. This is a critical and delicate issue which entails that all aspects of the experiment, analysis and conclusion in a study are accounted for based on the techniques and hardware used. Blanking, for example in this study, is a procedure, designed by the device manufacturer as a safety tool, which has been demonstrated to influence the outcome of a whole experiment potentially leading to false conclusions if not taken into consideration.
Author Contributions
SM and KJ conducted experimental and theoretical work; TF and UH supervised the experimental and theoretical work; OC provided technical support; SM, KJ, OC, TF, and UH wrote and reviewed the manuscript.
Conflict of Interest Statement
The authors declare that the research was conducted in the absence of any commercial or financial relationships that could be construed as a potential conflict of interest.
Acknowledgments
The authors would like to acknowledge the Peter-Osypka Foundation and the Freiburg Institute for Advanced Sciences (FRIAS) for funding.
References
Abelson, J. L., Curtis, G. C., Sagher, O., Albucher, R. C., Harrigan, M., Taylor, S. F., et al. (2005). Deep brain stimulation for refractory obsessive-compulsive disorder. Biol. Psychiatry 57, 510–516. doi: 10.1016/j.biopsych.2004.11.042
Aouizerate, B., Cuny, E., Martin-Guehl, C., Guehl, D., Amieva, H., Benazzouz, A., et al. (2004). Deep brain stimulation of the ventral caudate nucleus in the treatment of obsessive-compulsive disorder and major depression. Case report. J. Neurosurg. 101, 682–686. doi: 10.3171/jns.2004.101.4.0682
Ayling, O. G. S., Harrison, T. C., Boyd, J. D., Goroshkov, A., and Murphy, T. H. (2009). Automated light-based mapping of motor cortex by photoactivation of channelrhodopsin-2 transgenic mice. Nat. Methods 6, 219–224. doi: 10.1038/nmeth.1303
Bair, W., Koch, C., Newsome, W., and Britten, K. (1994). Power spectrum analysis of bursting cells in area MT in the behaving monkey. J. Neurosci. 14(5 Pt 1), 2870–2892. doi: 10.1523/JNEUROSCI.14-05-02870.1994
Benabid, A. L., Pollak, P., Gervason, C., Hoffmann, D., Gao, D. M., Hommel, M., et al. (1991). Long-term suppression of tremor by chronic stimulation of the ventral intermediate thalamic nucleus. Lancet 337, 403–406. doi: 10.1016/0140-6736(91)91175-T
Brindley, G. S., and Lewin, W. S. (1968). The sensations produced by electrical stimulation of the visual cortex. J. Physiol. 196, 479–493. doi: 10.1113/jphysiol.1968.sp008519
Cardin, J. A., Carlén, M., Meletis, K., Knoblich, U., Zhang, F., Deisseroth, K., et al. (2009). Driving fast-spiking cells induces gamma rhythm and controls sensory responses. Nature 459, 663–667. doi: 10.1038/nature08002
Choi, J. S., Brockmeier, A. J., McNiel, D. B., Kraus, L. M., von Príncipe, J. C., and Francis, J. T. (2016). Eliciting naturalistic cortical responses with a sensory prosthesis via optimized microstimulation. J. Neural Eng. 13:056007. doi: 10.1088/1741-2560/13/5/056007
Dayan, P., and Abbott, L. F. (2001). Theoretical neuroscience: Computational and mathematical modeling of neural systems. Cambridge, MA: Massachusetts Institute of Technology Press.
Deisseroth, K. (2015). Optogenetics: 10 years of microbial opsins in neuroscience. Nat. Neurosci. 18, 1213–1225. doi: 10.1038/nn.4091
Deniau, J.-M., Degos, B., Bosch, C., and Maurice, N. (2010). Deep brain stimulation mechanisms: beyond the concept of local functional inhibition. Eur. J. Neurosci. 32, 1080–1091. doi: 10.1111/j.1460-9568.2010.07413.x
Georgopoulos, A. P., Schwartz, A. B., and Kettner, R. E. (1986). Neuronal population coding of movement direction. Science 233, 1416–1419. doi: 10.1126/science.3749885
Gnadt, J. W., Echols, S. D., Yildirim, A., Zhang, H., and Paul, K. (2003). Spectral cancellation of microstimulation artifact for simultaneous neural recording in situ. IEEE Trans. Biomed. Eng. 50, 1129–1135. doi: 10.1109/TBME.2003.816077
Han, X., Qian, X., Bernstein, J. G., Zhou, H.-H., Franzesi, G. T., Stern, P., et al. (2009). Millisecond-timescale optical control of neural dynamics in the nonhuman primate brain. Neuron 62, 191–198. doi: 10.1016/j.neuron.2009.03.011
Hashimoto, T., Elder, C. M., and Vitek, J. L. (2002). A template subtraction method for stimulus artifact removal in high-frequency deep brain stimulation. J. Neurosci. Methods 113, 181–186. doi: 10.1016/S0165-0270(01)00491-5
Heffer, L. F., and Fallon, J. B. (2008). A novel stimulus artifact removal technique for high-rate electrical stimulation. J. Neurosci. Methods 170, 277–284. doi: 10.1016/j.jneumeth.2008.01.023
Hiller, A., Loeffler, S., Haupt, C., Litza, M., Hofmann, U., and Moser, A. (2007) Electrical high frequency stimulation of the caudate nucleus induces local GABA outflow in freely moving rats. J Neurosci. Methods 159, 286–290. doi: 10.1016/j.jneumeth.2006.07.023
Hochberg, L. R., Serruya, M. D., Friehs, G. M., Mukand, J. A., Saleh, M., Caplan, A. H., et al. (2006). Neuronal ensemble control of prosthetic devices by a human with tetraplegia. Nature 442, 164–171. doi: 10.1038/nature04970
Huidobro, N., De la Torre-Valdovinos, B., Mendez, A., Treviño, M., Arias-Carrion, O., Chavez, F., et al. (2018). Optogenetic noise-photostimulation on the brain increases somatosensory spike firing responses. Neurosci. Lett. 664, 51–57. doi: 10.1016/j.neulet.2017.11.004
Huidobro, N., Mendez-Fernandez, A., Mendez-Balbuena, I., Gutierrez, R., Kristeva, R., and Manjarrez, E. (2017). Brownian optogenetic-noise-photostimulation on the brain amplifies somatosensory-evoked field potentials. Front. Neurosci. 11:464. doi: 10.3389/fnins.2017.00464
Joseph, K., Varatharajan, R., Carvalho Neto, S. G., Hofmann, U., Tronnier, V., and Moser, A. (2015). Modulation of Extracellular Levels of 5-HT in the Caudate Putamen of freely moving rats by high frequency stimulation of the subthalamic nucleus. Open Neurosci. J. 8, 14–20. doi: 10.2174/1874082001408010014
Kandel, E. R., Schwartz, J. H., and Jessell, T. M. (2000). Principles of Neural Science. New York, NY: McGraw-Hill.
Lee, K. H., Chang, S.-Y., Roberts, D. W., and Kim, U. (2004). Neurotransmitter release from high-frequency stimulation of the subthalamic nucleus. J. Neurosurg. 101, 511–517. doi: 10.3171/jns.2004.101.3.0511
McCreery, D. B., Agnew, W. F., Yuen, T. G., and Bullara, L. (1990). Charge density and charge per phase as cofactors in neural injury induced by electrical stimulation. IEEE Trans. Biomed. Eng. 37, 996–1001. doi: 10.1109/10.102812
McIntyre, C. C., Savasta, M., Walter, B. L., and Vitek, J. L. (2004). How does deep brain stimulation work? Present understanding and future questions. J. Clin. Neurophys. 21, 40–50. doi: 10.1097/00004691-200401000-00006
Mottaghi, S., and Hofmann, U. G. (2015). “Dynamically adjusted, scalable electrical stimulator for exciteable tissue,” in 2015 7th International IEEE/EMBS Conference on Neural Engineering (NER) (Montpellier: IEEE), 288–291.
Mottaghi, S., Pinnell, R., and Hofmann, U. G. (2015). “A 16-bit high-voltage digital charge-control electrical stimulator,” in Proceedings of the IFMBE World Congress on Medical Physics and Biomedical Engineering, June 7-12, 2015, Toronto, Canada, eds D. A. Jaffray (Cham: Springer International Publishing), 1208–1212.
Nuttin, B., Cosyns, P., Demeulemeester, H., Gybels, J., and Meyerson, B. (1999). Electrical stimulation in anterior limbs of internal capsules in patients with obsessive-compulsive disorder. Lancet 354:1526. doi: 10.1016/S0140-6736(99)02376-4
Parsa, V., Parker, P. A., and Scott, R. N. (1998). Adaptive stimulus artifact reduction in noncortical somatosensory evoked potential studies. IEEE Trans. Biomed. Eng. 45, 165–179.
Penfield, W. (1958). Some mechanisms of consciousness discovered during electrical stimulation of the brain. Proc. Natl. Acad. Sci. U.S.A. 44, 51–66. doi: 10.1073/pnas.44.2.51
Perkins, K. L. (2006). Cell-attached voltage-clamp and current-clamp recording and stimulation techniques in brain slices. J. Neurosci. Methods 154, 1–18. doi: 10.1016/j.jneumeth.2006.02.010
Pezaris, J. S., and Reid, R. C. (2007). Demonstration of artificial visual percepts generated through thalamic microstimulation. Proc. Natl. Acad. Sci. U.S.A. 104, 7670–7675. doi: 10.1073/pnas.0608563104
Qiu, S., Feng, J., Xu, R., Xu, J., Wang, K., He, F., et al. (2015). A stimulus artifact removal technique for SEMG signal processing during functional electrical stimulation. IEEE Trans. Biomed. Eng. 62, 1959–1968. doi: 10.1109/TBME.2015.2407834
Rattay, F. (1989). Analysis of models for extracellular fiber stimulation. IEEE Trans. Biomed. Eng. 36, 676–682. doi: 10.1109/10.32099
Schwartz, A. B. (2004). Cortical neural prosthetics. Annu. Rev. Neurosci. 27, 487–507. doi: 10.1146/annurev.neuro.27.070203.144233
Sennels, S., Biering-Sørensen, F., Andersen, O. T., and Hansen, S. D. (1997). Functional neuromuscular stimulation controlled by surface electromyographic signals produced by volitional activation of the same muscle: adaptive removal of the muscle response from the recorded EMG-signal. IEEE Trans. Rehab. Eng. 5, 195–206. doi: 10.1109/86.593293
Serruya, M. D., Hatsopoulos, N. G., Paninski, L., Fellows, M. R., and Donoghue, J. P. (2002). Instant neural control of a movement signal. Nature 416, 141–142. doi: 10.1038/416141a
Stuart, G. J., Dodt, H. U., and Sakmann, B. (1993). Patch-clamp recordings from the soma and dendrites of neurons in brain slices using infrared video microscopy. Pflugers Arch. 423, 511–518. doi: 10.1007/BF00374949
Multichannel Systems, M. (2015). MEA Amplifier with Blanking Circuit for Upright Microscopes Manual. Multichannel Systems Manual.
Tehovnik, E. J. (1996). Electrical stimulation of neural tissue to evoke behavioral responses. J. Neurosci. Methods 65, 1–17. doi: 10.1016/0165-0270(95)00131-X
Tehovnik, E. J., Tolias, A. S., Sultan, F., Slocum, W. M., and Logothetis, N. K. (2006). Direct and indirect activation of cortical neurons by electrical microstimulation. J. Neurophysiol. 96, 512–521. doi: 10.1152/jn.00126.2006
ter Braack, E. M., de Jonge, B., and van Putten, M. J. (2013). Reduction of TMS induced artifacts in EEG using principal component analysis. IEEE Trans. Neural Syst. Rehab. Eng. 21, 376–382. doi: 10.1109/TNSRE.2012.2228674
Tronnier, V. M., Fogel, W., Krause, M., Bonsanto, M. M., Tronnier, J., Heck, A., et al. (2002). High frequency stimulation of the basal ganglia for the treatment of movement disorders: current status and clinical results. Minim Invasive Neurosurg. 45, 91–96. doi: 10.1055/s-2002-32495
Varatharajan, R., Joseph, K., Neto, S. C., Hofmann, U. G., Moser, A., and Tronnier, V. (2015). Electrical high frequency stimulation modulates GABAergic activity in the nucleus accumbens of freely moving rats. Neurochem. Int. 90, 255–260. doi: 10.1016/j.neuint.2015.10.002
Wagenaar, D. A., and Potter, S. M. (2002). Real-time multi-channel stimulus artifact suppression by local curve fitting. J. Neurosci. Methods 120, 113–120. doi: 10.1016/S0165-0270(02)00149-8
Whittington, R. H., Gilchrist, K. H., Giovangrandi, L., and Kovacs, G. T. A. (2003). “A multi-parameter, feedback-based electrical stimulation system for cardiomyocyte cultures,” in TRANSDUCERS 03. 12th International Conference on Solid-State Sensors, Actuators and Microsystems. Digest of Technical Papers (Cat. No.03TH8664) (Boston, MA: IEEE), 983–986.
Whittington, R. H., Giovangrandi, L., and Kovacs, G. T. (2005). A closed-loop electrical stimulation system for cardiac cell cultures. IEEE Trans. Biomed. Eng. 52, 1261–1270. doi: 10.1109/TBME.2005.847539
Xie, Y., Heida, T., Stegenga, J., Zhao, Y., Moser, A., Tronnier, V., et al. (2014). High-frequency electrical stimulation suppresses cholinergic accumbens interneurons in acute rat brain slices through GABA(B) receptors. Eur. J. Neurosci. 40, 3653–3662. doi: 10.1111/ejn.12736
Yi, X., Jia, J., Deng, S., Shen, S. G., Xie, Q., and Wang, G. (2013). A blink restoration system with contralateral EMG triggered stimulation and real-time artifact blanking. IEEE Trans. Biomed. Circuits Syst. 7, 140–148. doi: 10.1109/TBCAS.2013.2255051
Zhiyue, L., and McCallum, R. W. (1998). “Adaptive stimulus artifact cancellation in gastric myoelectrical signals,” in Proceedings of the 20th Annual International Conference of the IEEE Engineering in Medicine and Biology Society, Vol. 20, Biomedical Engineering Towards the Year 2000 and Beyond (Cat. No.98CH36286) (Hong Kong: IEEE), 1636–1639.
Keywords: stimulation, blanking circuit, stimulation artifact, electrophysiology, spike detection
Citation: Joseph K, Mottaghi S, Christ O, Feuerstein TJ and Hofmann UG (2018) When the Ostrich-Algorithm Fails: Blanking Method Affects Spike Train Statistics. Front. Neurosci. 12:293. doi: 10.3389/fnins.2018.00293
Received: 30 January 2018; Accepted: 13 April 2018;
Published: 30 April 2018.
Edited by:
Yoshio Sakurai, Doshisha University, JapanReviewed by:
De-Lai Qiu, Yanbian University, ChinaElias Manjarrez, Benemérita Universidad Autónoma de Puebla, Mexico
Copyright © 2018 Joseph, Mottaghi, Christ, Feuerstein and Hofmann. This is an open-access article distributed under the terms of the Creative Commons Attribution License (CC BY). The use, distribution or reproduction in other forums is permitted, provided the original author(s) and the copyright owner are credited and that the original publication in this journal is cited, in accordance with accepted academic practice. No use, distribution or reproduction is permitted which does not comply with these terms.
*Correspondence: Kevin Joseph, a2V2aW4uam9zZXBoQHVuaWtsaW5pay1mcmVpYnVyZy5kZQ==
†These authors have contributed equally to this work.