 Dhaval Solanki
 Uttama Lahiri
- Electrical Engineering, Indian Institute of Technology Gandhinagar, Gandhinagar, India
Ambulation is a fundamental requirement of human beings for enjoying healthy community life. A neurological disorder such as stroke can significantly affect one's gait thereby restricting one's active community participation. To quantify one's gait, spatiotemporal gait parameters are widely used in clinical context with different tests such as 10 meter walk test, 6 min walk test, etc. Though these conventional observation-based methods are powerful, yet they often suffer from subjectivity, a scarcity of adequately trained therapists and frequent clinical visits for assessment. Researchers have been exploring the technology-assisted solutions for gait characterization. There are laboratory-based stereophotogrammetric methods and walk mats that are powerful tools as far as gait characterization is concerned. However, these suffer from issues with portability, accessibility due to high cost, labor-intensiveness, etc. Faced with these issues, our present research tries to investigate and quantify the gait abnormalities in individuals with neurological disorder by using a portable and cost-effective instrumented shoes (ShoesFSR henceforth). The in-house developed ShoesFSR comprised of a pair of shoes instrumented with Force Sensing Resistors (FSR) and a wireless data acquisition unit. The real-time FSR data was acquired wirelessly and analyzed by a central console to offer quantitative indices of one's gait. Studies were conducted with 15 healthy participants and 9 post-stroke survivors. The spatiotemporal gait parameters of healthy participants measured using ShoesFSR were validated with standard methods such as stereophotogrammetric system and paper-based setup. Statistical analysis showed good agreement between the gait parameters measured using ShoesFSR and the standard methods. Specifically, the mean absolute error of the spatial parameters measured by the ShoesFSR, in the worst case, was 1.24% and that for the temporal parameters was 1.12% with that measured by standard methods for healthy gait. This research shows the potential of the ShoesFSR to quantify gait abnormality of post-stroke hemiplegic patients. In turn, the results show a promise for the future clinical use of the ShoesFSR.
Introduction
Reports from World Health Organization suggest that every year ~15 million people suffer from stroke globally (Rodrigo et al., 2013). Among these, ~6 million people die and another 4 million people suffer from partial disability, such as, hemiplegia, that can adversely affect their mobility. Movement disorders associated with such conditions can jeopardize one's independence to perform activities of daily living (ADL). Deficits in balance and gait disorder are common in individuals with hemiplegic stroke. Literature shows that the weight-bearing capacity of the paretic lower limb of a post-stroke survivor can be reduced by up to 43%. Consequently, these patients are often prone to falls with subsequent injuries during over-ground walk (Hagell et al., 1999; Wolfson, 2001). Thus, it is critical to objectively quantify or characterize the residual abilities of the patient before deciding on the therapeutic demands. Researchers have reported that there exists a link between one's gait (defined as a manner of walking) characteristics and different clinical conditions such as, foot inversion, flat foot, etc. that are common after-effects post-stroke (Wang et al., 2009). Again, characterization of one's gait is important since it can be useful in monitoring any improvement in one's gait performance and functional recovery post-stroke due to rehabilitation (Von Schroeder et al., 1995; Alexander, 1996).
Literature shows different approaches, ranging from very simple to extremely complex methods being used for gait characterization. For example, a simple and inexpensive method to characterize one's gait is to record one's footprints during one's over-ground walk (O'Sullivan et al., 2013). In this, one uses paint, ink, or chalk to color the bottom of the patient's foot or shoe so that the foot imprints can be stored post over-ground walk. This is often coupled with the standard walk tests, e.g., 6-min/10-m walk test (O'Sullivan et al., 2013) used to measure one's spatial gait parameters, namely, stride length, step length, etc. (O'Sullivan et al., 2013). To estimate one's temporal gait parameters, e.g., stride time, step time, etc., one often uses a stopwatch during the over-ground walk. Though this approach of characterizing gait is powerful and often practiced in conventional settings, yet this suffers from the subjectivity of measurement, limited healthcare resources, etc. (Toro et al., 2003).
Faced with these challenges, researchers have used different technology-assisted solutions, namely, stereophotogrammetric systems (Cappozzo et al., 2005), walk mats (Muro-De-La-Herran et al., 2014), wearable devices (Wang et al., 2009; Tao et al., 2012), etc. for gait characterization. The stereophotogrammetric systems [such as VICON (VICON Camera System; Vicon Motion Systems Ltd., United Kingdom) motion capture system]1 can provide the instantaneous position of markers located on one's body (Cappozzo et al., 2005) that can be used to characterize one's gait. These systems though powerful suffer from large setup time, operational complexity due to the specialized technical knowledge needed to operate the system, high cost, restriction to lab-based settings, etc. (Della Toffola et al., 2012). Researchers have also explored walk mats [such as Gait Mat (Strideway System; Tekscan, Inc., United States)2 and GAITRite (GAITRite Classic; CIR Systems, Inc., New Jersey)3] These, though costly, are easier to be setup compared to the stereophotogrammetric systems. These walk mats consisting of an array of force switches/sensors can be used to quantify the spatiotemporal gait parameters and also offer dynamic pressure mapping of footprints (O'Sullivan et al., 2013). Though literature reports that the spatiotemporal gait parameters can be reliably measured using walk mats (Barker et al., 2006), yet their usage is limited to well-instrumented laboratories and over-ground gait exercises.
Thus, researchers have explored cost-effective and portable solutions such as wearable sensors to characterize one's gait. The wearable sensors, such as accelerometers, gyro sensors, goniometers, force sensors, etc. can be attached to one's body for characterizing gait (Tao et al., 2012). The Inertial Measurement Unit (IMU) consisting of accelerometers and gyroscopes can be used for gait characterization based on the measurement of position and orientation of the limb as used in different studies (Lemoyne et al., 2008; Yang and Hsu, 2010; Fraccaro et al., 2014). However, the accelerometer and gyroscope-based techniques enable estimation of spatiotemporal gait parameters using model-based approach instead of direct sensor-based measurements (Ladha et al., 2016). Additionally, these need frequent calibration to address drift issues (Tong and Granat, 1999; Alvarez et al., 2008). On the other hand, goniometers can provide angular information but also require mathematical modeling techniques to predict one's spatiotemporal gait parameters (Maranesi et al., 2014) similar to the accelerometer and gyroscope.
Thus, researchers (Huang et al., 2007a; Beauchet et al., 2008; Hanlon and Anderson, 2009) have started exploring the use of portable force sensors such as, force sensitive resistors (FSRs). Using FSRs fitted below one's feet, we can detect one's gait-related events such as heel strike, toe off, etc. that in turn can be used to measure spatiotemporal gait parameters. There is a rich literature that speaks on the use of FSR. For example, different researchers have used multiple FSRs ranging from 2 to 32 numbers located at different positions under one's feet, namely, toe, heel, ball metatarsal 1 to 5, etc. (Chen et al., 2007, 2008; Huang et al., 2007b; Pawin et al., 2011; Pinkam and Nilkhamhang, 2013; Majumder et al., 2015) to characterize one's gait. Usage of multiple FSRs, though lend improved precision of measurements, yet, it increases the hardware complexity by increasing the number of data channels to be handled along with difficulty in troubleshooting, locating and correcting faulty FSR(s), making it infeasible for practical applications. On the other hand, too few FSRs can miss picking up certain aspects of gait abnormalities, such as foot inversion/eversion (Perry and Lafortune, 1995) often seen in post-stroke patients. All of the FSR-based applications have used one heel sensor along with other sensors situated at different locations under the feet. Instead of using one FSR sensor at the center of the Heel, we placed two FSRs at the heel location spaced at ~30 mm apart to accommodate patients having foot inversion/eversion. Having already used two FSR sensors, we wanted to keep the sensing circuit less complex and thus we kept a minimum of one more FSR sensor at the toe with which we were able to extract a number of spatiotemporal features that could characterize even pathologic gait. Most of the currently existing FSR-based studies characterizing one's gait have been applied to participants demonstrating healthy gait. Thus, further exploration to carry out detailed gait characterization of unhealthy gait such as for post-stroke hemiplegic patients using FSR-based approach is warranted.
Motivated by this need, in our present research, we have developed a pair of shoes instrumented with FSRs. It features two heel sensors and one toe sensor. The ShoesFSR features wireless data acquisition module that allows continuous and unobstructive assessment of gait features even outside the laboratory environment. The ShoesFSR can be used to detect different gait-related events such as heel strike, heel off, toe strike and toe off, useful for extracting different gait parameters. In order to obtain a faithful representation of the gait characteristics, it is essential that the gait parameters be validated with those measured using standard techniques. This is critical, since, literature reports trade-off between the accuracy and portability of gait measuring systems and their clinical usage (Beauchet et al., 2008). In fact, though, few studies such as by Lopez-Meyer et al. (2011) using FSR-based shoes for post-stroke individuals showed promising results as far as extraction of limited gait parameters (only temporal) are concerned, yet, the researchers did not report on validation of their shoes with any standard stereophotogrammetric techniques.
While our ShoesFSR could measure one's spatiotemporal gait parameters during the over-ground walk, we validated our observations using standard setups, namely, VICON and paper-based setups. The objectives of our study were three-fold, namely, (i) Design a pair of FSR-based shoes (ShoesFSR) that can measure spatiotemporal gait parameters for both healthy and post-stroke hemiplegic participants, (ii) Validate the temporal and spatial gait parameters of healthy participants using VICON and paper-based setup, respectively, during one's over-ground walk and (iii) Use ShoesFSR to quantify and paper-based setup to validate the spatial gait parameters of post-stroke hemiplegic participants.
This paper is organized as follows: section Materials and Methods presents the system design followed by the methodology used for the study. Section Result and Discussion offers the results obtained during the study. Finally, section Discussion and Limitation summarizes the research findings and discusses the limitations of the current research as well as the direction of future research.
Materials and Methods
Gait Characterization System
Our system comprised of four sub-modules, such as (A) Instrumented Shoes with Force Sensitive Resistors (FSR) (ShoesFSR henceforth) (B) Data Acquisition (C) VICON-ShoesFSR synchronizer and (D) Feature extraction modules. The data collection process was carried out in three stages, namely, Stage 1, Stage 2, and Stage 3. Stage 1 was used to validate the temporal gait parameters measured by ShoesFSR with that by VICON. This used all the modules [modules (A) to (D)]. Stage 2 was used to validate the spatial gait parameters measured by the ShoesFSR with that by the paper-based setup. This incorporated modules (A), (B), and (D). The Stages 1 and 2 were carried out with healthy participants. Stage 3 was similar to Stage 2, except that it was used to collect experimental data with post-stroke hemiplegic participants.
Instrumented Shoes With FSR (ShoesFSR)
Figure 1 shows the block diagram of the data acquisition system using the ShoesFSR as one of the modules. The ShoesFSR comprised of a pair of shoes having six FSRs (three FSRs in each shoe for characterizing the Gait Dynamics (FSRGD henceforth) placed below the shoe insole. To avoid physical damage to the FSRs due to the forces exerted during one's walk, an extra protective layer of dummy insole was placed above the shoe insole mounted with FSRs. One of the common faults that can occur is the breakage of the electrical connections. However, we provided heat shrinks to offer insulation and strengthening of electrical connections between wires and the terminals of FSRs. Insole mounted with FSRs was crafted with grooves to conceal signal carrying wires in the insole protecting the wires from unwanted external forces during one's walk. Six FSRGD (TL, HL1, HL2 for left shoe and TR, HR1, HR2 for right shoe) were placed below the shoe insole at different positions below the foot, namely, Toe and two Heel locations [Figure 1A, Module (A)]. The idea of placing two FSRs at the Heel of each shoe was to use the ShoesFSR to measure one's gait parameters (such as stride time, step time, stance time, swing time, etc.) for characterizing both healthy and pathologic gait. Specifically, post-stroke patients often demonstrate pathologic gait (Perry and Lafortune, 1995). For example, the pathologic gait commonly seen in post-stroke survivors is often accompanied with foot inversion causing abnormal weight shifting during over-ground walk (Chae, 2016).
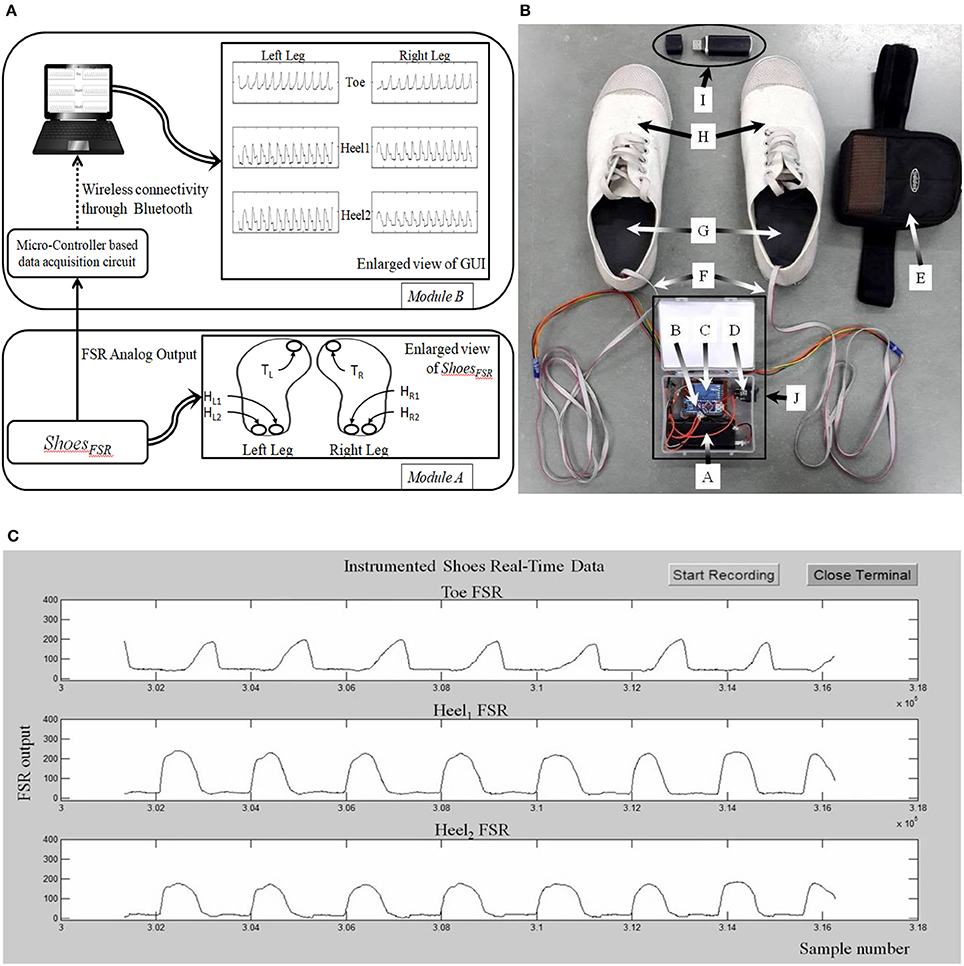
Figure 1. (A) Block Diagram of ShoesFSR; (B) Photo of ShoesFSR (Physical appearance) with Data Acquisition Module (DAQ); (C) A snapshot of graphical user interface. TL/TR: FSRGD placed below Left and Right toe respectively; HL1/HR1: 1st FSRGD placed below Left and Right heel; HL2/HR2: 2nd FSRGD placed below Left and Right heel; A: Battery for DAQ; B: Micro-controller circuit for DAQ; C: Bluetooth Transmitter; D: ON/OFF switch for DAQ; E: Case to mount DAQ at the subject's pelvis; F: Wires connecting DAQ and FSRGD mounted in shoe-insole; G: Shoe-insole mounted with FSRs; H: ShoesFSR; I: Bluetooth Receiver; J: Data Acquisition Module.
Data Acquisition Module
Data from the ShoesFSR was in the form of 0–5 V analog signal. The analog signal from 6 Nos. of FSRs in the pair of shoes were routed to 6 analog input pins of the ATMEGA328 (microcontroller) that was powered with a regulated 5 V battery supply. This data was processed by the microcontroller of the Data Acquisition Module (that was pre-programmed using an Interactive Development Environment that comes with this microcontroller) [Figure 1A (Module B) and Figure 1B]. The data was transmitted to a remote laptop using a pair of serial Bluetooth device (HC-05). The sensor data was sampled using a 10-bit analog to digital convertor (ADC) at ~200 samples/second that was transmitted to the remote data logger computer (laptop) at a baud rate of 115.2 Kbits/second. This data was presented on a Graphical User Interface (GUI) (Figure 1C) in real-time. The experimenter used the GUI to confirm the health of the FSR sensors.
VICON-ShoesFSR Synchronizer
This study was conducted in three different stages. In Stage1 of the study, VICON was used to validate the temporal gait parameters measured by ShoesFSR. For the validation study, it was essential to synchronize the VICON and ShoesFSR. Therefore, we used the data synchronizing module (VICON-ShoesFSR synchronizer) that provided a simultaneous synchronizing marker to both systems (i.e., VICON and ShoesFSR). Figure 2 shows the block schematic of the setup used for VICON-ShoesFSR synchronization module. The data synchronizing module consisted of a microcontroller-based unit that received marker input from synchronizing FSR (FSRSYNC) mounted at the heel of the ShoesFSR (one to each of the two shoes; Figure 2). Thus, there were eight inputs from the ShoesFSR (six from the FSRGD and two from FSRSYNC). Here we wanted to use the FSRSYNC to send binary (ON/OFF; ON indicating heel contact; OFF indicating no heel contact) marker signal to the synchronization module. The Synchronizing marker signal based on No Contact/Heel Contact was transmitted simultaneously to (i) Data Logger Computer of VICON system via Lock+ hardware module and (ii) Data Logger Computer of ShoesFSR via the Microcontroller based Data Acquisition Circuit (Figure 2). The Lock+ hardware module (Lock+ Sync Box; Vicon Motion Systems Ltd, United Kingdom)4 that came with VICON was used to connect and synchronize external inputs e.g., from FSRSYNC.
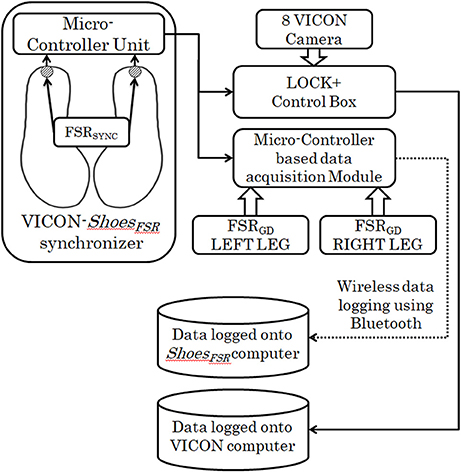
Figure 2. Block Schematic of VICON-ShoesFSR synchronizer.
Feature Extraction Module
The raw data (Figure 3) from the ShoesFSR were acquired by the Data Acquisition Module and stored in the Data Logger Computer for offline analysis. This raw data was filtered by a 10 point (window of ~50 ms) moving average filter thereby achieving a Signal:Noise Ratio (SNR) of ~40 dB. The window length of ~50 ms was chosen as an initial approximation. The filtered data was processed to extract relevant features such as stride length, stride time, etc. Additionally, a video of participant's over-ground walk was recorded for subsequent offline analysis.
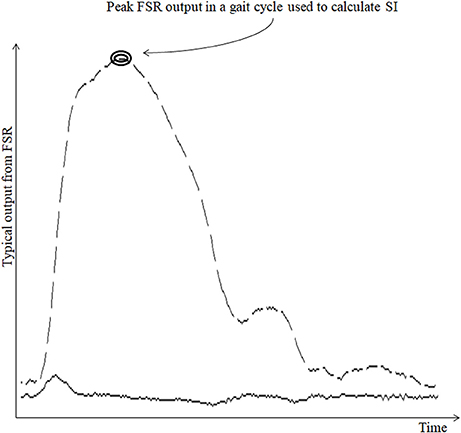
Figure 3. Typical output from FSR sensor. Broken line shows the typical output from FSRGD sensor for one gait cycle; Solid line (lower continuous line) shows the computed successive difference in FSR output; “SI” stands for Symmetry Index.
Computation of stride time (GF1)
Stride time can be calculated as the time difference between two successive heel strikes of the same foot (O'Sullivan et al., 2013). While a participant walked wearing the ShoesFSR, the microcontroller based wireless Data Acquisition Module acquired and transmitted the FSRGD data (Figure 3 shows a typical example of filtered data) to the remote Data Logger Computer (laptop). The filtered data from the heel sensors (FSRGD) was processed to compute the difference between successive sample values (Vn − Vn−1; where “V” is the digital value (ranging from 0 to 1023) obtained at the output of the 10 bit ADC; “n” is the sample number) of the data (Figures 3, 4). As can be seen from Figure 4, the peak points were picked up automatically by our in-house developed algorithm from the successive difference of values of consecutive samples of heel FSRGD (as shown by lower solid line in Figure 3) to extract heel strike events. Similarly, the toe off events were extracted from the trough points of the successive difference signal computed from signal recorded by the toe FSRGD. The Figure 4 represents the time-stamped heel-strike and toe-off events indicated by “o” and “+,” respectively for both the legs. Subsequently, the Stride Time was calculated from the time interval between two successive heel-strike events [represented by “DL” and “DR” in Figure 4 for each of Left and Right legs (LegL and LegR respectively, henceforth), respectively].
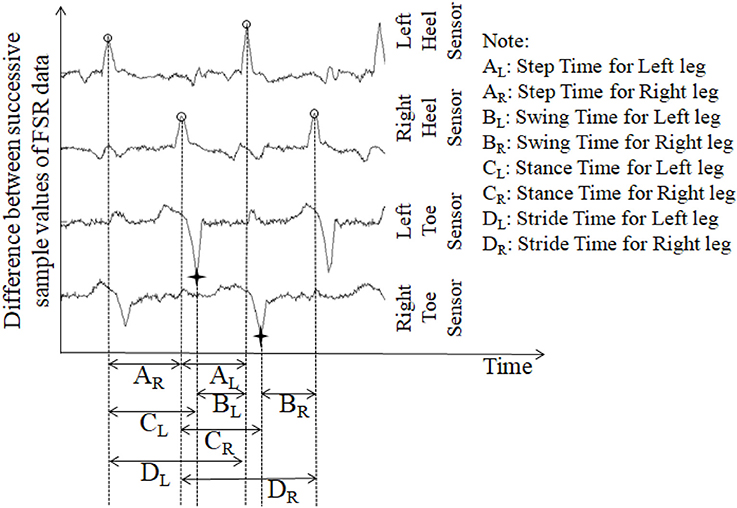
Figure 4. The successive difference signal derived from different FSR outputs. “o” represents heel strike (foot strike) events; “+” represents toe off (foot off) event.
Computation of stride length (GF2)
Stride Length is the distance covered between two successive heel strikes of the same foot (O'Sullivan et al., 2013). To compute the Stride Length, we needed information on Stride Time [section Computation of Stride Time (GF1)] and Walking Speed. To measure one's Walking Speed, we used the recorded video of the participant's walk that provided information on the time taken by an individual to cover a pre-defined walk distance (specified by the experimental setup; section Experimental Setup below). While a participant walked wearing the ShoesFSR, the Stride Time was multiplied with Walking Speed to compute the individualized Stride Length (Frenkel-Toledo et al., 2005) for each of LegL and LegR. Subsequently, the Normalized Stride Length (Stride LengthNorm) was computed based on one's height (Equation 1) to nullify the effect of inter-subject height differences that can affect one's gait parameters (Elble et al., 1991).
Computation of step time (GF3)
The ShoesFSR data was collected and logged on the remote Data Logger Computer for offline processing. One's Step Time can be calculated as the time interval between two successive heel-strike events of contralateral legs (O'Sullivan et al., 2013). Here, we used our logged data to calculate the Step Time from the time interval between two successive heel-strike events of contralateral legs (represented by “AR” and “AL;” Figure 4).
Computation of step length (GF4)
One's Step Length can be computed from the spatial distance between two successive heel-strike events of contralateral legs (O'Sullivan et al., 2013). Thus, this depends on one's Step Time [section Computation of Step Time (GF3)] and Walking speed. We computed the Step Length from the product of the Step Time and Walking speed (Frenkel-Toledo et al., 2005) for each leg. Again, to nullify the effect of inter-subject height differences, we computed the normalized Step Length (Step LengthNorm) using Equation (2).
Computation of single support time (GF5)
Single (limb) Support Time of a gait cycle is the duration for which only one leg supports the body during one's gait (Debi et al., 2011). Alternatively, Single Support Time for one leg (say, left) can be measured from the Swing Time for the other leg (say, right) (Bagley et al., 1991). Here, we considered an alternate approach to measure the Single Support Time. Subsequently, the % Single Support Time for each leg (LegL and LegR) was calculated as a percentage of the total gait cycle time using Equations (3, 4), respectively (Figure 4).
Computation of parameters (GF6) related to swing and stance phases of gait
One's gait cycle can be divided into two phases, such as, Stance and Swing phases that have been reported to be ~60 and 40% of one's gait cycle for healthy gait (O'Sullivan et al., 2013). The Stance and Swing phases (associated with a reference foot) is related to the foot being in contact and not in contact with the ground surface, respectively (O'Sullivan et al., 2013). In our study, the gait cycle time (Hausdorff et al., 1998) was calculated as the time interval between two successive heel-strike events of the same leg [represented by “DL” and “DR” in Figure 4 as discussed in section Computation of Stride Time (GF1)]. From this, we computed the Stance and Swing phases as percentage of the gait cycle. Specifically, we used the period of the Stance and Swing phases to calculate the percentage of the gait cycle time used by each reference leg. For this, the data from the heel sensors and the toe sensors (FSRGD) of ShoesFSR were processed to extract information on the time-stamped heel-strike and toe-off events (indicated by “o” and “+” for heel-strike and toe-off events, respectively for both the legs; Figure 4). Subsequently, the Swing Time was calculated as the time interval between successive toe-off and heel-strike events of the same foot when the foot is not in contact with the ground (represented by “BL” and “BR” in Figure 4). Similarly, the Stance Time was calculated when the foot is in contact with the ground surface (represented by “CL” and “CR” in Figure 4). The % Swing (GF6_Swing) and % Stance (GF6_Stance) Phases were calculated using the Swing Time and Stance Time, respectively and quantified as a percentage of the total gait cycle time of the reference leg (Equations 5–8).
Computation of symmetry index (SI) (GF7)
Since we had hemiplegic post-stroke patients with gait abnormalities who volunteered in our study, we wanted to quantify the contribution of each leg toward the overall gait in an individualized manner. For this, in Stage 3 of this study, we computed the Symmetry Index (SI). Literature indicates the use of SI, based on gait parameters such as Step Length, Step Time, Stance Time, Swing Time, etc. (Błazkiewicz et al., 2014). Again, other studies report that the post-stroke hemiplegic patients often suffer from assymetric weight-bearing capacity on both sides of the body. For example, the weight-bearing capacity of the paretic lower limb of a post-stroke survivor can be reduced by up to 43% (Hagell et al., 1999; Wolfson, 2001). Thus, considering the individualized gait profile and the weight-bearing capacity, we wanted to select at least one of the heel sensors and explore the force profile measured by the two heel sensors (FSRGD at the heel) for each participant while computing the SI. Depending on one's gait profile such as healthy gait or pathologic gait (e.g., with foot inversion/eversion, etc.), our system selected the analog output from at least one of the two FSRGD at the heel based on whichever sensor first indicated heel strike with the ground surface during gait. As regards the force profile measured by the two heel sensors, instead of using the maximum of the peak values of the force profile recorded by the two FSRGD at the heel (of each leg), we considered the minimum of the peak (magnitude) values (Minimum Peak Value, MPV) of the data for each leg. Specifically, the MPV was chosen as representative of the worst case magnitude of the force profile since we wanted to investigate the maximum possible asymmetry in one's gait. For example, if an individual has foot inversion, it might so happen that the force profiles measured by the two FSRGD at the heel of each leg are quite different. In such cases, the MPV can characterize the worst-case asymmetry in one's gait. Using MPV, we computed the SI value using Equation (9).
Where Xl and Xr are the MPV values corresponding to the LegL and LegR, respectively.
Tests of correlation and statistical significance
In this study, we computed different gait parameters (GF1 to GF7) from the data measured by the ShoesFSR. In Stage 1 and Stage 2 of this study, we wanted to validate the ability of ShoesFSR to measure different gait parameters by using the state-of-the-art (standard) methods such as VICON and paper-based setup. For this, we calculated the Intra-class Correlation Coefficient (ICC) (Shrout and Fleiss, 1979) to test the conformity of gait parameters obtained using ShoesFSR with those computed by VICON and paper-based setup. In Stage 3 of this study, we wanted to understand the implications of stroke on one's gait parameters. While analyzing our results (i.e., gait parameters) of LegL and LegR of each participant, we wanted to understand whether there existed any statistically significant difference in gait parameters obtained from both the legs of stroke patients. Considering limited sample size, we applied nonparametric Wilcoxon–Mann–Whitney test (Field, 2013) to identify any statistically significant difference.
Participants
Here we conducted studies in three Stages, namely, Stage 1, Stage 2 and Stage 3. Table 1 shows the participants' characteristics for Stages 1 and 2. In Stage 1, five male healthy participants [Mean (SD) = 27 (±3.67) years and Body Mass Index (BMI) of Mean (SD) = 21.98 (±2.33) kg/m2] volunteered. In Stage 2, ten male healthy participants (Mean (SD) = 25.8 (±3.11) years, BMI of Mean (SD) = 22.21 (±2.33) kg/m2) volunteered. The healthy participants were recruited from the neighborhood. In Stage 3, nine male hemiplegic post-stroke patients [Mean (SD) = 46 (±10.44) years, and BMI of Mean (SD) = 23.8 (±2.89) kg/m2] volunteered. The post-stroke participants (Table 2) were recruited from nearby physiotherapy hospital where they were undergoing treatment. Enrolment of these participants was through physiotherapist's referral.
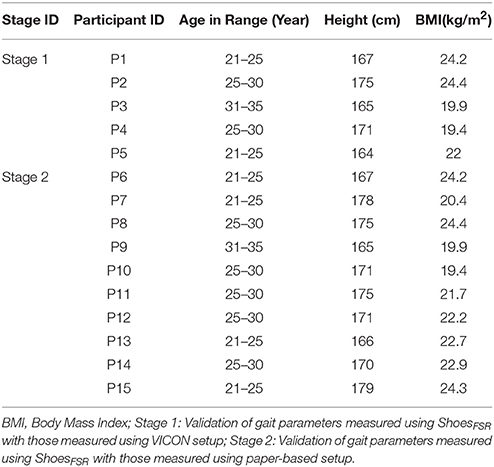
Table 1. Participant characteristics for Stages 1 and 2.
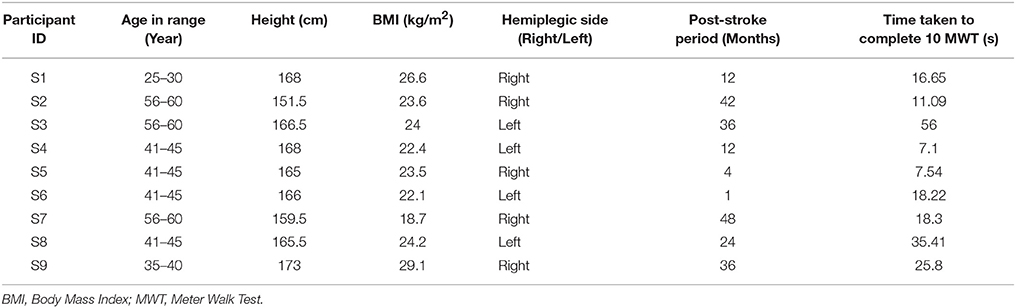
Table 2. Participant characteristics for Stage 3 of study.
Experimental Setup
This study was conducted in three Stages having two experimental setups. For example, Stage 1 consisted of ShoesFSR and VICON and Stages 2 and 3 consisted of ShoesFSR and paper-based setup.
Experimental Setup for Stage 1
In Stage 1, we used a 7 m long walk path inside a lab-based setting (Figure 5A) for over-ground walk. This setting was equipped with VICON system that included (i) 8 cameras (2,048 × 1,088 pixels) to track reflective markers placed on the subject, (ii) a LOCK+ hardware module to collect data and integrate the VICON cameras and ShoesFSR (aided by VICON-ShoesFSR synchronizer; section VICON-ShoesFSR Synchronizer) for synchronization and (iii) a computer [Intel(R) Xeon(R) CPU operating at clock frequency of 2.1 GHz with 16 GB RAM and 64-bit windows 10 operating system] to record stereophotogrammetric data (from VICON cameras). A Data Logger laptop was used for storing the gait-related data captured by ShoesFSR (section Data Acquisition Module) wirelessly. A MATLAB-based Data Acquisition Module (Figure 1C) running on the laptop was used for recording and displaying instantaneous data captured by the ShoesFSR. While the participants walked over-ground on the walk path, data from both the stereophotogrammetric setup and ShoesFSR were simultaneously recorded during the intermediate 3 m path (that was in the Field of View of the VICON cameras) for measurement and validation of temporal gait parameters. The central 3 m path was chosen as an initial approximation to account for the acceleration and deceleration in one's walk toward the beginning and the end of the path (Henriksen et al., 2004). For measurement and validation of spatial gait parameters, instead of using a limited walk path of length 3 m (that was available to us), we wanted a longer walk path with a possibility of having a fairly constant average walking speed (devoid of acceleration and deceleration) and thereby moved to a paper-based setup that can offer a 10 m walk path and this formed the experimental setup for Stages 2 and 3.
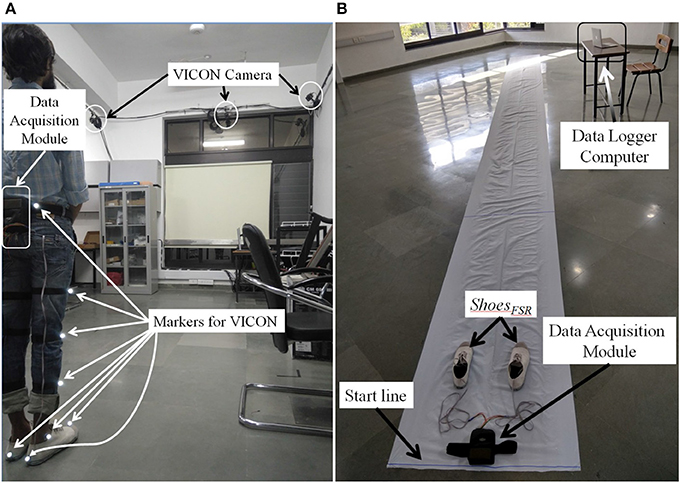
Figure 5. Walk path (A) with VICON cameras for Stage 1; (B) for Stages 2 and 3.
Experimental Setup for Stages 2 and 3
The experimental setup in Stages 2 and 3 comprised of a 10 × 0.7 m walk path (Figure 5B). This walk path was created by pasting a 10 × 0.7 m white paper on the floor. Additionally, the shoe soles of the two ShoesFSR were colored so to aid the experimenter to make the measurements from the imprints on the white paper of the walk path. While taking the measurements, care was taken that approximately the intermediate 6 m path was considered for the measurement (Henriksen et al., 2004). This was used to account for the effect of one's possible acceleration and deceleration toward the beginning and end of the walk, similar to that during Stage 1.
Procedure
Procedure Followed During Stage 1
The Stage 1 required a commitment of ~30 min from each participant. The study began with a brief introduction of the experimental setup comprising of ShoesFSR, VICON system along with reflective markers, a 7 m long straight walk path, etc. Then the experimenter told the participant that he would be expected to walk on the straight path at his comfortable speed. Also, the participant was told that he can discontinue from the study at any point of time if he felt uncomfortable. Subsequently, the experimenter helped the participant to wear the ShoesFSR. The reflective markers of VICON system were placed on both the lower limbs of the participant as described in Table 3. Before starting the study, the experimenter confirmed that the participant had understood what he was expected to do and waited for his yes nod to start the study. First, the participant was asked to stand with both legs touching the Start line (Figure 5A). To facilitate synchronization of data (from VICON and ShoesFSR), the participant was asked to make three taps on the ground using the right leg. Then the participants walked on the straight path at their comfortable speed till they reached the end of the path followed by standing upright for ~1–2 s while the experimenter stopped the data collection process.
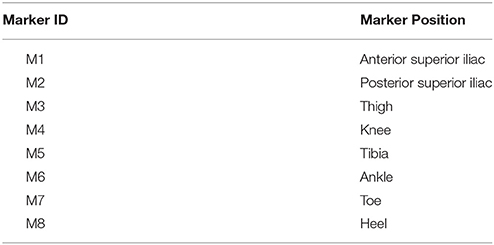
Table 3. Marker placement for VICON system.
Procedure Followed During Stages 2 and 3
Each of the Stages 2 and 3 required ~20 min from each participant. Similar to that in Stage 1, in Stages 2 and 3, the participant was briefed on the experimental setup and was told what he was expected to do during the study. The Stage 2 had healthy participants. The Stage 3 involved post-stroke hemiplegic patients. The patients were recruited through referrals and a physiotherapist in our team checked the inclusion criteria. In this, the patients were checked for their ability to perform the 10 m walk-test (O'Sullivan et al., 2013) while walking over-ground without any external support such as orthosis, canes, etc.
Subsequently, the experimenter helped the participant to wear the ShoesFSR with the bottom of the shoe sole being colored. The participant was asked to stand with both the legs touching the Start line (Figure 5B). A video of participant's walk was recorded for post analysis. In order to synchronize data from ShoesFSR and video, the participant was asked to make three taps on the ground using the right leg before starting to walk. The participants walked at their comfortable speed till they reached the end of the path followed by standing upright for ~1–2 s while the experimenter stopped the data collection process.
Result and Discussion
In our study, participants were asked to perform over-ground walk while wearing ShoesFSR. The results of all the three stages along with the post-study feedback are discussed below.
Post-study Feedback
After the participants wearing ShoesFSR had finished their walk on the 10 m walk path, a questionnaire was used by the experimenter to get the participants' feedback on our system. We were interested to know their views on whether they (i) felt any inconvenience in wearing the ShoesFSR, (ii) faced any difficulty in understanding the task, (iii) agreed to use the ShoesFSR again and (iv) are willing to refer others to participate in our study. From the participants' responses, we found that the participants did not experience any inconvenience while wearing the ShoesFSR. Also, they did not report any difficulty in understanding the tasks. Additionally, they expressed their willingness to use ShoesFSR in future and also refer their known acquaintances to this study. Thus, from the participants' feedback, we can infer that the ShoesFSR has the potential to be accepted by individuals with gait disorder.
Results on Validation of Temporal Gait Parameters Computed Using the ShoesFSR for Healthy Participants
The Figure 6 shows a comparative group analysis of two temporal gait parameters, such as Stride Time (GF1) and Step Time (GF3) [for both the left leg (LegL) and right leg (LegR)] measured using the two systems, namely, ShoesFSR and VICON. The measured values show good agreement between the results (the average % absolute error being 0.70 and 0.72%, respectively for LegL and LegR in case of GF1; 1.12 and 0.48%, respectively for LegL and LegR in case of GF3) computed using the two systems. Additionally, we found a high correlation in terms of Intra-class correlation coefficients (ICC) for GF1 (ICC = 0.99 and 0.97 for LegL and LegR, respectively) and GF3 (ICC = 0.99 and 0.95 for LegL and LegR, respectively) measured using the ShoesFSR and VICON. From these results, we can infer that the ShoesFSR can offer a reliable measure of at least some of the temporal gait parameters.
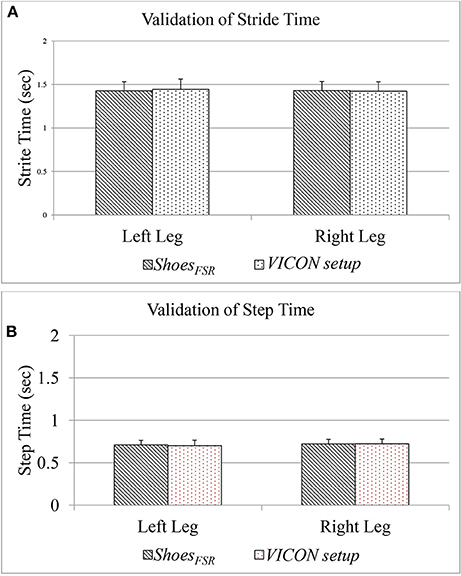
Figure 6. (A) Comparison of Stride Time measured using ShoesFSR and VICON setup; (B) Comparison of Step Time measured using ShoesFSR and VICON setup.
Please note that, since our participants were healthy individuals, we could observe a close agreement in the gait parameters for LegL and LegR. Specifically, the difference (%Δ) in the group average of GF1 and GF3 between the LegL and LegR, as measured by ShoesFSR were ~0.21 and 1.50%, respectively. Also, statistical analysis using non-parametric Wilcoxon–Mann–Whitney test showed no statistical significance (p > 0.05) between the measured gait parameters of LegL and LegR.
Results on Validation of Spatial Gait Parameters Computed Using the ShoesFSR for Healthy Participants
During Stage 2, while the participants walked over-ground with the paper-based setup wearing the ShoesFSR having colored bottom, the foot imprints were used for subsequent analysis. This was later used to measure normalized spatial gait parameters such as normalized Stride Length (GF2) and normalized Step Length (GF4) [discussed in section Computation of Stride Length (GF2) and Computation of Step Length (GF4), respectively]. The accompanying video of the participant's walk was analyzed offline to validate the GF2 and GF4.
Figure 7 shows comparative analysis of GF2 and GF4 measured using the ShoesFSR and the paper-based setup for each leg (LegL and LegR). The value of % absolute error between the measurements obtained using the ShoesFSR and the paper-based setup was found to be 0.59 and 1.24% for GF2; 0.15% and 0.55% for GF4 for LegL and LegR, respectively. A good agreement between the measurements done by the two systems is evident from the ICC values > 0.95 for all the cases.
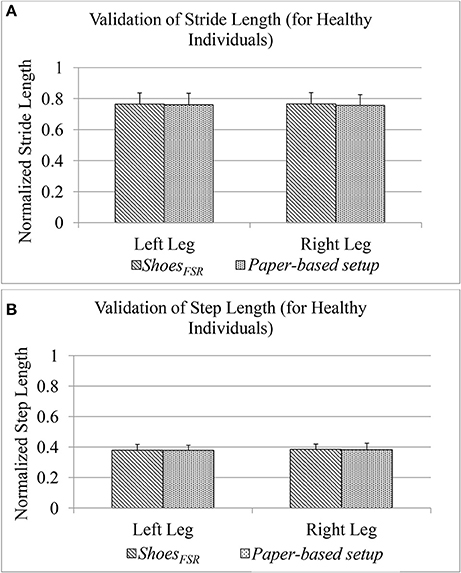
Figure 7. (A) Comparison of Stride Length measured using ShoesFSR and paper-based setup for healthy participants; (B) Comparison of Step Length measured using ShoesFSR and paper-based setup for healthy participants.
As stated earlier, since our participants of the Stage 2 of our study were healthy individuals, we could observe a close agreement of the spatial gait parameters between LegL and LegR. Specifically, the difference (%Δ) in the group average of GF2 and GF4 between the LegL and LegR as measured by ShoesFSR, was ~0.15 and 1.35%, respectively. Similar to the temporal gait parameters, for the spatial gait parameters, we did not find any statistically significant difference (p >0.05) between those of LegL and LegR.
Understanding the Impact of Stroke on One's Gait
So far we have been validating the parameters measured by our ShoesFSR with those measured by the standard setups, namely VICON and paper-based setup for healthy participants. Subsequently, we wanted to extend the usage of the ShoesFSR among the post-stroke survivors. For this, we recruited post-stroke hemiplegic survivors during Stage 3 of the study. In this stage, we wanted to (i) validate the gait parameters measured by the ShoesFSR with those measured by the paper-based setup followed by a comparison of the gait parameters measured by the two systems and (ii) investigate the feasibility of ShoesFSR to quantify abnormalities in the gait pattern of post-stroke patients.
Results on Validation of Gait Parameters of Post-stroke Patients Measured by ShoesFSR
In Stage 3 of the study, post-stroke hemiplegic participants (S1–S9; Table 2) performed over-ground walk while using (i) ShoesFSR and (ii) paper-based setup. Figure 8 shows a comparative analysis of some of the gait parameters, e.g., normalized Stride Length (GF2) and normalized Step Length (GF4) measured using the ShoesFSR and the paper-based setup. On an average, the stroke patients showed reduced Stride Length and Step Length as compared to that for the healthy participants (Figures 7A,B) that is in conformity with the reports from literature (O'Sullivan et al., 2013). Also, though the post-stroke patients were hemiplegic, yet, the group average of GF2 was almost similar across both the legs (Figure 8A). Similar observation was found for GF4 as well (Figure 8B). This similarity in the group data can be possibly attributed to the fact that nearly 50% of the post-stroke group was right hemiplegic and the rest were left hemiplegic. The group average (excluding S9) of gait parameters measured by ShoesFSR and the paper-based setup closely matched with % absolute error being 1.58 and 0.15%, respectively for GF2; and 0.82 and 1.48%, respectively for GF4 as far as the LegL and LegR were concerned. We excluded S9 since his foot imprints were not properly captured on the paper-based setup. Both the measured GF2 and GF4 for each leg of the post-stroke group showed larger variation (Figures 8A,B) compared to that for the healthy group (Figures 7A,B). The comparatively larger variation in GF2 and GF4 for the post-stroke individuals can be possibly attributed to the spectrum nature of the post-stroke conditions. Since the walking speed varied within hemiplegic patients possessing heterogeneous disability (Table 2), we also present the individual Normalized Stride Length and Step Length as measured by the ShoesFSR and paper-based setup. As can be seen from Figures 8C,D, irrespective of the individualized capabilities, there existed good agreement between the normalized Stride Length and Step Length values of individual post-stroke patients as measured by ShoesFSR and paper-based setup. Again, the ICC values confirmed good agreement between the measurements done by the ShoesFSR and the paper-based setup for post-stroke patients as well (ICC = 0.99 and 0.99, respectively for GF2; and ICC = 0.98 and 0.93, respectively for GF4 as far as the LegL and LegR were concerned). From these results, we can infer that the ShoesFSR can be reliably used to quantify gait parameters even for post-stroke hemiplegic individuals. Additionally, using non-parametric test, the statistical analysis revealed a significant difference (p < 0.05) for GF4 but not for GF2 as far as the paretic and non-paretic legs of post-stroke participants were concerned as indicated in literature (Kirtley, 2006).
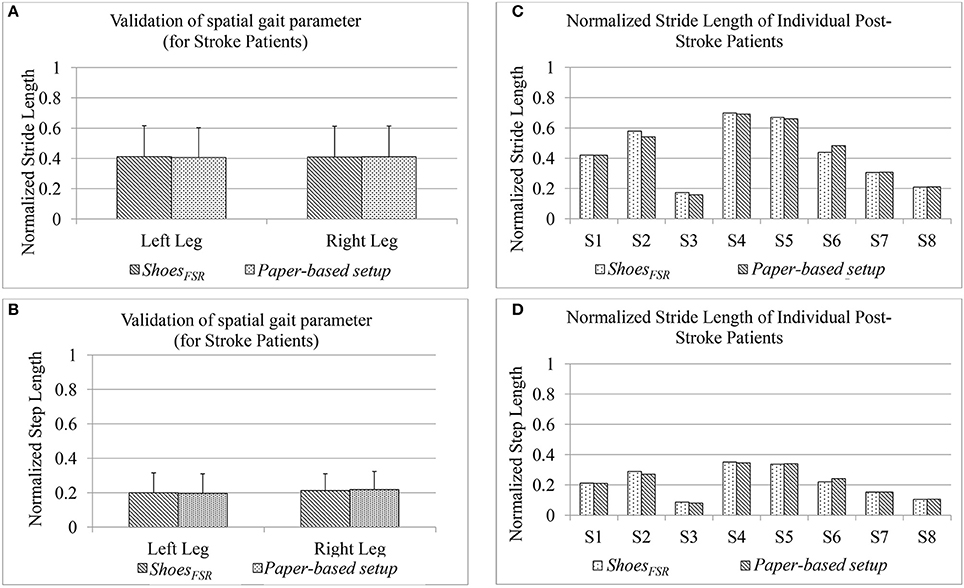
Figure 8. Comparison of normalized (A) Stride Length and (B) Step Length measured using ShoesFSR and paper-based setup for post-stroke hemiplegic patients (C) Normalized Stride Length of individual post-stroke patients (D) Normalized Step Length of individual post-stroke patients.
Implications of Stroke on Unilateral Gait Parameters
Till now we have looked into one's gait characteristics using the bilateral gait parameters (such as Step Time, Step Length, Stride Length, etc.) (Buesing et al., 2015). In order to examine the asymmetry in one's gait (especially for hemiplegic post-stroke patients), we analyzed the unilateral gait parameters such as Single Support Time, Swing Time and Stance Time (Von Schroeder et al., 1995).
Implication of stroke on single support time (GF5)
One's Single (limb) Support Time (GF5) is an important attribute of one's gait since it has been reported to mirror a post-stroke survivor's functional recovery (Von Schroeder et al., 1995). For healthy gait, one can expect GF5 associated with one's left (GF5_Left) and right (GF5_Right) legs to be very closely matched. Figure 9 shows the group scatter plot of GF5_Left vs. GF5_Right (expressed as % of gait cycle time). From Figure 9, we can observe that for the healthy individuals, the values are clustered close to the line representing y = x, as expected. Again, we can see that for the healthy individuals, the values of GF5_Left and GF5_Right were close to 40% that is in agreement with that reported in literature (Kyriazis and Rigas, 2000). In contrast, for all the hemiplegic post-stroke patients (except S2, S4, and S5), these values were distributed on either sides of the line representing y = x in the scatter plot (Figure 9). For S2, S4, and S5, we observed that their corresponding GF5_Left and GF5_Right values are in close proximity to the y = x line, similar to that of the healthy participants. A possible explanation for this observation might be that these participants (S2, S4, and S5) demonstrated a low abnormality in their gait compared to the other post-stroke patients, as evident from post-study video analysis. Also, this was supported by the clinical measures as recorded during the 10 m walk test (Table 2).
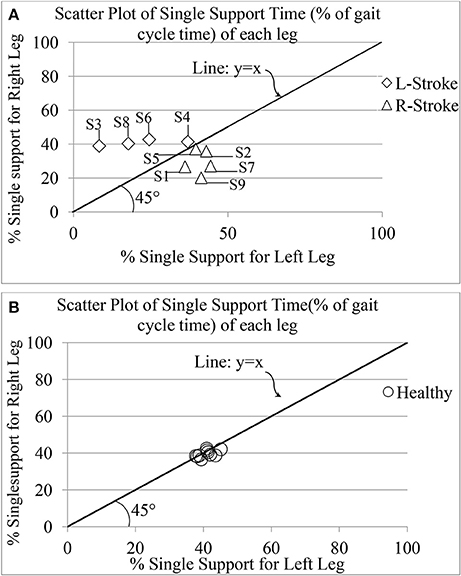
Figure 9. Comparative presentation of single limb support time of each leg for (A) post-stroke and (B) healthy individuals. R-Stroke, post-stroke patients with right hemiplegia stroke; L-Stroke, post-stroke patients with left hemiplegia.
Again, the post-stroke participant pool comprised of both left hemiplegic (S3, S4, S6, S8) and right hemiplegic (S1, S2, S5, S7, S9; Table 2) patients. In order to understand the implication of the hemiplegic side on the distribution of the values of GF5_Left and GF5_Right in the scatter plot, we carried out further analysis. We found that for the left hemiplegic post-stroke patients, GF5_Left<GF5_Right thereby causing the scatter points to lie to the left of the y = x line. A careful examination of the video analysis revealed that the left hemiplegic patients showed reduced usage of the leg on their paretic side (left leg) that was compensated with increased usage of the leg on their healthy side (right leg) during over-ground walk, similar to that reported in literature (Patterson et al., 2008). In contrast, for the right hemiplegic post-stroke patients, the scatter points were to the right side of the y = x line.
In order to understand whether unilateral gait parameter, such as GF5 was statistically different as far as the paretic and non-paretic sides of post-stroke hemiplegic participants were concerned, we carried out non-parametric Wilcoxon–Mann–Whitney test. Results indicate that there was statistically significant difference (p < 0.05) between the values of GF5 for the paretic and non-paretic legs.
Implication of stroke on swing (GF6_Swing) and stance (GF6_Stance) phases.
To further investigate the asymmetry in the gait of hemiplegic post-stroke patients, we calculated the unilateral gait parameters such as Swing and Stance phases quantified as percentage of one's gait cycle time. As reported in literature, healthy gait is characterized by Stance phase being ~60% of gait cycle and Swing phase as the remaining 40% of the gait cycle (O'Sullivan et al., 2013). The Figure 10 shows a comparative group analysis of Stance and Swing phases for healthy and post-stroke participants. It can be seen from Figures 10A,B that for both the healthy and post-stroke participants, the average % Stance and % Swing phases (for LegL and LegR) were ~60 and 40% of the gait cycle time, respectively. Although the group analysis of post-stroke survivors showed that the % Stance for the LegR was marginally higher (Δ% = 5.69%) than that for the LegL, the analysis based on hemiplegic side showed a different picture. It can be seen from the Figure 10C that for the right hemiplegic group, the absolute difference in the % Stance between LegL and LegR was 12% with that of LegL being greater of the two. Opposite was the case for the left hemiplegic group in which the absolute difference in the % Stance was 19% with that of LegR being greater of the two. Also, results on statistical analysis indicated that there was statistically significant difference (p < 0.05) between the paretic and non-paretic legs as far as GF6_Swing and GF6_Stance were concerned.
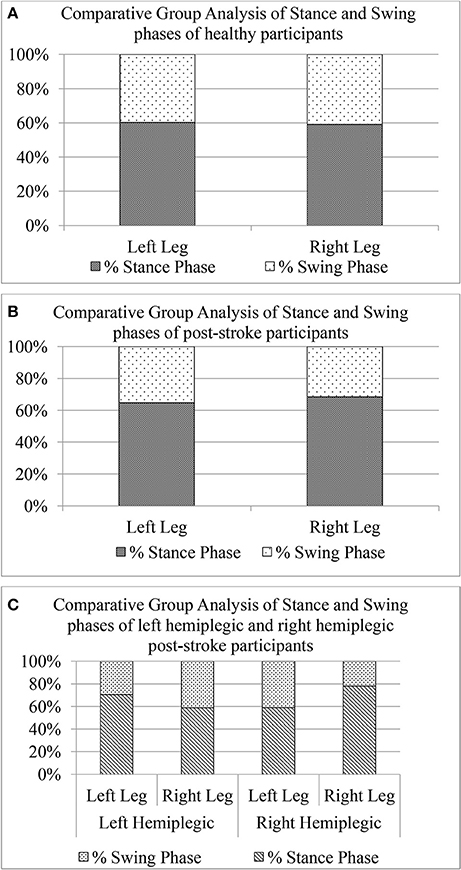
Figure 10. Comparative group analysis of stance and swing stages of left and right legs for (A) Healthy participants, (B) Post-stroke participants irrespective of hemiplegic side (C) Post-stroke participants segregated into left and right hemiplegia.
Implication of stroke on symmetry of weight bearing capacity during one's walk (GF7)
Understanding symmetry in one's gait is important as it is often related with risk of musculoskeletal injury, particularly in over-used non-paretic limb of post-stroke patients, and challenges in balance during one's walk (Patterson et al., 2008). Thus, in addition to the spatiotemporal data, we tried to understand the asymmetry in weight-bearing capacity of each leg in post-stroke patients by computing symmetry index, i.e., SI (GF7) using force magnitude data measured by the FSRs (FSRGD) in the instrumented shoes (ShoesFSR). Smaller is the value of SI, better is the symmetry and vice-versa for higher value of SI. Results indicate that the asymmetry in weight-bearing capacity of post-stroke group (SI = 25.16 ± 19.07) was higher (%Δ = 68%) compared to that of the healthy group (SI = 14.90± 9.49). This higher value of SI in post-stroke patients can be due to the comparatively reduced usage of the paretic leg than that of the non-paretic leg (Patterson et al., 2008). Thus the ShoesFSR can offer a precise quantitative estimate of the asymmetry in one's weight-bearing capacity on each leg.
Discussion and Limitation
The main contribution of this study was the design of a cost-effective and portable ShoesFSR that can characterize one's gait using spatiotemporal gait parameters. The ShoesFSR consisted of a pair of shoes having FSRs placed under the shoe insole. The FSR output was used to detect gait-related events such as heel strike/off and toe strike/off that were in turn used to measure Stride Length and Time, Step Length and Time, etc. The novelty of the ShoesFSR was its ability to characterize gait, accommodate cases with foot inversion/eversion, applicability to outdoor use and portability unlike the currently existing techniques. Additionally, this offers a detailed presentation of gait characterization even for post-stroke individuals.
The overall study was conducted in three stages. The Stages 1 and 2 were aimed to explore the ability of ShoesFSR to measure gait parameters of healthy individuals. In Stage 1, temporal gait parameters measured using ShoesFSR were validated with that measured using VICON system for healthy individuals. The result showed a good agreement between the measurement of gait parameters done using ShoesFSR and VICON system. In Stage 2, spatial gait parameters measured using ShoesFSR were validated with that measured using paper-based setup for healthy individuals. Results validated the reliability of ShoesFSR to report accurate spatial gait parameters as well. The Stage 3 was aimed to understand the potential of ShoesFSR to quantify abnormal gait in post-stroke hemiplegic participants. In Stage 3, we validated the gait parameters measured by ShoesFSR with that measured using the paper-based setup for post-stroke participants. Additionally, we explored the potential of the ShoesFSR to investigate abnormal gait patterns exhibited by post-stroke patients using different gait-related indices namely, Single Support Time, Swing and Stance phases and Symmetry Index.
Though our results were promising, yet our study had certain limitations. Specifically, one of the limitations was the reduced sample size of post-stroke hemiplegic participants. Also, our participants, enrolled based on availability, had heterogeneous post-stroke conditions. In future, we plan to extend our study by enrolling a larger number of post-stroke participants. Also, to better understand the effect of hemiplegic side on one's gait, we plan to segregate the extended participant pool based on hemiplegic side, age, etc. Additionally, in future, we plan to explore the applicability of ShoesFSR to different gait patterns exhibited by larger and more diverse group of subjects including healthy subjects simulating different walking patterns as well as post-stroke survivors. Again, with regard to the specifications of the Data Acquisition Module associated with the ShoesFSR, we used a sampling resolution of ~200 samples/second. Though this sampling resolution sufficed for our present application, yet we might need to go for higher sampling resolution to capture gait dynamics for faster gait or while running. Thus, in future, we plan to use hardware with higher sampling resolution when the same ShoesFSR can be used for other applications as well. Additionally, while we mention that our ShoesFSR was capable to measure the spatiotemporal parameters of one's gait, yet that was achieved in conjunction with additional devices such as camera. Specifically, as regards the computation of spatial parameters, the ShoesFSR required information on walking speed for which we have used a camera [section Computation of Stride Length (GF2)]. However, in future, we plan to use the ShoesFSR in connection with the Treadmill-based gait rehabilitation with pre-defined speed information that would not need any external device such as camera for separate measurement of walking speed.
However, the results of our preliminary study obtained using ShoesFSR could distinguish between healthy and pathologic gait and further it could discriminate right hemiplegic and left hemiplegic gait using gait parameters such as % Swing and Stance phases. Also, our results showed the potential of the ShoesFSR to be used to quantify one's gait symmetry that can help to monitor one's functional gait recovery in a cost-effective manner. At present, we have developed a working prototype of ShoesFSR that was made in-house with hand-fabricated electronic circuits costing around 90 $. However, we think that the current prototype needs to go through ergonomic modifications that might increase the price of the market-ready version of the ShoesFSR. Presently, the ShoesFSR have been used in controlled settings such as research labs and hospitals. Thus, questions still remain on the translation of the ShoesFSR outside the controlled settings to real-world use. Overall the ShoesFSR showed a commitment to be a reliable, portable and inexpensive solution for characterization of one's gait. In turn, the ShoesFSR shows a promise for future clinical use.
Ethics Statement
The study was carried out in accordance with the recommendations of Institutional Research Ethics by Institutional Ethics Committee (IEC), IIT Gandhinagar. The protocol was approved by the IEC. All participants provided informed and written consent for their participation in the study.
Author Contributions
DS and UL drafted the manuscript and contributed to the experiment design, experimental data collection with stroke participants, data analysis, and statistical analysis. Also, they read, corrected/commented, and approved the final manuscript.
Conflict of Interest Statement
The authors declare that the research was conducted in the absence of any commercial or financial relationships that could be construed as a potential conflict of interest.
Funding
This work was jointly funded by the Department of Science and Technology, India (Grant number: INT/SIN/P-07/2015) and Visvesvaraya Fellowship by Ministry of Electronics and Information Technology, India (Grant number: PhD-MLA/4(28)/2014-15 dated 28/04/2015).
Acknowledgments
The authors would like to thank DST—ASTAR, MeITY (Visvesvaraya Fellowship), Govt. of Gujarat, Physiotherapy institute at Civil Medical Hospital, CMP college of physiotherapy and Center of Biomedical Engineering at Indian Institute of Technology Gandhinagar for supporting this research. The authors would also like to thank the participants and lab members for making this study possible. Also the authors acknowledge the support from Dr. Vineet Vashista by giving us access to the VICON Camera setup.
Footnotes
1. ^VICON Motion Capture System. Available online at: https://www.vicon.com/products/camera-systems/vero.
2. ^Strideway System. Available online at: https://www.tekscan.com/products-solutions/systems/strideway-system?tab=applications).
3. ^GAITRite. Available online at: https://www.gaitrite.com/.
4. ^VICON LOCK+connect, integrate and synchronize. Available online at: https://www.vicon.com/file/vicon/lock-1104017-24499.pdf.
References
Alexander, N. B. (1996). Gait disorders in older adults. J. Am. Geriatr. Soc. 44, 434–451. doi: 10.1111/j.1532-5415.1996.tb06417.x
Alvarez, D., González, R. C., López, A., and Alvarez, J. C. (2008). “Comparison of step length estimators from wearable accelerometer devices,” in Encyclopedia of Healthcare Information Systems, eds K. Klinger, K. Roth, J. Neidig, J. Snavely C. Coulson, L. Kochanowski, J. Porter, and S. V. Hook (Pennsylvania, PA: IGI Global), 244–250.
Bagley, S., Kelly, B., Tunnicliffe, N., Turnbull, G. I., and Walker, J. M. (1991). The effect of visual cues on the gait of independently mobile Parkinson's disease patients. Physiotherapy 77, 415–420. doi: 10.1016/S0031-9406(10)62035-4
Barker, S., Craik, R., Freedman, W., Herrmann, N., and Hillstrom, H. (2006). Accuracy, reliability, and validity of a spatiotemporal gait analysis system. Med. Eng. Phys. 28, 460–467. doi: 10.1016/j.medengphy.2005.07.017
Beauchet, O., Herrmann, F. R., Grandjean, R., Dubost, V., and Allali, G. (2008). Concurrent validity of SMTEC® footswitches system for the measurement of temporal gait parameters. Gait Posture 27, 156–159. doi: 10.1016/j.gaitpost.2006.12.017
Błazkiewicz, M. I., Wiszomirska, I., and Wit, A. (2014). Comparison of four methods of calculating the symmetry of spatial-temporal parameters of gait. Acta Bioeng. Biomech. 16, 29–35. doi: 10.5277/abb140104
Buesing, C., Fisch, G., O'Donnell, M., Shahidi, I., Thomas, L., Mummidisetty, C. K., et al. (2015). Effects of a wearable exoskeleton stride management assist system (SMA®) on spatiotemporal gait characteristics in individuals after stroke: a randomized controlled trial. J. Neuroeng. Rehabil. 12, 69. doi: 10.1186/s12984-015-0062-0
Cappozzo, A., Della Croce, U., Leardini, A., and Chiari, L. (2005). Human movement analysis using stereophotogrammetry: part 1: theoretical background. Gait Posture 21, 186–196. doi: 10.1016/j.gaitpost.2004.01.010
Chae, J. (2016). Stroke Rehabilitation, An Issue of Physical Medicine and Rehabilitation Clinics of North America 26-4, E-Book. Philadelphia, PA: Elsevier Health Sciences.
Chen, M., Huang, B., and Xu, Y. (2007). “Human abnormal gait modeling via hidden Markov model,” in IEEE International Conference on Information Acquisition (Seogwipo-si), 517–522.
Chen, M., Huang, B., and Xu, Y. (2008). “Intelligent shoes for abnormal gait detection,” in IEEE International Conference on Robotics and Automation (Pasadena, CA), 2019–2024.
Debi, R., Mor, A., Segal, G., Segal, O., Agar, G., Debbi, E., et al. (2011). Correlation between single limb support phase and self-evaluation questionnaires in knee osteoarthritis populations. Disabil. Rehabil. 33, 1103–1109. doi: 10.3109/09638288.2010.520805
Della Toffola, L., Patel, S., Ozsecen, M. Y., Ramachandran, R., and Bonato, P. (2012). “A wearable system for long-term monitoring of knee kinematics,” in Proceedings of 2012 IEEE-EMBS International Conference on Biomedical and Health Informatics (Hong Kong), 188–191.
Elble, R. J., Thomas, S. S., Higgins, C., and Colliver, J. (1991). Stride-dependent changes in gait of older people. J. Neurol. 238, 1–5. doi: 10.1007/BF00319700
Fraccaro, P., Coyle, L., Doyle, J., and O'Sullivan, D. (2014). “Real-world gyroscope-based gait event detection and gait feature extraction,” Proceedings of eTELEMED, The Sixth International Conference on eHealth, Telemedicine, and Social Medicine (Barcelona), 247–252.
Frenkel-Toledo, S., Giladi, N., Peretz, C., Herman, T., Gruendlinger, L., and Hausdorff, J. M. (2005). Effect of gait speed on gait rhythmicity in Parkinson's disease: variability of stride time and swing time respond differently. J. Neuroeng. Rehabil. 2:23. doi: 10.1186/1743-0003-2-23
Hagell, P., Chen, H., Evans, V., O'Brien, E., Thomas, S., Hoeck, B., et al. (1999). International perspectives on stroke rehabilitation. J. Neurosci. Nurs. 31, 110–114. doi: 10.1097/01376517-199904000-00008
Hanlon, M., and Anderson, R. (2009). Real-time gait event detection using wearable sensors. Gait Posture 30, 523–527. doi: 10.1016/j.gaitpost.2009.07.128
Hausdorff, J. M., Cudkowicz, M. E., Firtion, R., Wei, J. Y., and Goldberger, A. L. (1998). Gait variability and basal ganglia disorders: stride-to-stride variations of gait cycle timing in Parkinson's disease and Huntington's disease. Mov. Disord. 13, 428–437. doi: 10.1002/mds.870130310
Henriksen, M., Lund, H., Moe-Nilssen, R., Bliddal, H., and Danneskiod-Samsøe, B. (2004). Test–retest reliability of trunk accelerometric gait analysis. Gait Posture 19, 288–297. doi: 10.1016/S0966-6362(03)00069-9
Huang, B., Chen, M., Lee, K. K., and Xu, Y. (2007a). Human identification based on gait modeling. Int. J. Inform. Acquis. 4, 27–38. doi: 10.1142/S0219878907001137
Huang, B., Chen, M., Shi, X., and Xu, Y. (2007b). “Gait event detection with intelligent shoes,” in IEEE International Conference on Information Acquisition (Seogwipo-si), 579–584.
Kirtley, C. (2006). Clinical Gait Analysis: Theory and Practice. New York, NY: Elsevier Health Sciences.
Kyriazis, V., and Rigas, C. (2000). A telemetry system designed for use with a conductive walkway: description and validation. J. Orthopaed. Traumatol. 1, 115–118. doi: 10.1007/s101950070001
Ladha, C., Del Din, S., Nazarpour, K., Hickey, A., Morris, R., Catt, M., et al. (2016). “Toward a low-cost gait analysis system for clinical and free-living assessment,” in 38th Annual International Conference of the IEEE Engineering in Medicine and Biology Society (EMBC) (Orlando, FL), 1874–1877.
Lemoyne, R., Coroian, C., Mastroianni, T., and Grundfest, W. (2008). Accelerometers for quantification of gait and movement disorders: a perspective review. J. Mech. Med. Biol. 8, 137–152. doi: 10.1142/S0219519408002656
Lopez-Meyer, P., Fulk, G. D., and Sazonov, E. S. (2011). Automatic detection of temporal gait parameters in poststroke individuals. IEEE Trans. Inf. Technol. Biomed. 15, 594–601. doi: 10.1109/TITB.2011.2112773
Majumder, A. J., Ahamed, S. I., Povinelli, R. J., Tamma, C. P., and Smith, R. O. (2015). “A novel wireless system to monitor gait using smartshoe-worn sensors,” in IEEE 39th Annual Computer Software and Applications Conference (Taichung), 733–741.
Maranesi, E., Di Nardo, F., Ghetti, G., Burattini, L., and Fioretti, S. (2014). “A goniometer-based method for the assessment of gait parameters,” in IEEE/ASME 10th International Conference on Mechatronic and Embedded Systems and Applications (MESA) (Senigallia), 1–4.
Muro-De-La-Herran, A., Garcia-Zapirain, B., and Mendez-Zorrilla, A. (2014). Gait analysis methods: an overview of wearable and non-wearable systems, highlighting clinical applications. Sensors 14, 3362–3394. doi: 10.3390/s140203362
O'Sullivan, S. B., Schmitz, T. J., and Fulk, G. (2013). Physical Rehabilitation. Philadelphia, PA: FA Davis.
Patterson, K. K., Parafianowicz, I., Danells, C. J., Closson, V., Verrier, M. C., Staines, W. R., et al. (2008). Gait asymmetry in community-ambulating stroke survivors. Arch. Phys. Med. Rehabil. 89, 304–310. doi: 10.1016/j.apmr.2007.08.142
Pawin, J., Khaorapapong, T., and Chawalit, S. (2011). “Neural-based human's abnormal gait detection using force sensitive resistors,” in Fourth IEEE International Workshop on Advanced Computational Intelligence (Wuhan), 224–229.
Perry, S. D., and Lafortune, M. A. (1995). Influences of inversion/eversion of the foot upon impact loading during locomotion. Clin. Biomech. 10, 253–257. doi: 10.1016/0268-0033(95)00006-7
Pinkam, N., and Nilkhamhang, I. (2013). “Wireless smart shoe for gait analysis with automated thresholding using PSO,” in 10th International Conference on Electrical Engineering/Electronics, Computer, Telecommunications and Information Technology (ECTI-CON) (Krabi), 1–6.
Rodrigo, R., Fernández-Gajardo, R., Gutiérrez, R., Manuel Matamala, J., Carrasco, R., Miranda-Merchak, A., et al. (2013). Oxidative stress and pathophysiology of ischemic stroke: novel therapeutic opportunities. CNS Neurol. Disord. Drug Targets 12, 698–714. doi: 10.2174/1871527311312050015
Shrout, P. E., and Fleiss, J. L. (1979). Intraclass correlations: uses in assessing rater reliability. Psychol. Bull. 86:420. doi: 10.1037/0033-2909.86.2.420
Tao, W., Liu, T., Zheng, R., and Feng, H. (2012). Gait analysis using wearable sensors. Sensors 12, 2255–2283. doi: 10.3390/s120202255
Tong, K., and Granat, M. H. (1999). A practical gait analysis system using gyroscopes. Med. Eng. Phys. 21, 87–94. doi: 10.1016/S1350-4533(99)00030-2
Toro, B., Nester, C., and Farren, P. (2003). A review of observational gait assessment in clinical practice. Physiother. Theor. Pract. 19, 137–149. doi: 10.1080/09593980307964
Von Schroeder, H. P., Coutts, R. D., Lyden, P. D., and Nickel, V. L. (1995). Gait parameters following stroke: a practical assessment. J. Rehabil. Res. Dev. 32:25.
Wang, F., Stone, E., Dai, W., Skubic, M., and Keller, J. (2009). “Gait analysis and validation using voxel data,” in Annual International Conference of the IEEE Engineering in Medicine and Biology Society (Minneapolis, MN), 6127–6130.
Wolfson, L. (2001). Gait and balance dysfunction: a model of the interaction of age and disease. Neuroscientist 7, 178–183. doi: 10.1177/107385840100700212
Keywords: stroke, gait characterization, gait parameter, instrumented shoe, FSR
Citation: Solanki D and Lahiri U (2018) Design of Instrumented Shoes for Gait Characterization: A Usability Study With Healthy and Post-stroke Hemiplegic Individuals. Front. Neurosci. 12:459. doi: 10.3389/fnins.2018.00459
Received: 29 March 2018; Accepted: 15 June 2018;
Published: 20 July 2018.
Edited by:
Ulrich G. Hofmann, Universitätsklinikum Freiburg, GermanyReviewed by:
Kunal Mankodiya, University of Rhode Island, United StatesChristoph Bodensteiner, Fraunhofer Society (FHG), Germany Nikolas Hesse contributed to the review of Christoph Bodensteiner
Copyright © 2018 Solanki and Lahiri. This is an open-access article distributed under the terms of the Creative Commons Attribution License (CC BY). The use, distribution or reproduction in other forums is permitted, provided the original author(s) and the copyright owner(s) are credited and that the original publication in this journal is cited, in accordance with accepted academic practice. No use, distribution or reproduction is permitted which does not comply with these terms.
*Correspondence: Dhaval Solanki, ZGhhdmFsLnNvbGFua2lAaWl0Z24uYWMuaW4=