 Blanca Lizarbe
 Ana Francisca Soares1
 João M. N. Duarte
- 1Laboratory for Functional and Metabolic Imaging, École Polytechnique Fédérale de Lausanne, Lausanne, Switzerland
- 2Instituto de Investigaciones Biomédicas “Alberto Sols”, Consejo Superior de Investigaciones Científicas – Universidad Autónoma de Madrid, Madrid, Spain
- 3Department of Experimental Medical Science, Faculty of Medicine, Lund University, Lund, Sweden
- 4Wallenberg Centre for Molecular Medicine, Faculty of Medicine, Lund University, Lund, Sweden
Metabolic syndrome and diabetes impact brain function and metabolism. While it is well established that rodents exposed to diets rich in saturated fat develop brain dysfunction, contrasting results abound in the literature, likely as result of exposure to different high-fat diet (HFD) compositions and for varied periods of time. In the present study, we investigated alterations of hippocampal-dependent spatial memory by measuring Y-maze spontaneous alternation, metabolic profiles of the hippocampus, cortex and hypothalamus by 1H magnetic resonance spectroscopy (MRS), and levels of proteins specific to synaptic and glial compartments in mice exposed for 6 months to different amounts of fat (10, 45, or 60% of total energy intake). Increasing the dietary amount of fat from 10 to 45% or 60% resulted in obesity accompanied by increased leptin, fasting blood glucose and insulin, and reduced glucose tolerance. In comparison to controls (10%-fat), only mice fed the 60%-fat diet showed increased fed glycemia, as well as plasma corticosterone that has a major impact on brain function. HFD-induced metabolic profile modifications measured by 1H MRS were observed across the three brain areas in mice exposed to 60%- but not 45%-fat diet, while both HFD groups displayed impaired hippocampal-dependent memory. HFD also affected systems involved in neuro- or gliotransmission in the hippocampus. Namely, relative to controls, 60%-fat-fed mice showed reduced SNAP-25, PSD-95 and syntaxin-4 immunoreactivity, while 45%-fat-fed mice showed reduced gephyrin and syntaxin-4 immunoreactivity. For both HFD levels, reductions of the vesicular glutamate transporter vGlut1 and levels of the vesicular GABA transporter were observed in the hippocampus and hypothalamus, relative to controls. Immunoreactivity against GFAP and/or Iba-1 in the hypothalamus was higher in mice exposed to HFD than controls, suggesting occurrence of gliosis. We conclude that different levels of dietary fat result in distinct neurochemical alterations in the brain.
Introduction
The ever-increasing life expectancy has led to a dramatic increase in the prevalence of age-associated disorders namely metabolic syndrome and type 2 diabetes (T2D), and neurodegenerative disorders, such as Alzheimer’s disease (AD). Notably, there is a growing body of epidemiological evidence suggesting that both metabolic syndrome and T2D increase the risk of developing age-related cognitive decline, mild cognitive impairment, vascular dementia, and AD (Frisardi et al., 2010; Duarte, 2015).
In addition to the many components of metabolic syndrome that may affect brain function, brain insulin resistance is a proposed mechanistic link between T2D and AD. Indeed, post-mortem analyses of brains from dementia patients revealed that insulin receptors are downregulated, and pointed toward a major role of neuronal insulin resistance in the etiology of AD (Steculorum et al., 2014; Duarte, 2015). Insulin receptors are widely distributed in the brain (Havrankova et al., 1978; Hill et al., 1986). Insulin and insulin-like growth factor 1 (IGF-1), which have converging signaling pathways in the brain, regulate the neuronal control of energy and glucose homeostasis by acting on hypothalamic nuclei (Steculorum et al., 2014), and also regulate cognitive processes through its actions on neurotransmission, synaptic plasticity, and neurogenesis within cortical and hippocampal circuits (Fernandez and Torres-Alemán, 2012).
A number of components of the metabolic syndrome such as hyperglycemia, microvascular complications, insulin resistance, dyslipidemia and hypertension occur in diabetes, and are risk factors for cognitive dysfunction (Duarte, 2015; Moheet et al., 2015). Although this combination of factors with potential impact on the central nervous system makes the mechanisms of diabetes-induced brain dysfunction difficult to study, research on different rodent models of diabetes have found that diabetic conditions lead to synaptic deterioration that results in defective neurotransmission and synaptic plasticity (Duarte et al., 2009, 2012a; Calvo-Ochoa et al., 2014), as well as neuroinflammation and astrogliosis (Saravia et al., 2002; Baydas et al., 2003; Duarte et al., 2009, 2012a; Calvo-Ochoa et al., 2014).
Changes in the cellular integrity of neurons and astrocytes are likely reflected on brain metabolic regulation, as well as metabolic profiles. Indeed, studies employing MRS, which allow to quantify brain metabolite profiles in a non-invasive manner, have generally identified reduced levels of the putative neuronal marker N-acetylaspartate, as well as increased in myo-inositol content (a proposed marker of astrocyte density) in brains of subjects with both AD and diabetes, relative to healthy individuals (reviewed in Duarte, 2016). Accordingly, altered metabolite profiles have been also reported in the brain of diabetes and HFD-induced obesity models (van der Graaf et al., 2004; Duarte et al., 2009; Wang et al., 2012; Lizarbe et al., 2018; Ribeiro et al., 2018).
In the present study, we tested the hypothesis that the severity of the metabolic syndrome is related to the degree of neurochemical alterations, as well as brain function deficits. For that, mice were fed diets containing different amounts of fat during 6 months, which lead to different degrees of glucose intolerance and insulin resistance (Soares et al., 2018). We then evaluated spatial memory performance, metabolic profiles of the hippocampus, cortex and hypothalamus, and levels of proteins specific to synaptic and glial compartments.
Materials and Methods
Animals
Animal experiments were performed with the approval by the local ethics committee (Service de la Consommation et des Affaires Vétérinaires, Epalinges, Switzerland). Sample size estimation was based on previous MRS experiments (Gapp et al., 2017; Lizarbe et al., 2018). Eleven-week-old male C57BL/6J mice were purchased from Charles River (L’Arbresle, France), and housed in groups of 3–4 on a 12-h light-dark cycle with lights on at 07:00, room temperature at 21–23°C, and humidity at 55–60%. Mice were randomly split in three groups (n = 11/group), and dietary interventions started after 1 week of acclimatization to the facility, i.e., at 3 months of age. During 6 months, mice were fed standardized diets containing 10%, 45%, or 60% of kilocalories from lard-based fat (D12450B, D12451, D12492, Research Diets, New Brunswick, NJ, United States), as previously detailed (Soares et al., 2018). Food and tap water were provided ad libitum. After this 6-month housing period, the following procedures were carried out sequentially with 2 days of interval: behavior experiments, one MRS scan session, glucose tolerance tests, tissue collection.
Behavioral Tasks
Exploratory behavior and locomotor activity of mice was evaluated over a 5-min period in the dark, using a squared open field arena measuring 30 cm × 30 cm and 25 cm high, divided in four squares of 15 cm × 15 cm. The number of crossings in these squares and the number of rearing movements with forepaws were quantified as horizontal and vertical activity, respectively. Rearing with the forepaws pressed against the walls was not considered.
Spontaneous alternation was observed in a Y-maze (Duarte et al., 2012a), with each arm of 30 cm long, 5 cm wide, and 25 cm height, converging to an equal angle. Mice were placed at the bottom of one arm in the Y-maze and were allowed to explore freely all three arms for a single 8-min session in the dark. The recorded spontaneous alternation behavior was used to access hippocampal-dependent spatial memory. If the mouse remembers the arm it has just explored, it will then enter the other arm of the maze instead. Complete spontaneous alternation was defined as successive entries into the three arms and expressed as fraction of the possible alternations in the respective test. In additionally to the open field test, the number of entries in the arms of the maze also allowed to access locomotor activity.
Magnetic Resonance Spectroscopy (MRS)
All experiments were carried out in a 14.1 T magnet with a horizontal bore of 26 cm (Magnex Scientific, Abingdon, United Kingdom), equipped with a 12-cm internal diameter gradient coil insert (400mT/m, 200μs), and interfaced to a DirectDrive console (Agilent Technologies, Palo Alto, CA, United States). Radio frequency transmission and reception were achieved with a home-built quadrature surface coil composed of two geometrically decoupled single-turn loops of 12 mm inner diameter resonating at 600 MHz. Spontaneously breathing mice were anesthetized with 1–1.5% isoflurane (Animalcare Ltd., York, United Kingdom) in a 1:1 O2:air mixture, and fixed in a home-built mouse holder with a bite bar and two ear inserts. Body temperature was maintained at 37°C by warm water circulation. Respiration and temperature were continuously monitored using a MR-compatible system (Small Animal Instruments, Inc., Stony Brook, NY, United States). Volumes of interest (VOI) were placed in the dorsal hippocampus (1.2 mm × 2.0 mm × 2.1 mm), cortex (0.8 mm × 4.0 mm × 1.6 mm) or hypothalamus (1.8 mm × 2.7 mm × 1.8 mm) according to anatomical landmarks in T2-weighted fast-spin-echo images. Field homogeneity in the VOI was achieved with FAST(EST)MAP (Gruetter and Tkác, 2000). Spectra were acquired using SPECIAL with echo time of 2.8 ms and repetition time of 4 s (Mlynárik et al., 2006). We accumulated 210, 320, and 400 scans for the cortex, hippocampus, and hypothalamus, respectively. The order of scanning the regions was random.
The concentrations of brain metabolites were determined with LCModel (Stephen Provencher Inc., Oakville, ON, Canada), including a Mac spectrum in the database and using the unsuppressed water signal measured from the same VOI as internal reference (Gapp et al., 2017). The following metabolites were included in the analysis: alanine, ascorbate, aspartate, creatine, γ-aminobutyrate (GABA), glutamine, glutamate, glutathione, glycine, glycerophosphorylcholine, glucose, lactate, myo-inositol, N-acetylaspartate, N-acetylaspartylglutamate (NAAG), phosphorylethanolamine, phosphorylcholine, phosphocreatine, scyllo-inositol, taurine. The Cramér-Rao lower bound (CRLB) was provided by LCModel as a measure of the reliability of the quantification for each metabolite. In most measured spectra, scyllo-inositol was below the detection limit, and was excluded from subsequent data analyses. Alanine in the hypothalamus was also below the detection limit. Remaining metabolites had CRLB below 30%. Given the substantial overlap between phosphorylcholine and glycerophosphorylcholine signals, total choline levels are reported.
Three mice (one on 45% fat diet, two on 60% fat diet) were excluded from the study because of abnormally high glutamine concentration in all brain regions investigated, which suggests the occurrence of congenital portosystemic shunting (Cudalbu et al., 2013).
Glucose Tolerance Test
After a 6-h fast starting at 07:00, a blood sample was collected to determine glucose and insulin levels. Then mice were given an oral load of glucose (1.5 g/kg), and blood glucose was measured after 15, 30, 60, 90, and 120 min from the tail tip with the Breeze glucometer (Bayer, Zürich, Switzerland).
Tissue Collection
Mice were briefly anesthetized with isoflurane (2% in air). Glycemia under isoflurane anesthesia was measured using the Ascensia Contour glucometer (Bayer). A blood sample was collected from the descending aorta, and then mice were decapitated. The brain was rapidly removed, and brain regions were dissected in ice-cold phosphate-buffered saline (PBS; in mmol/L: 137 NaCl, 2.7 KCl, 1.5 KH2PO4, 8.1 Na2HPO4, pH 7.4). Brain and plasma samples were stored at -80°C until further processing.
Western Blot
Tissue samples were homogenized with a needle sonicator in lysis buffer [in mmol/L: 150 NaCl, 1 ethylenediaminetetraacetic acid (EDTA), 50 tris(hydroxymethyl)aminomethane (Tris)-HCl, 1% (v/v) Triton X-100, 0.5% (w/v) sodium deoxycholate, 0.5% (w/v) sodium dodecylsulfate (SDS), pH 8.0] containing protease inhibitors (Roche, Switzerland). The homogenate was then maintained in constant agitation for 2 h at 4°C. After centrifugation at 3,000 ×g for 10 min at 4°C to remove major debris, the supernatant was saved. Total protein content was determined with the bicinchoninic acid assay (kit from Pierce, Thermo Fisher Scientific, Göteborg, Sweden).
Samples were then diluted in NuPAGE-LDS sample buffer [in mmol/L: 141 Tris-base, 106 Tris-HCl, 50 dithiothreitol, 0.51 EDTA, 0.22 Coomassie Brilliant Blue G-250, 0.175 phenol red; 2% (w/v) lithium dodecylsulfate, 10% glycerol, pH 8.5] and heated for 2 min at 95°C, 2–20 μg of protein were loaded in precast NuPAGE Novex 4–12% polyacrylamide gradient gels (Invitrogen, Thermo Fisher Scientific), along with molecular weight standards (Precision Plus Protein standards from Bio-Rad, Sundbyberg, Sweden), and electrophoresis was carried out at 125 V in a 3-(N-morpholino)propanesulfonic acid (MOPS) running buffer (in mmol/L: 50 MOPS, 50 Tris Base, 1 EDTA, 0.1% SDS, pH 7.7).
Proteins were transferred onto 0.45 μm polyvinylidene difluoride membranes (GE Life Sciences, Sweden) in a buffer composed of 192 mmol/L glycine, 25 mmol/L Tris and 20% (v/v) methanol (pH 9.2). The membranes were subsequently blocked for 90 min in 5% (w/v) low-fat milk (VWR, Stockholm, Sweden) solution prepared in Tris-buffered saline (TBS) (in mmol/L: 20 Tris, 137 NaCl, pH 7.46) with 0.1% (v/v) tween-20 (TBS-T), and were then incubated with primary antibodies (Table 1) over night at 4°C. After three 15-min washes in TBS-T containing 1% (w/v) milk, membranes were incubated with the respective secondary antibodies conjugated with horseradish peroxidase (Table 1) for 1 h at room temperature. After the second antibody, the membranes were washed three more times in TBS-T and developed in the ChemiDoc (Bio-Rad) using the SuperSignal West Pico PLUS Chemiluminescent substrate (Thermo Scientific).
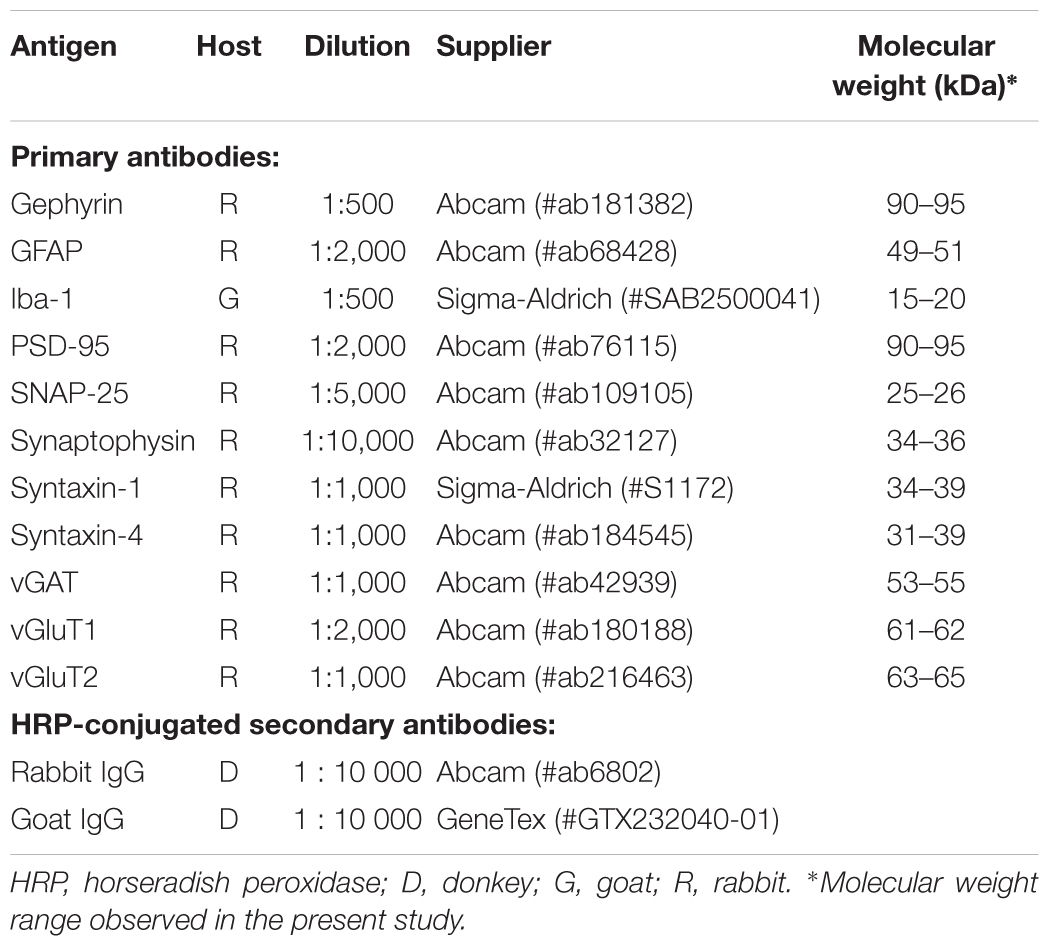
Table 1. Antibodies employed in the present study.
Biochemical Analyses
Plasma corticosterone and leptin were assayed with ELISA kits from Abcam (Cambridge, United Kingdom). Plasma insulin concentration was determined using the mouse insulin ELISA kit from Mercodia (Uppsala, Sweden).
Statistical Analysis
All results were analyzed using analysis of variance (ANOVA), followed by independent comparisons with the Fisher’s least significant difference (LSD) test. For the analyses of metabolite concentrations, the three brain regions were analyzed together as repeated measures, and post hoc analyses were only performed in case of significant effects of fat or fat-region interaction at P < 0.05. Results are presented as mean ± SEM unless otherwise stated.
Results
Chronic exposure to HFD resulted in development of obesity, mild hyperglycemia, glucose intolerance, and hyperinsulinemia (Figure 1). Weight gain was proportional to the dietary fat content (F = 64.2, P < 0.001, Figure 1A). Fed glycemia was modified by HFD (F = 9.1, P = 0.001, Figure 1B), being significantly increased in 60%-fat fed mice compared to controls (+56 ± 14%, P < 0.001) and to 45%-fat fed mice (+45 ± 13%, P = 0.002). Mice under 10%- and 45%-fat diets showed similar fed glycemia. After fasting for 6 h, mice showed a glycemia that was proportional to the amount of fat in the diet (F = 23.1; P < 0.001, Figure 1C), while insulinemia was similarly increased in both HFD groups compared to controls (F = 9.2, P < 0.001, Figure 1D). The diet also had an effect on the fasting glycemia to plasma insulin ratio (F = 3.6, P = 0.041) that is commonly taken as an indicator of insulin sensitivity. In particular, compared to controls (10%-fat fed mice), the ratio of glucose to insulin was reduced by 94 ± 42% (P = 0.034) and 95 ± 42% (P = 0.033) in mice from the 45%-fat or 60%-fat groups, respectively. An oral glucose tolerance test after this fasting period revealed an impairment of blood glucose clearance that was also proportional to the amount of fat present in the diet (F = 14.6, P < 0.001, Figure 1E). This is especially clear when looking at the glycemia at 2 h post the glucose administration (F = 13.5, P < 0.001, Figure 1F), with 60%-fat fed mice displaying increased glycemia compared to both 45%-fat fed mice (+32 ± 14%, P = 0.033) and controls (+109 ± 21%, P < 0.001). HFD also affected the circulating concentrations of corticosterone (F = 4.2, P = 0.025, Figure 1G) and leptin (F = 19.0, P < 0.001, Figure 1H). In post hoc tests, corticosterone was only significantly different between mice under diets with 10% and 60% fat (+32 ± 11%, P = 0.007), while leptin was similarly increased in both HFD groups compared to controls.
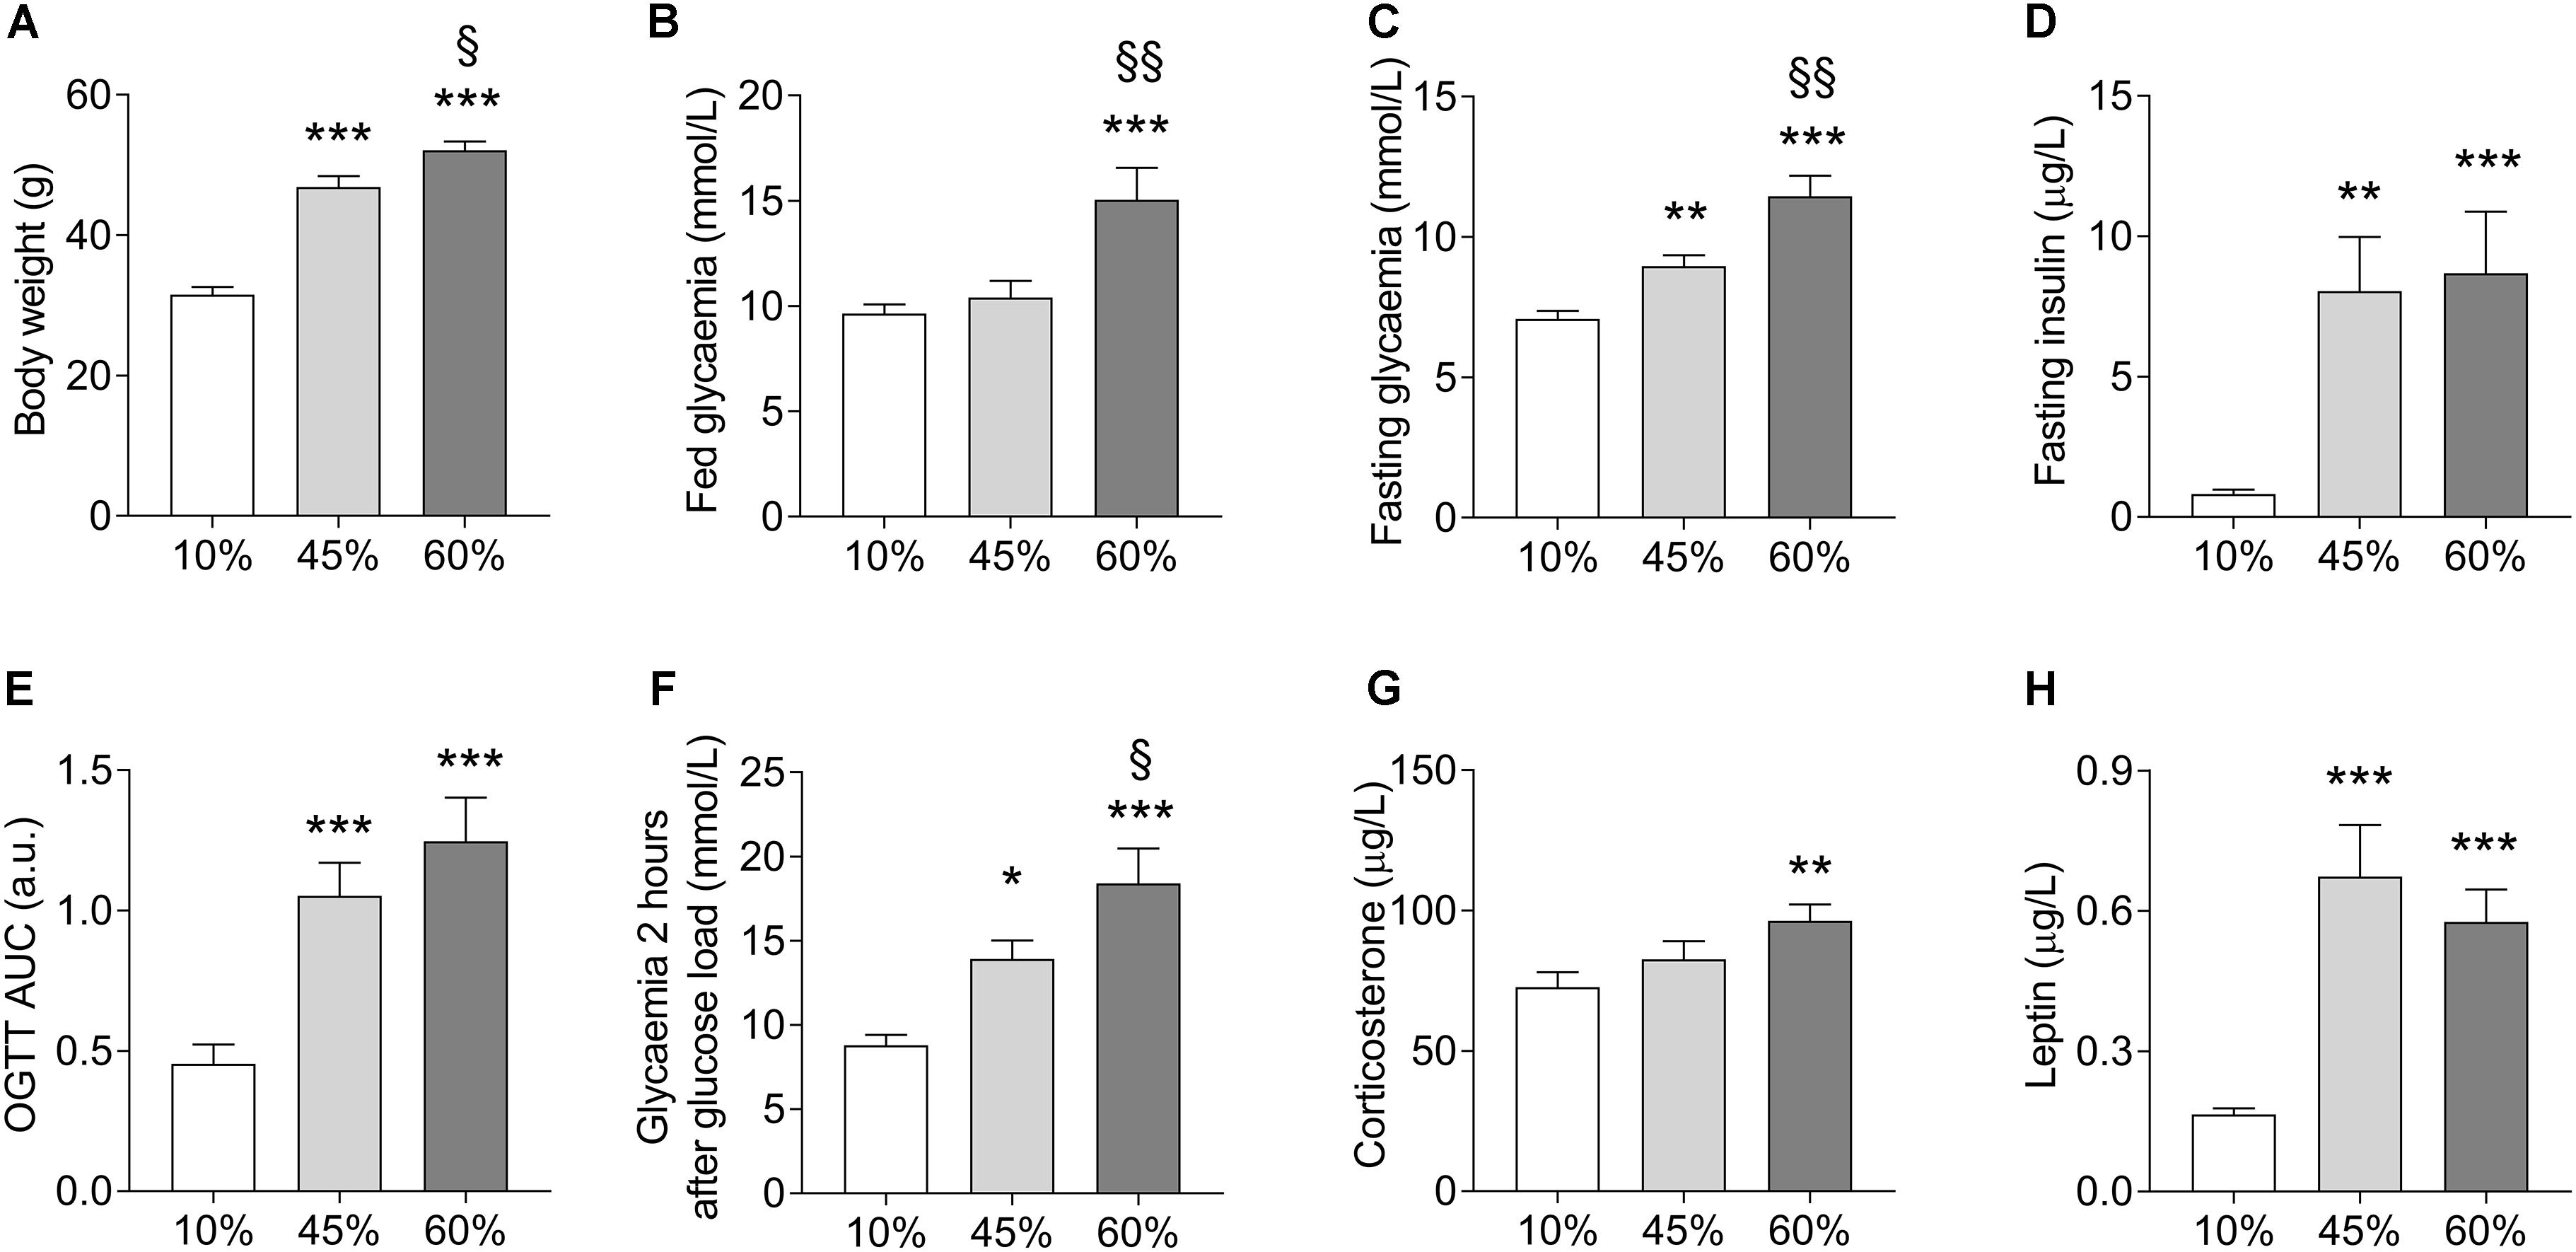
Figure 1. HFD-induced changes on body weight (A), fed glycemia (B), glycemia (C), and plasma insulin (D) after a 6-h fasting, area under the curve (AUC) of an oral glucose tolerance test (OGTT) with 1.5 g/kg of glucose (E) and glycemia measured 2 h after the glucose load (F), and plasma corticosterone (G) and leptin (H) concentrations. Data are mean ± SEM. Symbols indicate significant differences in LSD tests after significant ANOVA, comparing HFD fed mice (45% fat or 60%-fat) and controls (10%-fat; ∗P < 0.05, ∗∗P < 0.01; ∗∗∗P < 0.001), or the diets containing 45% and 60% fat (§ P < 0.05, §§ P < 0.01).
Spatial Memory
Exposure to HFD resulted in impaired spatial memory performance, measured as spontaneous alternation in the Y-maze (F = 3.8, P = 0.030, Figure 2A). In particular, there was a reduction of the Y-maze spontaneous alternation in mice consuming both the 45%-fat diet (-11 ± 5%, P = 0.028) and 60%-fat diet (-10 ± 4%, P = 0.025), relative to controls. Diet also had an effect on the number of entries in the maze arms (F = 8.2, P = 0.001), but not resulting in major impairment of exploratory behavior, which was also assessed in the open-field test (Figure 2B). Nevertheless, mice exposed to both 45%-fat and 60%-fat diets showed a reduction in locomotor activity, that is reduced number of crossing events between quadrants of the arena (F = 5.5, P = 0.008), and reduced vertical explorations of the arena’s space, that is rearing events (F = 3.8, P = 0.030). Nevertheless, the observed reduction activity did not impair the analysis of spontaneous alteration behavior as it is normalized for the number of possible complete alternations, and there were sufficient arm entries in the Y-maze (Figure 2A).
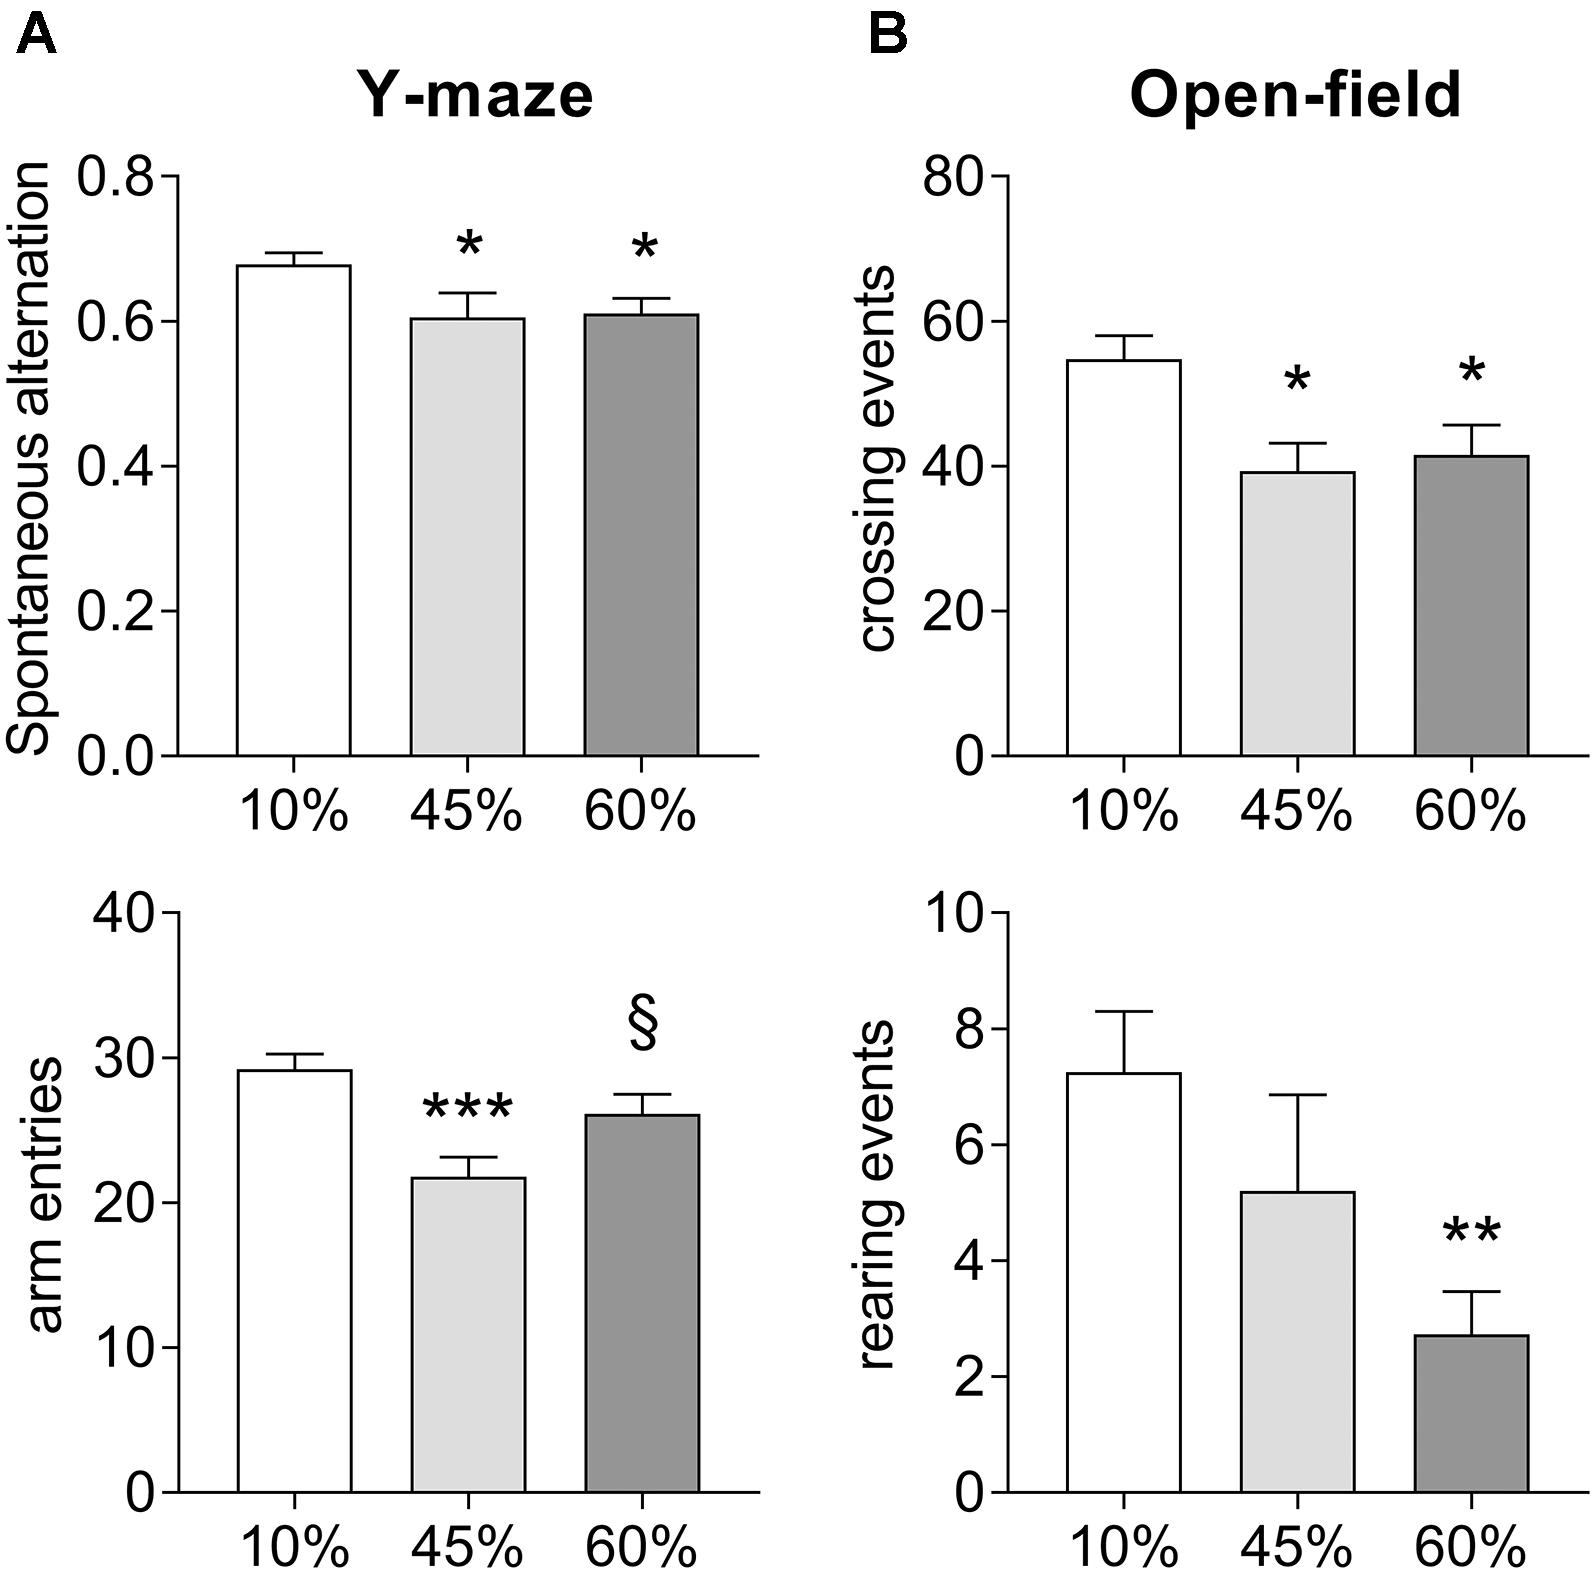
Figure 2. Impact of HFD exposure on the performance in the Y-maze (A) and the open-field arena (B). Data are mean ± SEM. Symbols indicate significant differences in LSD tests after significant ANOVA, comparing HDF fed mice (45% fat or 60%-fat) and controls (10%-fat; ∗P < 0.05, ∗∗P < 0.01; ∗∗∗P < 0.001), or the diets containing 45% and 60% fat (§ P < 0.05).
Metabolic Profiles
Proton spectra were acquired with an average SNR of 18 ± 3 (standard deviation across all brain areas). Typical spectra are shown in Figure 3. Linewidths at half-height were 11.2 ± 3.0 Hz, 16.2 ± 4.0 Hz and 13.6 ± 2.2 Hz (mean with standard deviation) in the hippocampus, cortex and hypothalamus, respectively.
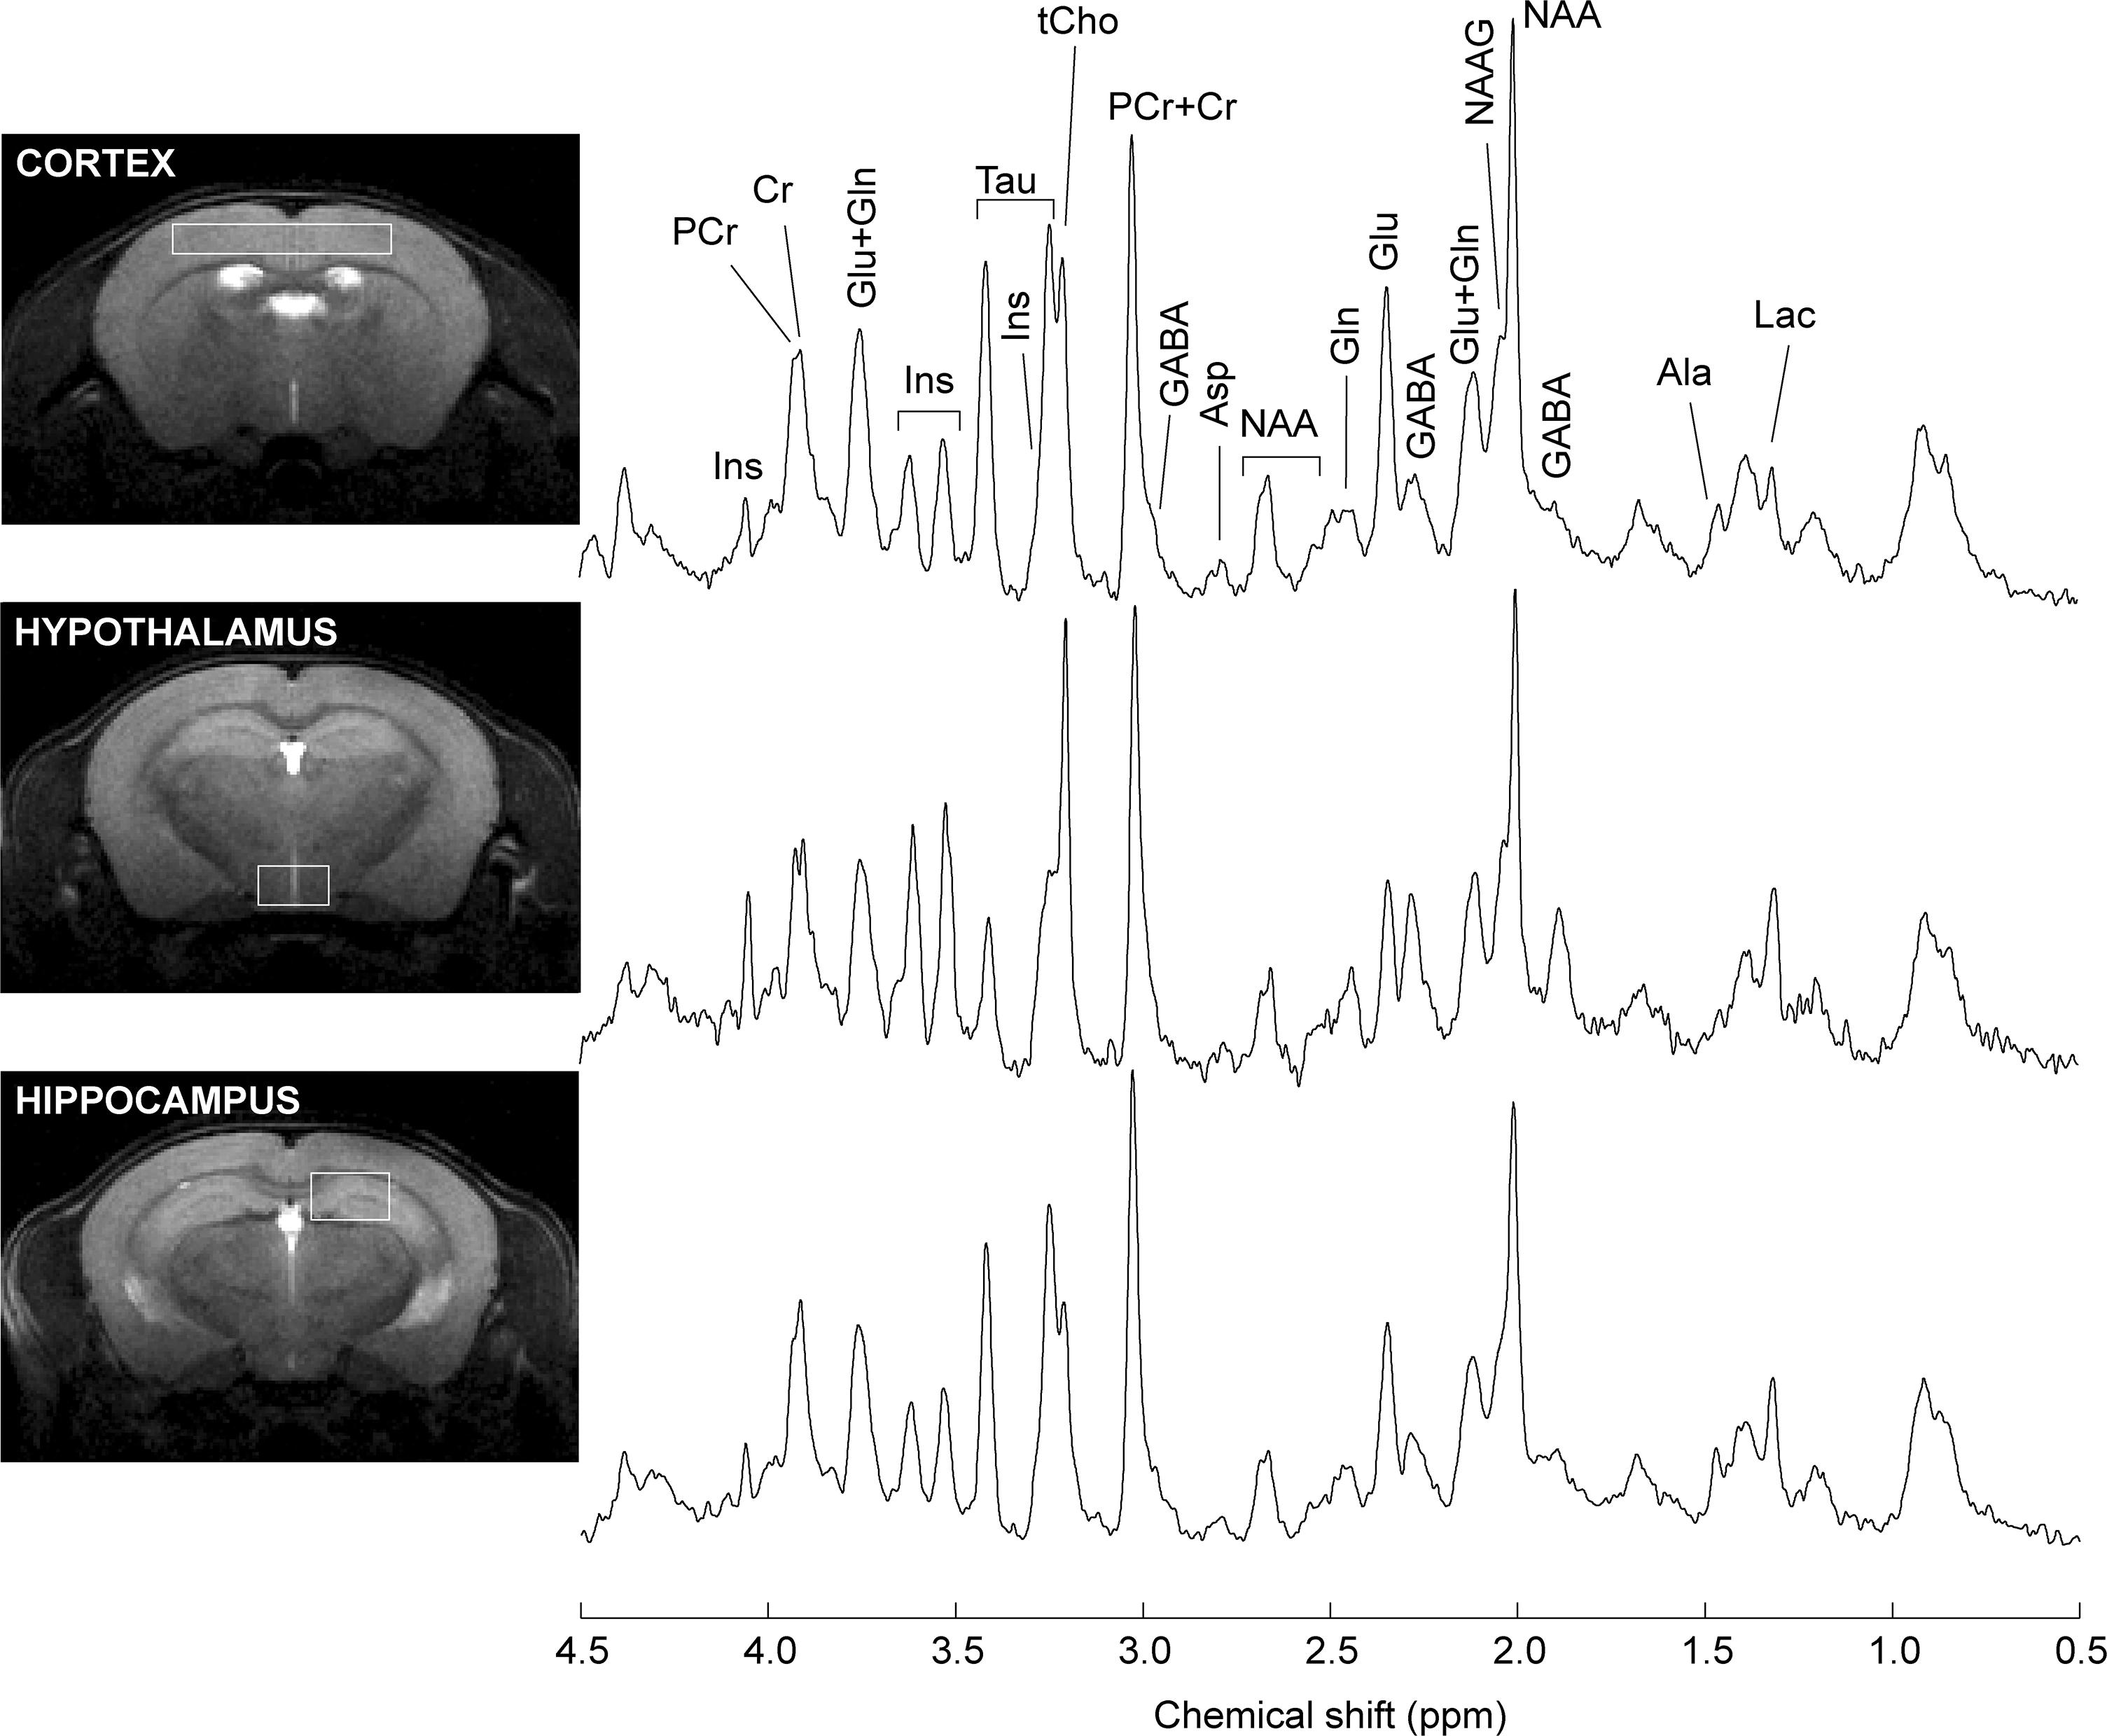
Figure 3. Typical spectra recorded from the mouse hippocampus, cortex and hypothalamus. Spectra were acquired with SPECIAL at 14.1 T. For signal enhancement of the displayed spectra, a Gaussian apodization (gf = 0.08, gfs = 0.02) was applied prior Fourier transformation. Lac, lactate; Ala, alanine; GABA, γ-aminobutyrate; NAA, N-acetylaspartate; NAAG, N-acetylaspartylglutamate; Glu, glutamate; Gln, glutamine; Asp, aspartate, Cr, creatine; PCr, phosphocreatine; tCho, total choline-containing compounds; Tau, taurine; Ins, myo-inositol.
The amount of fat in the diet significantly impacted the levels of creatine (F = 13.7, P < 0.001, Figure 4A), which also varied across analyzed brain areas (region effect F = 55.1, P < 0.001; interaction F = 0.9, P = 0.506). Although phosphocreatine levels were not impacted by HFD exposure (Figure 4B), the content of fat was associated to reductions of the phosphocreatine-to-creatine ratio (F = 13.1, P = 0.009, Figure 4C), which suggests impaired energy metabolism. This effect was particularly prominent in the cortex (-31%, P = 0.003) and hypothalamus (-20%, P = 0.050), and not significant in the hippocampus (-13%, P = 0.303) of the 60%-fat group compared to controls.
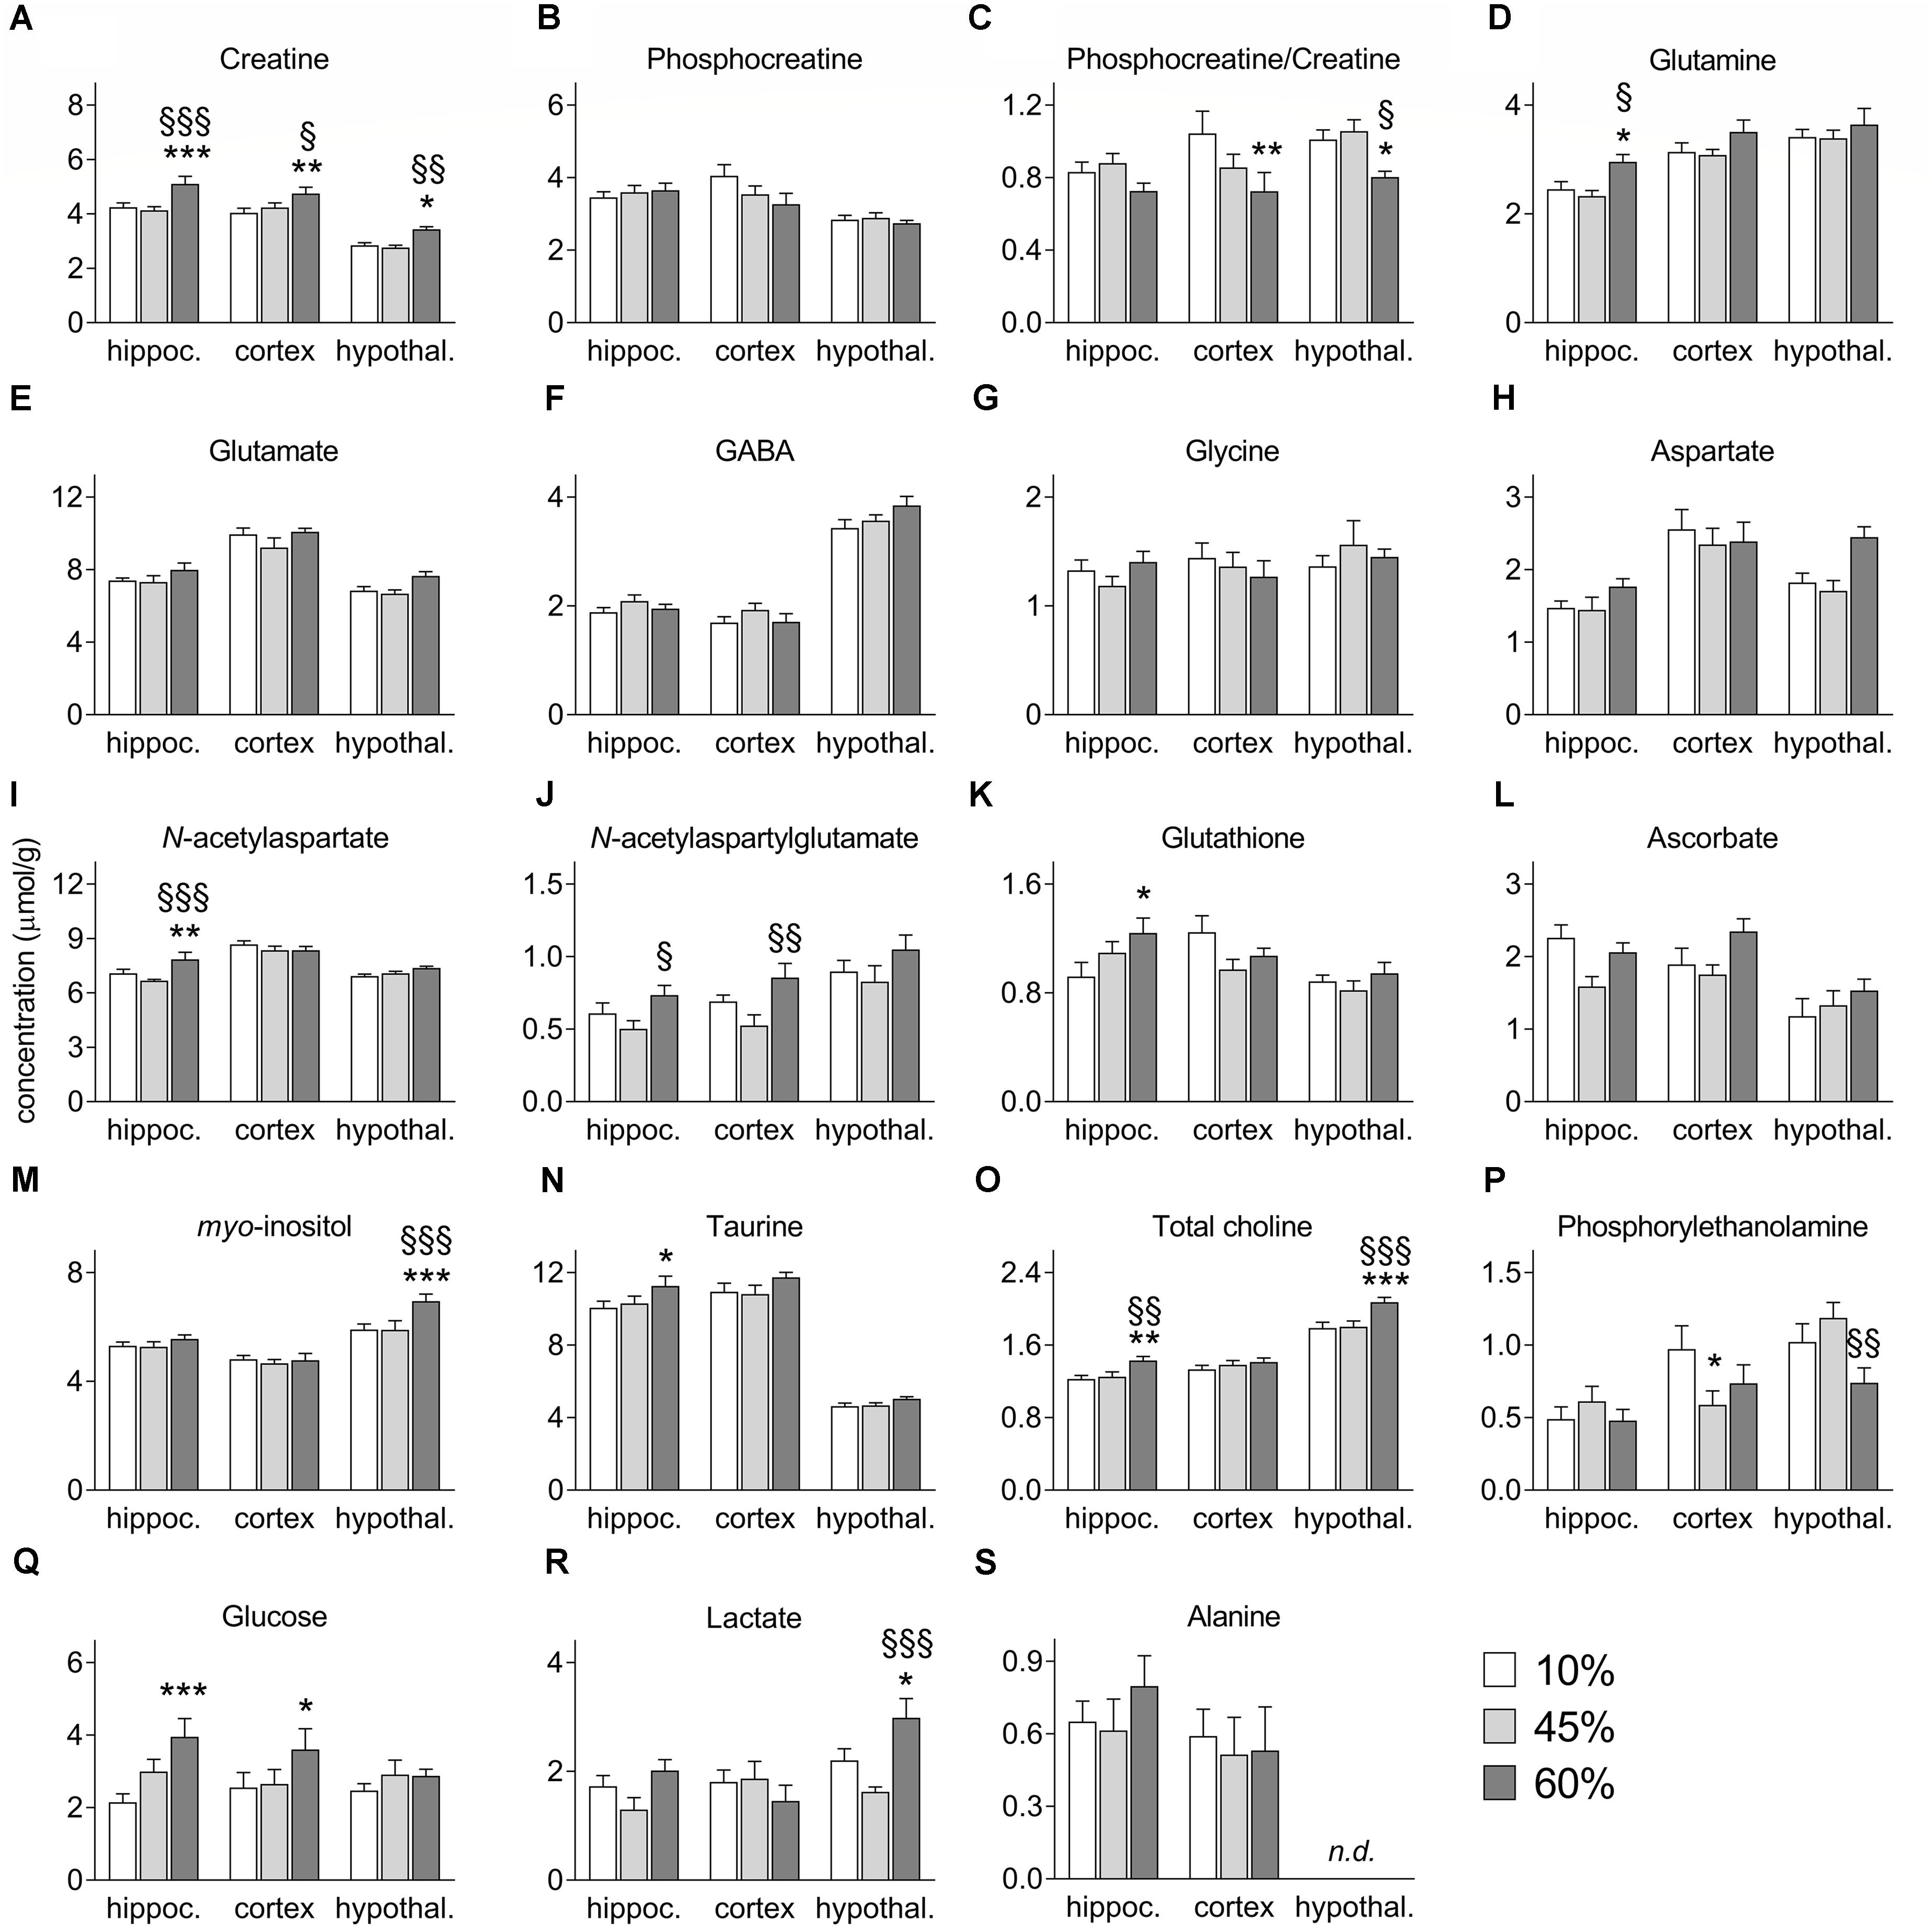
Figure 4. Concentrations of metabolites in the hippocampus (hippoc.), cortex and hypothalamus (hypothal.) of mice fed diets containing 10%, 45%, and 60% fat. Panels (A–S) show alterations of each metabolite as presented in the text. Data are mean ± SEM (μmol/g). Symbols indicate significant differences in LSD tests after significant ANOVA, comparing HFD fed mice (45% fat or 60%-fat) and controls (10%-fat; ∗P < 0.05, ∗∗P < 0.01; ∗∗∗P < 0.001), or the diets containing 45% and 60% fat (§ P < 0.05, §§ P < 0.01, §§§ P < 0.001).
High-fat diet caused a general increase of glutamine levels (F = 7.9, P = 0.050, Figure 4D), and there was also an effect of brain region on glutamine levels (region F = 33.3, P < 0.0001; interaction F = 0.9, P = 0.717), and post hoc analyses revealed a significant increase the hippocampus of mice fed 60%-fat diet relative to controls (+21 ± 10%, P = 0.036), as well as relative to mice fed 45%-fat diet (+27 ± 10%, P = 0.011). Interestingly glutamate levels were not significantly affected by the diet (Figure 4E). Brain concentrations the neuro-transmitting amino acids GABA (Figure 4F), glycine (Figure 4G), and aspartate (Figure 4H) also remained unaltered by HFD exposure.
The levels of the neuronal marker N-acetylaspartate showed a significant diet-region interaction (interaction F = 6.7, P = 0.006; region F = 44.2, P < 0.001; fat F = 4.5, P = 0.066, Figure 4I). Post hoc analyses identified an increase of N-acetylaspartate concentration in the hippocampus of mice exposed to 60%-fat diet compared to controls (+11 ± 4%, P = 0.007), and compared to 45%-fat fed mice (+18 ± 4%, P < 0.001).
N-Acetylaspartylglutamate levels were modified by fat content in the diet (F = 12.8, P = 0.015, Figure 4J) and varied across brain areas (F = 20.4, P < 0.001), without interaction (F = 0.5, P = 0.918). However, no significant changes were detected in post hoc analyses between controls and mice in either HFD group. However, significant differences were observed between 45%-fat and 60%-fat groups in the cortex (+36 ± 22%, P = 0.005) and hippocampus (+46 ± 20%, P = 0.046).
We found a diet-region interaction effect on the concentration of glutathione (interaction F = 9.8, P = 0.047; region F = 10.9, P = 0.006; diet F = 2.7, P = 0.247, Figure 4K). Post hoc analyses showed a significant increase of hippocampal glutathione levels in the 60%-fat group compared to controls (+35 ± 13%, P = 0.011). The concentrations of the antioxidant Asc were not significantly modified by HFD exposure (Figure 4L).
There was a significant diet-region interaction effect on the concentration of myo-inositol (interaction F = 4.9, P = 0.029; region F = 45.4, P < 0.001; diet F = 5.2, P = 0.071, Figure 4M). Post hoc analyses indicated that the increase of myo-inositol was exclusive to the hypothalamus (+18 ± 5%, P < 0.001 for mice exposed to 60%-fat diet vs. controls; and +18 ± 5%, P < 0.001 vs. 45%-fat).
High-fat diet caused an increase of taurine levels (F = 1.3, P = 0.047, Figure 4N), which also varied across the three brain regions (F = 85.9, P < 0.001) without diet-region interaction (F = 0.2, P = 0.788). Post hoc analyses showed a significant difference of hippocampal taurine content between the mice exposed 60%-fat diet and controls (+12 ± 0.5%, P = 0.022).
The concentration of total choline-containing compounds was affected by HFD exposure (F = 6.8, P = 0.001, Figure 4O) and varied across brain regions (F = 68.1, P < 0.001) without interaction between the two factors (F = 1.8, P = 0.149). The content of total choline was significantly higher in mice exposed to 60%-fat diet in the hippocampus (+17 ± 6%, P = 0.007 vs. controls; +14 ± 6%, P = 0.018 vs. 45%-fat) and hypothalamus (+16 ± 4%, P < 0.001 vs. controls; +15 ± 4%, P < 0.001 vs. 45%-fat), but not in the cortex.
A significant diet-region interaction effect was observed on phosphorylethanolamine levels (interaction F = 8.7, P = 0.022; region F = 19.8, P < 0.0001; fat F = 3.2, P = 0.252, Figure 4P). Post hoc analyses identified a 40 ± 16% reduction of phosphorylethanolamine concentration in the cortex of mice exposed to 45%-fat diet compared to controls (P = 0.017). Such reduction in mice exposed to the 60%-fat diet did not reach statistical significance (-24 ± 17%, P = 0.148). The concentration of phosphorylethanolamine in the hypothalamus was different between the two HFD groups (P = 0.009).
Brain glucose levels were increased with the amount of fat in the diet (F = 12.6, P = 0.037, Figure 4Q) with no region (F = 0.8, P = 0.513) or interaction (F = 4.4, P = 0.146) effects. Compared to control mice, mice exposed to 60%-fat diet displayed a glucose concentration increase of 84 ± 25% in the hippocampus (P < 0.001) and of 41 ± 20% in the cortex (P = 0.049), but negligible in the hypothalamus (+16 ± 21%, P = 0.442).
We observed a significant diet-region interaction effect on the levels of lactate (interaction F = 11.9, P = 0.005, region F = 10.1, P = 0.002, fat F = 6.9, P = 0.080, Figure 4R). Post hoc analyses identified an increase of lactate concentration in the hypothalamus of mice exposed to 60%-fat diet compared to controls (+36 ± 16%, P = 0.025), and compared to 45%-fat fed mice (+84 ± 21%, P < 0.001). Levels of alanine were not significantly modified by HFD exposure (Figure 4S).
Synaptic Degeneration
In order to infer on synaptic degeneration, we measured the density of proteins located in synapses (Figure 5). Levels of synaptophysin were not significantly impacted by HFD exposure in any of the brain regions investigated (hippocampus F = 2.4, P = 0.112; cortex F = 1.5, P = 0.250; hypothalamus F = 0.4, P = 0.661), although one may notice a tendency for reduced synaptophysin content in the hippocampus of HFD mice relative to controls (P = 0.054 and P = 0.090 for 45% and 60%-fat versus controls, respectively). Also levels of syntaxin-1 were similar across experimental groups in the hippocampus (F = 0.9, P = 0.414), cortex (F = 1.8, P = 0.240) and hypothalamus (F = 0.3, P = 0.764). The synaptosomal-associated protein SNAP-25 was modified in the hippocampus of HFD-exposed mice (F = 6.8, P = 0.029), but not in the cortex or hypothalamus. In particular, SNAP-25 in the hippocampus on mice the fed 60%-fat diet was reduced by 25 ± 8% (P = 0.021) when compared to controls and by 26 ± 8% (P = 0.017) when compared to 45%-fat fed mice. Levels of syntaxin-4, which is another protein of the exocytosis machinery of nerve terminals but mainly occurring in processes of astrocytes (Tao-Cheng et al., 2015), were reduced in the hippocampus (F = 9.2, P = 0.002) but not cortex (F = 0.1, P = 0.932) or hypothalamus (F = 0.1, P = 0.887). In particular, when compared to controls, syntaxin-4 in the hippocampus was reduced by 19 ± 5% (P = 0.011) and 27 ± 7% (P < 0.001) in mice fed 45%-fat and 60%-fat diets, respectively.
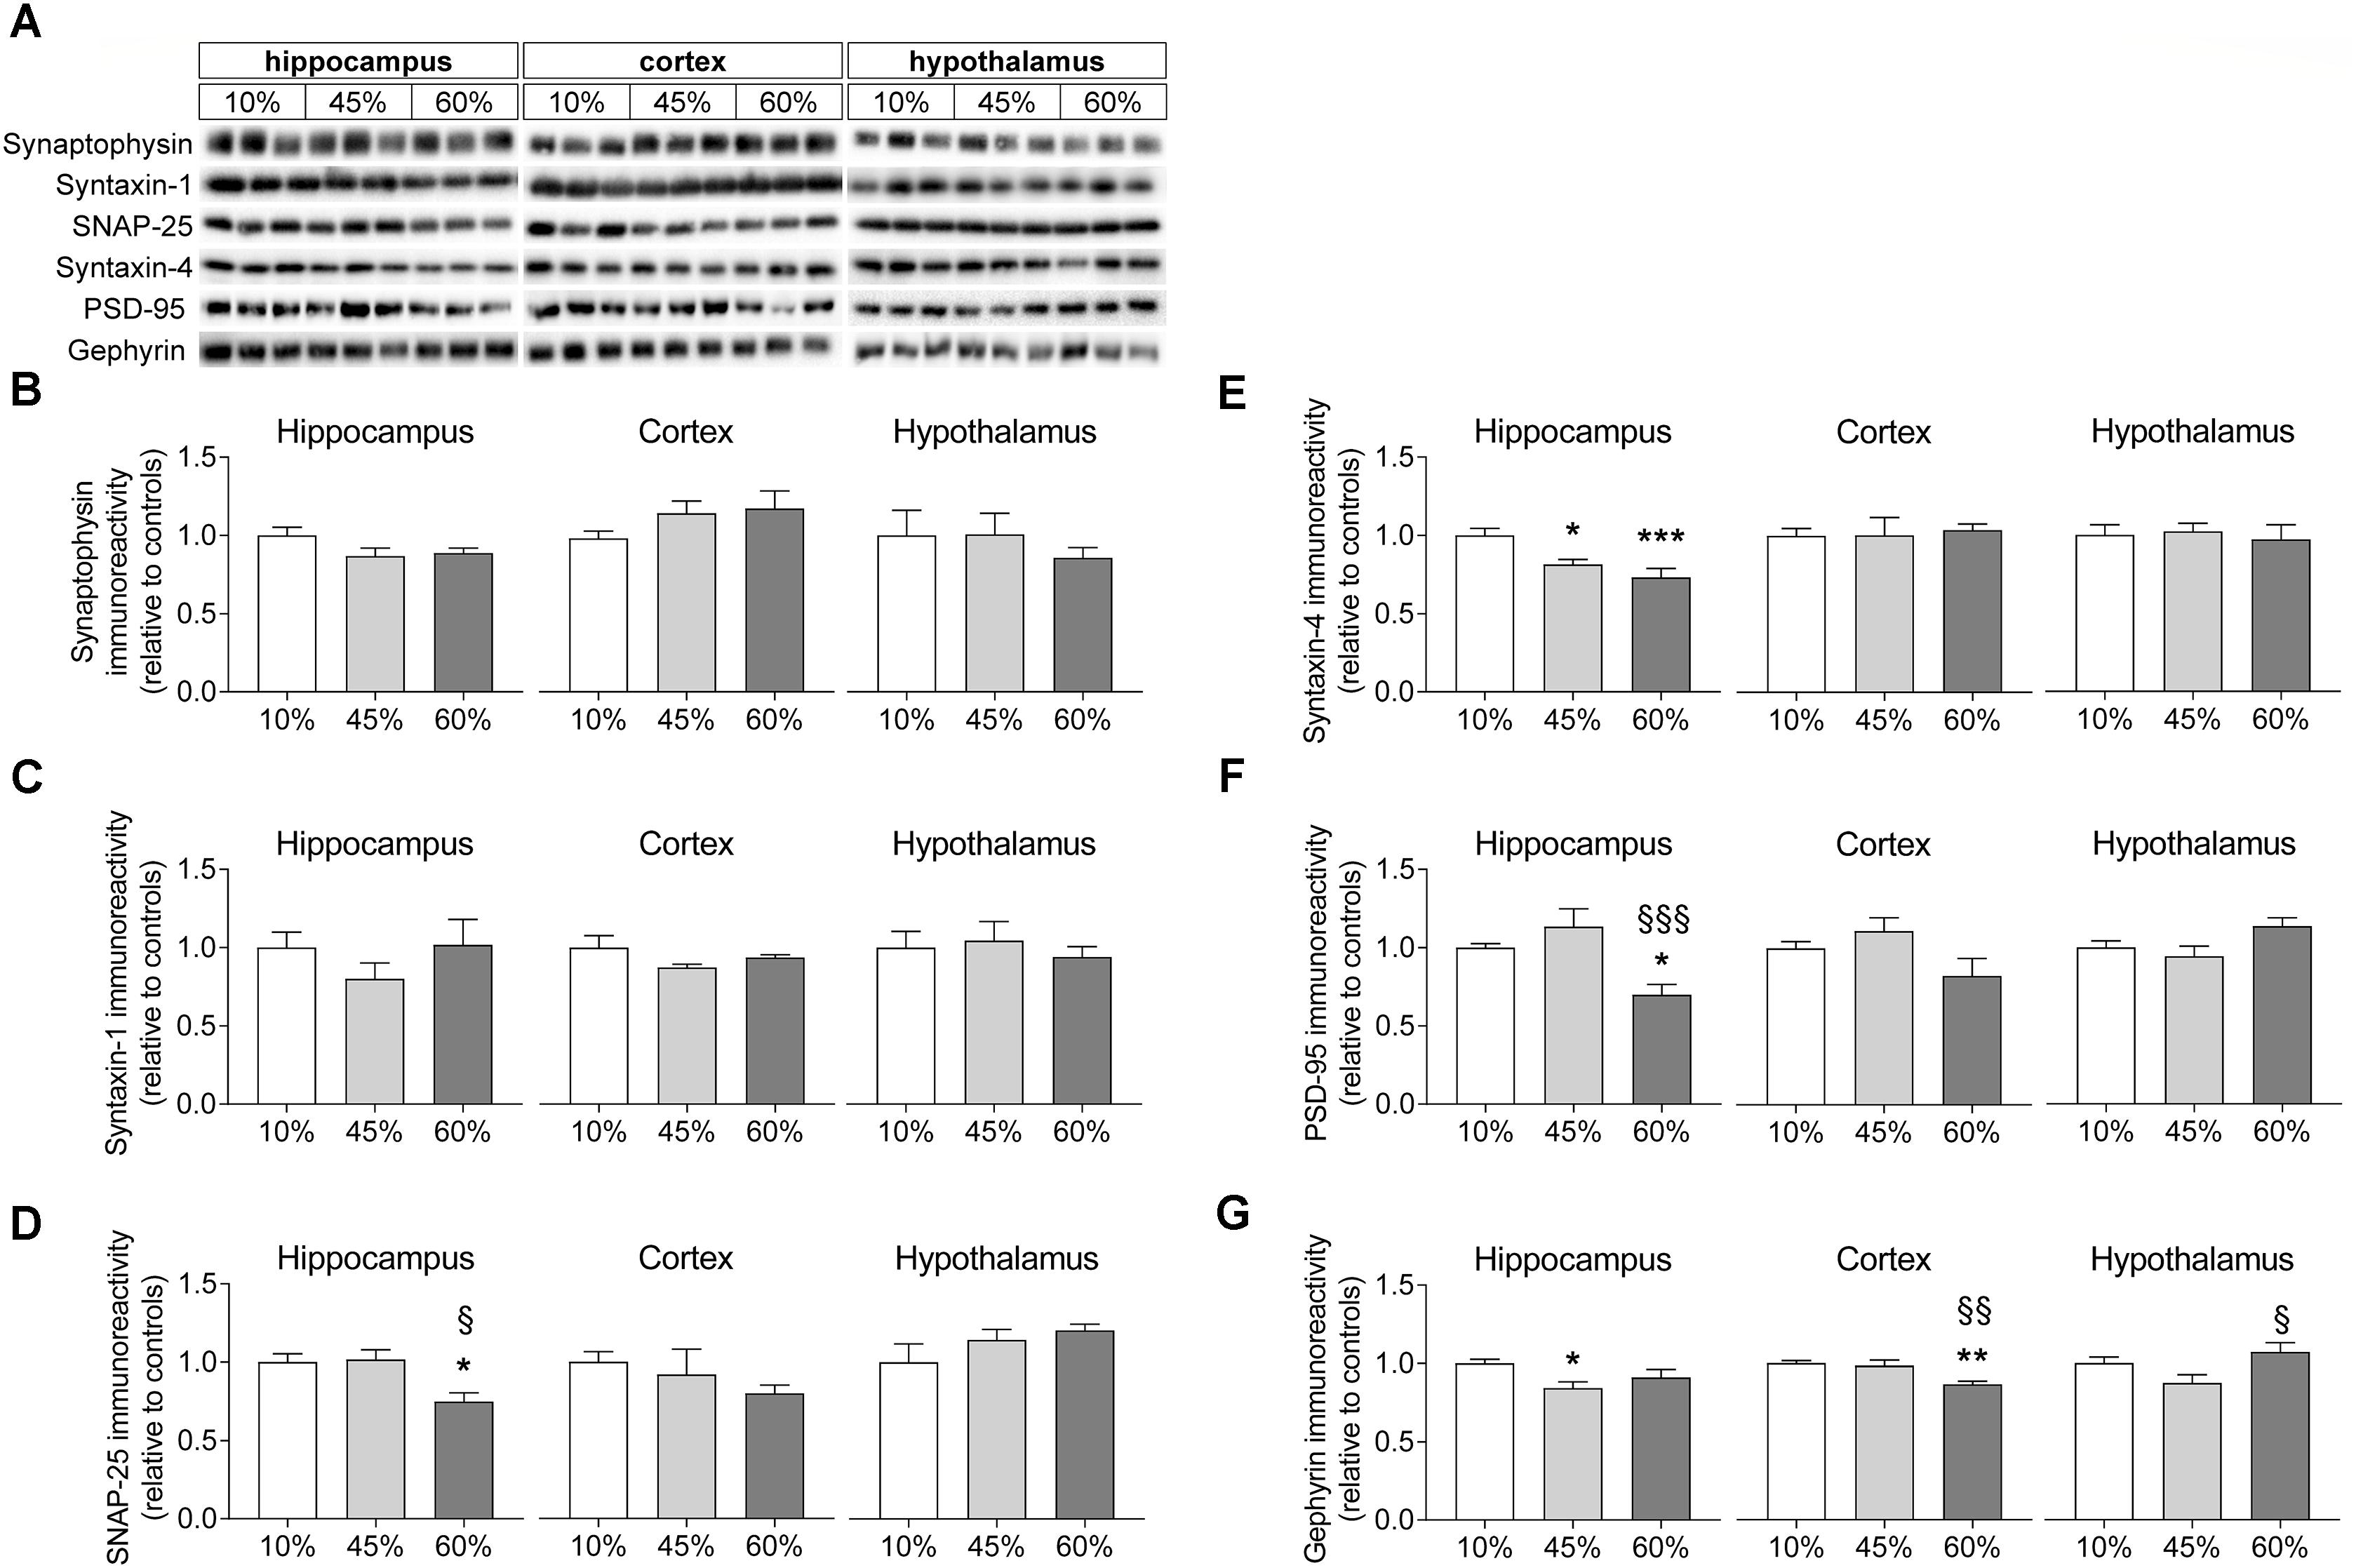
Figure 5. HFD-induced changes on levels of synaptic proteins. (A) Shows typical Western blot of synaptophysin (B), syntaxin-1 (C), SNAP-25 (D), syntaxin-4 (E), PSD-95 (F), and gephyrin (G). Samples from three mice of each group were loaded in SDS-PAGE gels (2 μg of protein of syntaxin-1 and synaptophysin, 5 μg of protein for the remaining proteins). Measured immunoreactivity was normalized to the average of the three controls (10%-fat group, white bar) to allow pooling data from different gels. Data are mean ± SEM of n = 6. Symbols indicate significant differences in LSD tests after significant ANOVA, comparing HFD fed mice (45% fat or 60%-fat) and controls (10%-fat; ∗P < 0.05, ∗∗P < 0.01; ∗∗∗P < 0.001), or the diets containing 45% and 60% fat (§ P < 0.05, §§ P < 0.01).
Proteins from the post-synaptic region of synapses were also modified by HFD feeding. Diet impacted the postsynaptic density protein PSD-95 levels in the hippocampus (F = 8.1, P = 0.002) but not cortex (F = 2.9, P = 0.076) or hypothalamus (F = 3.3, P = 0.067). PSD-95 levels were reduced in the hippocampus of mice fed the 60%-fat diet by 30 ± 7% (P = 0.012) when compared to controls, and by 38 ± 13% (P < 0.001) when compared to mice fed the 45%-fat diet. Levels of gephyrin, another protein from the post-synaptic zone, varied with the amount of fat in the diet in the hippocampus (F = 3.8, P = 0.044), cortex (F = 8.8, P = 0.003) and hypothalamus (F = 3.9, F = 0.035). Compared to controls, the 45%-fat diet caused a significant reduction of gephyrin levels in the hippocampus (-16 ± 5%, P = 0.014). In the cortex, 60%-fat diet mice showed reduced gephyrin relative to the other groups (-13 ± 3%, P = 0.002 vs. controls; -12 ± 4%, P = 0.004 vs. 45%-fat diet). In the hypothalamus there was a reduction of -18 ± 8% in gephyrin levels in mice fed 45%-fat diet versus 60%-fat diet (P = 0.011).
We further measured the relative levels of vesicular glutamate and GABA transporters (vGluT1/2 and vGAT; Figure 6). The amount of fat in the diet was associated with a reduction of vGluT1 levels in the mouse hippocampus (F = 7.9, P = 0.005) and hypothalamus (F = 4.3, P = 0.033) but not in the cortex (F = 1.5, P = 0.297). In the hippocampus, both 45%-fat and 60%-fat fed mice showed significantly reduced vGluT1 levels when compared to controls (-38 ± 9%, P = 0.001 for 45%-fat diet; -22 ± 7%, P = 0.032 for 60%-fat diet). The same was observed in the hypothalamus (-39 ± 14%, P = 0.015 for 45%-fat diet; -32 ± 16%, P = 0.039 for 60%-fat diet). HFD exposure impacted levels of vGluT2 in the mouse cortex (F = 10.3, P = 0.001) and hypothalamus (F = 3.9, P = 0.043) but not in the hippocampus (F = 0.3, P = 0.748). In the cortex, mice fed 60%-fat diet showed increased cortical vGluT2 relative to the other groups (+25 ± 6%, P < 0.001 vs. controls; +24 ± 7%, P = 0.001 vs. 45%-fat diet). In the hypothalamus, we observed a significant reduction of vGluT2 levels in mice fed 45%-fat diet (-28 ± 8%, P = 0.014 vs. controls). Levels of vGAT were affected by HFD exposure in the hippocampus (F = 3.6, P = 0.044) and hypothalamus (F = 3.6, P = 0.049). The hippocampus of mice exposed to both 45%-fat and 60%-fat diet showed less vGAT levels than controls (-25 ± 9%, P = 0.024 for 45%-fat diet; -22 ± 10%, P = 0.042 for 60%-fat diet). In the hypothalamus, the reduction of vGAT was significant only in mice exposed to 45%-fat diet (-25 ± 10%, P = 0.018 vs. controls).
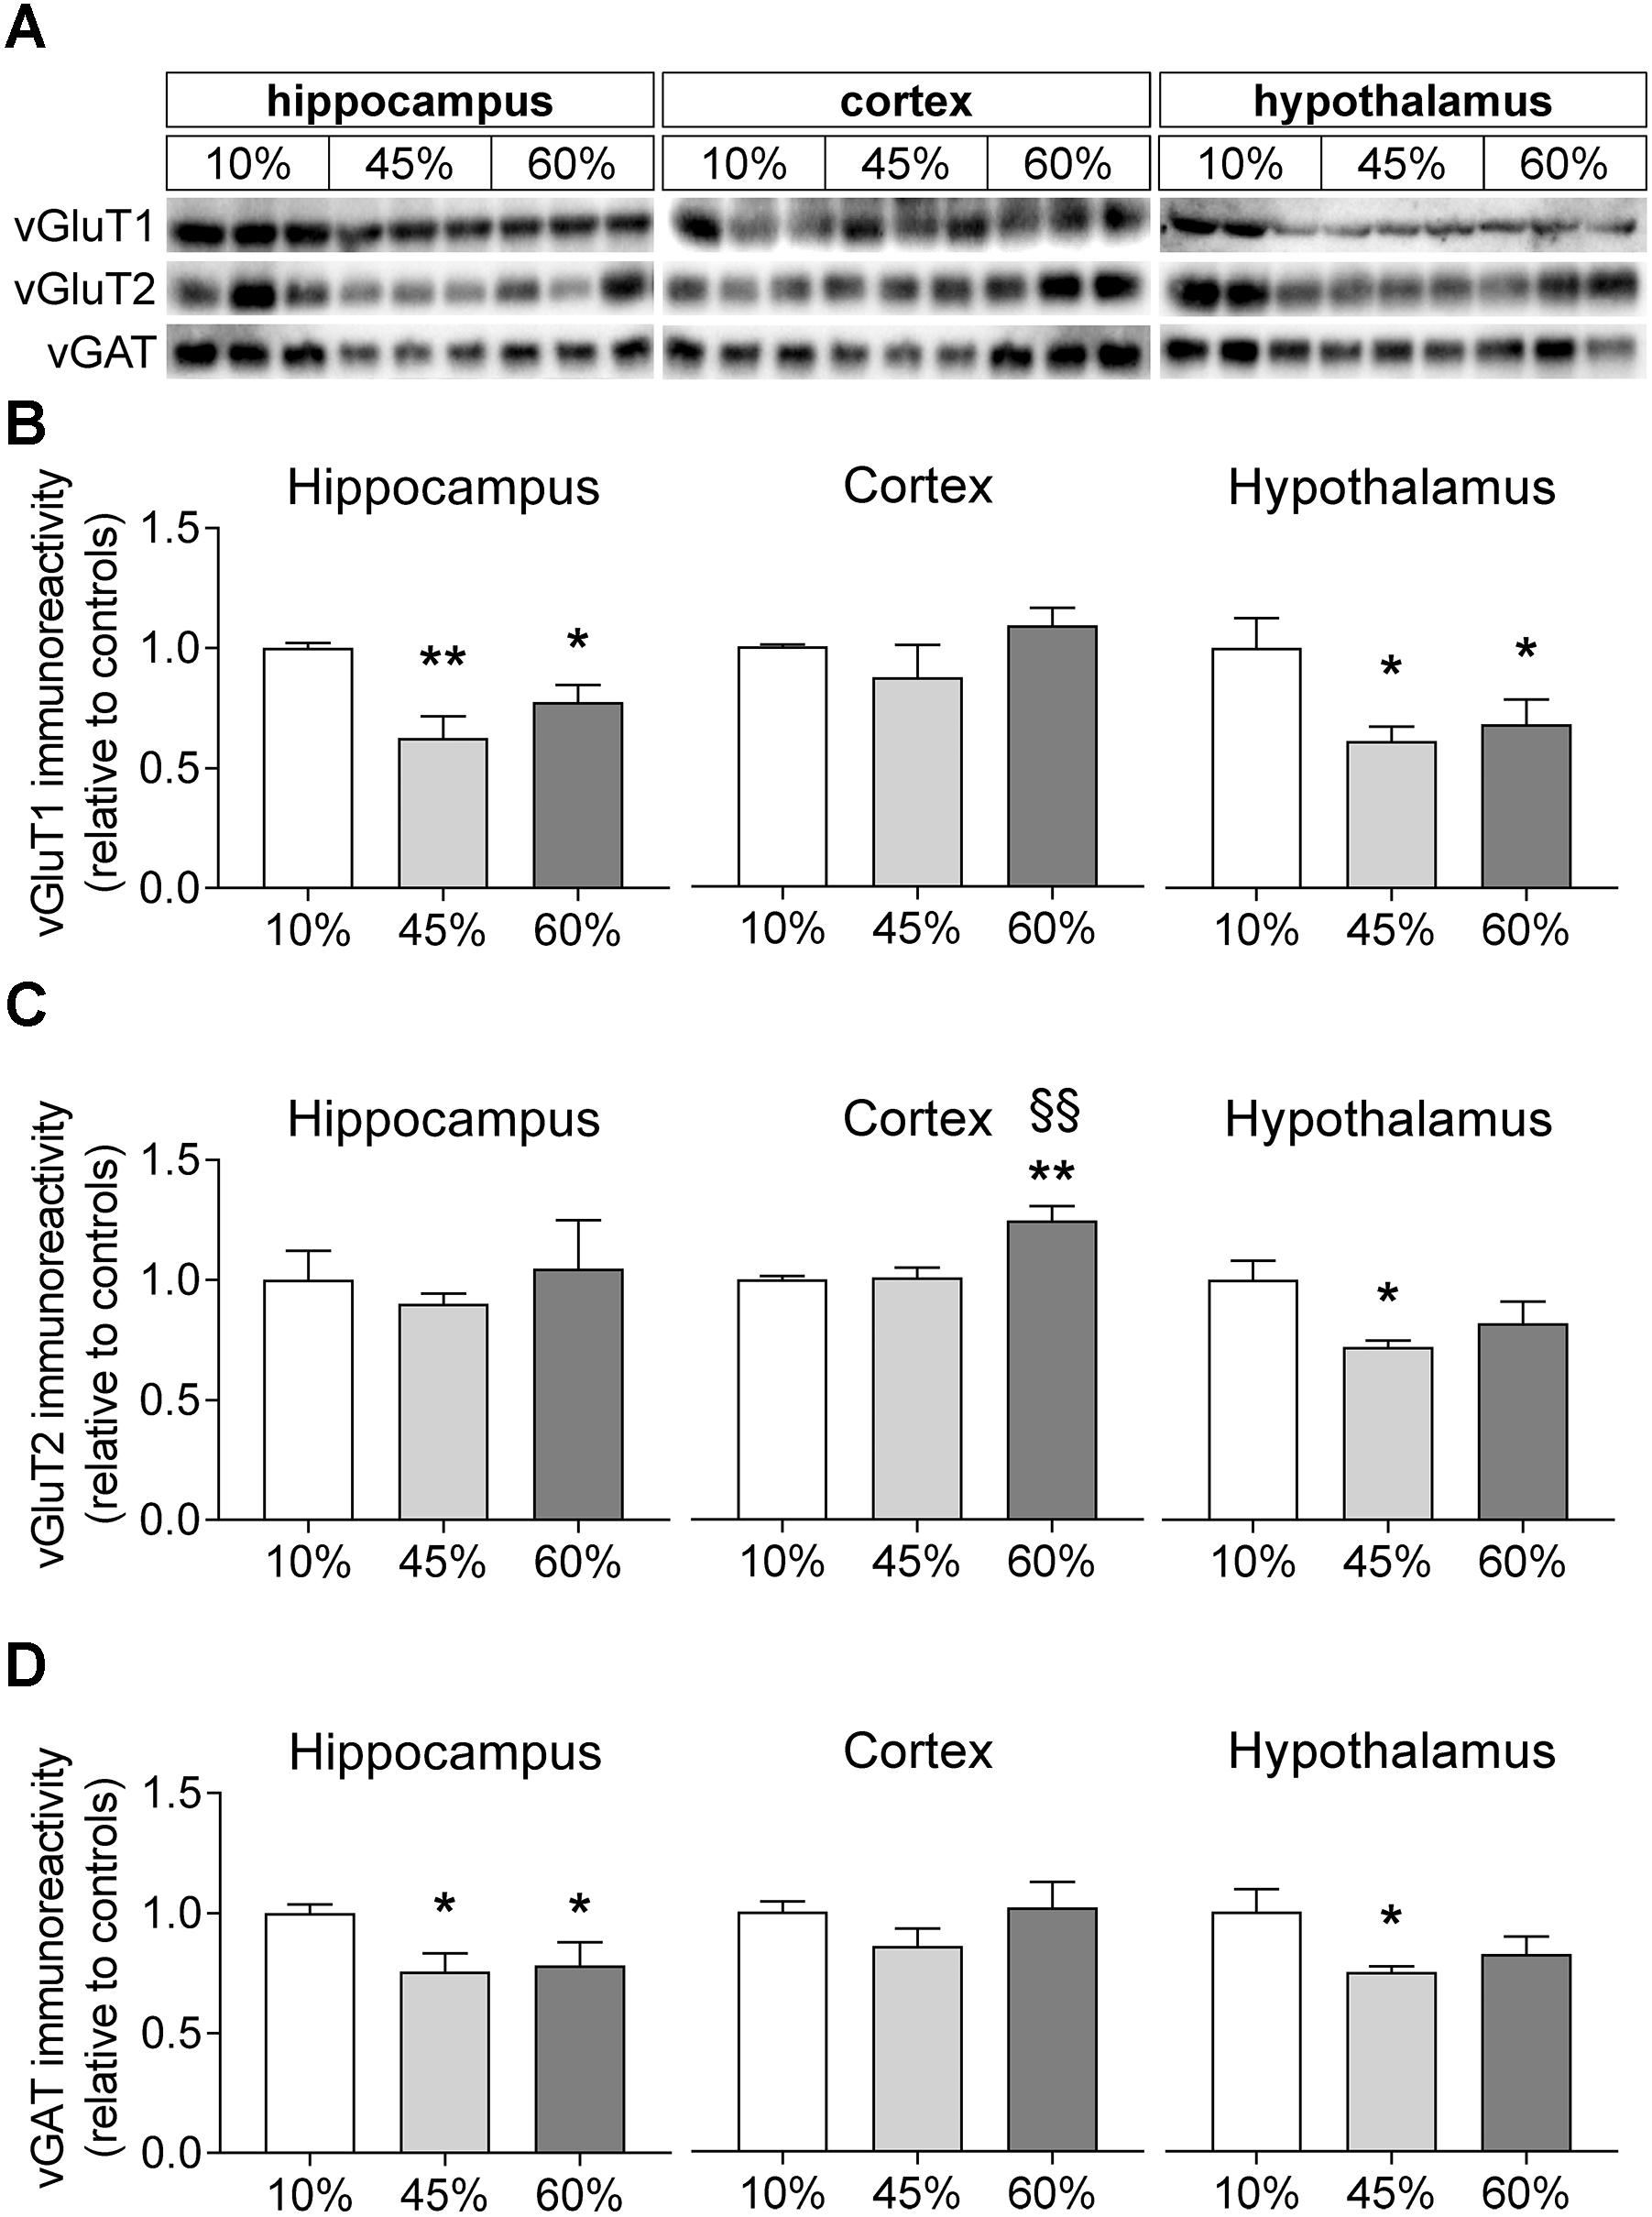
Figure 6. HFD-induced changes on levels of vesicular glutamate and GABA transporters. (A) Shows representative Western blots of vGluT1 (B), vGluT2 (C), and vGAT (D). Samples from three mice of each group were loaded in SDS-PAGE gels (20 μg of protein). Measured immunoreactivity was normalized to the average of the three controls (10%-fat group, white bar) to allow pooling data from different gels. Data are mean ± SEM of n = 6. Symbols indicate significant differences in LSD tests after significant ANOVA, comparing HFD fed mice (45% fat or 60%-fat) and controls (10%-fat; ∗P < 0.05, ∗∗P < 0.01), or the diets containing 45% and 60% fat (§§ P < 0.01).
Gliosis Markers
To infer on the modification of glial compartments, we measured the levels of glia-specific proteins (Figure 7). The glial fibrillary acidic protein (GFAP) that is specific to astrocytes was modified by fat levels in the diet in the hypothalamus (F = 7.8, P = 0.005), but not in the hippocampus (F = 1.6, P = 0.235) and cortex (F = 2.6, P = 0.155). Relative to controls, the hypothalamus of mice exposed to 45%-fat diet displayed a 38 ± 7% increase of GFAP immunoreactivity (P = 0.003), and a similar increase was observed for mice on the 60%-fat diet (+35 ± 12%, P = 0.005). Also the ionized calcium-binding adapter molecule 1 (iba-1), a protein present in microglial cells, showed increased levels in the hypothalamus (F = 3.5, P = 0.045), but not in the hippocampus (F = 1.1, P = 0.352) and cortex (F = 1.1, P = 0.360). In particular, there was a 31 ± 10% increase of iba-1 immunoreactivity in the hypothalamus of mice exposed to 60%-fat diet compared to controls (P = 0.014).
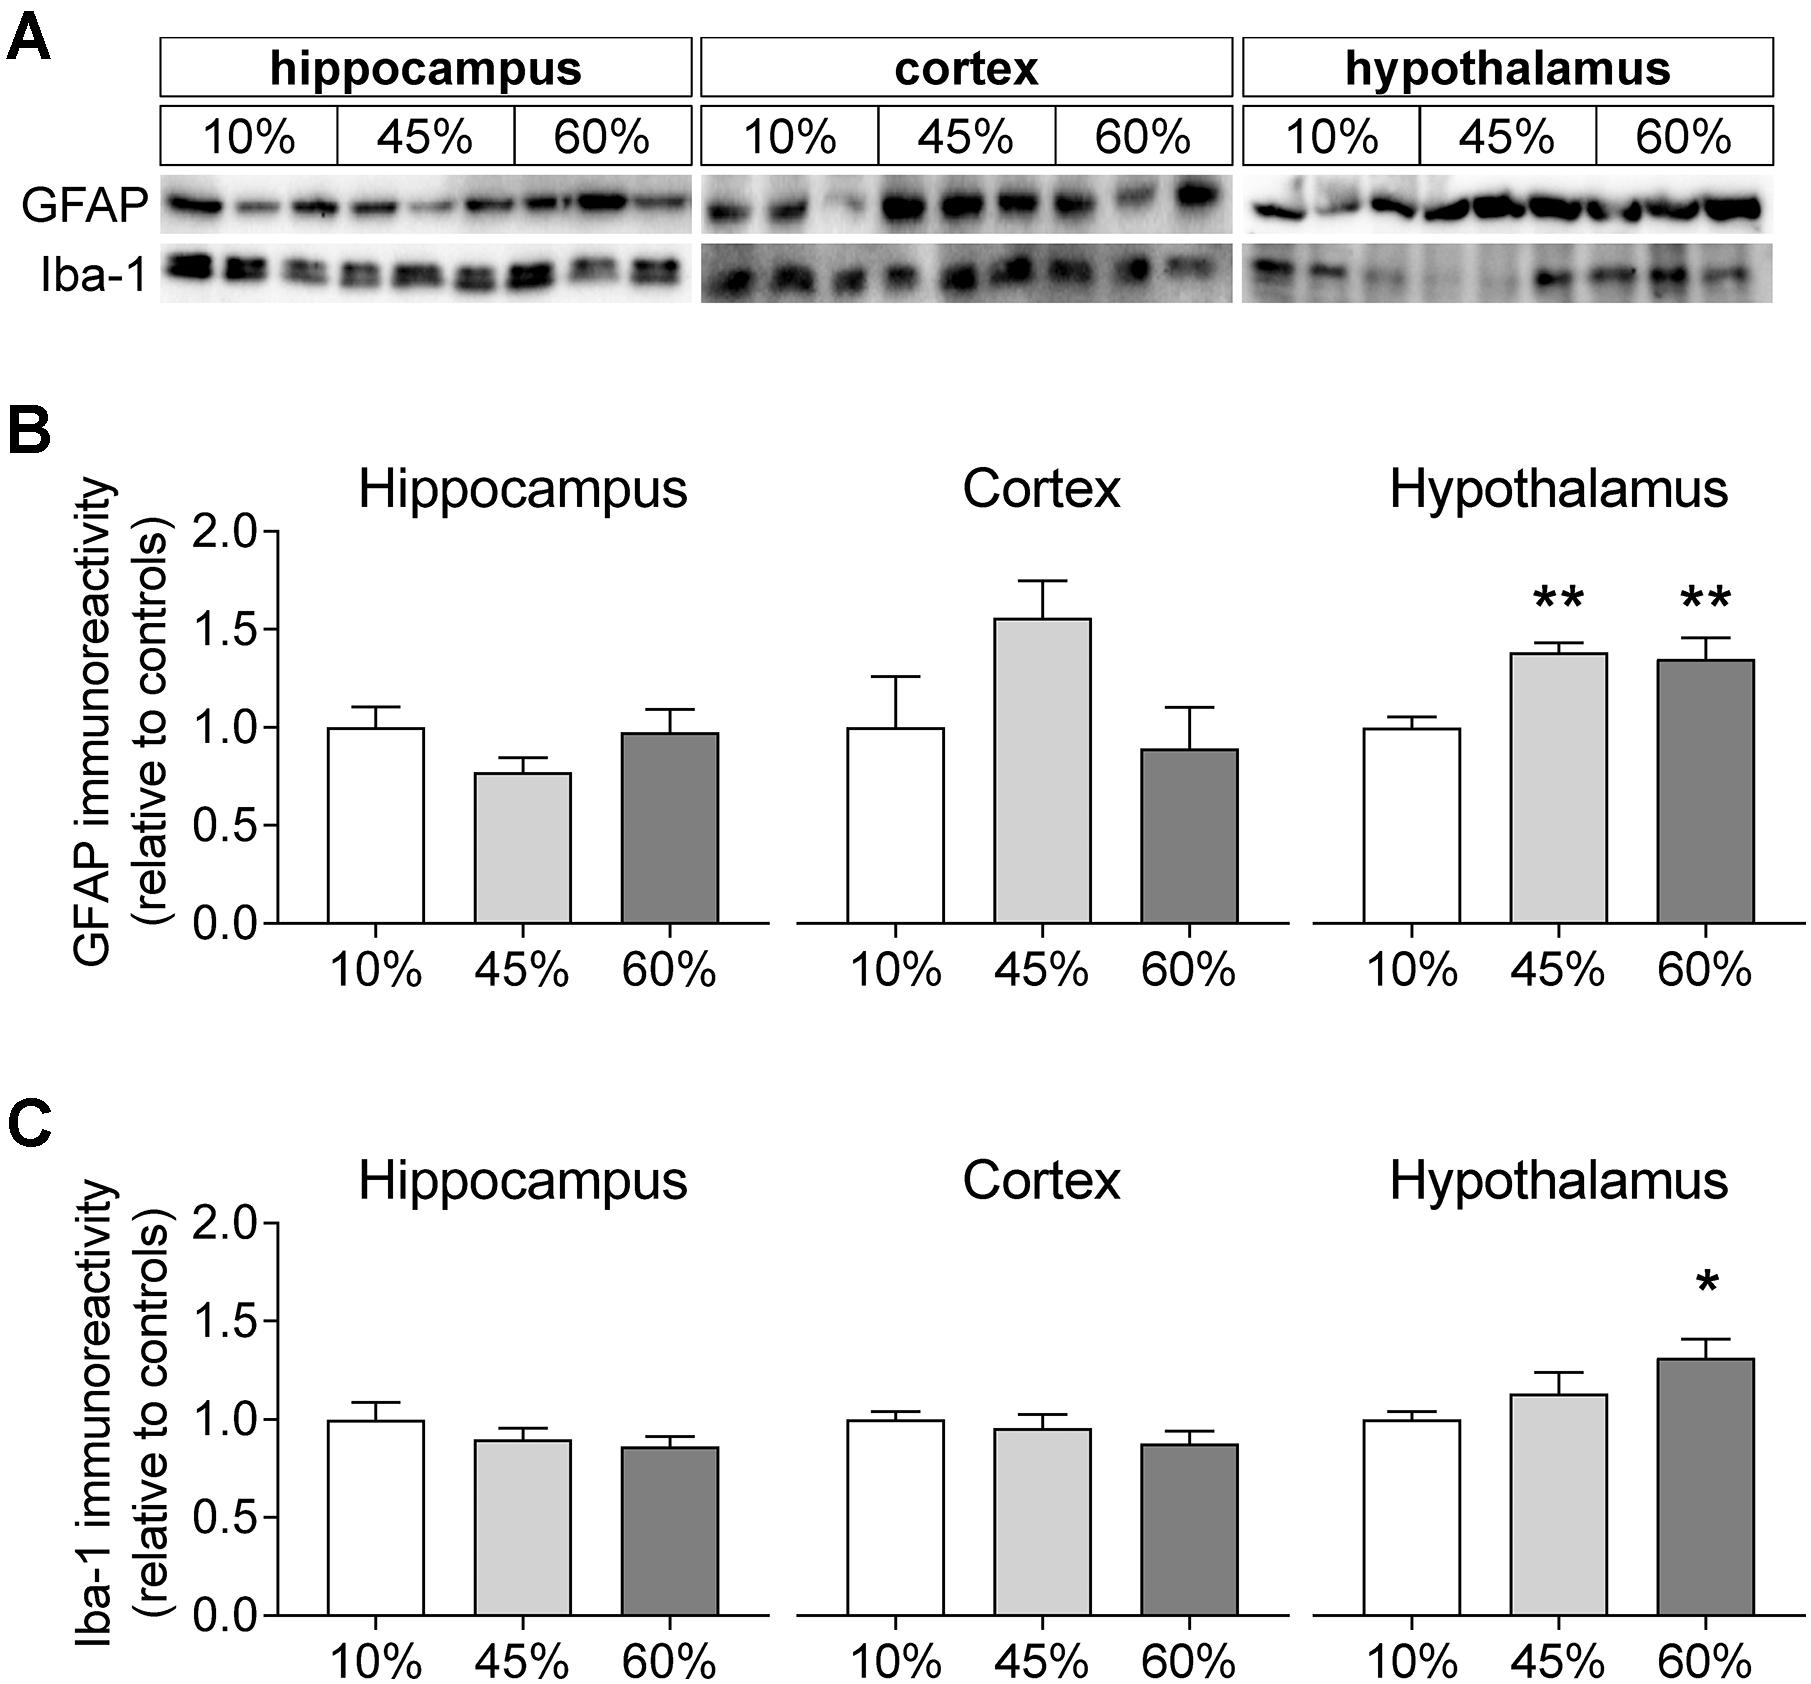
Figure 7. HFD-induced changes on levels of glia-specific proteins. (A) Shows typical Western blot of GFAP (B) and Iba-1 (C). Samples from three mice of each group were loaded in SDS-PAGE gels (20 μg of protein). Measured immunoreactivity was normalized to the average of the three controls (10%-fat group, white bar) to allow pooling data from different gels. Data are mean ± SEM of n = 6. Symbols indicate significant differences in LSD tests after significant ANOVA, comparing HFD fed mice (45% fat or 60%-fat) and controls (10%-fat; ∗P < 0.05, ∗∗P < 0.01). No significant differences were observed between the two HFD groups.
Discussion
The present results show that mice chronically exposed to a lard-based HFD develop glucose intolerance associated to reduced insulin sensitivity, impaired hippocampal-dependent spatial memory, and neurochemical alterations in the hippocampus, cortex and hypothalamus. While metabolic profiles of the hippocampus, cortex and hypothalamus were modified in mice fed 60%-fat but not 45%-fat diet, when compared to controls, memory dysfunction was observed in both HFD groups. Accordingly, levels of proteins required for adequate synaptic function were found modified in mice fed diets containing fat at either 45% or 60%, relative to controls. This indicates that synaptic dysfunction may occur in the brain upon diet-induced obesity in the absence of major changes of metabolite concentrations. Nevertheless, this does not exclude the presence of alterations in the rate of certain metabolic pathways.
Modifications of Energy Metabolism
A general reduction of the phosphocreatine-to-creatine ratio was prominent in 60%-fat fed mice, when compared to the other groups, which suggests a disruption of mechanisms regulating metabolism and maintaining the cellular energy status in the brain. HFD exposure resulted in changes of glucose concentration in the hippocampus and cortex that were parallel to the changes in fed glycemia. However, this was not observed in the hypothalamus, where glucose levels were similar in all diets tested. This suggests that glucose transport and metabolism is differently adapted to the mild hyperglycemia state of 60%-fat fed mice, likely related to the glucose-sensing ability of the hypothalamus. In line with this, the hypothalamus of mice exposed to 60%-fat, but not the hippocampus and cortex, displayed higher levels of lactate than the other experimental groups. The measurement of basal metabolite concentrations, however, does not provide insight into metabolic pathways, namely glycolysis and tricarboxylic acid cycle. By employing 13C MRS with 13C-labeled glucose we have previously demonstrated that energy metabolism is altered in the hypothalamus upon high-fat feeding (Lizarbe et al., 2018). Modifications of brain energy metabolism were reported in rats fed a fat-rich diet for 3 weeks, namely reduced glucose utilization and increased astrocytic metabolism (Melø et al., 2006). Recently, we also reported that a rat model of lean T2D, the Goto-Kakizaki rat, displays impaired neuronal oxidative metabolism and reduced glutamate-glutamine cycle rate, as well as exacerbated oxidative metabolism in astrocytes (Girault et al., 2018). The relative contributions of fatty acids and glucose as available brain energy substrates, and of neurodegeneration-associated metabolic changes to brain energy dysfunction deserve further investigation. Previous experiments suggest that HFD exposure increases the utilization of fat in detriment of glucose oxidation, at least in the hypothalamus (Lizarbe et al., 2018). This observation, together with the present findings of higher lactate and lower glucose concentrations, leads us to speculate that long-term HFD exposure results in increased glycolysis in for lactate production while other available substrates, such as fats, are metabolized in the tricarboxylic acid cycle.
Osmolarity Regulation
Changes of the phosphocreatine-to-creatine ratio were due to increases in the creatine concentration rather than decreases of phosphocreatine (see Figures 4A–C), which is in line with the relevance of creatine levels for osmolarity regulation. Osmolarity control in the brain is considered to occur via the concentrations of not only creatine but also taurine and myo-inositol, since hyper-osmolarity causes their accumulation (Gullans and Verbalis, 1993). Also N-acetylaspartate, which is present in large concentrations in neurons, has been proposed to act as a brain osmolyte (Taylor et al., 1994; Gotoh et al., 1997), and is effectively released to the interstitial space upon osmotic challenges (Sager et al., 1997; Bothwell et al., 2001). Accordingly, taurine and N-acetylaspartate in the hippocampus, and myo-inositol in the hypothalamus were also increased upon exposure to 60% but not 45% fat in the diet. It should be noted that these modifications in brain osmolytes follow the plasma glucose concentration in the fed state, as well as corticosterone levels, which were significantly higher in 60%-fat fed mice than the other groups. Indeed, in addition to chronic hyperglycemia, it cannot be excluded that glucocorticoid-mediated signaling plays a role in diabetes-induced impaired brain metabolism and function (discussed in Girault et al., 2018).
Metabolic Indications of Neurodegeneration
N-Acetylaspartate reductions are often associated to impaired mitochondrial integrity in neurons, as well as lipid and myelin biosynthesis (Duarte et al., 2012b). Metabolism of N-acetylaspartate is compartmentalized between neurons and oligodendrocytes and serves for myelination. N-acetylaspartate is mainly stored in neurons, being synthesized from mitochondrial acetyl-CoA and Asp (Baslow, 2003), and its de-acetylation occurs in oligodendrocytes (Kirmani et al., 2002), where it can replenish both acetyl-CoA and oxaloacetate (through aspartate) pools providing carbon skeletons for both energy production and local lipid synthesis, required in the myelination process. In line with this role of N-acetylaspartate, Canavan disease is characterized by accumulation of N-acetylaspartate due to impaired de-acetylation in oligodendrocytes, which is associated to defects in myelin synthesis and deposition (Chakraborty et al., 2001). Indeed, it was recently suggested that high-fat feeding has an impact on myelination, namely by promoting the loss of oligodendrocyte progenitor cells and mature oligodendrocytes (Yoon et al., 2016).
A significant increase of hippocampal glutathione levels was observed in the 60%-fat group relative to controls, while there was a tendency for reduced glutathione levels in the cortex. It should be noted that the levels of glutathione measured by MRS include both reduced and oxidized forms, which are not distinguishable. Although lower ratio of reduced-to-oxidized glutathione has been reported in short-term HFD feeding (e.g., Alzoubi et al., 2018), no change of brain levels of oxidized and reduced glutathione, or their ratio upon long-term HFD exposure (Li et al., 2013). It should be noted however that Li et al. (2013) reported a non-significant increase of 15–20% of hippocampal reduced glutathione in high- versus low-fat-fed mice, in line with the present observation. It is likely that a total glutathione increase in the hippocampus might reflect a compensatory mechanism to oxidative stress upon chronic HFD exposure. In fact, the brain of HFD-fed mice displays impaired redox homeostasis, including: (1) enhanced activity of enzymes that generate free radicals, such as xanthine oxidase or NADPH oxidase; (2) reduced activity of enzymes with antioxidant action, namely glutathione peroxidase and catalase; (3) increased concentration of free radicals; (4) and oxidative damage to lipids and proteins (e.g., Morrison et al., 2010; Li et al., 2013; Charradi et al., 2017; Liu et al., 2017; Alzoubi et al., 2018; Maciejczyk et al., 2018). Accordingly, the hippocampus of mice fed a 60%-fat diet for 4 months also shows impaired signaling mediated by the transcription factor NRF2 which protects against brain oxidative damage (Morrison et al., 2010). Namely, Morrison et al. (2010) reported HFD-induced reductions of NRF2 protein levels, NRF2-DNA binding activity, and levels of the NRF2 responsive proteins in the hippocampus.
Interestingly, impaired cellular redox regulation in the brain has been proposed to impact oligodendrocyte proliferation (consistent with increased levels of N-acetylaspartate, discussed above), which has implications on the maintenance of myelin sheets around axons, and thus brain connectivity (see Corcoba et al., 2016 and references there in).
The content of total choline was significantly higher in hippocampus and hypothalamus, but not cortex. The main contributors to the choline peaks in MRS are the water-soluble glycerophosphorylcholine and phosphorylcholine, which are involved in membrane lipid metabolism (Duarte et al., 2012b). Namely, it is precursor of phosphatidylcholine and, in turn, of sphingomyelin, which is necessary for adequate myelination of axons (Oshida et al., 2003), and is implicated in immune responses (Li et al., 2015). In contrast to phosphorylcholine, a HDF-induced reduction of phosphorylethanolamine concentration was observed in the cortex. It is interesting to note that besides these changes in the concentration of phosphorylethanolamine in the cortex, no other significant metabolic alterations were observed between mice fed the diet containing 45% of fat and those in the control group. Altogether, these results point to alterations on phospholipid metabolism with possible implications on plasma membrane permeability, maintenance of action potentials and conduction of electric impulses, and on events that involve membrane deformation, fusion and fission, such as transcellular signaling, vesicular release of neurotransmitters, gliotransmitters or neuromodulators, mitochondrial dynamics, and autophagy (Aureli et al., 2015; Krols et al., 2016; Lauwers et al., 2016; van Echten-Deckert and Alam, 2018). In addition, lipid metabolism is important for membrane reorganization of astrocytes and microglia in neuroinflammation, which have been proposed to be reflected on MRS-detected changes of choline-containing compounds (discussed in Duarte et al., 2012b). In our study, total choline increased with HFD in the hippocampus and hypothalamus, while increased levels of GFAP and Iba-1, which are signs of inflammation, were exclusively observed in the hypothalamus. These results support the notion that MRS markers do not distinguish neuroinflammation from neurodegeneration and other processes (Zahr et al., 2014; Pardon et al., 2016).
Taurine is an amino acid that, although it is present at 1 μmol/g in the human brain, it reaches relatively large concentrations in the rodent brain (above 5 μmol/g in rats and above 8 μmol/g in mice; Duarte, 2016), thus playing a major role as osmolyte (Duarte et al., 2009 and references therein). Taurine is released from both neurons and glial cells (Hada et al., 1998), and acts as an agonist at receptors of the GABAergic and glycinergic neurotransmission systems (Albrecht and Schousboe, 2005). In the present study, HFD exposure caused a reduction of proteins associated to inhibitory neurotransmission (gephyrin and vGAT), suggesting that increased taurine might be a compensatory mechanism for the loss of inhibitory tone. Moreover, taurine is transported into the mitochondrial matrix where it buffers pH to the optimal value for isocitrate dehydrogenase, which is one of the key enzymes of the tricarboxylic acid cycle regulating energy metabolism and oxidative phosphorylation, contributes to stabilize the pH gradient across the inner-membrane, and thus helps preserving mitochondrial function and preventing oxidative damage (Hansen et al., 2010). Therefore, this HFD-induced increase of taurine levels in the is likely a beneficial adaptation of the brain.
Microgliosis and Astrogliosis
Increased levels of myo-inositol have been suggested to represent astrogliosis in the neurodegeneration-associated inflammatory process (discussed in Duarte et al., 2012b). The HFD-associated increased myo-inositol of the present study was exclusive to the hypothalamus. Interestingly, the hypothalamus was also the sole brain region to show significantly HFD-associated increased levels of glial specific proteins, namely GFAP and Iba-1 that are present in astrocytes and microglia, respectively. This overexpression of GFAP and Iba-1 is thus indicative of HFD-associated hyper-reactivity of astrocytes (astrogliosis) and microglia (microgliosis), as we reported recently (Lizarbe et al., 2018). Brain disorders are accompanied by neuroinflammation with astrogliosis and microgliosis generally in response to damage of nearby neuronal processes, but gliosis might become deleterious for the neurons upon chronicity (López-Valdés and Martínez-Coria, 2016). A transient increase in levels of pro-inflammatory cytokines was observed in the hypothalamus within 1–3 days of HFD exposure (e.g., Thaler et al., 2012; Waise et al., 2015), which might constitute a protective or reparative inflammatory process. In contrast, the hypothalamic gliosis in chronic HFD exposure (present study) is likely neurotoxic and has been suggested to participate in the genesis of obesity-associated diabetes since it may cause alterations of food intake, energy expenditure, insulin secretion, hepatic glucose production and metabolism of glucose and fats (Rahman et al., 2018).
The hippocampus and cortex of HFD-exposed mice did not show signs of gliosis, when compared to controls (no significant increase in levels of myo-inositol, GFAP or Iba-1). Despite the general consensus that neuroinflammation and astrogliosis occur in insulin resistance and T2D (Saravia et al., 2002; Baydas et al., 2003; Duarte et al., 2009, 2012a; Calvo-Ochoa et al., 2014), conflicting results have been reported regarding astrogliosis in memory-related brain areas upon HFD exposure. This is likely due to the distinct study designs, diet compositions, fat origin, age and/or species. Recent studies do not find HFD-induced increased levels of GFAP in the rat hippocampus (Raider et al., 2016; Ribeiro et al., 2018). In contrast, Tarantini et al. found that mice exposed to a 60%-fat diet from 3 to 8 months of age show mild behavior deficits and neuroinflammation, which are exacerbated by exposure to a cellular stress induced by deletion of the transcription factor nrf2 that regulates the expression of antioxidant proteins, thus protecting against oxidative damage (Tarantini et al., 2018). A particularly interesting study by Tsai et al. (2018) found that GFAP levels increase in the hippocampus of mice exposed to 60%-fat diet for 3 months, relative to controls, and that HFD consumption leads to a reduction of the length and ramification of astrocytic processes in the CA1 and CA3 regions but not the dentate gyrus of the hippocampus. This retraction of astrocytic processes is of importance for the metabolic support that astrocytes should provide to neurons and their synapses (Sonnay et al., 2017), and in fact Tsai et al. (2018) also reported that HFD reduced levels of the astrocytic glutamate carriers GLT-1 and GLAST in the hippocampus, without changes of glutamine synthase levels. Soontornniyomkij et al. (2016) also found that 5 months of HFD exposure does not change levels of glutamine synthetase in the hippocampus of 5-month-old mice, although HFD increases the density of this protein in aged mice. Altogether, these observations suggest impaired glutamate-glutamine cycle rate that, in turn, may result in glutamatergic dysfunction and consequent accumulation of glutamine in astrocytes. Consistent with impaired glutamate release, we observed reduced levels of vesicular glutamate transporters, mainly vGluT1. However, care should be taken when interpreting changes on levels of carriers and enzymes because they may not reflect changes of their activity in the brain in vivo.
Moreover, as mentioned above, observations from different diet-induced obesity studies should be compared with caution. For example, in contrast to the reduced levels of glutamate carriers caused by a 60% HFD (Tsai et al., 2018), hippocampal slices prepared from mice fed a 45%-fat diet for only 2 months displayed enhanced glutamate uptake, increased density of glutamate carriers and reduced levels of the glutamate degrading enzymes glutamine synthetase and GABA-decarboxylase, compared to slices from controls (Valladolid-Acebes et al., 2012). Based on our results, we believe that the exposure to diets containing fat at 45% or 60% elicits different degenerative processes rather than resulting from a simple dose-response phenotype.
Glutamine synthesis takes place in astrocytes (Sonnay et al., 2017). In our study, HFD caused indeed an increase of glutamine levels in the 60%-fat group (but not the 45%-fat) relative to controls, which was particularly significant in the hippocampus. In line with our observations, increased hippocampal glutamine-to-creatine ratio was recently reported in Wistar rats exposed to a 60%-diet from 8 to 12 months of age (Ribeiro et al., 2018). In young adult Fisher 344 rats under a 60%-fat diet for 5 months, Raider et al. (2016) also observed a tendency for higher hippocampal glutamine concentration, and a significantly increased glutamine-to-glutamate ratio, relative to controls. This study, however, reported lower levels of myo-inositol and creatine in high versus low fat-fed rats (Raider et al., 2016), contrasting to the findings of the present study (discussed above).
Dysfunction in Excitatory and Inhibitory Synapses
N-Acetylaspartylglutamate (NAAG) levels increased in the cortex and hippocampus with HFD exposure. Similar NAAG changes were observed in HFD-exposed rats (Raider et al., 2016). NAAG is synthetized from ATP-dependent condensation of N-acetylaspartate and glutamate in neurons, packed into synaptic vesicles of presynaptic terminals, including those of pyramidal neurons in the cortex and limbic system, is co-released with glutamate, and acts as an antagonist of the glycine site of the NMDA receptor (Duarte and Xin, 2018 and referenced therein). Importantly, NAAG also acts on the metabotropic type II glutamate receptor mGluR3 inhibiting the release of neurotransmitters, such as glutamate, GABA and glycine (Neale, 2011). In HFD-exposed mice, increased NAAG levels would thus reduce glutamatergic neurotransmission by both inhibiting the activity of NMDA receptors and augmenting the negative feedback of glutamate release through its agonist action on presynaptic mGluR3 receptors. High NAAG concentration might prevent glutamate excitotoxicity, which is important when astrocytes have impaired glutamate clearance (see above), but on the other hand sufficient glutamatergic activity is necessary for proper function, including memory performance.
Consistent with reduced rate of the glutamate-glutamine cycle and with synaptic dysfunction in general, we observed a reduction in the levels of some pre- and post-synaptic proteins and of vesicular glutamate and GABA transporters in mice exposed to diets containing either 45% or 60%, relative to controls. We measured the density of two presynaptic proteins that are target SNARE (Soluble N-ethylmaleimide-sensitive factor Attachment protein REceptor) proteins required for vesicle fusion, namely syntaxin-1 and SNAP-25 (Söllner et al., 1993), and the density of synaptophysin that is a major component of presynaptic vesicles (Valtorta et al., 2004). SNAP-25 was reduced in the hippocampus of mice fed 60%-fat diet, when compared to controls, and there was also a tendency for hippocampal synaptophysin levels to be reduced with increasing fat content in the diet. Similar results were found for the density of vGluT1 and vGAT in the hippocampus, which suggest a reduction of the number of excitatory and inhibitory synaptic vesicles that are available for neurotransmission. Deficits in gliotransmission cannot be excluded since vesicular transporters are present in both neurons and astrocytes (see Schubert et al., 2011 and references therein). Therefore, we further measured the levels of syntaxin-4. While syntaxin-1 is mostly located in neurons, namely in the plasma membrane of the presynaptic terminal, syntaxin-4 is particularly concentrated in glial cells, namely in peri-synaptic astrocytic processes (Schubert et al., 2011; Tao-Cheng et al., 2015). In fact, the level of syntaxin-4 was also found reduced in the hippocampus of mice from either HFD group, confirming also a dysfunction at the level of gliotransmission. We further measured the density of PSD-95 that is associated to excitatory postsynaptic densities (Hunt et al., 1996), and gephyrin that is present at the inhibitory postsynaptic density, where it interacts with glycine and γ-aminobutyric acid type A (GABAA) receptors (Maric et al., 2011). In the hippocampus, HFD also led to a reduction of PSD-95 (60%-fat group only) and of gephyrin (only significant for 45%-fat), compared to controls. Reduced level PSD-95 in the hippocampus of 45%-fat fed mice (for 2 weeks) relative to controls was also reported previously (Arnold et al., 2014). This synaptic dysfunction might be an important contributor for the hippocampal-dependent spatial memory impairment that was measured through the reduced spontaneous alternation in the Y-maze. In the cortex, only the levels of gephyrin were reduced in 60% fat fed mice versus controls, suggesting reduced inhibitory tone by the GABAergic system. In the hypothalamus, only vesicular neurotransmitter transporters and not the remaining measured synaptic proteins were reduced by HFD exposure, suggesting reduced neurotransmission capacity in both orexigenic and anorexigenic neurons (Meister, 2007; Moraes et al., 2009).
Conclusion
In sum, increasing the dietary amount of lard-based fat from 10 to 45% or 60% of the total energy intake leads to obesity accompanied by increased fasting blood glucose and insulin (pointing toward reduced insulin sensitivity), reduced glucose tolerance and increased plasma leptin. However, compared to controls (10%-fat) increased fed glycemia and plasma corticosterone were only observed in the 60%-fat fed mice. Exposure to both 45%-fat and 60%-fat diets resulted in deterioration of systems involved in neuro- and gliotransmission in the hippocampus, and in impaired spatial memory performance. Metabolic alterations measured by 1H MRS were generally observed in mice exposed to 60%-fat but not 45%-fat diet. Therefore, we conclude that different features of the metabolic syndrome result in distinct neurochemical alterations in the brain, all likely contributing for memory impairment. Moreover, chronically increased blood glucose and/or corticosterone appear to be main drivers for changes in brain metabolite levels.
Author Contributions
JD designed the study and wrote the manuscript. All authors performed the experiments, analyzed the data, and revised the manuscript.
Funding
This work was supported by the Knut and Alice Wallenberg Foundation, the Swedish Research Council (Strategic Research Area EXODIAB, grant 2009-1039), the Swedish Foundation for Strategic Research (grant IRC15-0067), the Community of Madrid, Spain (grant S2017/BMD-3688 MULTITARGET&VIEW-CM), the Swiss National Science Foundation (grant 148250), and the Centre d’Imagerie BioMédicale (CIBM) of the UNIL, UNIGE, HUG, CHUV, EPFL, and the Leenaards and Jeantet Foundations.
Conflict of Interest Statement
The authors declare that the research was conducted in the absence of any commercial or financial relationships that could be construed as a potential conflict of interest.
Abbreviations
Aβ, amyloid β; AD, Alzheimer’s disease; ANOVA, analysis of variance; CRLB, Cramér-Rao lower bound; GABA, γ-aminobutyrate; HFD, high-fat diet; IGF-1, insulin-like growth factor 1; LSD, least significant difference; MOPS, 3-(N-morpholino)propanesulfonic acid; MRS, magnetic resonance spectroscopy; NAAG, N-acetylaspartylglutamate; TBS, Tris-buffered saline; T2D, type 2 diabetes; VOI, volume of interest.
References
Albrecht, J., and Schousboe, A. (2005). Taurine interaction with neurotransmitter receptors in the CNS: an update. Neurochem. Res. 30, 1615–1621. doi: 10.1007/s11064-005-8986-6
Alzoubi, K. H., Mayyas, F. A., Mahafzah, R., and Khabour, O. F. (2018). Melatonin prevents memory impairment induced by high-fat diet: role of oxidative stress. Behav. Brain Res. 336, 93–98. doi: 10.1016/j.bbr.2017.08.047
Arnold, S. E., Lucki, I., Brookshire, B. R., Carlson, G. C., Browne, C. A., Kazi, H., et al. (2014). High fat diet produces brain insulin resistance, synaptodendritic abnormalities and altered behavior in mice. Neurobiol. Dis. 67, 79–87. doi: 10.1016/j.nbd.2014.03.011
Aureli, M., Grassi, S., Prioni, S., Sonnino, S., and Prinetti, A. (2015). Lipid membrane domains in the brain. Biochim. Biophys. Acta 1851, 1006–1016. doi: 10.1016/j.bbalip.2015.02.001
Baslow, M. H. (2003). N-acetylaspartate in the vertebrate brain: metabolism and function. Neurochem. Res. 28, 941–953. doi: 10.1023/A:1023250721185
Baydas, G., Nedzvetskii, V. S., Tuzcu, M., Yasar, A., and Kirichenko, S. V. (2003). Increase of glial fibrillary acidic protein and S-100B in hippocampus and cortex of diabetic rats: effects of vitamin E. Eur. J. Pharmacol. 462, 67–71. doi: 10.1016/S0014-2999(03)01294-9
Bothwell, J. H., Rae, C., Dixon, R. M., Styles, P., and Bhakoo, K. K. (2001). Hypo-osmotic swelling-activated release of organic osmolytes in brain slices: implications for brain oedema in vivo. J. Neurochem. 77, 1632–1640. doi: 10.1046/j.1471-4159.2001.00403.x
Calvo-Ochoa, E., Hernández-Ortega, K., Ferrera, P., Morimoto, S., and Arias, C. (2014). Short-term high-fat-and-fructose feeding produces insulin signaling alterations accompanied by neurite and synaptic reduction and astroglial activation in the rat hippocampus. J. Cereb. Blood Flow Metab. 34, 1001–1008. doi: 10.1038/jcbfm.2014.48
Chakraborty, G., Mekala, P., Yahya, D., Wu, G., and Ledeen, R. W. (2001). Intraneuronal N-acetylaspartate supplies acetyl groups for myelin lipid synthesis: evidence for myelin-associated aspartoacylase. J. Neurochem. 78, 736–745. doi: 10.1046/j.1471-4159.2001.00456.x
Charradi, K., Mahmoudi, M., Bedhiafi, T., Kadri, S., Elkahoui, S., Limam, F., et al. (2017). Dietary supplementation of grape seed and skin flour mitigates brain oxidative damage induced by a high-fat diet in rat: gender dependency. Biomed. Pharmacother. 87, 519–526. doi: 10.1016/j.biopha.2017.01.015
Corcoba, A., Steullet, P., Duarte, J. M. N., van de Looij, Y., Monin, A., Cuenod, M., et al. (2016). Glutathione deficit affects the integrity and function of the fimbria/fornix and anterior commissure in mice: relevance for schizophrenia. Int. J. Neuropsychopharmacol. 19, 1–11. doi: 10.1093/ijnp/pyv110
Cudalbu, C., McLin, V. A., Lei, H., Duarte, J. M. N., Rougemont, A. L., Oldani, G., et al. (2013). The C57BL/6 mouse exhibits sporadic congenital portosystemic shunts. PLoS One 8:e69782. doi: 10.1371/journal.pone.0069782
Duarte, J. M. N. (2015). Metabolic alterations associated to brain dysfunction in diabetes. Aging Dis. 6, 304–321. doi: 10.14336/AD.2014.1104
Duarte, J. M. N. (2016). Metabolism in the diabetic brain: neurochemical profiling by 1H magnetic resonance spectroscopy. J. Diabetes Metab. Disord. 3:011. doi: 10.24966/DMD-201X/100011
Duarte, J. M. N., Agostinho, P. M., Carvalho, R. A., and Cunha, R. A. (2012a). Caffeine consumption prevents diabetes-induced memory impairment and synaptotoxicity in the hippocampus of NONcNZO10/LtJ mice. PLoS One 7:e21899. doi: 10.1371/journal.pone.0021899
Duarte, J. M. N., Carvalho, R. A., Cunha, R. A., and Gruetter, R. (2009). Caffeine consumption attenuates neurochemical modifications in the hippocampus of streptozotocin-induced diabetic rats. J. Neurochem. 111, 368–379. doi: 10.1111/j.1471-4159.2009.06349.x
Duarte, J. M. N., Lei, H., Mlynárik, V., and Gruetter, R. (2012b). The neurochemical profile quantified by in vivo 1H NMR spectroscopy. Neuroimage 61, 342–362. doi: 10.1016/j.neuroimage.2011.12.038
Duarte, J. M. N., and Xin, L. (2018). Magnetic resonance spectroscopy in schizophrenia: evidence for glutamatergic dysfunction and impaired energy metabolism. Neurochem. Res. doi: 10.1007/s11064-018-2521-z [Epub ahead of print].
Fernandez, A. M., and Torres-Alemán, I. (2012). The many faces of insulin-like peptide signalling in the brain. Nat. Rev. Neurosci. 13, 225–239. doi: 10.1038/nrn3209
Frisardi, V., Solfrizzi, V., Seripa, D., Capurso, C., Santamato, A., Sancarlo, D., et al. (2010). Metabolic-cognitive syndrome: a cross-talk between metabolic syndrome and Alzheimer’s disease. Ageing Res. Rev. 9, 399–417. doi: 10.1016/j.arr.2010.04.007
Gapp, K., Corcoba, A., van Steenwyk, G., Mansuy, I. M., and Duarte, J. M. N. (2017). Brain metabolic alterations in mice subjected to postnatal traumatic stress and in their offspring. J. Cereb. Blood Flow Metab. 37, 2423–2432. doi: 10.1177/0271678X16667525
Girault, F.-M., Sonnay, S., Gruetter, R., and Duarte, J. M. N. (2018). Alterations of brain energy metabolism in type 2 diabetic Goto-Kakizaki rats measured in vivo by 13C magnetic resonance spectroscopy. Neurotox. Res. doi: 10.1007/s12640-017-9821-y [Epub ahead of print].
Gotoh, M., Davies, S. E., and Obrenovitch, T. P. (1997). Brain tissue acidosis: effects on the extracellular concentration of N-acetylaspartate. J. Neurochem. 69, 655–661. doi: 10.1046/j.1471-4159.1997.69020655.x
Gruetter, R., and Tkác, I. (2000). Field mapping without reference scan using asymmetric echo-planar techniques. Magn. Reson. Med. 43, 319–323. doi: 10.1002/(SICI)1522-2594(200002)43:2<319::AID-MRM22>3.0.CO;2-1
Gullans, S. R., and Verbalis, J. G. (1993). Control of brain volume during hyperosmolar and hypoosmolar conditions. Annu. Rev. Med. 44, 289–301. doi: 10.1146/annurev.me.44.020193.001445
Hada, J., Kaku, T., Morimoto, K., Hayashi, Y., and Nagai, K. (1998). Activation of adenosine A2 receptors enhances high K+-evoked taurine release from rat hippocampus: a microdialysis study. Amino Acids 15, 43–52. doi: 10.1007/BF01345279
Hansen, S. H., Andersen, M. L., Cornett, C., Gradinaru, R., and Grunnet, N. (2010). A role for taurine in mitochondrial function. J. Biomed. Sci. 17(Suppl. 1):S23. doi: 10.1186/1423-0127-17-S1-S23
Havrankova, J., Roth, J., and Brownstein, M. (1978). Insulin receptors are widely distributed in the central nervous system of the rat. Nature 272, 827–829. doi: 10.1038/272827a0
Hill, J. M., Lesniak, M. A., Pert, C. B., and Roth, J. (1986). Autoradiographic localization of insulin receptors in rat brain: prominence in olfactory and limbic areas. Neuroscience 17, 1127–1138. doi: 10.1016/0306-4522(86)90082-5
Hunt, C. A., Schenker, L. J., and Kennedy, M. B. (1996). PSD-95 is associated with the postsynaptic density and not with the presynaptic membrane at forebrain synapses. J. Neurosci. 16, 1380–1388. doi: 10.1523/JNEUROSCI.16-04-01380.1996
Kirmani, B. F., Jacobowitz, D. M., Kallarakal, A. T., and Namboodiri, M. A. (2002). Aspartoacylase is restricted primarily to myelin synthesizing cells in the CNS: therapeutic implications for Canavan disease. Brain Res. Mol. Brain Res. 107, 176–182. doi: 10.1016/S0169-328X(02)00490-4
Krols, M., van Isterdael, G., Asselbergh, B., Kremer, A., Lippens, S., Timmerman, V., et al. (2016). Mitochondria-associated membranes as hubs for neurodegeneration. Acta Neuropathol. 131, 505–523. doi: 10.1007/s00401-015-1528-7
Lauwers, E., Goodchild, R., and Verstreken, P. (2016). Membrane lipids in presynaptic function and disease. Neuron 90, 11–25. doi: 10.1016/j.neuron.2016.02.033
Li, L., Wang, Z., and Zuo, Z. (2013). Chronic intermittent fasting improves cognitive functions and brain structures in mice. PLoS One 8:e66069. doi: 10.1371/journal.pone.0066069
Li, M., Fan, P., and Wang, Y. (2015). Integrative approaches for lipid analysis. Pharmacologia 6, 213–234. doi: 10.5567/pharmacologia.2015.213.234
Liu, Y., Zhang, Q., Wang, L., Wang, H., Sun, T., Xia, H., et al. (2017). The α-lipoic acid improves high-fat diet-induced cerebral damage through inhibition of oxidative stress and inflammatory reaction. Environ. Toxicol. Pharmacol. 56, 219–224. doi: 10.1016/j.etap.2017.09.018
Lizarbe, B., Cherix, A., Duarte, J. M. N., Cardinaux, J. R., and Gruetter, R. (2018). High-fat diet consumption alters energy metabolism on the mouse hypothalamus. Int. J. Obesity doi: 10.1038/s41366-018-0224-9 [Epub ahead of print].
López-Valdés, H. E., and Martínez-Coria, H. (2016). The role of neuroinflammation in age-related dementias. Rev. Invest. Clin. 68, 40–48.
Maciejczyk, M., Żebrowska, E., Zalewska, A., and Chabowski, A. (2018). Redox balance, antioxidant defense, and oxidative damage in the hypothalamus and cerebral cortex of rats with high fat diet-induced insulin resistance. Oxid. Med. Cell. Longev. 2018:6940515. doi: 10.1155/2018/6940515
Maric, H. M., Mukherjee, J., Tretter, V., Moss, S. J., and Schindelin, H. (2011). Gephyrin-mediated γ-aminobutyric acid type A and glycine receptor clustering relies on a common binding site. J. Biol. Chem. 286, 42105–42114. doi: 10.1074/jbc.M111.303412
Meister, B. (2007). Neurotransmitters in key neurons of the hypothalamus that regulate feeding behavior and body weight. Physiol. Behav. 92, 263–271. doi: 10.1016/j.physbeh.2007.05.021
Melø, T. M., Nehlig, A., and Sonnewald, U. (2006). Neuronal-glial interactions in rats fed a ketogenic diet. Neurochem. Int. 48, 498–507. doi: 10.1016/j.neuint.2005.12.037
Mlynárik, V., Gambarota, G., Frenkel, H., and Gruetter, R. (2006). Localized short-echo-time proton MR spectroscopy with full signal-intensity acquisition. Magn. Reson. Med. 56, 965–970. doi: 10.1002/mrm.21043
Moheet, A., Mangia, S., and Seaquist, E. R. (2015). Impact of diabetes on cognitive function and brain structure. Ann. N. Y. Acad. Sci. 1353, 60–71. doi: 10.1111/nyas.12807
Moraes, J. C., Coope, A., Morari, J., Cintra, D. E., Roman, E. A., Pauli, J. R., et al. (2009). High-fat diet induces apoptosis of hypothalamic neurons. PLoS One 4:e5045. doi: 10.1371/journal.pone.0005045
Morrison, C. D., Pistell, P. J., Ingram, D. K., Johnson, W. D., Liu, Y., Fernandez-Kim, S. O., et al. (2010). High fat diet increases hippocampal oxidative stress and cognitive impairment in aged mice: implications for decreased Nrf2 signaling. J. Neurochem. 114, 1581–1589. doi: 10.1111/j.1471-4159.2010.06865.x
Neale, J. H. (2011). N-acetylaspartylglutamate is an agonist at mGluR3 in vivo and in vitro. J. Neurochem. 119, 891–895. doi: 10.1111/j.1471-4159.2011.07380.x
Oshida, K., Shimizu, T., Takase, M., Tamura, Y., Shimizu, T., and Yamashiro, Y. (2003). Effects of dietary sphingomyelin on central nervous system myelination in developing rats. Pediatr. Res. 53, 589–593. doi: 10.1203/01.PDR.0000054654.73826.AC
Pardon, M. C., Yanez Lopez, M., Yuchun, D., Marjańska, M., Prior, M., Brignell, C., et al. (2016). Magnetic Resonance Spectroscopy discriminates the response to microglial stimulation of wild type and Alzheimer’s disease models. Sci. Rep. 6:19880. doi: 10.1038/srep19880
Rahman, M. H., Bhusal, A., Lee, W. H., Lee, I. K., and Suk, K. (2018). Hypothalamic inflammation and malfunctioning glia in the pathophysiology of obesity and diabetes: Translational significance. Biochem. Pharmacol. 153, 123–133. doi: 10.1016/j.bcp.2018.01.024
Raider, K., Ma, D., Harris, J. L., Fuentes, I., Rogers, R. S., Wheatley, J. L., et al. (2016). A high fat diet alters metabolic and bioenergetic function in the brain: a magnetic resonance spectroscopy study. Neurochem. Int. 97, 172–180. doi: 10.1016/j.neuint.2016.04.008
Ribeiro, M., Castelhano, J., Petrella, L. I., Sereno, J., Rodrigues, T., Neves, C., et al. (2018). High-fat diet induces a neurometabolic state characterized by changes in glutamate and N-acetylaspartate pools associated with early glucose intolerance: an in vivo multimodal MRI study. J. Magn. Reson. Imaging doi: 10.1002/jmri.25942 [Epub ahead of print].
Sager, T. N., Fink-Jensen, A., and Hansen, A. J. (1997). Transient elevation of interstitial N-acetylaspartate in reversible global brain ischemia. J. Neurochem. 68, 675–682. doi: 10.1046/j.1471-4159.1997.68020675.x
Saravia, F. E., Revsin, Y., Deniselle, M. C. G., Gonzalez, S. L., Roig, P., Lima, A., et al. (2002). Increased astrocyte reactivity in the hippocampus of murine models of type 1 diabetes: the nonobese diabetic (NOD) and streptozotocin-treated mice. Brain Res. 957, 345–353. doi: 10.1016/S0006-8993(02)03675-2
Schubert, V., Bouvier, D., and Volterra, A. (2011). SNARE protein expression in synaptic terminals and astrocytes in the adult hippocampus: a comparative analysis. Glia 59, 1472–1488. doi: 10.1002/glia.21190
Soares, A. F., Duarte, J. M. N., and Gruetter, R. (2018). Increased hepatic fatty acid polyunsaturation precedes ectopic lipid deposition in the liver in adaptation to high-fat diets in mice. MAGMA 31, 341–354. doi: 10.1007/s10334-017-0654-8
Söllner, T., Whiteheart, S. W., Brunner, M., Erdjument-Bromage, H., Geromanos, S., Tempst, P., et al. (1993). SNAP receptors implicated in vesicle targeting and fusion. Nature 362, 318–324. doi: 10.1038/362318a0
Sonnay, S., Gruetter, R., and Duarte, J. M. N. (2017). How energy metabolism supports cerebral function: insights from 13C magnetic resonance studies in vivo. Front. Neurosci. 11:288. doi: 10.3389/fnins.2017.00288
Soontornniyomkij, V., Kesby, J. P., Soontornniyomkij, B., Kim, J. J., Kisseleva, T., Achim, C. L., et al. (2016). Age and high-fat diet effects on glutamine synthetase immunoreactivity in liver and hippocampus and recognition memory in mice. Curr. Aging. Sci. 9, 301–309. doi: 10.2174/1874609809666160413113311
Steculorum, S. M., Solas, M., and Brüning, J. C. (2014). The paradox of neuronal insulin action and resistance in the development of aging-associated diseases. Alzheimers Dement 10(1 Suppl.), S3–S11. doi: 10.1016/j.jalz.2013.12.008
Tao-Cheng, J. H., Pham, A., Yang, Y., Winters, C. A., Gallant, P. E., and Reese, T. S. (2015). Syntaxin 4 is concentrated on plasma membrane of astrocytes. Neuroscience 286, 264–271. doi: 10.1016/j.neuroscience.2014.11.054
Tarantini, S., Valcarcel-Ares, M. N., Yabluchanskiy, A., Tucsek, Z., Hertelendy, P., Kiss, T., et al. (2018). Nrf2 deficiency exacerbates obesity-induced oxidative stress, neurovascular dysfunction, blood-brain barrier disruption, neuroinflammation, amyloidogenic gene expression, and cognitive decline in mice, mimicking the aging phenotype. J. Gerontol. A Biol. Sci. Med. Sci. 73, 853–863. doi: 10.1093/gerona/glx177
Taylor, D. L., Davies, S. E., Obrenovitch, T. P., Urenjak, J., Richards, D. A., Clark, J. B., et al. (1994). Extracellular N-acetylaspartate in the rat brain: in vivo determination of basal levels and changes evoked by high K+. J. Neurochem. 62, 2349–2355. doi: 10.1046/j.1471-4159.1994.62062349.x
Thaler, J. P., Yi, C. X., Schur, E. A., Guyenet, S. J., Hwang, B. H., Dietrich, M. O., et al. (2012). Obesity is associated with hypothalamic injury in rodents and humans. J. Clin. Invest. 122, 153–162. doi: 10.1172/JCI59660
Tsai, S. F., Wu, H. T., Chen, P. C., Chen, Y. W., Yu, M., Wang, T. F., et al. (2018). High-fat diet suppresses the astrocytic process arborization and downregulates the glial glutamate transporters in the hippocampus of mice. Brain Res. 1700, 66–77. doi: 10.1016/j.brainres.2018.07.017
Valladolid-Acebes, I., Merino, B., Principato, A., Fole, A., Barbas, C., Lorenzo, M. P., et al. (2012). High-fat diets induce changes in hippocampal glutamate metabolism and neurotransmission. Am. J. Physiol. Endocrinol. Metab. 302, E396–E402. doi: 10.1152/ajpendo.00343.2011
Valtorta, F., Pennuto, M., Bonanomi, D., and Benfenati, F. (2004). Synaptophysin: leading actor or walk-on role in synaptic vesicle exocytosis? Bioessays 26, 445–453.
van der Graaf, M., Janssen, S. W., van Asten, J. J., Hermus, A. R., Sweep, C. G., Pikkemaat, J. A., et al. (2004). Metabolic profile of the hippocampus of Zucker Diabetic Fatty rats assessed by in vivo 1H magnetic resonance spectroscopy. NMR Biomed. 17, 405–410. doi: 10.1002/nbm.896
van Echten-Deckert, G., and Alam, S. (2018). Sphingolipid metabolism - an ambiguous regulator of autophagy in the brain. Biol. Chem. 399, 837–850. doi: 10.1515/hsz-2018-0237
Waise, T. M. Z., Toshinai, K., Naznin, F., NamKoong, C., Md Moin, A. S., Sakoda, H., et al. (2015). One-day high-fat diet induces inflammation in the nodose ganglion and hypothalamus of mice. Biochem. Biophys. Res. Commun. 464, 1157–1162. doi: 10.1016/j.bbrc.2015.07.097
Wang, W. T., Lee, P., Yeh, H. W., Smirnova, I. V., and Choi, I. Y. (2012). Effects of acute and chronic hyperglycemia on the neurochemical profiles in the rat brain with streptozotocin-induced diabetes detected using in vivo 1H MR spectroscopy at 9.4 T. J. Neurochem. 121, 407–417. doi: 10.1111/j.1471-4159.2012.07698.x
Yoon, H., Kleven, A., Paulsen, A., Kleppe, L., Wu, J., Ying, Z., et al. (2016). Interplay between exercise and dietary fat modulates myelinogenesis in the central nervous system. Biochim. Biophys. Acta 1862, 545–555. doi: 10.1016/j.bbadis.2016.01.019
Keywords: glucose, insulin, diabetes, brain metabolism, synaptic dysfunction, gliosis
Citation: Lizarbe B, Soares AF, Larsson S and Duarte JMN (2019) Neurochemical Modifications in the Hippocampus, Cortex and Hypothalamus of Mice Exposed to Long-Term High-Fat Diet. Front. Neurosci. 12:985. doi: 10.3389/fnins.2018.00985
Received: 22 October 2018; Accepted: 10 December 2018;
Published: 08 January 2019.
Edited by:
Joana M. Gaspar, Universidade Federal de Santa Catarina, BrazilReviewed by:
Enrique Cadenas, University of Southern California, United StatesAna I. Duarte, University of Coimbra, Portugal
Copyright © 2019 Lizarbe, Soares, Larsson and Duarte. This is an open-access article distributed under the terms of the Creative Commons Attribution License (CC BY). The use, distribution or reproduction in other forums is permitted, provided the original author(s) and the copyright owner(s) are credited and that the original publication in this journal is cited, in accordance with accepted academic practice. No use, distribution or reproduction is permitted which does not comply with these terms.
*Correspondence: João M. N. Duarte, am9hby5kdWFydGVAbWVkLmx1LnNl