- 1General Psychology Unit, Chair of Psychology, Faculty of Pedagogy, Pedagogical University of Kraków, Poland
- 2Neurocognitive Psychology Unit, Chair of Psychology, Faculty of Pedagogy, Pedagogical University of Kraków, Poland
The sufficient length and good quality of night sleep play a vital role in maintaining health, well-being and effective functioning. Nevertheless, an increase in the prevalence of sleep deprivation can be observed recently. The concept of bedtime procrastination, defined as going to bed later than intended, has been proposed to explain one of the psychological determinants of sleep deficiency. To investigate the prevalence of bedtime procrastination among Poles we carried out a Polish adaptation of the Bedtime Procrastination Scale (BPS), a self-report questionnaire for measuring the tendency to voluntarily postpone going to bed in the absence of any external circumstances for doing so. The aim of the research was to determine the main psychometric properties of the Polish version of the BPS. We also aimed to identify the relationships between bedtime procrastination and selected demographic variables in the Polish sample, and to examine the impact of bedtime procrastination on self-reported sleep outcomes. The data obtained from online surveys conducted on two Polish samples were analyzed, including demographic factors, self-reported sleep outcomes, and responses to items of the BPS. The Polish version of the BPS has a unifactorial structure like the original version. It also exhibits satisfactory internal consistency and moderate temporal stability in a 10-week retest study. BPS scores were not significantly related to the place of residence, the highest completed level of education, living with a spouse or partner, and living with children. Scores in BPS slightly decreased with age and females scored higher on BPS than males. Higher BPS scores were obtained for a group of students in comparison to a group of subjects who were not students, and lower BPS scores were found in working respondents in comparison to respondents who were not working. BPS scores correlate negatively with sleep length on workdays and a feeling of sleep sufficiency, and positively with sleep length on weekdays relative to workdays, sleeping later than one would like, and a feeling of fatigue. Several relationships between self-reported sleep outcomes and demographic variables were also identified.
Introduction
Sleep is an important part of human life and is of key importance for physical and mental health, cognitive performance and good functioning at school, work, and leisure. Sleep deprivation may be the cause of poor working efficiency, low school performance (Wolfson and Carskadon, 2003; Curcio et al., 2006; Ming et al., 2011) traffic accidents (Connor et al., 2001; Connor, 2002; Abdoli et al., 2015a, b, 2018), mental stress, depressed mood and anxiety (Eller et al., 2006). It also involves medical conditions, including obesity, diabetes, cardiovascular disease, and an increased risk of death (Strine and Chapman, 2005; Gangwisch et al., 2006; Roane and Taylor, 2008; Fernandez-Mendoza et al., 2015). In addition, it was found that lack of sleep leads to a reduction in the level of optimism and sociability (Haack and Mullington, 2005).
Various factors may contribute to the delayed onset of night sleep. Length and quality of sleep are often negatively affected by various psychological and psychiatric issues such as insomnia and affective disorders, as well as several neurodegenerative diseases (Ondo et al., 2001; Bliwise, 2004; Herzog-Krzywoszanska and Krzywoszanski, 2019). Numerous studies have shown that female gender is a strong risk factor of poor sleep and insomnia; this is probably largely due to changes in sex steroid production during the menstrual cycle, pregnancy, and menopausal transition (Shaver et al., 1988; Pien and Schwab, 2004; Baker and Driver, 2007; Mong and Cusmano, 2016). On the other hand, numerous environmental and sociocultural factors, like exposure to noise and light at night, shift work, daily routines, lifestyle (Irish et al., 2015), and use of electronic media (Gradisar et al., 2013) all considerably contribute to postponing going to bed. Because of the growing mobility, accessibility, and user-friendliness of electronic media, we spend an increasing amount of time in front of screens (Rideout et al., 2010). As we devote more time to media, there is less time available for other activities, including sleep. One of the most profound effects of media use on sleep is sleep displacement, whereby media use leads to later bedtimes and shorter sleep duration (Cain and Gradisar, 2010; Van den Bulck, 2010).
The role of psychological conditions as the third potentially important group of factors in determining chronobiological health has been highlighted recently (Harvey, 2002; Harvey and Payne, 2002; Brand et al., 2015). Most research in this area focuses on patients with sleep disorders (ex., Szentkirályi et al., 2009; Swanson et al., 2011), but much less attention is paid to sleep problems that are a result of lifestyle and bad sleep habits in the general population (Kroese et al., 2016a). Going to bed on time may have a crucial role in providing sufficient sleep length and quality. Sleep deficiency can, therefore, be treated as the effect of a behavioral problem in that people have insufficient sleep because they go to bed late and the next morning they must get up for school or work. Most of them could fall asleep and sleep enough hours if they went to bed, but they delay doing so. Most often these individuals can easily predict that if they do not go to sleep early enough, they will be sleepy and tired the next day (Kroese et al., 2016b). Kroese et al. (2014, 2016a) called this phenomenon “bedtime procrastination,” defined as “needlessly and voluntarily delaying going to bed, despite foreseeably being worse off as a result” (Kroese et al., 2016b). Bedtime procrastination, like general procrastination, is associated with poor self-regulation. Self-regulation failure increases the tendency to seek immediate rewards, increases susceptibility to temptation and hinders concentration in goal-directed activities (Tangney et al., 2004). The ability to resist temptations is crucial in order to realize the intention to go to bed at a certain time by giving up attractive activities such as watching TV or surfing the internet (Hofmann et al., 2008; Mann et al., 2013). To measure the general tendency to go to bed later than intended, the Bedtime Procrastination Scale (BPS) was developed (Kroese et al., 2014). English (Kroese et al., 2014; Sirois et al., 2019), Danish (Kroese et al., 2016a) and Flemish (Exelmans and Van den Bulck, 2017) versions of the BPS have been used in previous studies on bedtime procrastination. In addition, the preliminary results of work on the Polish adaptation of BPS were presented recently by Herzog-Krzywoszanska and Krzywoszanski (2017).
In Poland, as in other countries, sleep deprivation is a fairly common problem (National Sleep Foundation, 2008; Oginska et al., 2014). The results of a study on a representative sample of Polish adults (Boguszewski, 2016) showed that half of Poles declared that they sleep for less than 6 h at least once a week, and 8% that they always sleep less than 6 h. Students are particularly vulnerable to sleep deprivation since they have worse health habits than subjects in other groups (Trockel et al., 2000; Buboltz et al., 2001; Gaultney, 2010; Owens et al., 2017). Research on Polish high-school students revealed that they were sleep-deprived as 88.5% of adolescents reported getting less than 9 h of sleep, and 78% adolescents felt tired during the day on 3 or more days per week (Kadzikowska-Wrzosek, 2018a). Nearly half of Polish university students always or often slept less than 6 h per day and over 60% felt tired in the morning (Błońska and Gotlib, 2012; Kasperczyk and Jośko, 2012). This high prevalence of sleep deprivation among students indicates the need for more comprehensive studies on the psychological factors that affect it. Taking into account the phenomenon of bedtime procrastination, which is recognized as a specific sleep-related deficit of self-regulation, this seems a very promising approach in this field. However, to the best of our knowledge no studies on the prevalence of bedtime procrastination in different demographic groups in Poland have yet been presented. In order to support our other aims, the first goal of our study was to develop a Polish version of the BPS and examine its psychometric properties. Secondly, since the role of demographic factors in bedtime procrastination has not yet been thoroughly analyzed, we intended to investigate the possible variations of BPS scores due to demographic variables. In particular, it seemed to us to be particularly interesting to compare the severity of bedtime procrastination in Polish students against subjects from groups with different professional status. Thirdly, we attempted to identify the impact of bedtime procrastination on sleep duration and sleep outcomes in the general Polish population.
Materials and Methods
Subjects
Since principal component analysis (PCA) and confirmatory factor analysis (CFA) had to be conducted on separate samples (Matsunaga, 2010), we conducted online surveys on two different samples of respondents. Sample 1 consisted of 431 students of the Pedagogical University of Kraków, who were studying various academic fields and disciplines. They participated voluntarily and received credit points for a voluntary academic course involving participation in research as subjects. Answers to survey questions were recorded anonymously. The possibility to withdraw from the research at any stage without providing explanations was assured. All students gave informed consent for their participation in the survey. Ten weeks (from 9 to 11 weeks) after the first test, the retest study was conducted on the participants from Sample 1.
Participants of Sample 2 were recruited via email invitations sent to a pool of research volunteers from the database maintained by Biostat, a Polish company providing an online social research service. For completing the survey participants were granted credit points with a value corresponding to five Polish zlotys (approximately 1 Euro). Credit points obtained by participants are redeemable for financial compensation from Biostat when a total sum of points worth at least 50 Polish zlotys has been accrued. Responses from 335 subjects from Sample 2 were analyzed as we excluded data from 42 participants (11.1% out of 377 respondents) who reported working nightshifts, indicated that they had received treatment for sleeping problems, or had consulted a doctor regarding sleep difficulties and were therefore considered as having a clinical history of sleep disorders. The minimum group sizes needed to detect the effect size of δ ≥ 0.5 with probability ≥ 0.8, assuming type I error rate two-tailed set at α = 0.05 with two-tailed testing were 295 and 36. The size of group 2 (students) relative to group 1 (other respondents) was assumed to be 0.12.
Measures
The BPS is a self-report questionnaire consisting of nine individual items, that describe sleep-related behaviors and habits that are considered indicators of a high or low level of bedtime procrastination. The subject is asked to indicate whether given statements apply to him or her, choosing responses on a five-point Likert scale labeled 1 = “(almost) never” and 5 = “(almost) always.” Four items are reverse scored. The total BPS score is computed by averaging responses to all individual items and it may range from 1 to 5 points with a scale midpoint of 3 points. The total score reflects the extent to which people unnecessarily delay going to bed, with higher scores indicating more bedtime procrastination. Sample items are “I go to bed later than I had intended” and “I do not go to bed on time” (reverse coded). For the English version of BPS, Cronbach’s α of 0.92, 0.89, and 0.90 was obtained in an online survey of users of an internet crowdsourcing platform (Kroese et al., 2014) and on two samples of internet users (Sirois et al., 2019), respectively. Cronbach’s α of 0.88 was reported for the Dutch version of BPS in an online survey on a representative sample of Dutch adults (Kroese et al., 2016a) and for the Flemish version of BPS in a survey on a randomly selected sample of Flemish-speaking adults (Exelmans and Van den Bulck, 2017).
Demographic questions included gender, age, the place of residence (from village to big town/city), and education. The highest completed level of education (from lower secondary to doctoral, postgraduate, or equivalent) was coded according to the 2011 International Standard Classification of Education (ISCED) categories. Responses to questions about household composition and vocational status were also collected. For the purpose of data analysis, information about living with a child or children and living with a spouse or partner were extracted from the responses to the question about household composition and coded into two dummy variables with “yes” or “no” values. The responses to questions about vocational status were recoded into two dummy variables: employment (1 = employed, 0 = not employed) and student (1 = student, 0 = not a student).
Sleep descriptives and sleep outcomes were assessed using measures created by Kroese et al. (2014, 2016a). Participants’ self-perceived average night sleep duration was measured by answers to questions about sleep length on workdays and sleep length on weekdays; these were expressed in hours a day and given on the 5-point response scale (less than 5 | 5–6 | 7–8 | 9–10 | more than 10). The average frequency of going to bed later than intended was assessed by answers to the question “In an average week, how many days do you go to bed later than you would like to?,” given on the response scale described above. The answers to the question “On average, how many days a week do you feel tired during the day?” were given on a five-point response scale (0 days/never | 1–2 days | 3–4 days | 5–6 days | 7 days/always) and were used as a self-report measure of sleep-related daytime fatigue. Experienced sleep insufficiency was assessed by responses to the question “To what extent do you feel the number of hours of sleep you usually get is sufficient,” given on a four-point response scale (completely insufficient | rather insufficient | rather sufficient | completely sufficient).
Procedure
The Polish BPS version was prepared in accordance with the rules of the translation and backtranslation procedure suggested by Brislin (1986). The initial translations of the BPS items were done by three Polish-speaking people (including two psychologists with Ph.D. in psychology) with a very good command of English. After comparing all Polish translations, the final Polish version was agreed through discussion (see: Appendix). The final Polish version of BPS items was subsequently back-translated into English, showing a satisfactory convergence with the original.
Statistical Analysis
Principal component analysis that determined the number of components based on simulations on random data obtained in parallel analysis was performed as an exploratory assessment of the factorial structure of responses to items of the Polish BPS version in Sample 1. Bartlett’s test of the sphericity of the correlation matrix and the Kaiser-Meyer-Olkin measure of sampling adequacy (MSA) were also computed. To verify the unifactorial structure of the Polish version of BPS that was indicated by the results of PCA analysis, the responses obtained in Sample 2 were subjected to CFA. A single-factor model with one latent variable representing total BPS score was specified. Since the distribution of responses to items in the Polish BPS version deviated from normal distribution, the diagonally weighted least squares (DWLS) estimation method with robust error estimation was used. Chi-square to df ratio (χ2/df), root mean square error of approximation (RMSEA), standardized root mean square residual (SRMR), Bentler’s Comparative Fit Index (CFI), Tucker-Lewis Index (TLI), and Bentler-Bonett Normed Fit Index (NFI) were used to evaluate the overall model fit.
Cronbach’s α (Cronbach, 1951) and McDonald’s ω (McDonald, 1999) were applied as measures of the internal consistency of the total score in the Polish BPS version. Means, standard deviations, and item-rest correlations were computed. Measures of internal consistency were also calculated if an item was dropped for individual items. Pearson correlation was used for analysis of test–retest reliability. The R ‘cocron’ package for the statistical comparison of Cronbach’s α coefficients (Diedenhofen and Musch, 2016) was used to compare values of Cronbach’s α in independent samples. Values of standard error of measurement (Guilford, 1954; Harvill, 1991), the halfwidth of its 95% confidence interval, and minimal detectable change, also called smallest real change (Beckerman et al., 2001) were determined on the basis of Cronbach’s α as the measure of scale reliability. Mean, median, standard deviation, skewness, and kurtosis was given to describe the distribution of raw scores of the Polish BPS version in Sample 2.
Since the distribution of BPS scores were slightly skewed, the relations between raw total BPS scores and responses to sleep-related questions with demographic factors were examined using Spearman rank-order correlation and the Mann–Whitney U-test, with rank-biserial correlation as the measure of effect size. To find the best subset of demographic predictors of high severity of bedtime procrastination (defined as a high categorized score in BPS), multivariate binomial logistic regression was conducted to predict the ratio for high versus not-high BPS scores from demographic variables (gender, median-split dichotomized age, living with a spouse or partner, living with children, being a student and employment status). The backward elimination of variables with p-values > 0.05 in each step was applied.
A series of univariate ordinal logistic regression analyses predicting answers to sleep-related questions from raw BPS scores was performed to examine the impact of bedtime procrastination on sleep outcomes. To determine whether the impact of BPS scores on responses to demographic questions can be attributed to demographic variables, a series of two-step hierarchical multiple ordinal logistic regression analyses was performed in which demographics were entered in the first step, and sleep outcomes were entered in the second step.
The interrelationships between answers to sleep-related questions, respondents’ highest completed level of education, and the place of residence were analyzed using Spearman rank-order correlations. The impact on answers to sleep-related questions of gender, median-split dichotomized age (below 38 years versus 38 years or more), living with a spouse or partner, living with children, being a student and employment were examined using univariate ordinal logistic regressions. Multivariate ordinal logistic regressions with backward elimination of variables with p-values > 0.05 in each step were also conducted to select the best demographic predictors of sleep outcomes.
Jamovi (The jamovi project 2019) and JASP (JASP Team 2019) open-source statistical programs were used for statistical analyses. The lavaan R Package for Structural Equation Modeling (Rosseel, 2012) implemented in JASP was used for CFA computations.
Results
Demographic Characteristics of the Studied Samples
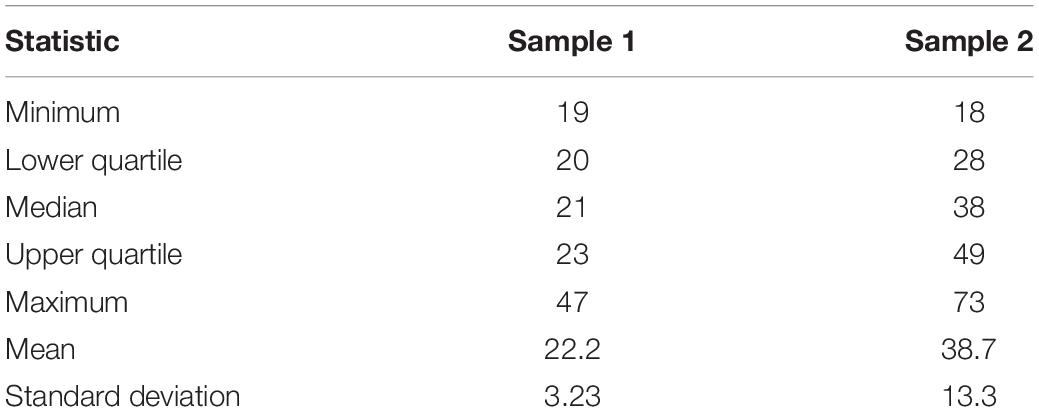
Distribution of respondents’ age and their responses to demographic questions are presented in Tables 1, 2.
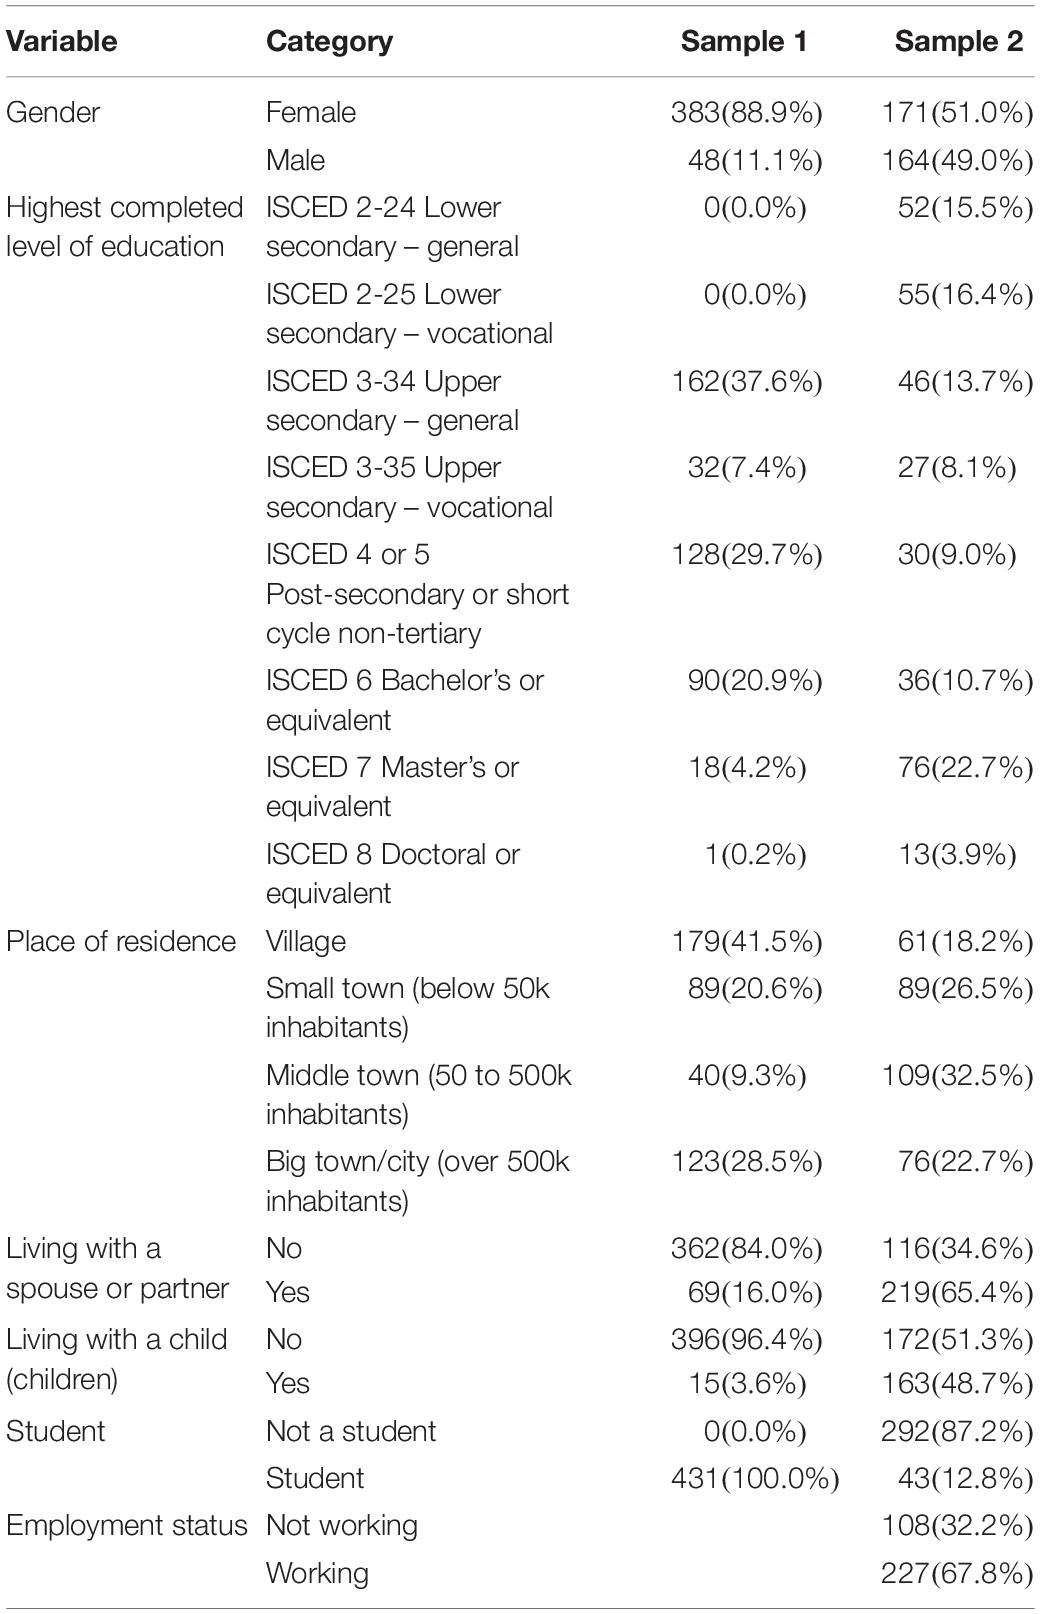
Table 2. Frequencies of responses to demographic questions in Sample 1 and Sample 2 with percentages of total sample size.
As can be seen in Tables 1, 2, Sample 2 represents a similar share of females and males and covers a wide range of ages and completed levels of education, with varied household composition; Sample 1 is dominated by young female adults with upper secondary or higher education, living without children and without a spouse or partner, all of which is due to their status as university students.
Psychometric Characteristics of BPS
Principal Component Analysis
Following the approach of the authors of the original BPS version (Kroese et al., 2014), PCA was used to explore the component structure of responses to items of the Polish version of this questionnaire in Sample 1 All interitem correlations of the Polish BPS version in this sample were significant at p < 0.001, ranging from 0.24 to 0.59, with average of 0.41. The results of Bartlett’s test of sphericity of the correlation matrix, χ2(36) = 1354, p < 0.001, showed significant relationships among responses to the individual items of the Polish version of BPS in Sample 1 and indicated that they are correlated enough for PCA. The overall Kaiser-Meyer-Olkin MSA was high (MSA = 0.90) and all MSA values for individual items were > 0.87, which confirmed the good factorability of responses to items of the Polish BPS version in this sample. Only the first eigenvalue was greater than one (4.29), and the inspection of a scree plot also suggested the extraction of the component which accounted for 48 percent of the total variance. Parallel analysis confirmed the adequacy of the one-dimensional solution (see Figure 1). Since only one component was extracted, no rotation was applied. As depicted in Table 3, all component loadings for PCA in Sample 1 were high, ranging from 0.60 to 0.79.
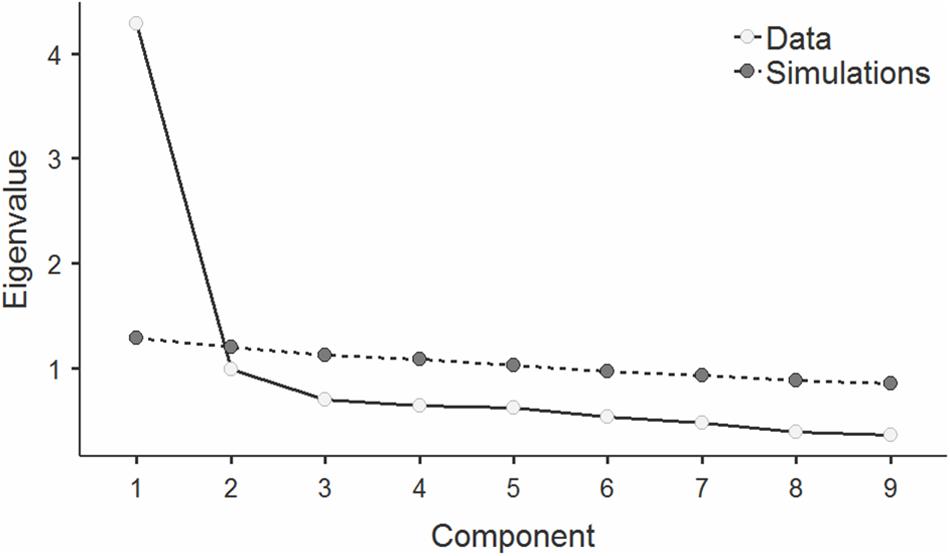
Figure 1. Scree plot with eigenvalues for consecutive components in principal component analysis (PCA) of responses to items of the Polish BPS version in Sample 1, with values of upper 95% confidence intervals for eigenvalues in simulations on random data obtained in parallel analysis.
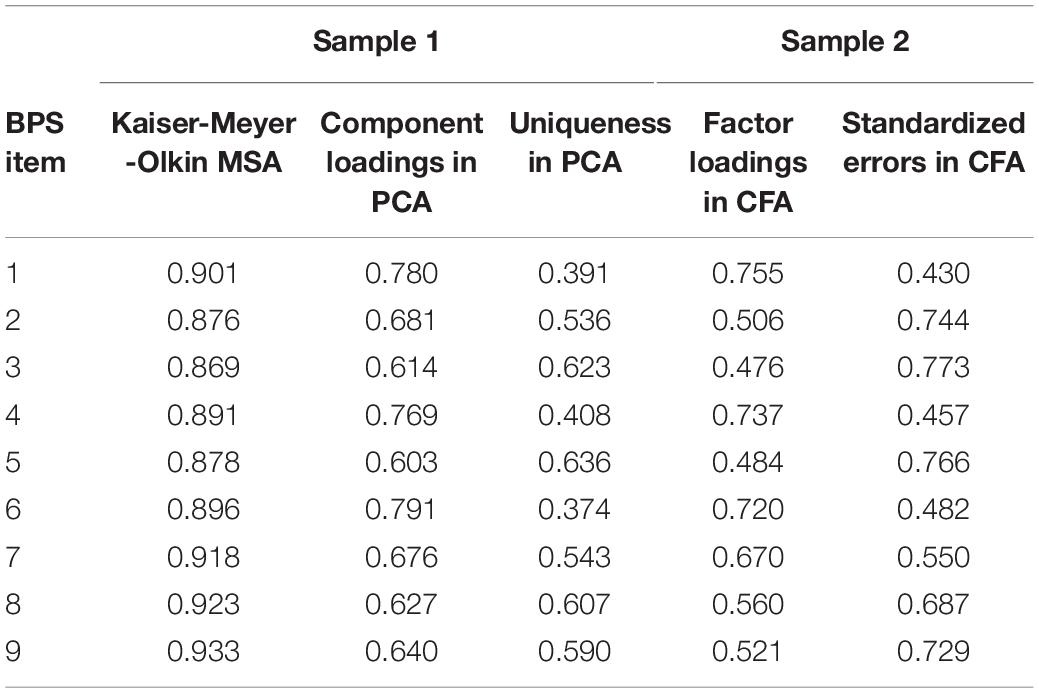
Table 3. Results of Kaiser-Meyer-Olkin measure of sampling adequacy (MSA), principal component analysis (PCA), and confirmatory factor analysis (CFA) of responses to items of the Polish BPS version.
Confirmatory Factor Analysis
To verify the validity of the unifactorial structure of the Polish BPS version that were suggested by the results of PCA analysis, the responses obtained in Sample 2 were subjected to CFA. All path coefficients between the latent variable and individual BPS items were significant at p < 0.001, with standardized estimates (factor loadings) ranging from 0.48 to 0.76 (see Table 3 for details), thus indicating that the factor that represents the total BPS score substantially contributed to the variance of all BPS items. It is worth noting that the configuration of values of component loadings and uniqueness in PCA correspond to factor loadings and errors in CFA. The values of the adopted fit indices indicated a good overall fit of the specified CFA model: χ2/df = 1.31, RMSEA = 0.031, with 90% confidence intervals from 0.000 to 0.053, SRMR = 0.052, CFI = 0.994, TLI = 0.992, NFI = 0.976.
Items’ Descriptives, Item-Rest Correlations, and Scale Reliability
Means, standard deviations, item-rest correlations and measures of internal consistency if an item was dropped are given in Table 4 for individual items of the Polish BPS version in Sample 1 and Sample 2. Item-rest correlations in Sample 1 ranged from 0.50 to 0.70, with an average of 0.59; in Sample 2 they ranged from 0.44 to 0.67, with an average of 0.54.
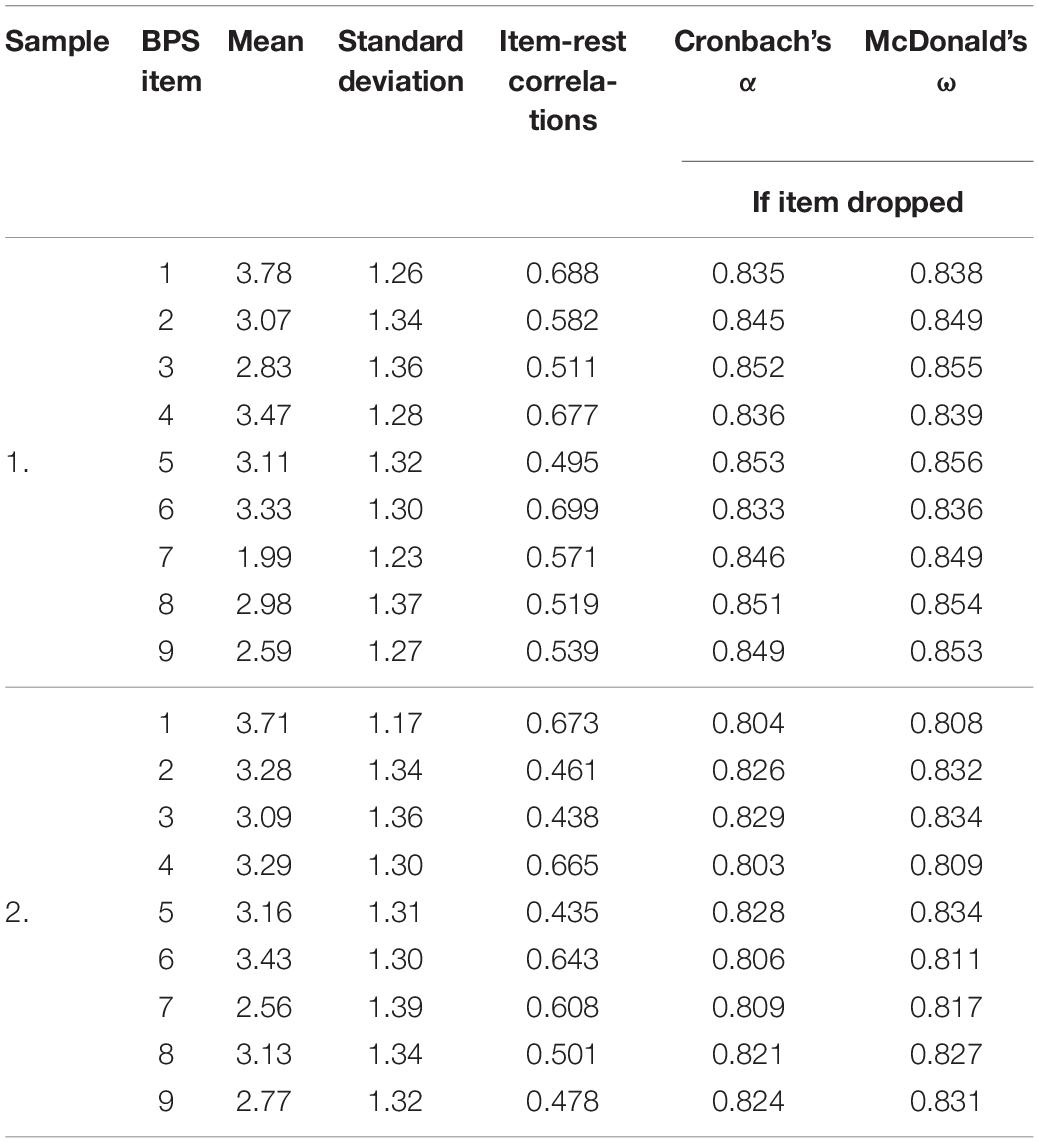
Table 4. Means, standard deviations, item-rest correlations for BPS items and measures of internal consistency (Cronbach’s α and McDonald’s ω), computed if items dropped for Sample 1 and Sample 2.
Reliability and Measurement Error of BPS Total Score
As presented in Table 5, Cronbach’s α and McDonald’s ω for the whole scale were greater than 0.8 in both samples. The values of Cronbach’s α did not differ significantly between both samples, χ2(1) = 2.01, p = 0.156, and the 95% confidence intervals of this coefficient overlapped considerably. Cronbach’s α for the Polish BPS version in Sample 2 differed significantly from Cronbach’s α obtained for the English (Kroese et al., 2014), Dutch (Kroese et al., 2016a), and Flemish (Exelmans and Van den Bulck, 2017) BPS versions: χ2(1) = 22.3, p < 0.001; χ2(1) = 13.4, p < 0.001; χ2(1) = 11.5, p = 0.001, respectively. It also differed significantly from Cronbach’s α for the English BPS version applied by Sirois et al. (2019) in study 1, χ2(1) = 6.03, p = 0.014, and study 2, χ2(1) = 23.6, p < 0.001. The Pearson correlation coefficient was equal to 0.675 in the 10-week test–retest analysis of total BPS score in 395 subjects with non-missing data from Sample 1, which indicates moderate temporal stability of the BPS score. Standard error of measurement values and halfwidth of the 95% confidence interval for measurement error for the total score of the Polish BPS version in Sample 2 are given in Table 5.
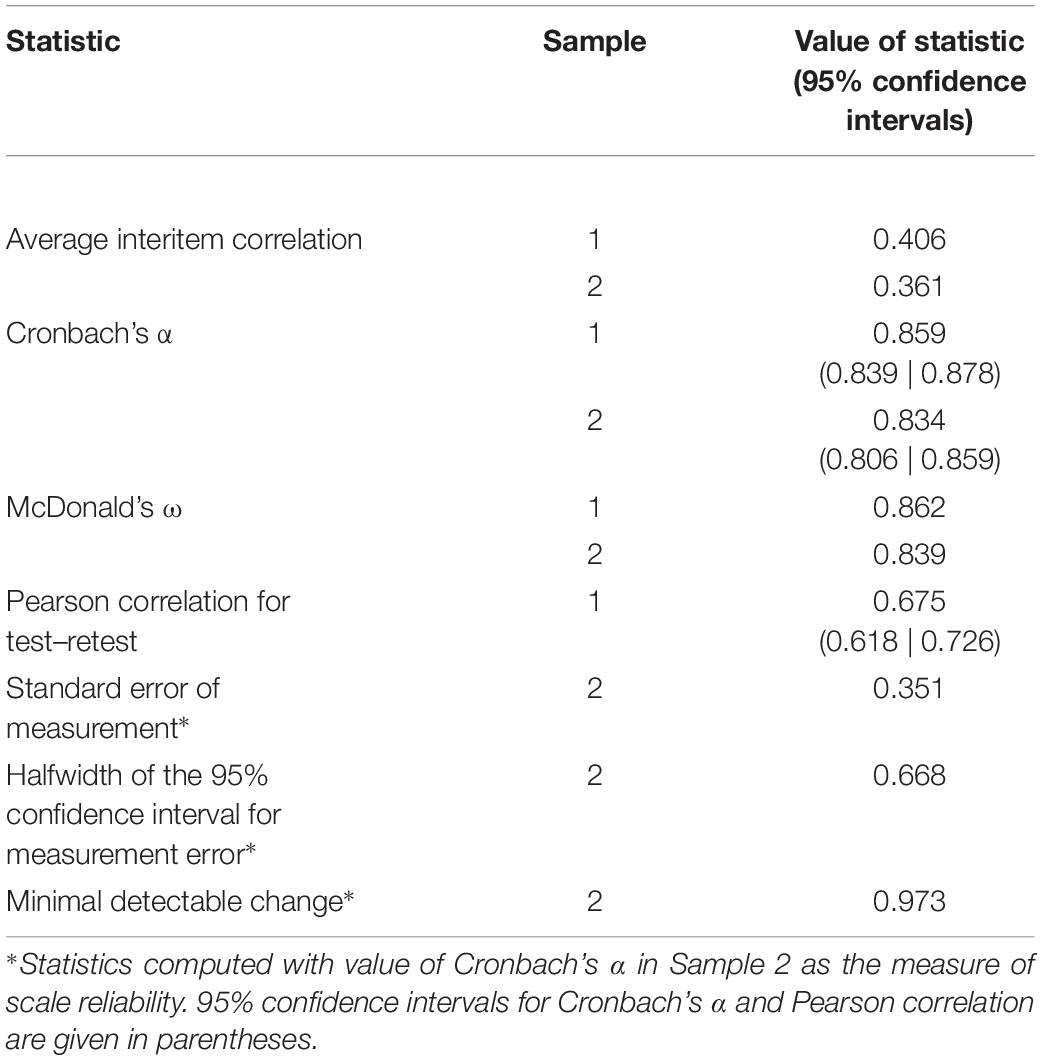
Table 5. Reliability statistics, standard error of measurement with halfwidth of 95% confidence intervals and minimal detectable change for the Polish BPS version.
Distribution of Raw and Categorized BPS Total Score
Considering that Sample 2 was more diverse in terms of demographic variables, the results obtained in this sample were used to compute the measures of distribution of the raw total score in the Polish BPS version. The observed minimum and maximum are equal to the lowest and highest possible values of the scale (1 and 5 points), which shows that the obtained raw scores fully cover the scale’s entire range. Mean, median, standard deviation, skewness, kurtosis, and their 95% confidence intervals for Sample 1 and Sample 2 are presented in Table 6.
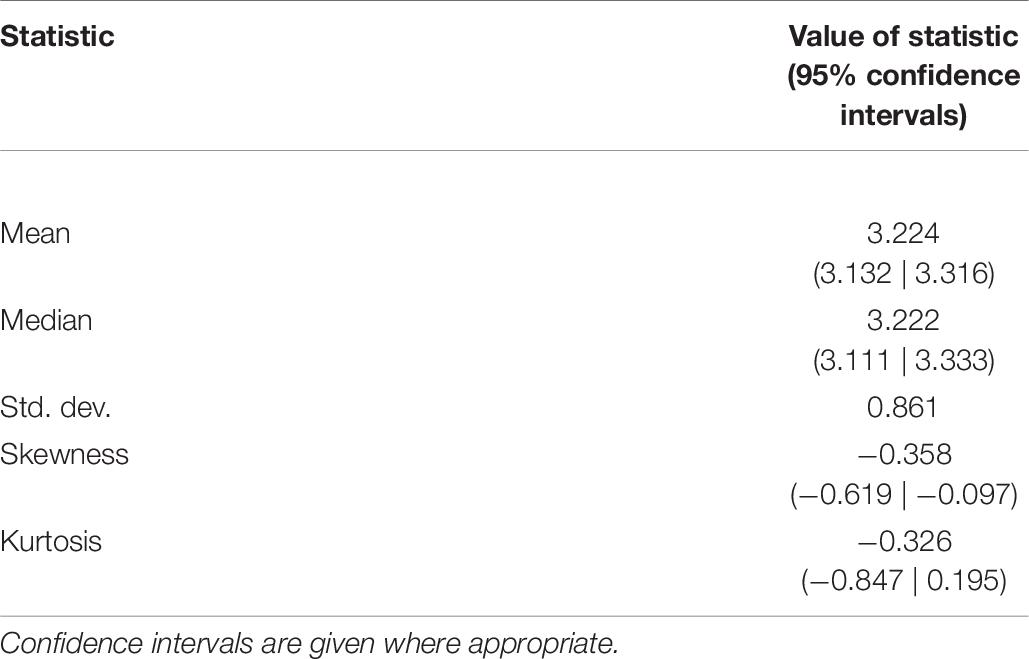
Table 6. Descriptive statistics with 95% confidence intervals where appropriate for distribution of raw total score of Polish PBS version in Sample 2.
Since both mean and median are higher than the scale midpoint (3.0) with a negative value of skewness, the distribution of the total scores of the Polish BPS version is slightly left-skewed. A histogram with a smoothed density plot showing the distribution of total scores of the Polish BPS version in Sample 2 is depicted in Figure 2.
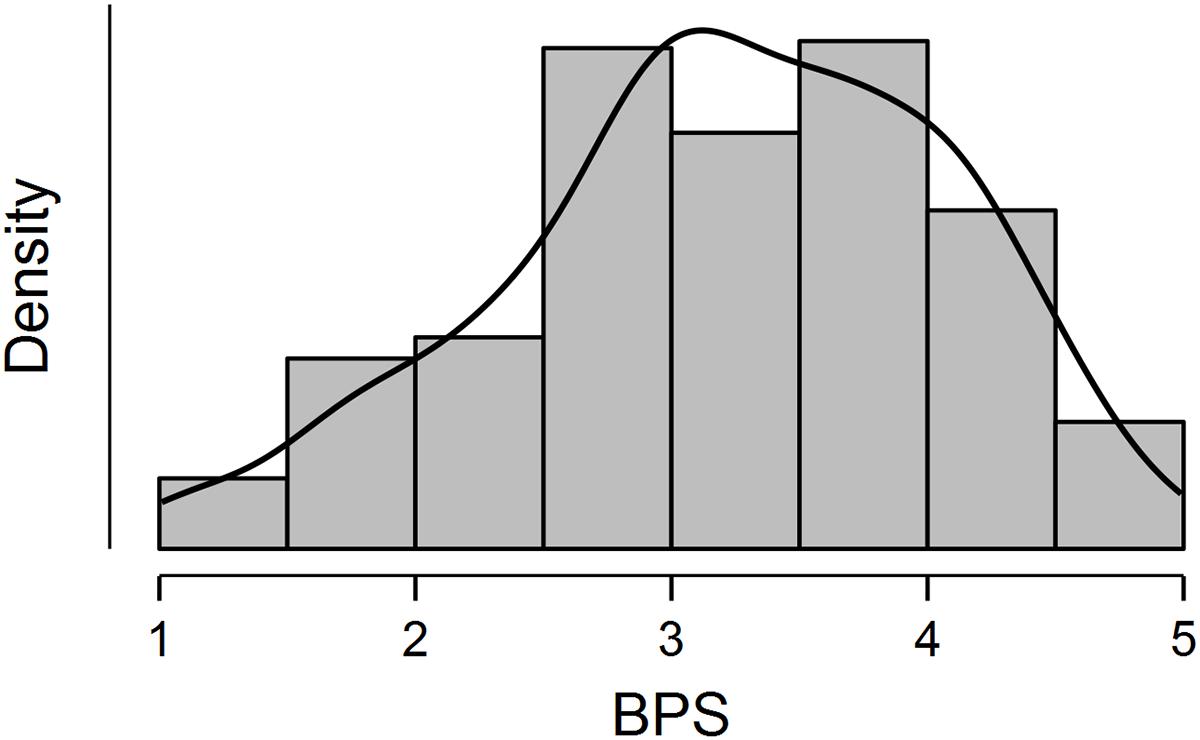
Figure 2. Histogram and smoothed density plot showing distribution of total raw scores of the Polish version of the Bedtime Procrastination Scale (BPS) in Sample 2.
For discriminating between low, moderate and high levels of the Polish BPS version scores, two cut-off points that are distant by the halfwidth of the 95% confidence interval for the measurement error (Lyles and Kupper, 1999) from the scale midpoint were determined to have values of 2.332 and 3.668. Proportions of subjects with three levels of scores in the Polish BPS version are depicted in Figure 3.
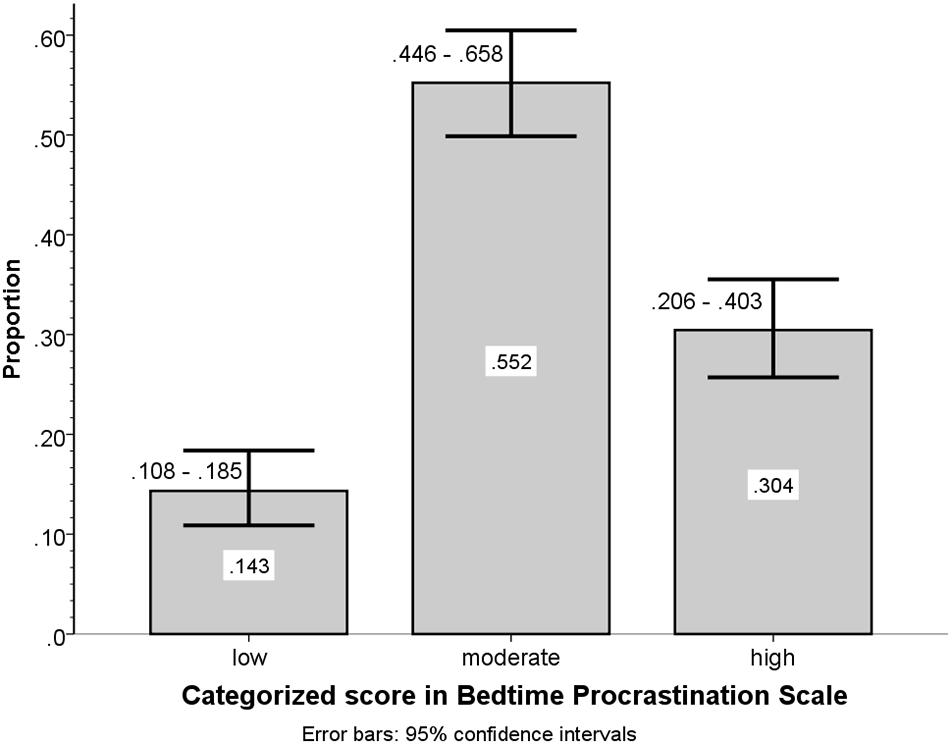
Figure 3. Group frequency to total sample size proportions with 95% confidence intervals for categorized scores of the Polish version of the BPS in Sample 2.
Relations Between BPS Scores and Demographic and Sleep-Related Variables
BPS Scores and Demographic Variables
Spearman rank-order correlations between raw BPS scores and respondents’ age (ρ = −0.120 with 95% confidence intervals from −0.224 to −0.013) indicate that bedtime procrastination slightly decreases with age. The relationship between BPS scores and respondents’ age are plotted in Figure 4. As can be inferred from the confidence bands in Figure 4, mean BPS scores for respondents aged 18 to 37 deviate from the scale midpoint, whereas for subjects aged 38 or more years the scale midpoint is within the range of 95% confidence intervals (compare the confidence interval bands with the horizontal grid line at BPS value 3.0 in Figure 4).
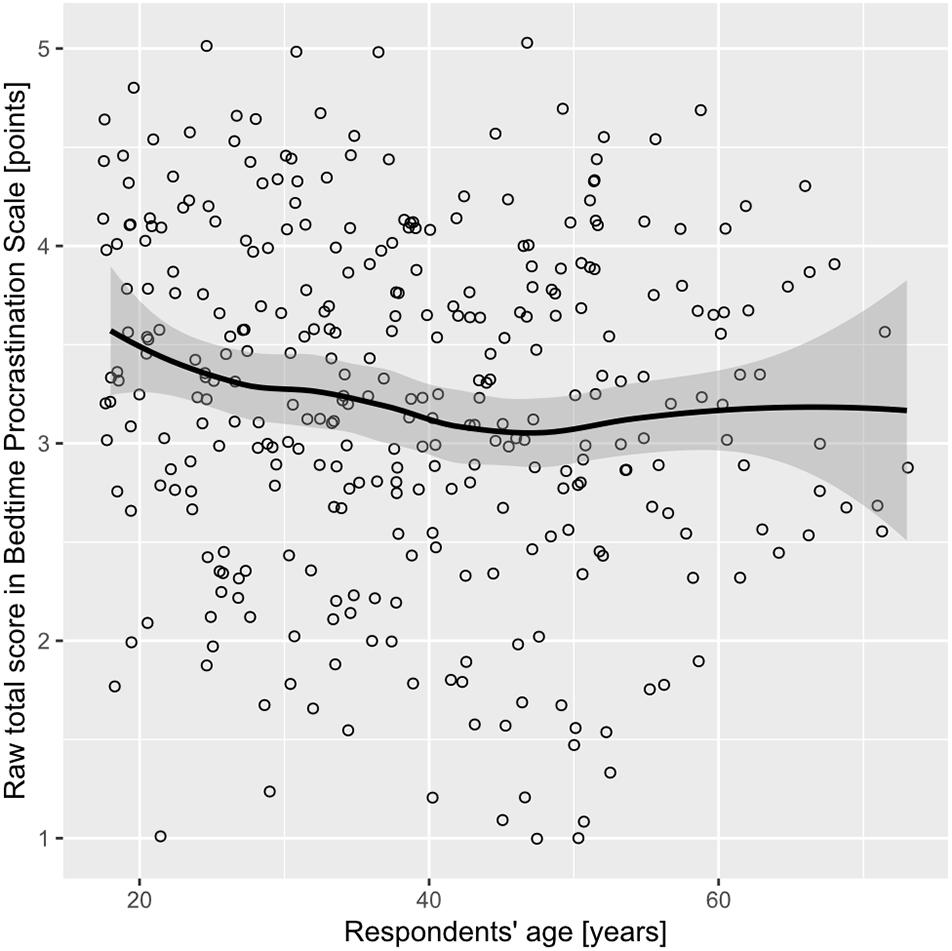
Figure 4. Scatterplot of raw total scores in BPS by respondents’ age with smoothed regression line and 95% confidence interval in Sample 2. The loess function was used for smoothing.
Spearman rank-order correlations between raw BPS scores and respondents’ highest completed level of education (ρ = −0.101 with 95% confidence intervals from −0.206 to 0.006) and place of residence (ρ = 0.018 with 95% confidence intervals from −0.089 to 0.125) did not deviate significantly from zero. Results of the Mann–Whitney U-test that was used to examine the differences in raw BPS scores between groups distinguished by binomial demographic variables are presented in Table 7. The group means for raw BPS scores, probabilities and odds of high BPS categorized scores, and odds ratios for high versus not-high BPS scores are also given. Females scored higher on the BPS than males; higher BPS scores were obtained for the group of students in comparison to the group of non-students, and lower BPS scores were found in working respondents in comparison to non-working respondents.
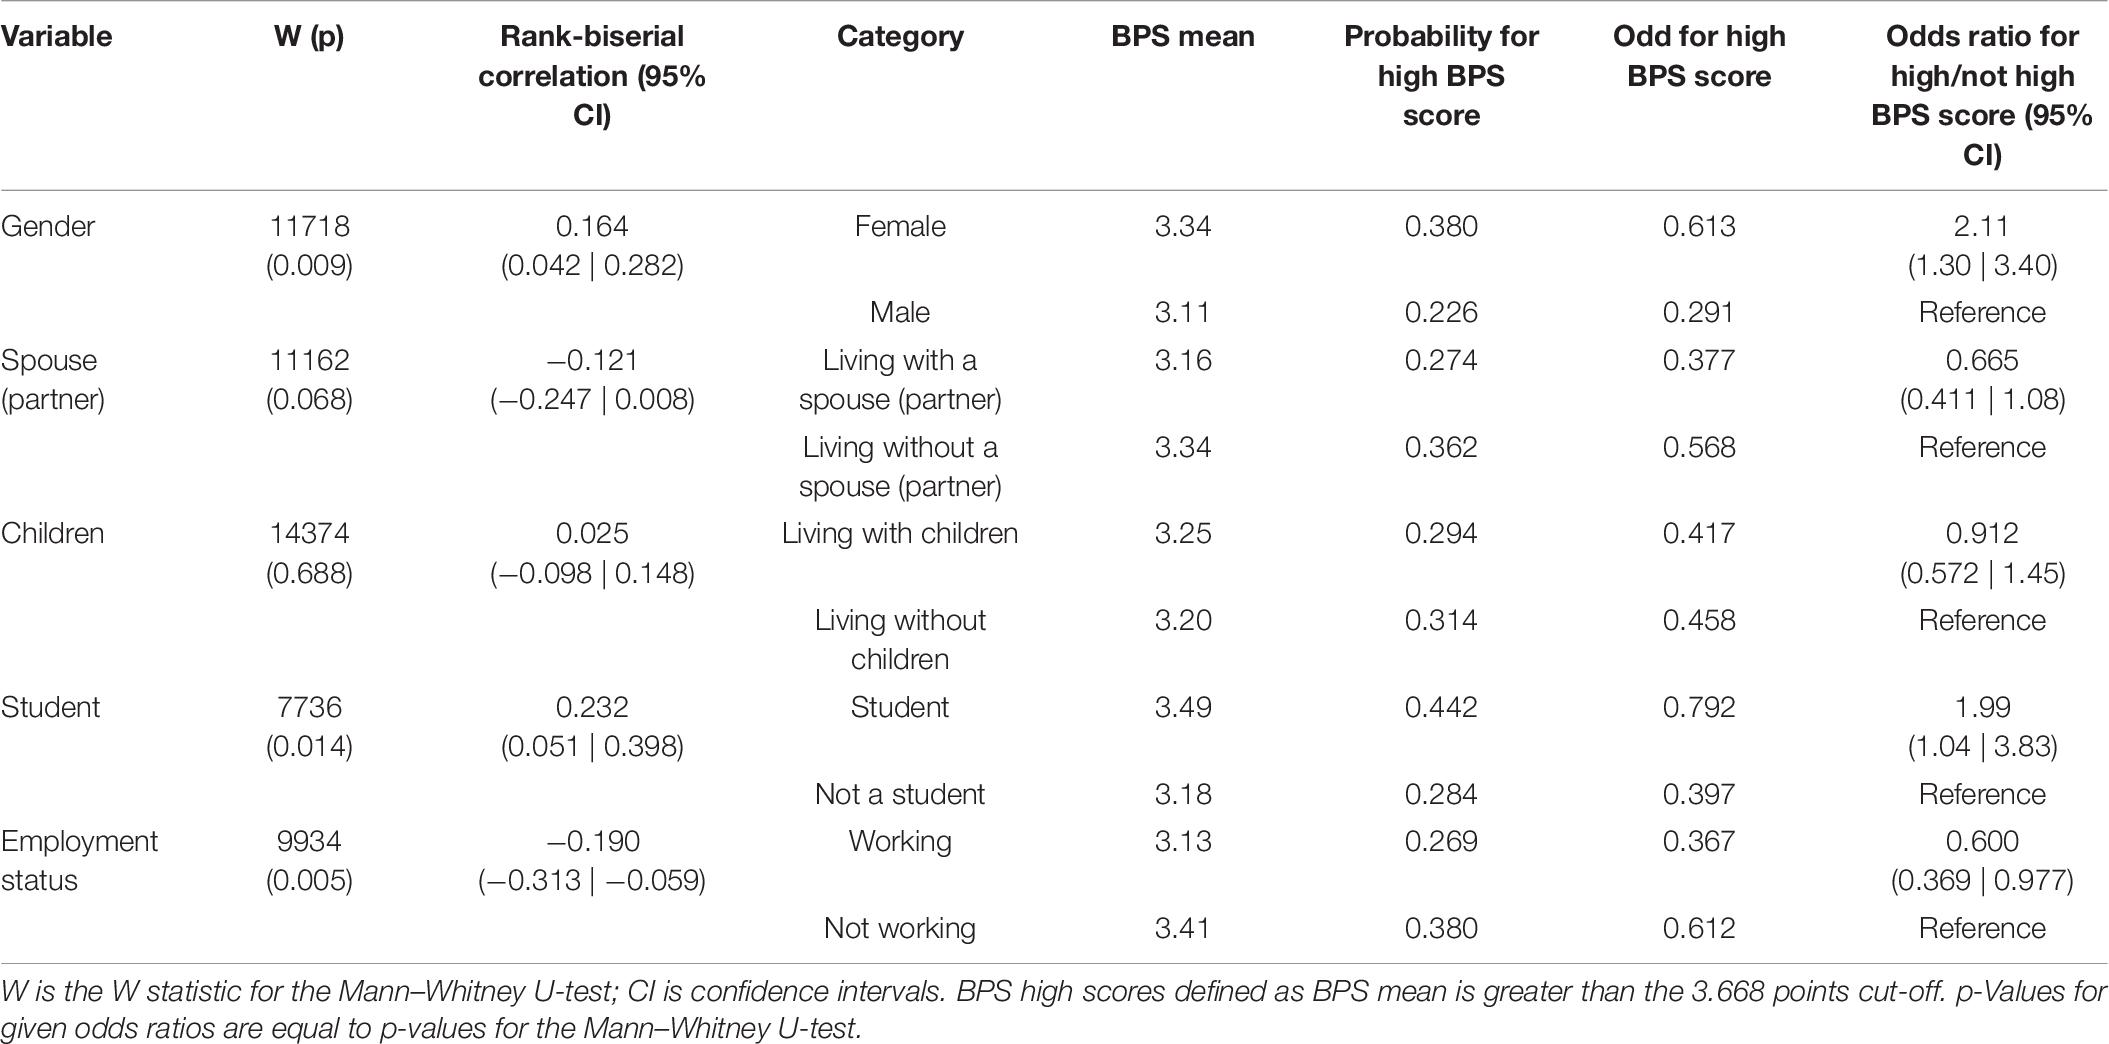
Table 7. Comparison of total score of Polish PBS version for different categories of demographic variables in Sample 2.
To find the best subset of demographic predictors of a BPS score above 3.668 points cut-off, multivariate binomial logistic regression was conducted to predict the ratio of high to not-high BPS scores from demographic variables, with backward elimination of variables with p-values > 0.05 in each step. Female gender and being a student were selected as best demographic predictors of high BPS scores (odds ratio: 2.17 with 95% confidence intervals from 1.31 to 3.44, and 2.04 with 95% confidence intervals from 1.05 to 3.96, respectively). The test of the overall model was significant (χ2 = 10.8 with 2 degrees of freedom, p = 0.004), and Nagelkerke pseudo R2 was equal to 0.057.
Scores in BPS and Responses to Sleep-Related Questions
Relationships between responses to questions about sleep duration and sleep outcomes, and the total score of the Polish PBS in Sample 2 are presented in Table 8. Raw total scores in BPS correlate negatively with sleep length on workdays and a feeling of sleep sufficiency, and positively with sleep length on weekdays relative to workdays, sleeping later than one would like and a feeling of fatigue.
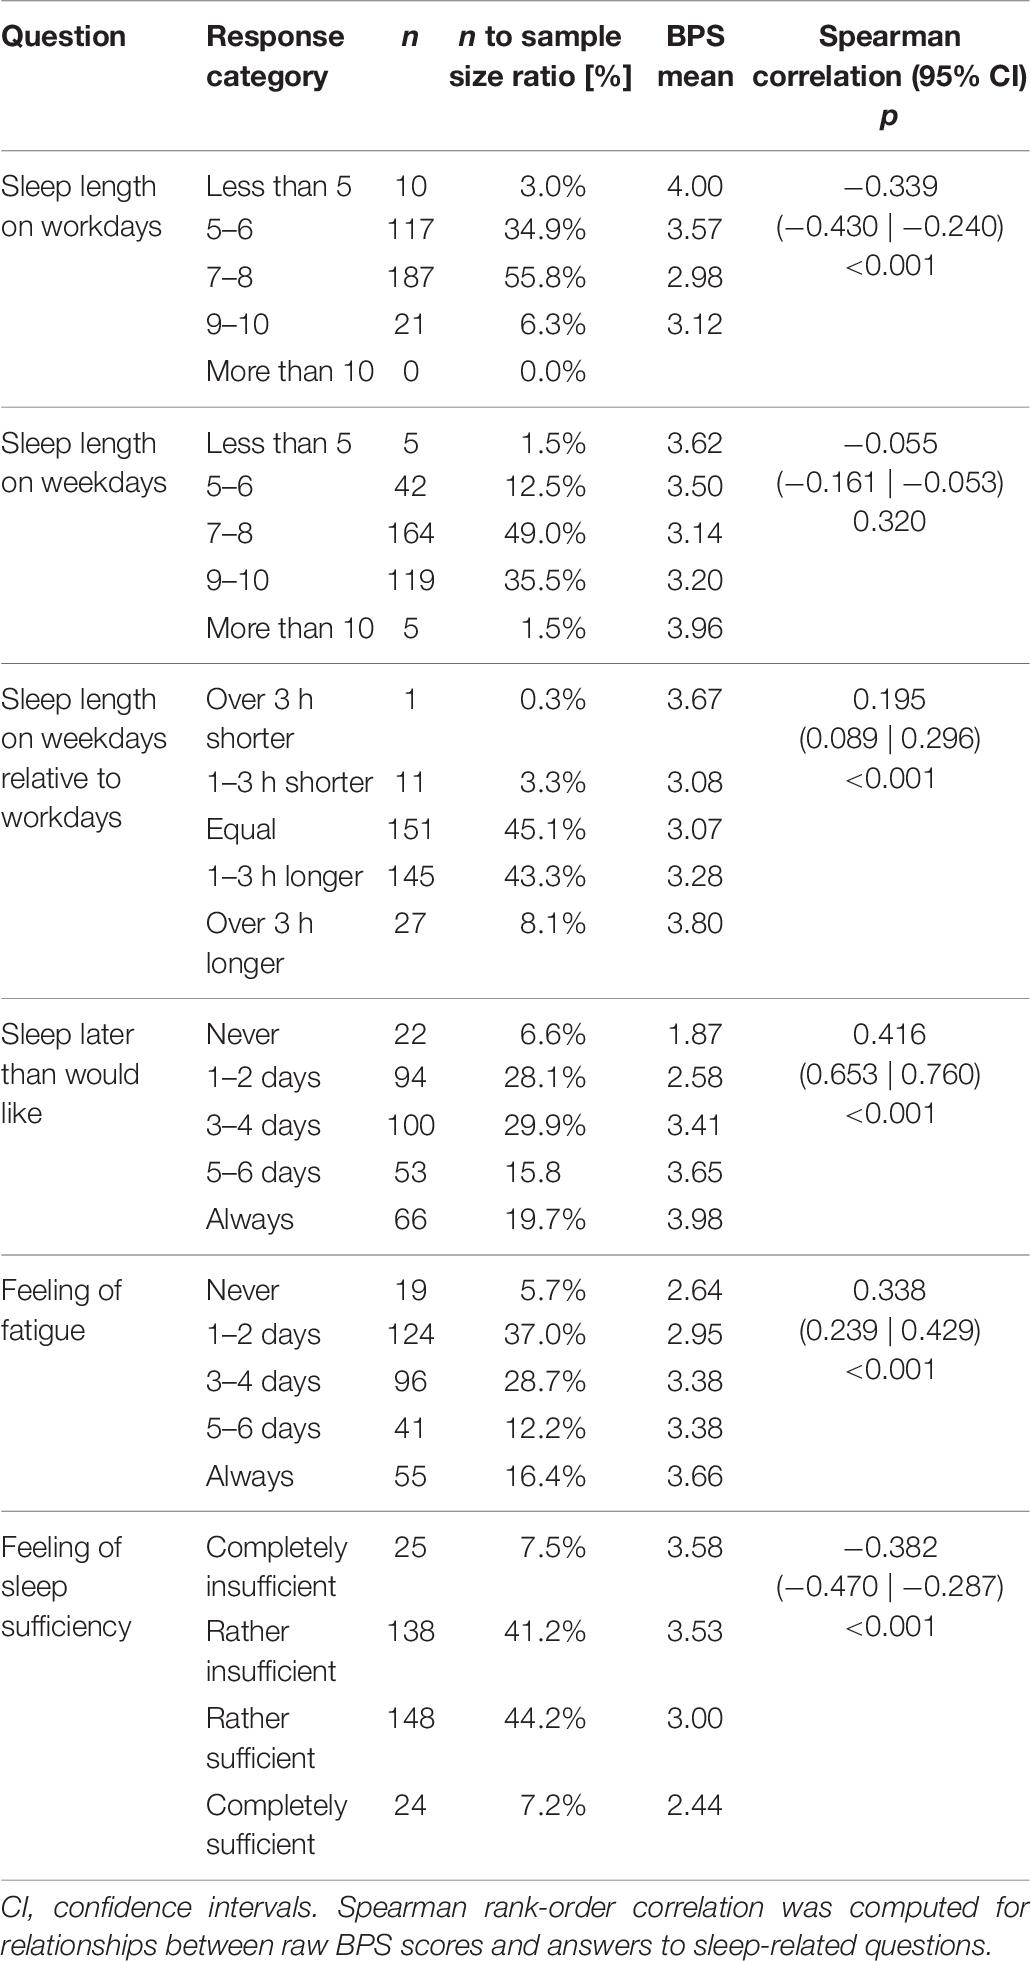
Table 8. Responses to sleep-related questions and averaged raw scores in Polish BPS version with Spearman rank-order correlations in Sample 2.
The results from univariate and multivariate hierarchical ordinal logistic regression analyses that predict answers to sleep-related questions from raw BPS scores are presented in Table 9. Except for sleep length on weekdays, for all remaining sleep-related questions adding BPS scores to the regression models with demographics significantly improved the model’s fit. No considerable differences could be found when the values of pseudo R2 in univariate analyses were compared to pseudo R2 changes for adding BPS scores to the model in hierarchical analyses. This indicates that the impact of BPS scores on responses to sleep-related questions cannot be attributed to demographic variables.
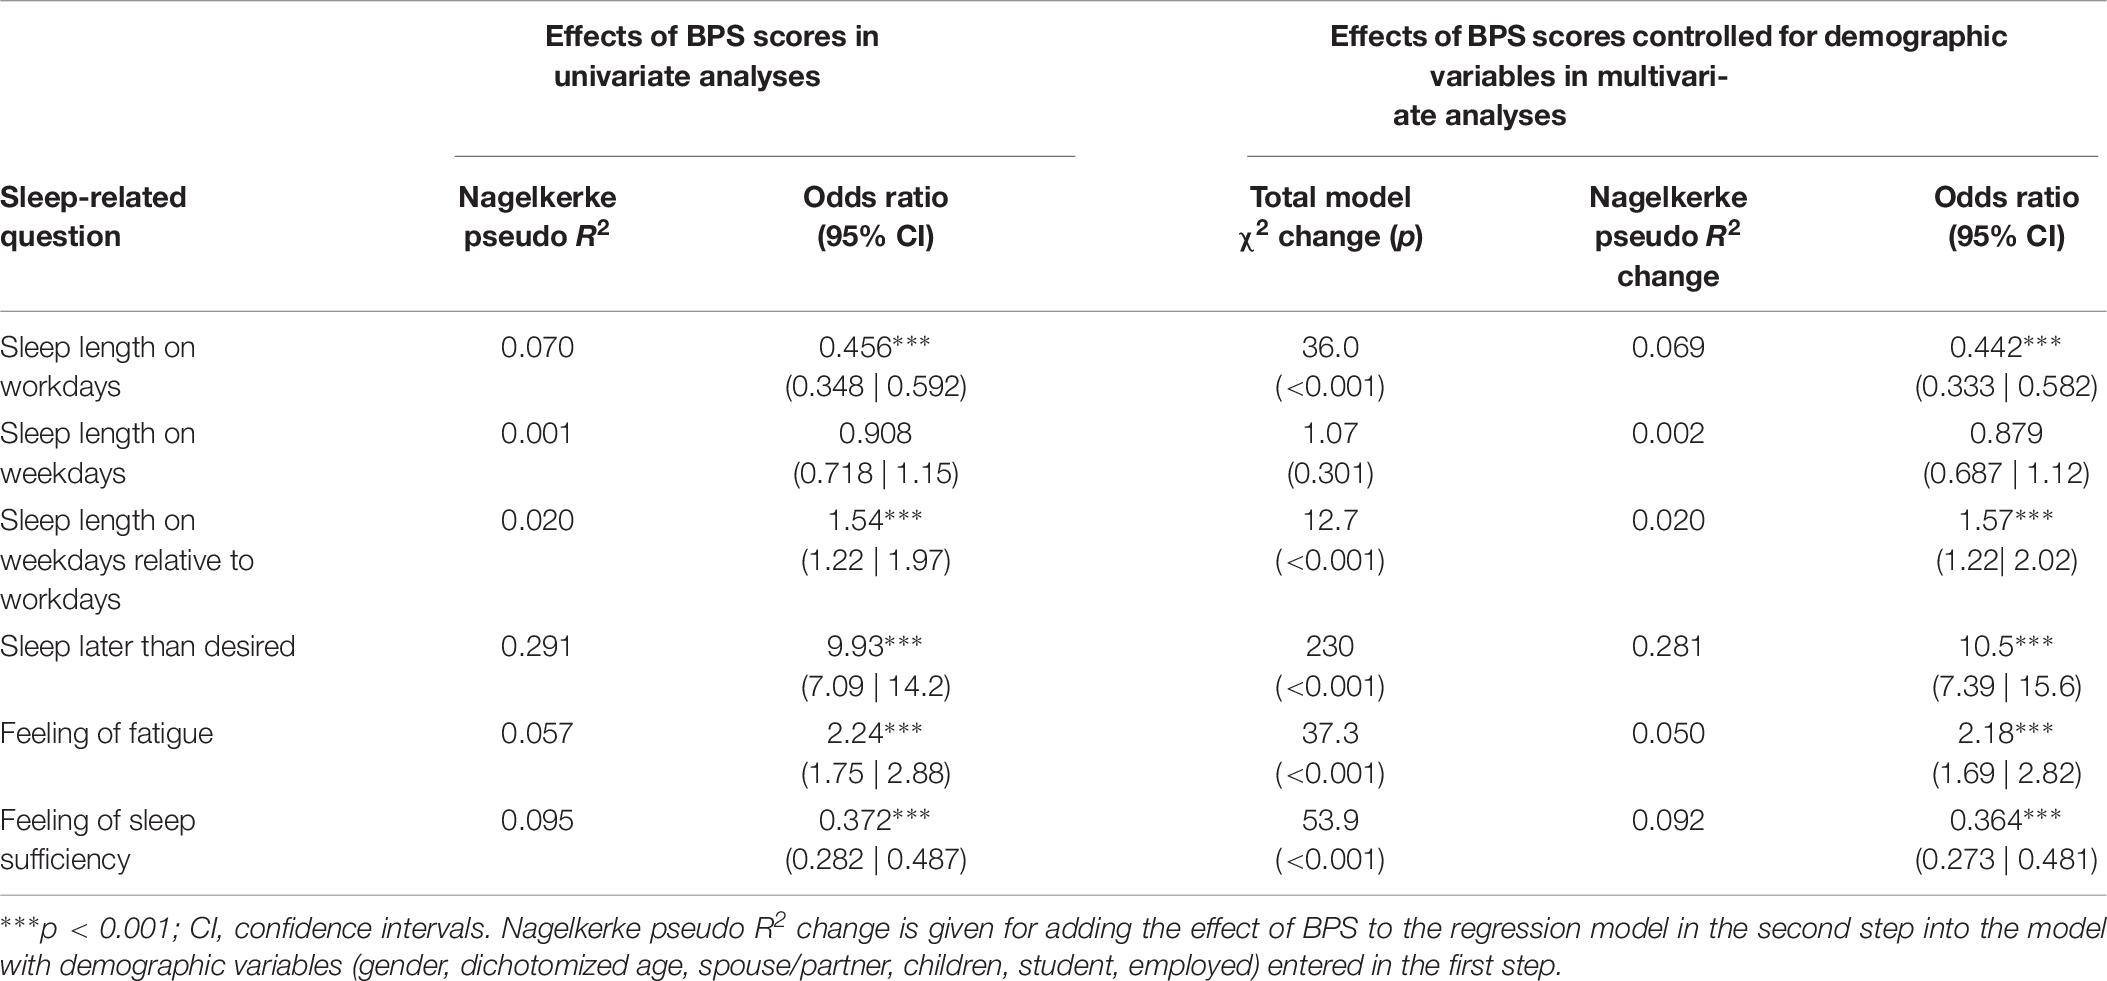
Table 9. Odds ratios (with 95% confidence intervals) for ordinal logistic regressions predicting answers to sleep-related questions from raw BPS scores in univariate models and multivariate hierarchical models controlled for demographic variables in Sample 2.
Answers to Sleep-Related Questions and Demographic Variables
Spearman rank-order correlations indicated that answers to the question measuring the feeling of fatigue correlated negatively with the highest completed level of education, ρ = −0.131 with 95% confidence intervals from −0.235 to −0.024. No significant differences from zero were found for correlations between the place of residence and responses to any sleep-related questions.
The odds ratios with 95% confidence intervals obtained in univariate analyses predicting sleep outcomes from demographic variables are given in Table 10. In backward elimination multivariate analyses, being a student was the only predictor of sleep length on workdays and sleep length on weekdays relative to workdays; living with children was the only predictor for sleep length on weekdays; female gender was the only predictor for feeling of fatigue. The obtained odds ratios are identical to the corresponding ones from the univariate analyses (see Table 10). Living with children and employment were included in the final step (odds ratio: 1.70 with 95% confidence intervals from 1.15 to 2.52, and 0.571 with 95% confidence intervals from 0.375 to 0.866, respectively) for going to bed later than one likes.
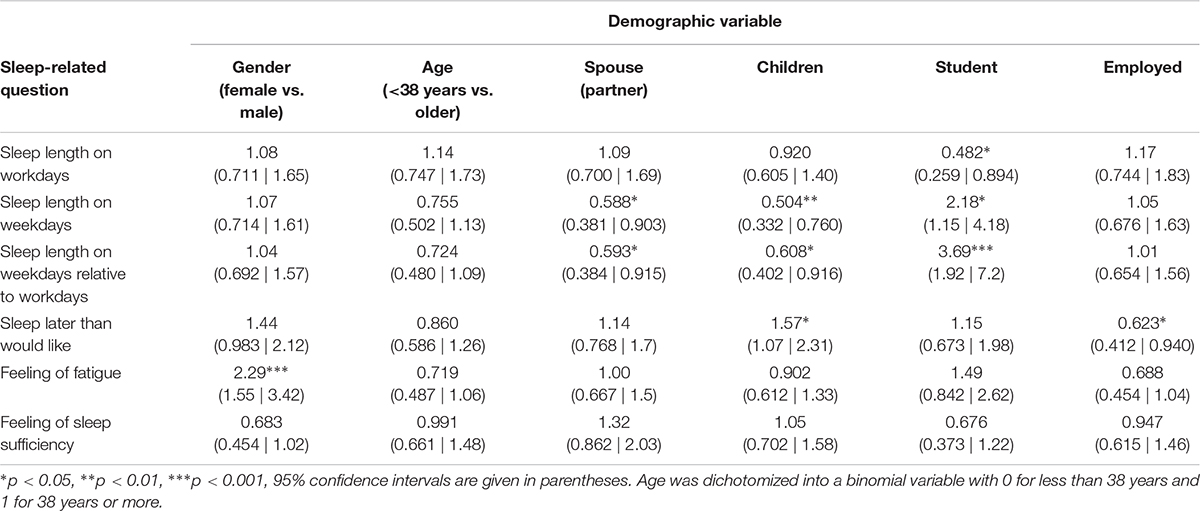
Table 10. Odds ratios with 95% confidence intervals for univariate ordinal logistic regressions predicting answers to sleep-related questions from demographic variables in Sample 2.
Discussion
In order to determine the psychometric properties of the Polish BPS version, we first tested whether its total score allows measurement of the general tendency to procrastinate going to bed, conceptualized as a uniform dispositional construct. Results of PCA on Sample 1 and CFA on Sample 2 consistently and clearly showed that responses to all individual items of the Polish BPS version are considerably intercorrelated and a substantial part of their variance could be attributed to one common latent variable: total BPS score. This justified computing the composite score of the Polish BPS version by averaging the values assigned to the responses to all individual items. All values of corrected item-rest correlations between responses to all individual items and total BPS score well above the recommended 0.3 threshold, showing that in both samples all the items were substantially related to the total scores computed from all other BPS items. The values of Cronbach’s α and McDonald’s ω for the whole scale were greater than 0.8 in both samples. It should also be noted that the values of Cronbach’s α obtained for the English (Kroese et al., 2014; Sirois et al., 2019), Dutch (Kroese et al., 2016a), and Flemish (Exelmans and Van den Bulck, 2017) BPS versions were slightly higher than Cronbach’s α for the Polish BPS version in Sample 2, which was drawn from the general population. However, the values of the internal consistency indicators obtained in our samples for the Polish BPS version are high enough to allow reliable qualitative measurement of the general tendency to procrastinate going to bed with a relatively low error of measurement. The use of the Polish BPS version also makes it possible to differentiate between subjects with varying levels of this behavioral tendency.
We also proposed two cut-off points for discriminating low, middle and high levels of bedtime procrastination, based on determining values distant from the scale midpoint by the halfwidth of the 95% confidence interval for the measurement error. By applying the given cut-off points, the level of bedtime procrastination of about one-third of respondents recruited from the general population were classified as high, whereas about half as many subjects demonstrated a low level of bedtime procrastination. The slightly left-skewed distribution of the total score of the Polish BPS version may be related to a possible ceiling effect which limits its suitability for differentiation between subjects with very high severity of bedtime procrastination. In further studies, this limitation could possibly be overcome by the extending the response format to a Likert scale with more than five points and modifying the anchor labels if necessary, in surveys conducted on subjects with very high bedtime procrastination. Moderate correlation in test–retest comparisons of BPS scores indicates relatively temporal stability of bedtime procrastination and suggests its dispositional status, but on the other hand it shows that it can be partially subject to change.
We found that in the Polish sample the level of bedtime procrastination was significantly higher by about half the standard deviation compared to international English-speaking users of an internet crowdsourcing platform (Kroese et al., 2014), a representative sample of Dutch adults participating in internet surveys (Kroese et al., 2016a) and a randomly selected sample of adults residing in Flanders, Belgium (Exelmans and Van den Bulck, 2017). In view of the similarity of our research methodology to the methodology of previous studies (Kroese et al., 2014, 2016a; Exelmans and Van den Bulck, 2017), there are no grounds for attributing the higher level of bedtime procrastination among Poles to any methodological issues. On the other hand, the mean BPS scores in the Polish sample do not differ substantially from the results reported by Sirois et al. (2019) for study 1 and study 2: M = 3.23 ± 0.89, and M = 3.05 ± 0.90, respectively. Further research on the role of socioeconomic and psychological factors in bedtime and sleep-related behaviors is needed to explain the relatively high level of bedtime procrastination found in the Polish sample, which was drawn from the general population.
Average BPS scores were related to reduced sleep length on workdays, increased sleep length on weekdays relative to workdays, a feeling of sleep insufficiency, and a feeling of fatigue. Despite the fact that responses to sleep-related questions showed several relationships with demographic variables, the results of multivariate analyses indicate that the impact of bedtime procrastination on self-reported sleep outcomes cannot be attributed to demographic variables.
In this study, we also attempted to delineate more precisely the differences in bedtime procrastination between demographic groups. We found a relatively low negative correlation between BPS scores and age (ρ = −0.120). A decrease in the mean level of bedtime procrastination with age was also reported several times in the results of previous studies. Significantly different-from-zero negative correlation coefficients between BPS scores and age were found by Exelmans and Van den Bulck (2017) in a sample of inhabitants of Flanders (r = −0.404), and by Sirois et al. (2019) in a sample of internet users (r = −0.32). A negative correlation between BPS scores and age (r = −0.11) was also obtained in a sample of users of an internet crowdsourcing platform (Kroese et al., 2014), but due to the relatively low sample size it did not meet the criterion of statistical significance. In addition, a negative correlation (r = −0.19) between age and bedtime procrastination assessed by means of sleep diaries was found in employees working in various industries (Kühnel et al., 2018). Apart from confirming a negative correlation between BPS scores and age, we also managed to capture the more detailed pattern of the associations between bedtime procrastination and age. The highest average BPS scores were observed in the group of the youngest respondents, with a weak decreasing tendency for the middle-aged group, followed by a relative stabilization of the scores around the scale midpoint in older participants (see Figure 4).
Place of residence, highest completed level of education, living with a spouse or partner, and living with children were not significantly associated with BPS scores. On raw BPS scores, females scored about one-fourth of the standard deviation higher than males. Higher BPS scores were obtained for a group of students in comparison to a group of non-student subjects, and lower BPS scores were found in working respondents in comparison to non-working respondents. Female gender and being a student appeared to be the best demographic predictors of high BPS scores in the analysis with backward elimination of parameters in the multivariate regression model, therefore the effects of age and employment could be explained by the impact of being a student because being young and unemployed considerably overlaps with being a student.
Although females scored slightly higher than males in the raw BPS scores, when taking into account the odds ratio for the effect of gender on categorized BPS scores (OR = 2.11 in univariate analysis, and OR = 2.17 in multivariate analysis) it should be noted that the chance of severe bedtime procrastination is more than twice as high for females than for males. Differences between the sexes in delaying sleep already appear in school children. Kubiszewski′s et al. (2014) research has shown that 70% of girls and only 55% of boys among adolescents aged 11–15 go to sleep after 10 p.m. The earlier age of onset of bedtime delay in girls than in boys may increase the risk of formation of poor sleep habits, thus leading to sleep deprivation. This problem is all the more important due to the fact that women report a greater need for sleep than men (Oginska and Pokorski, 2006; Cheng et al., 2012) and they also have a higher risk than men of developing cardiovascular and metabolic disease (Cappuccio et al., 2007; Ferrie et al., 2007; Suarez, 2008; Kronholm et al., 2011; Lyytikäinen et al., 2011; Miller, 2015) and depression (Armitage and Hoffmann, 2001; Krystal, 2004) as a result of sleep deprivation. A higher prevalence of sleep disorders and poorer sleep quality in women compared to men have been reported in several studies and attributed to biological factors (Manber and Armitage, 1999; Zhang et al., 2011, 2014; Nowakowski et al., 2013). Our research suggests that, along with biological factors, sleep-related behaviors, i.e., voluntarily delaying going to sleep without valid external reasons, could also be an important determinant of the poorer sleep quality in women.
The results of our research for the first time show that students have a higher level of bedtime procrastination than non-students. As can be inferred from effect of being a student on categorized BPS scores (OR = 1.99 in univariate analysis, and OR = 2.04 in multivariate analysis), the chance of severe bedtime procrastination is about twice as high for a group of students than for subjects who are not students. These findings are in line with much research that reports a considerable degree of sleep problems and poor sleep quality in students (Kang and Chen, 2009; Cheng et al., 2012). There are several possible reasons for the occurrence of sleep problems in students, including anxiety and depression (Moo-Estrella et al., 2005; Eller et al., 2006). However, as our research shows, an important reason for poor sleep quality in students may also be inappropriate sleep behavior. Students generally have poor health habits, including irregular meal patterns and high consumption of recreational drugs, both of which can impair sleep hygiene (Brown et al., 2002; Brick et al., 2010; Spanos and Hankey, 2010). Previous researchers have shown a high incidence of irregular sleeping habits and insufficient sleep in students (Kang and Chen, 2009). The research of Manber et al. (1996) revealed that regularizing sleep-wake schedules in students with irregular sleep schedules and excessive daytime sleepiness resulted in increased sleep efficiency and improved alertness compared to the control group. The lack of a regular sleep-wake schedule requires more attentional control and effort to regulate sleep behavior, which may be difficult, especially in the evening when self-regulatory resources are exhausted (Hofmann et al., 2012). Self-control allows delay of gratification in order to achieve a long-term goal, so it is crucial for the implementation of health intentions related to diet, physical activity or sleep. A number of studies have shown that self-control is negatively associated with bedtime procrastination (Kroese et al., 2014, 2016a; Exelmans and Van den Bulck, 2017; Kadzikowska-Wrzosek, 2018b). Self-control is important for behavior that allows you to go to sleep at the right time to get enough sleep; for example, refraining from drinking caffeinated beverages in the evening or engaging in raising the level of stimulation by watching exciting movies (Nauts and Kroese, 2017). Studies show that most bedtime procrastinators’ habitual leisure activities, such as watching TV or using other electronic media, can cause sleep delay (Kroese et al., 2014). Exelmans and Van den Bulck (2017) found positive correlations between evening television viewing and bedtime procrastination and between bedtime procrastination and deficient self-regulation of television viewing. These results suggest that low self-regulation makes it difficult to stop using electronic media when going to sleep, which leads to delayed sleep. Having good sleep habits, including regular bedtimes and waketimes, reduces the risk of self-regulation failure, especially in situations in which it is weakened due to tiredness when going to bed at night. Habit formation can be supported by self-regulation techniques such as intention implementation. Loft and Cameron (2013) found that the implementation intention intervention can improve sleep behavior and in turn improve sleep quality in workers. The effectiveness of the implementation intention and other interventions that normalize the rhythm of the day in students – thus forming proper sleep habits and preventing bedtime delay – requires further research.
Conclusion
The Polish BPS version has psychometric properties similar to the original version. It allows reliable measurement of bedtime procrastination, conceptualized as a uniform construct. The level of bedtime procrastination among Poles is highly varied, with high scores clearly being much more common than low ones. Average BPS scores were related to worse self-reported sleep outcomes. In the youngest subjects, the highest averaged BPS scores were observed with a slightly decreasing tendency and subsequent stabilization around the scale midpoint in middle-aged and older respondents. Average total BPS scores were also dependent on the employment status of respondents. However, female gender and being a student were found to be the best demographic predictors of high BPS scores in the multivariate regression model, which indicates that the effects of age and employment status on bedtime procrastination stems from the fact, that students are younger and usually are not employed. Students should be considered as the group most vulnerable to bedtime procrastination; thus, they may require further research, as well as health promotion interventions to correct their sleep-related habits and attitudes.
Data Availability
The data supporting the findings of this study will be made available by the authors to qualified researchers upon reasonable request.
Ethics Statement
The studies involving human participants were reviewed and approved by the Faculty Committee for Research Ethics, Faculty of Pedagogy, Pedagogical University of Kraków. The patients/participants provided their written informed consent to participate in this study.
Author Contributions
RH-K and LK contributed to the concept and design of the study, administration of the surveys, and revision of the manuscript, interpreted the results, wrote the sections of the manuscript, and read and approved the submitted version. LK designed and maintained the database, and performed the statistical analysis.
Funding
This work was supported by funds for statutory research from the Faculty of Pedagogy, Pedagogical University of Kraków, granted on the basis of the application number BS-438/P/2018.
Conflict of Interest Statement
The authors declare that the research was conducted in the absence of any commercial or financial relationships that could be construed as a potential conflict of interest.
References
Abdoli, N., Farnia, V., Delavar, A., Dortaj, F., Esmaeili, A., Farrokhi, N., et al. (2015a). Mental health status, aggression, and poor driving distinguish traffic offenders from non-offenders but health status predicts driving behavior in both groups. Neuropsychiatr. Dis. Treat. 11, 2063–2070. doi: 10.2147/NDT.S89916
Abdoli, N., Farnia, V., Delavar, A., Esmaeili, A., Dortaj, F., Farrokhi, N., et al. (2015b). Poor mental health status and aggression are associated with poor driving behavior among male traffic offenders. Neuropsychiatr. Dis. Treat. 11, 2071–2078. doi: 10.2147/NDT.S88835
Abdoli, N., Sadeghi Bahmani, D., Farnia, V., Alikhani, M., Golshani, S., Holsboer-Trachsler, E., et al. (2018). Among substance-abusing traffic offenders, poor sleep and poor general health predict lower driving skills but not slower reaction times. Psychol. Res. Behav. Manag. 11, 557–566. doi: 10.2147/PRBM.S173946
Armitage, R., and Hoffmann, R. F. (2001). Sleep EEG, depression and gender. Sleep Med. Rev. 5, 237–246. doi: 10.1053/smrv.2000.0144
Baker, F. C., and Driver, H. S. (2007). Circadian rhythms, sleep, and the menstrual cycle. Sleep Med. 8, 613–622. doi: 10.1016/j.sleep.2006.09.011
Beckerman, H., Roebroeck, M. E., Lankhorst, G. J., Becher, J. G., Bezemer, P. D., and Verbeek, A. L. (2001). Smallest real difference, a link between reproducibility and responsiveness. Qual. Life Res. 10, 571–578. doi: 10.1023/A:1013138911638
Bliwise, D. L. (2004). Sleep disorders in Alzheimer’s disease and other dementias. Clin. Cornerstone 6, 16–28. doi: 10.1016/S1098-3597(04)90014-90012
Błońska, B. K., and Gotlib, J. (2012). Występowanie zaburzeń snu wśród studentów Prevalence of sleep disorders among students [prevalence of sleep disorders among students]. Przegląd Medyczny Uniwersytetu Rzeszowskiego i Narodowego Instytutu Leków w Warszawie 4, 485–497.
Boguszewski, R. (2016). Zdrowie i prozdrowotne zachowania Polaków [Health and health-related behavior of Poles]. Centrum Badania Opinii Społecznej: Komunikat z Badań 138/1016, 1–15. Available at: https://www.cbos.pl/SPISKOM.POL/2016/K_138_16.PDF (Accessed August 18, 2019).
Brand, S., Kirov, R., Kalak, N., Gerber, M., Pühse, U., Lemola, S., et al. (2015). Perfectionism related to self-reported insomnia severity, but not when controlled for stress and emotion regulation. Neuropsychiatr. Dis. Treat. 11, 263–271. doi: 10.2147/NDT.S74905
Brick, C. A., Seely, D. L., and Palermo, T. M. (2010). Association between sleep hygiene and sleep quality in medical students. Behav. Sleep Med. 8, 113–121. doi: 10.1080/15402001003622925
Brislin, R. W. (1986). “The wording and translation of research instruments,” in Field Methods in Cross-Cultural Research Cross-Cultural Research and Methodology Series, eds W. J. Lonner and J. W. Berry (Thousand Oaks, CA: Sage Publications, Inc), 137–164.
Brown, F. C., Buboltz, W. C., and Soper, B. (2002). Relationship of sleep hygiene awareness, sleep hygiene practices, and sleep quality in university students. Behav. Med. 28, 33–38. doi: 10.1080/08964280209596396
Buboltz, W. C., Brown, F., and Soper, B. (2001). Sleep habits and patterns of college students: a preliminary study. J. Am. Coll. Health 50, 131–135. doi: 10.1080/07448480109596017
Cain, N., and Gradisar, M. (2010). Electronic media use and sleep in school-aged children and adolescents: a review. Sleep Med. 11, 735–742. doi: 10.1016/j.sleep.2010.02.006
Cappuccio, F. P., Stranges, S., Kandala, N.-B., Miller, M. A., Taggart, F. M., Kumari, M., et al. (2007). Gender-specific associations of short sleep duration with prevalent and incident hypertension. Hypertension 50, 693–700. doi: 10.1161/HYPERTENSIONAHA.107.095471
Cheng, S. H., Shih, C.-C., Lee, I. H., Hou, Y.-W., Chen, K. C., Chen, K.-T., et al. (2012). A study on the sleep quality of incoming university students. Psychiatr. Res. 197, 270–274. doi: 10.1016/j.psychres.2011.08.011
Connor, J. (2002). Driver sleepiness and risk of serious injury to car occupants: population based case control study. BMJ 324, 1125–1125. doi: 10.1136/bmj.324.7346.1125
Connor, J., Whitlock, G., Norton, R., and Jackson, R. (2001). The role of driver sleepiness in car crashes: a systematic review of epidemiological studies. Accid. Anal. Prev. 33, 31–41. doi: 10.1016/S0001-4575(00)00013-10
Cronbach, L. J. (1951). Coefficient alpha and the internal structure of tests. Psychometrika 16, 297–334. doi: 10.1007/BF02310555
Curcio, G., Ferrara, M., and De Gennaro, L. (2006). Sleep loss, learning capacity and academic performance. Sleep Med. Rev. 10, 323–337. doi: 10.1016/j.smrv.2005.11.001
Diedenhofen, B., and Musch, J. (2016). Cocron: a web interface and r package for the statistical comparison of cronbach’s alpha coefficients. Int. J. Internet Sci. 11, 51–60.
Eller, T., Aluoja, A., Vasar, V., and Veldi, M. (2006). Symptoms of anxiety and depression in Estonian medical students with sleep problems. Depress. Anxiety 23, 250–256. doi: 10.1002/da.20166
Exelmans, L., and Van den Bulck, J. (2017). Glued to the tube. Commun. Res. 0, 1–23. doi: 10.1177/0093650216686877
Fernandez-Mendoza, J., Shea, S., Vgontzas, A. N., Calhoun, S. L., Liao, D., and Bixler, E. O. (2015). Insomnia and incident depression: role of objective sleep duration and natural history. J. Sleep Res. 24, 390–398. doi: 10.1111/jsr.12285
Ferrie, J. E., Shipley, M. J., Cappuccio, F. P., Brunner, E., Miller, M. A., Kumari, M., et al. (2007). A prospective study of change in sleep duration: associations with mortality in the whitehall II cohort. Sleep 30, 1659–1666. doi: 10.1093/sleep/30.12.1659
Gangwisch, J. E., Heymsfield, S. B., Boden-Albala, B., Buijs, R. M., Kreier, F., Pickering, T. G., et al. (2006). Short sleep duration as a risk factor for hypertension. Hypertension 47, 833–839. doi: 10.1161/01.HYP.0000217362.34748.e0
Gaultney, J. F. (2010). The prevalence of sleep disorders in college students: impact on academic performance. J. Am. Coll. Health 59, 91–97. doi: 10.1080/07448481.2010.483708
Gradisar, M., Wolfson, A. R., Harvey, A. G., Hale, L., Rosenberg, R., and Czeisler, C. A. (2013). The sleep and technology use of Americans: findings from the national sleep foundation’s 2011 sleep in America poll. J. Clin. Sleep Med. 9, 1291–1299. doi: 10.5664/jcsm.3272
Haack, M., and Mullington, J. M. (2005). Sustained sleep restriction reduces emotional and physical well-being. Pain 119, 56–64. doi: 10.1016/j.pain.2005.09.011
Harvey, A. G. (2002). A cognitive model of insomnia. Behav. Res. Ther. 40, 869–893. doi: 10.1016/S0005-7967(01)00061-64
Harvey, A. G., and Payne, S. (2002). The management of unwanted pre-sleep thoughts in insomnia: distraction with imagery versus general distraction. Behav. Res. Ther. 40, 267–277. doi: 10.1016/S0005-7967(01)00012-12
Harvill, L. M. (1991). An NCME instructional module on standard error of measurement. Educ. Meas. 10, 33–41. doi: 10.1111/j.1745-3992.1991.tb00195.x
Herzog-Krzywoszanska, R., and Krzywoszanski, L. (2017). Polska adaptacja Bedtime Procrastination Scale [Polish Adaptation of Bedtime Procrastination Scale]. in Kongres Polskiego Towarzystwa Psychologicznego: Psychologia Dla Zdrowia Osoby I Społeczeństwa: Księga Abstraktów. [Congress of the Polish Psychological Association: Psychology for the Health of a Person and Society: Abstract Book]. Gdańsk: Polskie Towarzystwo Psychologiczne.
Herzog-Krzywoszanska, R., and Krzywoszanski, L. (2019). Sleep disorders in Huntington’s disease. Front. Psychiatr. 10:221. doi: 10.3389/fpsyt.2019.00221
Hofmann, W., Friese, M., and Wiers, R. W. (2008). Impulsive versus reflective influences on health behavior: a theoretical framework and empirical review. Health Psychol. Rev. 2, 111–137. doi: 10.1080/17437190802617668
Hofmann, W., Vohs, K. D., and Baumeister, R. F. (2012). What people desire, feel conflicted about, and try to resist in everyday life. Psychol. Sci. 23, 582–588. doi: 10.1177/0956797612437426
Irish, L. A., Kline, C. E., Gunn, H. E., Buysse, D. J., and Hall, M. H. (2015). The role of sleep hygiene in promoting public health: a review of empirical evidence. Sleep Med. Rev. 22, 23–36. doi: 10.1016/j.smrv.2014.10.001
Kadzikowska-Wrzosek, R. (2018a). Insufficient sleep among adolescents: the role of bedtime procrastination, chronotype and autonomous vs. controlled motivational regulations. Curr. Psychol. 1–10. doi: 10.1007/s12144-018-9825-9827
Kadzikowska-Wrzosek, R. (2018b). Self-regulation and bedtime procrastination: the role of self-regulation skills and chronotype. Pers. Indiv. Dif. 128, 10–15. doi: 10.1016/j.paid.2018.02.015
Kang, J.-H., and Chen, S.-C. (2009). Effects of an irregular bedtime schedule on sleep quality, daytime sleepiness, and fatigue among university students in Taiwan. BMC Public Health 9:248. doi: 10.1186/1471-2458-9-248
Kasperczyk, J., and Jośko, J. (2012). Analiza czynników odpowiedzialnych za złą jakość snu u studentów śląskiego uniwersytetu medycznego [The analysis of factors responsible for poor sleep quality in silesian medical school students]. Hygeia Public Health 47, 191–195.
Kroese, F. M., De Ridder, D. T. D., Evers, C., and Adriaanse, M. A. (2014). Bedtime procrastination: introducing a new area of procrastination. Front. Psychol. 5:611. doi: 10.3389/fpsyg.2014.00611
Kroese, F. M., Evers, C., Adriaanse, M. A., and de Ridder, D. T. (2016a). Bedtime procrastination: a self-regulation perspective on sleep insufficiency in the general population. J. Health Psychol. 21, 853–862. doi: 10.1177/1359105314540014
Kroese, F. M., Nauts, S., Kamphorst, B. A., Anderson, J. H., and de Ridder, D. T. D. (2016b). “Bedtime procrastination: a behavioral perspective on sleep insufficiency,” in Procrastination, Health, and Well-Being, eds P. Tim and S. Fuschia (Amsterdam: Elsevier), 93–119. doi: 10.1016/b978-0-12-802862-9.00005-0
Kronholm, E., Laatikainen, T., Peltonen, M., Sippola, R., and Partonen, T. (2011). Self-reported sleep duration, all-cause mortality, cardiovascular mortality and morbidity in Finland. Sleep Med. 12, 215–221. doi: 10.1016/j.sleep.2010.07.021
Krystal, A. D. (2004). Depression and insomnia in women. Clin. Cornerstone 6, S19–S28. doi: 10.1016/S1098-3597(04)80022-X
Kubiszewski′s, V., Fontaine, R., Rusch, E., and Hazouard, E. (2014). Association between electronic media use and sleep habits: an eight-day follow-up study. Int. J. Adolesc. Youth 19, 395–407. doi: 10.1080/02673843.2012.751039
Kühnel, J., Syrek, C. J., and Dreher, A. (2018). Why don’t you go to bed on time? A daily diary study on the relationships between chronotype, self-control resources and the phenomenon of bedtime procrastination. Front. Psychol. 9:77. doi: 10.3389/fpsyg.2018.00077
Loft, M. H., and Cameron, L. D. (2013). Using mental imagery to deliver self-regulation techniques to improve sleep behaviors. Ann. Behav. Med. 46, 260–272. doi: 10.1007/s12160-013-9503-9509
Lyles, R. H., and Kupper, L. L. (1999). A note on confidence interval estimation in measurement error adjustment. Am. Stat. 53, 247–253. doi: 10.1080/00031305.1999.10474467
Lyytikäinen, P., Rahkonen, O., Lahelma, E., and Lallukka, T. (2011). Association of sleep duration with weight and weight gain: a prospective follow-up study. J. Sleep Res. 20, 298–302. doi: 10.1111/j.1365-2869.2010.00903.x
Manber, R., Bootzin, R. R., Acebo, C., and Carskadon, M. A. (1996). The effects of regularizing sleep-wake schedules on daytime sleepiness. Sleep 19, 432–441. doi: 10.1093/sleep/19.5.432
Mann, T., de Ridder, D., and Fujita, K. (2013). Self-regulation of health behavior: social psychological approaches to goal setting and goal striving. Health Psychol. 32, 487–498. doi: 10.1037/a0028533
Matsunaga, M. (2010). How to factor-analyze your data right: do’s, don’ts, and how-To’s. Int. J. Psychol. Res. 3, 97–110.
Miller, M. A. (2015). The role of sleep and sleep disorders in the development, diagnosis, and management of neurocognitive disorders. Front. Neurol. 6:224. doi: 10.3389/fneur.2015.00224
Ming, X., Koransky, R., Kang, V., Buchman, S., Sarris, C. E., and Wagner, G. C. (2011). Sleep insufficiency, sleep health problems and performance in high school students. Clin. Med. Insights 5, 71–79. doi: 10.4137/CCRPM.S7955
Mong, J. A., and Cusmano, D. M. (2016). Sex differences in sleep: impact of biological sex and sex steroids. Philos. Trans. R. Soc. Lond. B Biol. Sci. 371:20150110. doi: 10.1098/rstb.2015.0110
Moo-Estrella, J., Pérez-Benítez, H., Solís-Rodríguez, F., and Arankowsky-Sandoval, G. (2005). Evaluation of depressive symptoms and sleep alterations in college students. Arch. Med. Res. 36, 393–398. doi: 10.1016/j.arcmed.2005.03.018
National Sleep Foundation, (2008). Sleep in America Poll. Summary of Findings. Available at: https://www.sleepfoundation.org/sites/default/files/2018-11/2008_POLL_SOF.pdf (accessed August 18, 2019).
Nauts, S., and Kroese, F. M. (2017). “The role of self-control in sleep behavior,” in Routledge International Handbook of Self-Control in Health and Well-Being, eds K. F. D. de Ridder and M. Adriaanse (Abingdon: Routledge), 288–299. doi: 10.4324/9781315648576-23
Nowakowski, S., Meers, J., and Heimbach, E. (2013). Sleep and women’s health. Sleep Med. Res. 4, 1–22. doi: 10.17241/smr.2013.4.1.1
Oginska, H., Mojsa-Kaja, J., Fafrowicz, M., and Marek, T. (2014). Measuring individual vulnerability to sleep loss-the CHICa scale. J. Sleep Res. 23, 341–348. doi: 10.1111/jsr.12115
Oginska, H., and Pokorski, J. (2006). Fatigue and mood correlates of sleep length in three age-social groups: school children, students, and employees. Chronobiol. Int. 23, 1317–1328. doi: 10.1080/07420520601089349
Ondo, W. G., Dat Vuong, K., Khan, H., Atassi, F., Kwak, C., and Jankovic, J. (2001). Daytime sleepiness and other sleep disorders in Parkinson’s disease. Neurology 57, 1392–1396. doi: 10.1212/WNL.57.8.1392
Owens, H., Christian, B., and Polivka, B. (2017). Sleep behaviors in traditional-age college students. J. Am. Assoc. Nurse Pract. 29, 695–703. doi: 10.1002/2327-6924.12520
Pien, G. W., and Schwab, R. J. (2004). Sleep disorders during pregnancy. Sleep 27, 1405–1417. doi: 10.1093/sleep/27.7.1405
Rideout, V. J., Foehr, U. G., and Roberts, D. F. (2010). Generation M2. Media in the Lives of 8- to 18-Year-Olds. Menlo Park, CA: A Kaiser Family Foundation Study.
Roane, B. M., and Taylor, D. J. (2008). Adolescent insomnia as a risk factor for early adult depression and substance abuse. Sleep 31, 1351–1356.
Rosseel, Y. (2012). lavaan: an R package for structural equation modeling. J. Stat. Softw. 48, 1–36. doi: 10.18637/jss.v048.i02
Shaver, J., Giblin, E., Lentz, M., and Lee, K. (1988). Sleep patterns and stability in perimenopausal women. Sleep 11, 556–561. doi: 10.1093/sleep/11.6.556
Sirois, F. M., Nauts, S., and Molnar, D. S. (2019). Self-compassion and bedtime procrastination: an emotion regulation perspective. Mindfulness 10, 434–445. doi: 10.1007/s12671-018-0983-983
Spanos, D., and Hankey, C. R. (2010). The habitual meal and snacking patterns of university students in two countries and their use of vending machines. J. Hum. Nutr. Diet. 23, 102–107. doi: 10.1111/j.1365-277X.2009.01005.x
Strine, T. W., and Chapman, D. P. (2005). Associations of frequent sleep insufficiency with health-related quality of life and health behaviors. Sleep Med. 6, 23–27. doi: 10.1016/j.sleep.2004.06.003
Suarez, E. C. (2008). Self-reported symptoms of sleep disturbance and inflammation, coagulation, insulin resistance and psychosocial distress: evidence for gender disparity. Brain Behav. Immun. 22, 960–968. doi: 10.1016/j.bbi.2008.01.011
Swanson, L. M., Arnedt, J. T., Rosekind, M. R., Belenky, G., Balkin, T. J., and Drake, C. (2011). Sleep disorders and work performance: findings from the 2008 national sleep foundation sleep in America poll. J. Sleep Res. 20, 487–494. doi: 10.1111/j.1365-2869.2010.00890.x
Szentkirályi, A., Madarász, C. Z., and Novák, M. (2009). Sleep disorders: impact on daytime functioning and quality of life. Expert Rev. Pharmacoecon. Outcomes Res. 9, 49–64. doi: 10.1586/14737167.9.1.49
Tangney, J. P., Baumeister, R. F., and Boone, A. L. (2004). High self-control predicts good adjustment, less pathology, better grades, and interpersonal success. J. Pers. 72, 271–324. doi: 10.1111/j.0022-3506.2004.00263.x
Trockel, M. T., Barnes, M. D., and Egget, D. L. (2000). Health-related variables and academic performance among first-year college students: implications for sleep and other behaviors. J. Am. Coll. Health 49, 125–131. doi: 10.1080/07448480009596294
Wolfson, A. R., and Carskadon, M. A. (2003). Understanding adolescent’s sleep patterns and school performance: a critical appraisal. Sleep Med. Rev. 7, 491–506. doi: 10.1016/S1087-0792(03)90003-90007
Zhang, J., Lam, S.-P., Li, S. X., Ma, R. C. W., Kong, A. P. S., Chan, M. H. M., et al. (2014). A community-based study on the association between insomnia and hypothalamic-pituitary-adrenal axis: sex and pubertal influences. J. Clin. Endocrinol. Metab. 99, 2277–2287. doi: 10.1210/jc.2013-3728
Zhang, J., Ma, R. C. W., Kong, A. P., So, W. Y., Li, A. M., Lam, S. P., et al. (2011). Relationship of sleep quantity and quality with 24-hour urinary catecholamines and salivary awakening cortisol in healthy middle-aged adults. Sleep 34, 225–233. doi: 10.1093/sleep/34.2.225
Appendix
Bedtime Procrastinationscale – Polish Version
W odniesieniu do każdego z poniższych stwierdzeń zdecyduj w jakim stopniu dotyczy ono ciebie, wybierając odpowiedź na skali od 1 (nigdy lub prawie nigdy) do 5 (zawsze lub prawie zawsze):
1. Chodzę spać później niż zamierzałem(am).
2. Kładę się spać wcześnie, jeśli muszę wstać wcześnie rano (reverse coded).
3. Gdy wieczorem nadchodzi czas gaszenia światła, robię to od razu (reverse coded).
4. Często wciąż robię inne rzeczy, kiedy jest już czas żeby pójść spać.
5. Łatwo rozpraszają mnie różne rzeczy, kiedy właściwie już chciał(a)bym iść spać.
6. Nie chodzę spać na czas.
7. Mam stałą porę kładzenia się spać, której się trzymam (reverse coded).
8. Chcę iść spać o właściwej porze, ale po prostu nie mogę.
9. Łatwo mogę przerwać to co robię, kiedy jest czas kłaść się spać (reverse coded).
Keywords: health behaviors, bedtime procrastination, intention-behavior gap, sleep outcomes, sleep insufficiency, demographic factors, gender differences, students
Citation: Herzog-Krzywoszanska R and Krzywoszanski L (2019) Bedtime Procrastination, Sleep-Related Behaviors, and Demographic Factors in an Online Survey on a Polish Sample. Front. Neurosci. 13:963. doi: 10.3389/fnins.2019.00963
Received: 31 May 2019; Accepted: 28 August 2019;
Published: 18 September 2019.
Edited by:
Amir H. Pakpour, Qazvin University of Medical Sciences, IranReviewed by:
Zainab Alimoradi, Qazvin University of Medical Sciences, IranSerge Brand, University Psychiatric Clinic Basel, Switzerland
Copyright © 2019 Herzog-Krzywoszanska and Krzywoszanski. This is an open-access article distributed under the terms of the Creative Commons Attribution License (CC BY). The use, distribution or reproduction in other forums is permitted, provided the original author(s) and the copyright owner(s) are credited and that the original publication in this journal is cited, in accordance with accepted academic practice. No use, distribution or reproduction is permitted which does not comply with these terms.
*Correspondence: Radoslawa Herzog-Krzywoszanska, cmFkb3NsYXdhLmhlcnpvZy1rcnp5d29zemFuc2thQHVwLmtyYWtvdy5wbA==
 Radoslawa Herzog-Krzywoszanska
 Lukasz Krzywoszanski