 Carmen Vidaurre
 Stefan Haufe
 Tania Jorajuría
 Klaus-Robert Müller
 Vadim V. Nikulin
- 1Department of Statistics, Computer Science and Mathematics, Public University of Navarre, Pamplona, Spain
- 2Berlin Center for Advanced Neuroimaging, Charité – Universitätsmedizin Berlin, Berlin, Germany
- 3Bernstein Center for Computational Neuroscience Berlin, Berlin, Germany
- 4Department of Machine Learning, Berlin University of Technology, Berlin, Germany
- 5Department of Artificial Intelligence, Korea University, Seoul, South Korea
- 6Max Planck Institute for Informatics, Saarbrücken, Germany
- 7Google Research, Brain Team, Berlin, Germany
- 8Department of Neurology, Max Planck Institute for Human Cognitive and Brain Sciences, Leipzig, Germany
- 9Center for Cognition and Decision Making, Institute for Cognitive Neuroscience, National Research University Higher School of Economics, Moscow, Russia
Brain-Computer Interfaces (BCIs) are systems that allow users to control devices using brain activity alone. However, the ability of participants to command BCIs varies from subject to subject. About 20% of potential users of sensorimotor BCIs do not gain reliable control of the system. The inefficiency to decode user's intentions requires the identification of neurophysiological factors determining “good” and “poor” BCI performers. One of the important neurophysiological aspects in BCI research is that the neuronal oscillations, used to control these systems, show a rich repertoire of spatial sensorimotor interactions. Considering this, we hypothesized that neuronal connectivity in sensorimotor areas would define BCI performance. Analyses for this study were performed on a large dataset of 80 inexperienced participants. They took part in a calibration and an online feedback session recorded on the same day. Undirected functional connectivity was computed over sensorimotor areas by means of the imaginary part of coherency. The results show that post- as well as pre-stimulus connectivity in the calibration recording is significantly correlated to online feedback performance in μ and feedback frequency bands. Importantly, the significance of the correlation between connectivity and BCI feedback accuracy was not due to the signal-to-noise ratio of the oscillations in the corresponding post and pre-stimulus intervals. Thus, this study demonstrates that BCI performance is not only dependent on the amplitude of sensorimotor oscillations as shown previously, but that it also relates to sensorimotor connectivity measured during the preceding training session. The presence of such connectivity between motor and somatosensory systems is likely to facilitate motor imagery, which in turn is associated with the generation of a more pronounced modulation of sensorimotor oscillations (manifested in ERD/ERS) required for the adequate BCI performance. We also discuss strategies for the up-regulation of such connectivity in order to enhance BCI performance.
1. Introduction
Brain Computer Interfaces (BCIs) were developed with the aim to offer patients suffering from loss of voluntary motor abilities devices to increase their capacity to control and communicate with their environment. BCIs based on the modulation of Sensorimotor Rhythms (SMR) use brain signals recorded during the performance of movement imagination or movement attempt to extract features that allow the classification of different motor imagery (MI) tasks (Neuper and Pfurtscheller, 2001; Wolpaw et al., 2002; Dornhege et al., 2007; Blankertz et al., 2008; Lemm et al., 2011; Müller-Putz et al., 2015; Sannelli et al., 2019). SMR are oscillatory signals generated in the sensorimotor areas of the cortex. In general, oscillatory signals are divided within frequency ranges. μ (9–14 Hz) and β (15–25 Hz) bands are particularly important for MI feature extraction (Neuper and Pfurtscheller, 2001; Wolpaw, 2007; Millán et al., 2010; Blankertz et al., 2011; Vidaurre et al., 2013; Sannelli et al., 2019).
A modulation of brain activity in μ and β bands has been observed in relation to motor execution (Salmelin and Hari, 1994; Pfurtscheller et al., 1997; Klopp et al., 2001), motor preparation (Pfurtscheller and Neuper, 1997; Pineda, 2005), somatosensory processing (Nikulin et al., 2007), and motor imagery (Neuper et al., 2005; Pfurtscheller et al., 2006; Bauer et al., 2015). Due to its malleability induced by diverse aspects of sensorimotor processing, μ rhythm serves as the main neuronal signal for sensorimotor BCI based on MI (Leuthardt et al., 2004; Buch et al., 2008; Waldert et al., 2008; Nierhaus et al., 2019; Sannelli et al., 2019).
Furthermore, the power of sensorimotor oscillations in the μ-band during resting state, has been established as a predictor of SMR-based BCI performance in two different large scale studies (Blankertz et al., 2010; Acqualagna et al., 2016). In addition, spatio-temporal features based on power values in μ and β bands of resting state data have also been used to predict BCI performance (Blankertz et al., 2010; Suk et al., 2014). Considering the power in other frequency bands, Ahn et al. (2013b) found that oscillatory activity at high θ and low α frequency were present in users who could not attain BCI control. Grosse-Wentrup et al. (2011) showed that γ activity in the fronto-parietal network is related to subject-specific MI performance variations. Also in Ahn et al. (2013a), it was found that pre-frontal γ band activity is positively correlated with MI performance, concluding that concentration as mental state could be used to predict MI performance. Finally, Robinson et al. (2018) showed that the resting state activation patterns such as γ power from pre-motor and posterior areas, and β power from posterior areas can be used to estimate BCI performance. In summary, power of brain oscillations at different frequency bands has been successfully established as BCI performance predictor. Importantly, these measures that are directly based on the power of oscillations, can explain BCI performance variations that are due to signal-to-noise ratio (SNR) changes. However, also other measures not directly defined by the power of oscillations, should be utilized in order to shed light into neurophysiological aspects of neuronal activity defining BCI performance.
Regarding such neurophysiological predictors, Samek et al. (2016) showed that long-range temporal correlations, estimated with Hurst exponents in calibration recordings, could predict the subsequent performance of feedback recordings. Also Zhang et al. (2015) could find a significant correlation between BCI performance and spectral entropy in the band between 0.5 and 14 Hz. In addition Hammer et al. (2012) could establish correlates of psychological variables and BCI performance.
From a structural perspective, Halder et al. (2011) showed that the number of activated voxels in the supplementary motor area of participants with good BCI performance was greater than for those demonstrating worse performance. Then, in Halder et al. (2013) it was shown that the structural integrity and myelination quality of deep white matter structures were significantly correlated to BCI performance. The structural white matter integrity as measured by fractional anisotropy (FA) has also been significantly correlated to idle α peak (Valdés-Hernández et al., 2010), which occurs in the same frequency range as μ rhythms. Finally, Zhang et al. (2016) showed that the fronto-parietal attention network (measured by MRI) is correlated to BCI performance using structural (cortical thickness) as well as functional connectivity features (eigenvector centrality and degree of centrality).
Regarding connectivity of non-invasive time-resolved signals, phase synchrony of magneto encephalographic (MEG) signals in the μ-band has also been related to BCI performance in Sugata et al. (2014). There, the authors found a significant correlation between the strength of the imaginary part of coherency (Nolte et al., 2004, 2008) and estimated (offline) BCI performance in data of 10 participants. In that work, imaginary coherency (iCOH) was estimated between M1 and motor association areas in the post-stimulus interval of the trial. Although this is an interesting result, the study presented two drawbacks: first, iCOH and BCI performance were estimated in exactly the same trials and the same time interval, and second, BCI performance was estimated by cross-validation of an off-line (without online feedback) session. Thus, the ability of iCOH to predict future BCI accuracy has not been established yet. Furthermore, those correlations were not tested against the influence of the power (signal-to-noise-ratio, SNR) of the signals, that as aforementioned has been shown to significantly correlate to BCI performance. Additionally, Bayraktaroglu et al. (2013) showed that SNR might influence coherency values, with large amplitudes of oscillatory signals (large power, large SNR) producing larger iCOH values than lower ones. All this previous evidence indicates the need to study the effect of SNR on connectivity values. Finally, since the analysis was performed only in the post-stimulus interval, the question remains whether the relation between connectivity and BCI performance could also be extended to the pre-stimulus interval, which in turn would indicate that general trait-like connectivity patterns might define BCI performance.
The study presented here is in relation to our previous work published in Vidaurre et al. (2019). There, we observed in calibration data of 20 subjects that iCOH of pre and post-central gyri extracted during the post-stimulus interval of MI concurrent to submotor threshold neuromuscular electrical stimulation was significantly higher than that of MI. We also found that post-stimulus functional connectivity estimated using parameters extracted from MI data with simultaneous muscular stimulation was significantly correlated to calibration performance on a classifier trained with motor imagery and afferent signals. Here, we rather concentrate on motor imagery alone in the typical calibration vs. online recording paradigm. We aim to study whether pre- and post-stimulus imaginary coherence of within and/or across sensorimotor connectivity of calibration data can predict future feedback (online) performance in a group of 80 participants. Besides, and taking into account that the dynamics of the data are individual (Ricci et al., 2019; Tatti et al., 2019), we systematically control for the influence that SNR of the oscillatory signals might have on the extracted connectivity estimates.
2. Materials and Methods
2.1. Experimental Setup
Eighty healthy BCI-novices took part in the study (41 female, age 29.9 ± 11.5 years; 4 left-handed). Calibration and feedback runs were recorded in a single session.
The participants were sitting in a comfortable chair with arms lying relaxed on armrests. Brain activity was recorded using electroencephalographic (EEG) amplifiers (BrainAmp DC by Brain Products, Munich, Germany). For this study we selected 61 channels, referenced at nasion of an extended 10–20 system. The recorded signals were down-sampled at 100 Hz after filtering the data between 0.5 and 45 Hz. Calibration runs lasted approximately 15 min with three different visual cues, each of them representing one motor imagery task (left hand, right hand, or feet movement imagination). One run consisted of 25 trials of each class, 75 trials in total. Three runs of imagined movements were recorded, amounting to 225 trials. Each trial lasted approximately 8 s and started with a period of 2 s with a black fixation in the center of a gray screen. Then, an arrow appeared indicating the task to be performed (left or right for motor imagery classes left hand and right hand and downward for class feet) for 4 s, followed by a period of random length between 1.5 and 2 s, see Figure 1 top row for the trial timing of the calibration trials.
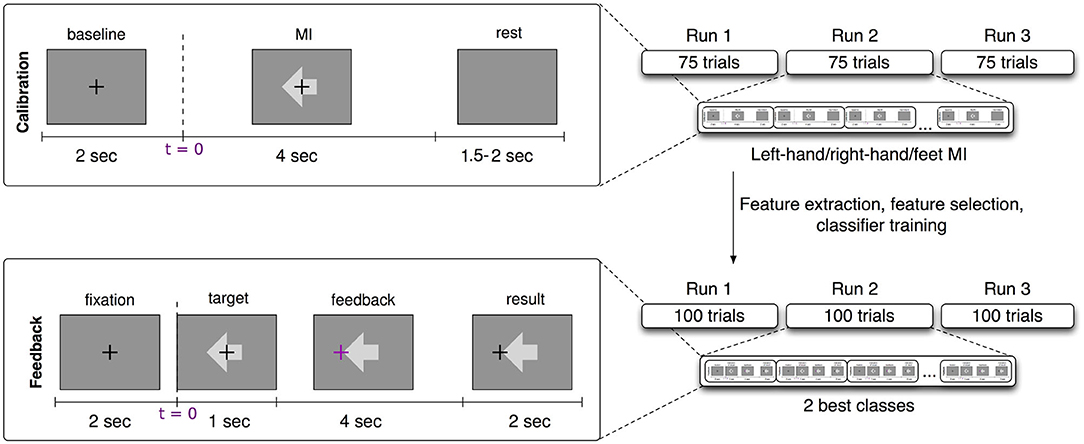
Figure 1. Experimental design of the BCI session. (Top left) Calibration trial timing. (Top right) Details of the calibration recording (3 runs of 75 trials each and 25 trials per class, left hand, right hand, and feet motor imagery). (Bottom left) Feedback trial timing. (Bottom right) Details of the feedback session (3 runs of 100 trials each and two subject-dependent classes).
After the calibration, participants performed three runs of 100 trials each with an online feedback paradigm. Each trial started with a period of 2 s displaying a black fixation cross in the center of a gray screen. Then an arrow appeared behind the cross to indicate the target direction of that trial (left or right for motor imagery classes left hand and right hand and downward for class feet). One second later the cross turned purple and started moving according to the classifier output. For the feet class, the cursor moved downwards, for left and right hands, it moved toward left or right respectively. After 4 s of cursor movement the cross froze at the final position and turned black again. Two seconds later the cross was reset to the center position and the next trial began. Hits or misses were counted according to this final position, but the score was only indicated during a break of 15 s after every block of 20 trials (see Figure 1, bottom row, for timing during feedback runs).
2.2. Feature Extraction and Classification
EEG from the calibration session was filtered in a subject-specific frequency band (feedback band), that was found using heuristics based on the spectra of channels located over the sensorimotor cortices according to the following procedure (Sannelli et al., 2019): the channels of the sensorimotor areas were filtered with a small laplacian derivation and the spectrum over the range 5–35 Hz computed. The spectra of each MI class were averaged across trials. To assess the class discriminability of each frequency bin, the signed r2-value (point biserial correlation coefficient) was used. The signed r2-value is a correlation coefficient between a real variable (in this case the band power in the frequency bin) and a dichotomous one containing class information. Signed r2-values were computed for each channel and frequency bin separately and smoothed with a sliding window of 3 Hz. The most discriminative frequency bins were selected such that the highest r2-value (across channels), and the lower and upper bound of the frequency band were iteratively enlarged until all frequency bins with the r2-value not lower than 1/3 of the initial highest r2-value were selected. The subject-specific time interval of maximal discrimination between classes was computed based on the event-related-desynchronization (ERD) and synchronization (ERS) of the signals of each channel during each class. The time-resolved ERD/ERS curves were computed as follows: the data were band-pass filtered at the previously selected subject-specific band. Then, the Hilbert transform (Clochon et al., 1996) was applied to obtain the amplitude envelope of the oscillations. EEG activity processed in this way was averaged across epochs separately for each class (left hand/right hand/feet MI). The time-resolved ERD curve was calculated for each channel over the sensorimotor cortex according to: ERD = 100*(POST−PRE)/PRE, where POST is the EEG amplitude at each sample of time in the post-stimulus interval and PRE is the average activity in the pre-stimulus interval (−500 to 0 ms). After selecting the subject-specific time interval using heuristics on the ERD/ERS values (see Sannelli et al., 2019), the EEG data were epoched to form post-stimulus filtered trials.
The band-pass filtered signals were then spatially filtered using common spatial pattern (CSP) analysis, (Blankertz et al., 2008; Sannelli et al., 2019). Then, log-variance features were computed for each trial of the calibration data. These features were used to train a binary linear classifier called Linear Discriminant Analysis (LDA) (Müller et al., 2003; Vidaurre et al., 2007; Lemm et al., 2011). The best classified pair of classes was chosen to provide feedback to the users, based on 5-fold chronological validation (Blankertz et al., 2011; Lemm et al., 2011; Sannelli et al., 2019). All the aforementioned methods are graphically summarized on the top row of Figure 2. Thirty participants performed feedback runs using classes left and right hand motor imagery, 34 participants used left hand vs. feet motor imagery and finally 16 users used right hand vs. feet motor imagery.
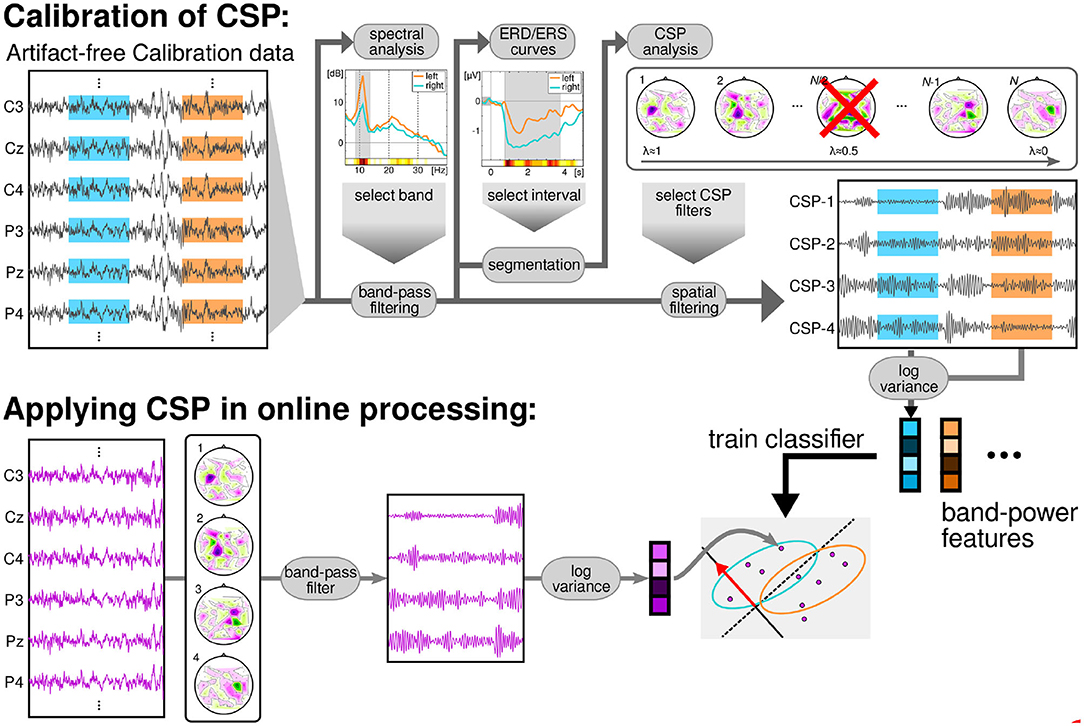
Figure 2. Data flow of the BCI session. The calibration data was processed to obtain a subject-specific band and time interval for the subsequent CSP-analysis. This analysis returned a subject-specific number of CSP filters, to compute log-variance features. The features were used to train a LDA classifier. During the feedback session, the EEG was filtered in time using the specific band and in space with the CSP filters. Then, log-variance features were computed in overlapping windows of 750 ms and classified with the previously trained LDA.
During the feedback recording, and in order to provide continuous feedback during a trial, the EEG signal was epoched in windows of 750 ms. These were overlapped such that every 40 ms the features were recomputed (applying CSP filters, band-pass filters, computing log-variance, and applying LDA, see Lemm et al., 2011; Sannelli et al., 2019). Thus, every 40 ms a classifier output was computed and this result added to the cursor position. Figure 2, bottom row, displays a graphical summary of the procedures followed during the feedback runs.
The trial was considered correctly classified if at the end task-time the cursor was located in the correct side (left/right/down for left hand/right hand/feet MI) of the screen. As the number of classified classes was two and they were balanced, the total accuracy after all feedback runs was then computed as:
2.3. Functional Connectivity Analysis
This analysis was performed to test whether online BCI performance can be associated, on a neurophysiological level, with the communication changes in the sensorimotor cortices. We detected these changes using functional connectivity metrics. Estimates of connectivity were computed in the pre-stimulus (−1,000 to 0 ms) as well as the post-stimulus (1,500–3,000 ms) intervals of the calibration data. Note that feedback datasets were not used to compute connectivity, but only to extract BCI performance. The EEG signals of those temporal intervals were mapped to the cortical surface using an accurate standardized volume conductor model of an average adult human head (Huang et al., 2016). Source reconstruction was implemented with eLORETA (Pascual-Marqui, 2007; Pascual-Marqui et al., 2011) using 4,502 sources locations. Then, four regions of interest were selected (left and right pre and post central gyri) corresponding to the sensorimotor areas of both hemispheres. Each precentral region consisted of 125 voxels, whereas the postcentral areas contained 112 voxels each. Regions were defined based on the Harvard- Oxford atlas included in FSL (Makris et al., 2006) and they were considered representative of primary motor and somatosensory cortices. We focused on these ROIs as our previous research showed that they were actively involved in sensorimotor BCI (Samek et al., 2016; Vidaurre et al., 2019). A graphical representation of the ROIs is shown in Figure 3. Visualization routines were adopted from Haufe and Ewald (2019).
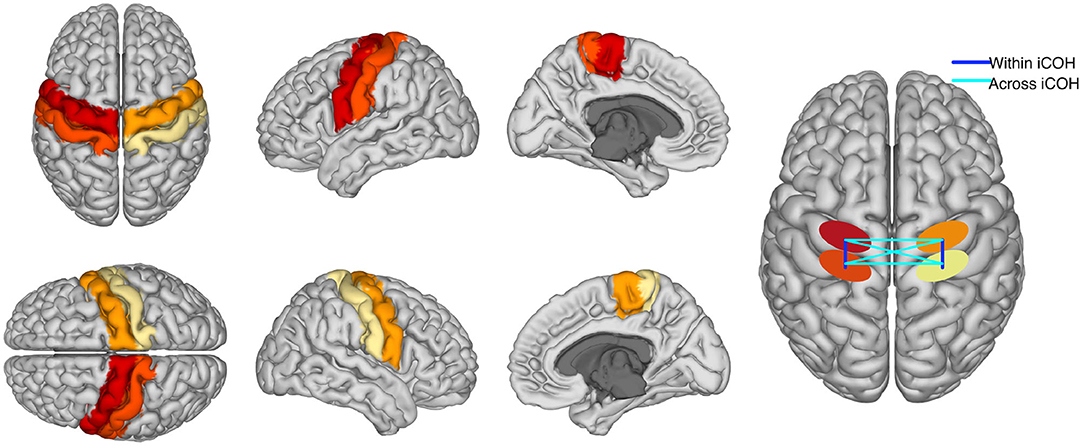
Figure 3. The first columns are a graphical representation of ROIs used to compute functional connectivity. Different colors represent each of the four regions. The fourth column is a graphical representation of “within” and “across” hemispheres connectivity between the four ROIs. Please, notice that iCOH is a functional and not a directed measure of connectivity.
Voxel activity along each of the three spatial orientation was normalized to unit variance. A singular value decomposition (SVD) of the standardized activity was performed for each region of interest. Then, only the three components of largest variability were retained. Functional connectivity was computed separately within each hemisphere and across hemispheres and it was evaluated using the imaginary part of coherency, iCOH. iCOH is an undirected connectivity measure between two time series that quantifies the presence of a stable non-zero phase delay at a given frequency (Nolte et al., 2004). Thus, one value of iCOH was obtained per frequency bin for each pair of SVD components, and rectified taking the absolute value. Absolute values were averaged across the pairs of components per region pair, classes, frequencies in the spectral bands (μ or feedback band). In particular, the connectivity between pre- and post-central gyri was separately computed for each hemisphere and averaged, providing a measure of “within hemispheres” functional connectivity. Furthermore, the pre- precentral gyri, post- postcentral gyri, and pre-postcentral gyri connectivity values across hemispheres were also computed and averaged, yielding an estimate of “across hemispheres” connectivity. A graphical representation of “within” and “across” hemispheres connectivity is visible in the last column of Figure 3.
This eventually yielded four connectivity values per subject: iCOH estimates for within or across hemispheres connectivity and in μ and feedback bands. We tested whether these values were significantly positively correlated to the online performance obtained with a different dataset of the same subject. For that, Spearman correlations between the previously described connectivity values and subsequent online feedback performance were computed. In summary, we tested whether two univariate variables were correlated using a correlation measure less sensitive to deviations of the variables from the normal distribution than the Pearson correlation (Mukaka, 2012). The corresponding p-values were corrected for multi-comparison using the False Discovery Rate (FDR) correction (Benjamini and Yekutieli, 2001). Additionally, and in order to further validate the significance of our results, we also performed permutation tests (Pernet et al., 2015). These tests consisted on shuffling the performance of the subjects randomly 1,000 times and calculating the correlation corresponding to the unshuffled connectivity values. Thus, we obtained 1,000 “shuffled” correlation values. Then we checked whether the corresponding correlation of unshuffled data was greater than the 95th percentile of the 1,000 “random” correlations set. If the 95th percentile was smaller than the corresponding correlation value, the result shows that the estimated correlation coefficient is significantly different from random (shuffled data) and thus a null hypothesis about the absence of correlation can be rejected.
2.4. Signal-to-Noise Ratio Estimation
It is known that connectivity values might be positively or negatively influenced by the signal to noise ratio of the EEG (Bayraktaroglu et al., 2013). This is because the phase portrait for the signal is more clearly defined for the signals with higher SNR and thus the phase difference (or phase locking) required for coherency does not suffer from phase-slips due to low SNR. Furthermore, BCI systems based on ERD/ERS effects depend on the suppression and recovery of oscillations in the μ and β bands. In different people, the post-stimulus intervals of power suppression and rebound might vary (Ricci et al., 2019; Tatti et al., 2019) and this may affect the SNR of the oscillations at different frequency bands. This in turn may influence the functional connectivity strength. Thus, in order to rule out that a potential significant correlation between connectivity estimates and BCI performance could be due to SNR (power) of the signals used to estimate connectivity, we partially regressed out an estimate of SNR in the temporal intervals of interest.
In order to obtain an estimate of SNR we applied the same procedure as in Blankertz et al. (2010), where the Power Spectral Densities (PSD) of interest and their corresponding decaying noise curves were modeled as follows: one curve was fitted for the noise baseline of the spectrum and another one was fitted to model the peaks of the PSD. The optimization procedure to find the fitting parameters is based on minimizing the L2-norm of the difference vector between the spectral PSD and the modeled parametric curves. The SNR estimate is the maximal difference between the maximum peak and the noise at the specific frequency value. An example of SNR estimation using PSD modeling is visible in Figure 4. More details of the whole procedure can be found in Blankertz et al. (2010).
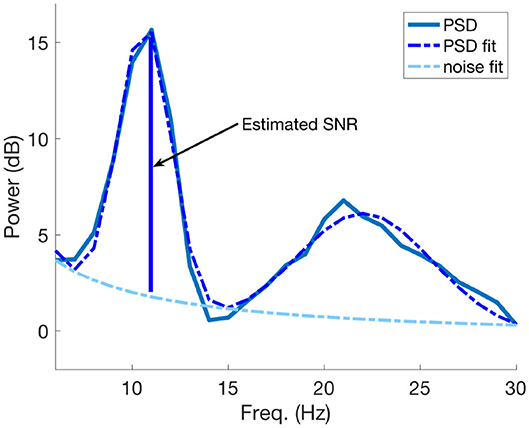
Figure 4. An example of SNR estimation using the PSD model described in Blankertz et al. (2010). The SNR estimate coincides with maximal difference between the greater fitted PSD peak and the estimated noise curve at the corresponding frequency value of the peak.
In particular for this study, we estimated the SNR from the fitted power spectral densities of the same SVD components used to compute iCOH (see section 2.3), in each time interval and for each class. The maximum difference between the maximal peak of the fitted PSD curve and a fit of the 1/f noise spectrum was taken as estimate of SNR of the signal. This estimation was performed separately for each SVD component of each ROI and for each class and then all those results corresponding to the same time interval were averaged.
3. Results
3.1. Estimation of BCI Feedback Performance
In this study we used a large dataset of 80 participants described in Sannelli et al. (2019). The mean accuracy (acc) over all users was 73.67±15.60%. From 80 participants, 66 of them performed above random (acc > 54.67% determined by the binomial inverse cumulative distribution).
The left panel of Figure 5 displays typical topographies of the two most discriminative CSP components. As explained in section 2.2, the corresponding CSP filters determine the most discriminative features used to train the classifier (calibration session) and also to classify EEG data during the feedback session. The middle panel of Figure 5 shows power-spectral densities of CSP components with typical peaks in the μ (10 Hz) and β (20 Hz) frequency ranges. Finally, the right panel of the figure displays time-resolved ERD/ERS curves of the amplitude of μ oscillations during left/right hand motor imagery (see section 2.2): note stronger attenuation of the oscillations in the left and right hemispheres for the imagery of right (upper row) and left hand movements (bottom row), respectively.
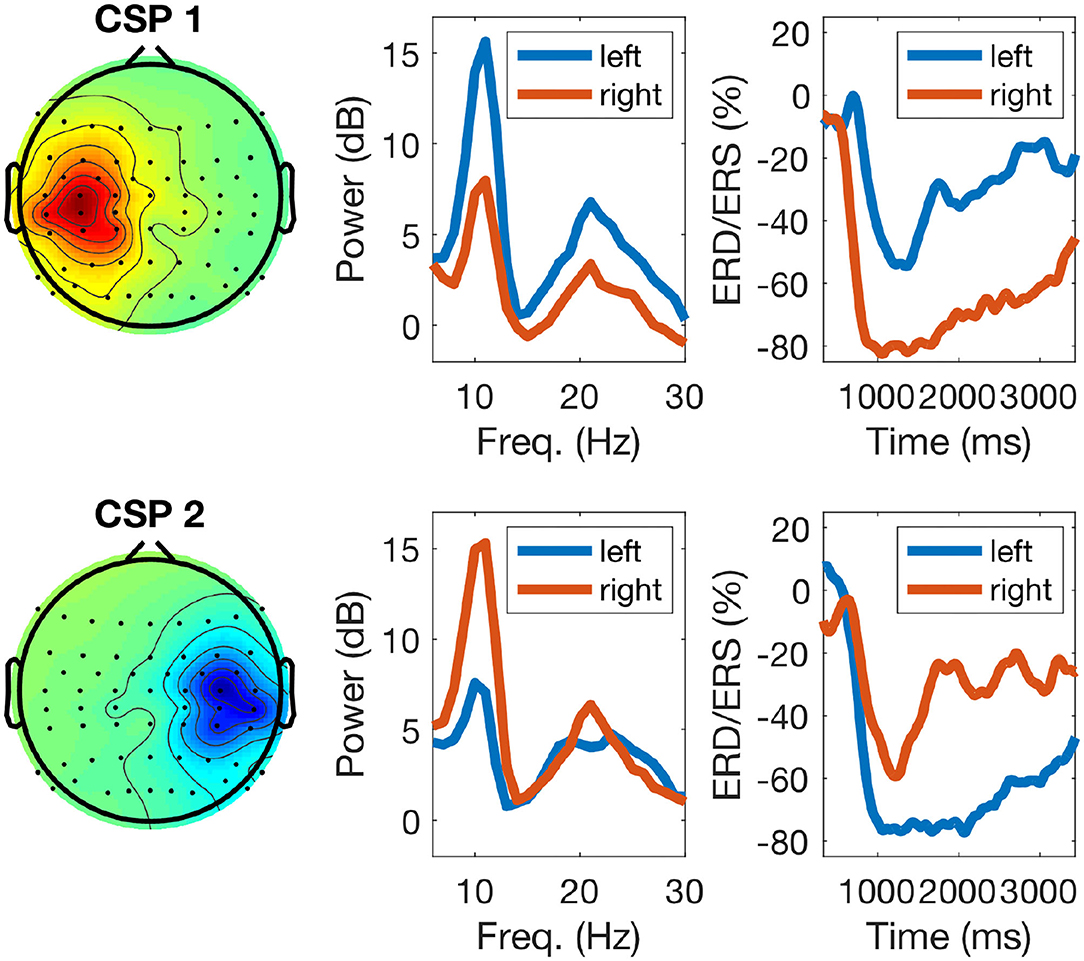
Figure 5. Example of calibration EEG data of one participant during task performance: the left panels display two sensorimotor CSP patterns (one for each class), the middle panels their corresponding power-spectra during calibration, with blue and red lines indicating left and right hand imagery, respectively, and the right panels display ERD/ERS responses. For right hand motor imagery (top row) the CSP pattern shows an activation over the left sensorimotor cortex and the power spectrum (red line) displays a strong power decrease in the μ band. The ERD response of the μ band filtered signal depicts the time course of the power decrease. For left hand motor imagery (bottom row, blue lines) the responses are analogous.
Figure 6 displays the cortical sources corresponding to the patterns of CSP in the left panel of Figure 5. The inverse modeling was performed with eLORETA (Pascual-Marqui, 2007; Pascual-Marqui et al., 2011). There, it is visible that the active sources were primarily localized over the contralateral pre- and post-central gyri. In particular, the pattern on the left panel of Figure 6 corresponds to the right hand motor imagery and is contralateral, as expected. The pattern in the right panel corresponds to left hand motor imagery and is analogously contralateral.
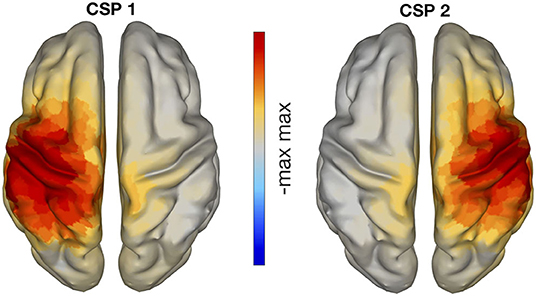
Figure 6. eLORETA localization of CSP patterns presented in Figure 5, with classes left vs. right hand motor imagery. The neuronal sources of these CSP patterns are clearly located in sensorimotor areas.
3.2. Estimation of SNR
As discussed in section 1, there exist several predictors of BCI performance based on the amount of power (or SNR) at resting state in different frequency bands. Furthermore, the SNR might influence the level of synchrony between brain regions, even if volume conduction safe measures are employed (Bayraktaroglu et al., 2013). Thus, we inspected whether the SNR of the SVD components used to calculate iCOH were significantly correlated to the BCI performance attained by the participants during the online session. These results are depicted in Table 1.
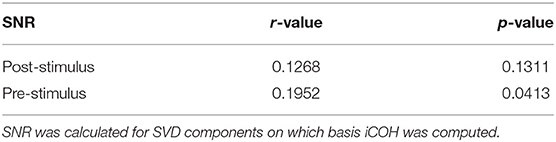
Table 1. Spearman correlations and corresponding p-values between SNR values and BCI accuracy.
There, one can observe that SNR correlates weakly (but significantly) with BCI accuracy for the pre-stimulus interval, and not significantly to the performance in the post-stimulus interval.
3.3. Correlation Between Sensorimotor Functional Connectivity and BCI Performance
All correlation coefficients between connectivity estimates and online feedback performance are summarized in Table 2. The first two columns refer to whether connectivity was computed in μ-band (9–14 Hz) or in the subject-selected frequency band used during online operation (feedback band). This subject-dependent band had mean values of 11.67 Hz for the lower and 17.58 Hz for the upper band limits. The smallest value for the lower band limit was 5.5 Hz and the greatest for the upper band limit was 35 Hz. The last two columns refer to the same estimates, but the correlation was performed by partially regressing out the SNR approximation of SVD components obtained from the corresponding time-interval. Then, the first row corresponds to connectivity computed between sensory and motor regions within the same hemisphere (both hemispheres averaged), in the post-stimulus interval. The second row is the connectivity computed from the same regions, but for the pre-stimulus interval. The third row relates to iCOH computed across the two hemispheres: left sensory to right motor areas, right sensory to left motor areas, left motor to right motor areas, and finally left sensory to right sensory areas connectivity. These last four values were estimated in the post-stimulus interval of the calibration dataset and averaged. Finally, row four of Table 2 refers to the same connectivity estimates, but computed on the pre-stimulus interval.
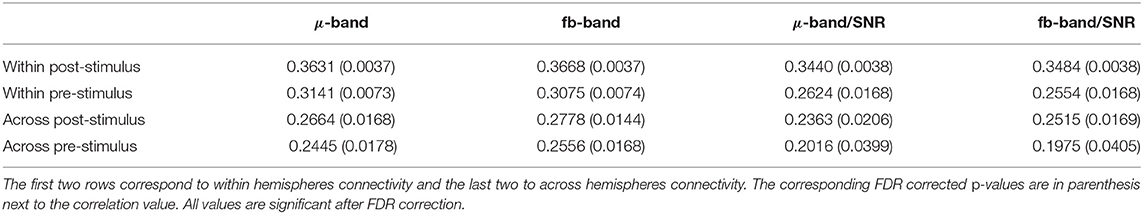
Table 2. Spearman r-values of correlations (first two columns) and partial correlations (regressing out effects of power, last two columns) of connectivity values in μ and feedback bands with online performance.
The corresponding FDR-corrected p-values (threshold 0.05) to the correlation coefficients presented in Table 2 are visible in parenthesis next to the r-values in the same table. All values are significant. The table shows that “within hemispheres” connectivity is more significantly correlated to BCI accuracy than “across hemispheres” connectivity. It is also visible that post-stimulus connectivity is less influenced by SNR than pre-stimulus connectivity, as expected given the insignificant relation between performance and post-stimulus SNR. Also, connectivity in the feedback band is, on average, more correlated to performance than iCOH in μ-band. In order to further validate the significance of the previous results, we also performed permutation tests as explained in section 2.3. In all cases, the 95th percentile of shuffled correlation coefficients was smaller than the coefficients displayed in Table 2 thus indicating that the estimated correlations were significant.
In Figure 7, two correlation plots are depicted. They correspond to the correlation values of row 2, columns 1 and 2, respectively. In particular, the left panel shows the correlation plot of the pre-stimulus μ-band connectivity vs. feedback accuracy. The right panel is similar, but representing the result of the feedback band instead of the μ-band. The pink lines correspond to the correlations found with the Spearman coefficient (not equivalent to the Pearson or least squares line).
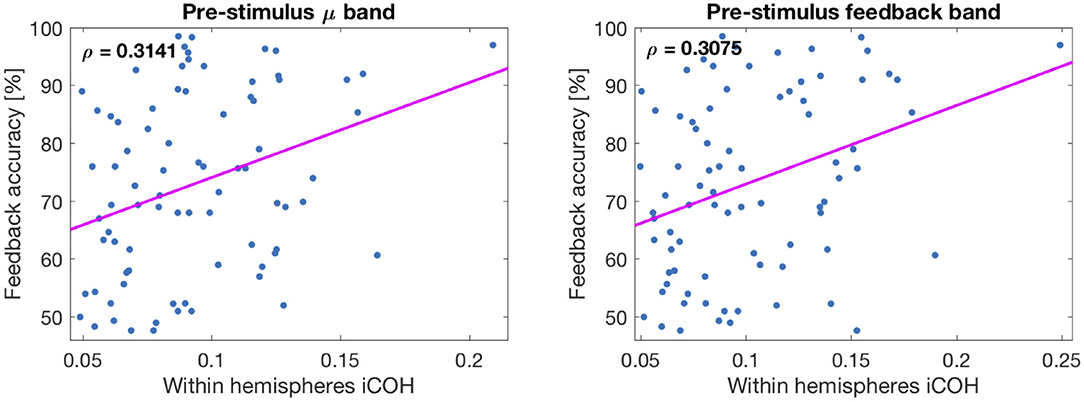
Figure 7. Plot of correlations between connectivity values and feedback accuracy. (Left) Corresponds to μ-band and (Right) to feedback band. The line corresponds to the Spearman correlation coefficient.
4. Discussion
The results presented in the previous section show that connectivity “within” and “across” hemispheres in the sensorimotor system significantly predicts future BCI performance.
Typically, BCI systems based on the modulation of SMR using MI tasks have lower rates of efficiency than other BCI paradigms based on evoked potentials such as event-related potentials (ERP) or steady-state visual potentials (SSVEP) (Chen et al., 2015; Min et al., 2016; Nierhaus et al., 2019). This is because MI-based BCI users normally need to acquire the skill to efficiently perform the MI tasks. In this situation, a learning curve over time can be usually observed (Sannelli et al., 2011, 2016; Vidaurre et al., 2011a,b). Thus, in this paradigm, BCI performance critically depends on the ability of the participants to perform movement imaginations that are able to modulate the amplitude of ongoing oscillations (Vidaurre and Blankertz, 2010; Sannelli et al., 2019).
Motor imagery is a complex cognitive process, associated with the activation of both somatosensory and motor cortices (Decety, 1996; Porro et al., 1996; Guillot and Collet, 2005). Motor imagery is accompanied not only by the feeling of motor agency but also by the feeling of consequences of the movement likely to be based on reactivation of proprioceptive sensations (Nikulin et al., 2008). For example, proprioception concurrent to MI has been shown to increase the decoding capability of classification algorithms for BCIs (Vidaurre et al., 2013, 2019; Ramos-Murguialday and Birbaumer, 2015; Corbet et al., 2018).
However, such complex and parallel activation of motor and sensory processes should then be integrated via neuronal connectivity, which represents a mechanism for joining distributed neuronal processing.
It is therefore quite possible that successful performance of motor imagery and consequently reliable BCI control critically depends on the presence of connectivity between relevant sensorimotor areas. Considering the sequence of motor imagery and taking into account the time perspective, it is likely that a subject usually starts with imagining a movement initiation. This is then followed by imagining the consequences of the movement, i.e., proprioceptive feedback. The first process relates to the activation of pre-central gyrus while the second one involves activation of the post-central gyrus. However, these two processes (efferent and afferent) are tightly related to each other, where the initiation of the movement (even an imagined one) relates to the anticipation of its sensory consequences (Wolpert et al., 1995). That is why connectivity between motor and sensory cortical areas represents a mechanistic explanation for how holistic imagery performance can be achieved. In agreement with these considerations, online feedback dependency on connectivity estimates during task performance (equivalent to post-stimulus connectivity) has recently been shown to enhance BCI classification (Gu et al., 2020).
Importantly, in our study we show that not only post-stimulus connectivity, but also synchrony in the pre-stimulus interval predicts future BCI performance. The fact that pre-stimulus connectivity significantly correlates with BCI performance, even after discarding the influence of SNR (which in this case is also positively correlated to performance, see Table 1), indicates that it is indeed the strength of the underlying functional pathways, and not their modulation by tasks that is important for BCI performance. The connectivity in this sense represents a prerequisite for the successful transfer and integration of information during BCI online feedback. The presence of connectivity in the pre-stimulus interval can thus facilitate task related modulations of connectivity in BCI. Additionally, this presents some advantage over resting state predictors; although pre-stimulus connectivity does not directly reflect task-related modulation, it nonetheless allows to estimate connectivity in the context of the task, thus quantifying the readiness of the system to be engaged into the upcoming processing of sensory information and the generation of an appropriate behavioral response. In case of BCI, this response is manifested in the generation of the corresponding motor imagery. This means that context dependent rather than resting-state connectivity could be used as a variable to estimate or increase BCI performance without the actual necessity to perform any task.
In section 3, it has been shown that although the correlation between connectivity and BCI performance was not particularly strong, it was indeed significant, an outcome that was further validated with permutation tests. Its presence indicates that not only the power (or SNR) of oscillations is important for predicting BCI performance, as shown for example in Blankertz et al. (2010), but also more delicate neuronal processes typically associated with motor performance have to be taken into account. Moreover, it has been shown that the measurement of neuronal connectivity using non-invasive technology such as EEG (and MEG) is very challenging (Mahjoory et al., 2017). Thus, even the modest correlation observed in the present study evidences that connectivity is an important factor defining sensorimotor BCI performance. This finding indicates that strengthening functional connectivity within the sensorimotor system might boost relating BCI performance. Up-regulation of functional connectivity via neurofeedback has recently been demonstrated in a study on corticomuscular coherence (von Carlowitz-Ghori et al., 2015). We hypothesize that the up-regulation of functional connectivity between S1 and M1 can enhance BCI performance via strengthening the communication between neuronal populations involved in motor imagery. In order to further enhance the effect of such neuro-feedback one can even consider the application of non-invasive neuro-modulation techniques [e.g., with Transcranial magnetic stimulation (TMS) or transcranial Direct Current Stimulation, tDCS] to change cortical excitability and promote further cortical connectivity (Sehm et al., 2012).
Another aspect visible from Table 2 is that SNR influenced predictions stronger in μ-band than in the feedback band. This is understandable since μ-band only partially captures the information contained in feedback band as the later might extend over lower and higher frequency ranges. Moreover, regarding SNR another interesting aspect is that, although we found significant pre-stimulus correlation between the SNR of SVD components and BCI accuracy, this was much weaker than other SNR-based measures directly computed for EEG electrodes over sensorimotor areas (Blankertz et al., 2010; Ahn et al., 2013b; Robinson et al., 2018). This can be due to the fact that SVD components capture primarily activity from sensorimotor areas, while electrodes record activity also from other cortical areas which potentially can contribute to the classification accuracy. Furthermore, the correlation of SNR in the post-stimulus interval and BCI accuracy was not significant, which might be related to the ERD (i.e., the power drop) observed during the post-stimulus interval of MI tasks (see Figure 5). In this case the amplitude of oscillations is strongly attenuated (see Figure 5) thus making an estimation of SNR challenging. However, thoroughly controlling for SNR in the post-stimulus interval is helpful for taking into account different individual dynamics of ERD/ERS (Ricci et al., 2019; Tatti et al., 2019).
Finally, we computed not only within hemispheres connectivity but also across hemispheres iCOH. The goal behind this analysis was to understand whether the communication between hemispheres also plays a significant role in the prediction of future BCI performance. Understandably, within hemispheres connectivity was more predictive of BCI performance than across hemispheres. This is most likely because motor imagery tasks primarily involve a contralateral hemisphere to the imagined movement (Nikulin et al., 2008). It is therefore in the contralateral hemisphere where both afferent and efferent aspects (and their integration requiring connectivity) are particularly pronounced in motor imagery. Since across-hemispheres connectivity was also predictable of BCI accuracy, it is possible that the performance of unilateral movements is associated with the activation of both hemispheres (Kicić et al., 2008). Finally, given that MI is a rehearsal of the actual movements by extension one can assume that unilateral MI might also depend on the functioning of both hemispheres whose neuronal states are defined by extensive callosal interactions (Ni et al., 2008), that can be captured with iCOH.
Consequently, our findings show that the level of sensorimotor functional connectivity should be taken into account when strategies to predict or improve BCI performance of a specific subject are designed.
Data Availability Statement
Large part of the data analyzed in this study is publicly available. This data can be found at: https://depositonce.tu-berlin.de/handle/11303/8979.
Ethics Statement
The studies involving human participants were reviewed and approved by The Ethical Review Boards of the Medical Faculty, University of Tübingen and was designed together with the Institute of Medical Psychology and Behavioral Neurobiology of the University of Tübingen. The patients/participants provided their written informed consent to participate in this study.
Author Contributions
CV, SH, K-RM, and VVN conceived and designed the analyses and interpreted the results. CV and VVN drafted the article. All authors critically revised the manuscript and gave final approval of the submitted version.
Funding
CV was supported by MINECO-RyC-2014-15671. SH was supported by the European Research Council (ERC) under the European Union's Horizon 2020 research and innovation programme (Grant agreement No. 758985). K-RM was supported in part by the Institute for Information & Communications Technology Promotion and funded by the Korea government (MSIT) (No. 2017-0-00451), and was partly supported by the German Ministry for Education and Research (BMBF) under Grants 01IS14013A-E, 01GQ1115, 01GQ0850, 01IS18025A, and 01IS18037A; the German ResearchFoundation (DFG) under Grant Math+, EXC 2046/1, Project ID 390685689. VVN was partly supported by the HSE Basic Research Program and the Russian Academic Excellence Project 5-100.
Conflict of Interest
The authors declare that the research was conducted in the absence of any commercial or financial relationships that could be construed as a potential conflict of interest.
Acknowledgments
The authors would like to thank Sebastian Halder, Eva-Maria Hammer, and Simon Scholler for recording part of the data. Additionally, they want to also thank Andrea Kübler, who was responsible for the study in Tübingen.
References
Acqualagna, L., Botrel, L., Vidaurre, C., Kübler, A., and Blankertz, B. (2016). Large-scale assessment of a fully automatic co-adaptive motor imagery-based brain computer interface. PLoS ONE 11:e148886. doi: 10.1371/journal.pone.0148886
Ahn, M., Ahn, S., Hong, J., Cho, H., Kim, K., Kim, B., et al. (2013a). Gamma band activity associated with BCI performance: simultaneous MEG/EEG study. Front. Hum. Neurosci. 7:848. doi: 10.3389/fnhum.2013.00848
Ahn, M., Cho, H., Ahn, S., and Jun, S. (2013b). High theta and low alpha powers may be indicative of bci-illiteracy in motor imagery. PLoS ONE 8:e80886. doi: 10.1371/journal.pone.0080886
Bauer, R., Fels, M., Vukelic, M., Ziemann, U., and Gharabaghi, A. (2015). Bridging the gap between motor imagery and motor execution with a brain-obot interface. Neuroimage 108, 319–327. doi: 10.1016/j.neuroimage.2014.12.026
Bayraktaroglu, Z., von Carlowitz-Ghori, K., Curio, G., and Nikulin, V. V. (2013). It is not all about phase: amplitude dynamics in corticomuscular interactions. NeuroImage 64, 496–504. doi: 10.1016/j.neuroimage.2012.08.069
Benjamini, Y., and Yekutieli, D. (2001). The control of the false discovery rate in multiple testing under dependency. Ann. Stat. 29, 1165–1188. doi: 10.1214/aos/1013699998
Blankertz, B., Lemm, S., Treder, M., Haufe, S., and Müller, K.-R. (2011). Single-trial analysis and classification of ERP components-a tutorial. NeuroImage 56, 814–825. doi: 10.1016/j.neuroimage.2010.06.048
Blankertz, B., Sannelli, C., Halder, S., Hammer, E. M., Kübler, A., Müller, K.-R., et al. (2010). Neurophysiological predictor of SMR-based BCI performance. NeuroImage 51, 1303–1309. doi: 10.1016/j.neuroimage.2010.03.022
Blankertz, B., Tomioka, R., Lemm, S., Kawanabe, M., and Muller, K.-R. (2008). Optimizing spatial filters for robust EEG single-trial analysis. IEEE Signal Process. Mag. 25, 41–56. doi: 10.1109/MSP.2008.4408441
Buch, E., Weber, C., Cohen, L., Braun, C., Dimyan, M., Ard, T., et al. (2008). Think to move: a neuromagnetic brain-computer interface (BCI) system for chronic stroke. Stroke 39, 910–917. doi: 10.1161/STROKEAHA.107.505313
Chen, X., Wang, Y., Gao, S., Jung, T.-P., and Gao, X. (2015). Filter bank canonical correlation analysis for implementing a high-speed SSVEP-based brain-computer interface. J. Neural Eng. 12:046008. doi: 10.1088/1741-2560/12/4/046008
Clochon, P., Fontbonne, J., Lebrun, N., and Etevenon, P. (1996). A new method for quantifying EEG event-related desynchronization: amplitude envelope analysis. Electroencephalogr. Clin. Neurophysiol. 98, 126–129. doi: 10.1016/0013-4694(95)00192-1
Corbet, T., Iturrate, I., Pereira, M., Perdikis, S., and Millan, J. d. R. (2018). Sensory threshold neuromuscular electrical stimulation fosters motor imagery performance. NeuroImage 176:268–276. doi: 10.1016/j.neuroimage.2018.04.005
Decety, J. (1996). Do imagined and executed actions share the same neural substrate? Cogn. Brain Res. 3, 87–93. doi: 10.1016/0926-6410(95)00033-X
Dornhege, G., del R. Millán, J., Hinterberger, T., McFarland, D., and Müller, K.-R. (eds.). (2007). Toward Brain-Computer Interfacing. Cambridge, MA: MIT Press. doi: 10.7551/mitpress/7493.001.0001
Grosse-Wentrup, M., Schölkopf, B., and Hill, J. (2011). Causal influence of gamma oscillations on the sensorimotor rhythm. NeuroImage 56, 837–842. doi: 10.1016/j.neuroimage.2010.04.265
Gu, L., Yu, Z., Ma, T., Wang, H., Li, Z., and Fan, H. (2020). EEG-based classification of lower limb motor imagery with brain network analysis. Neuroscience 436, 93–109. doi: 10.1016/j.neuroscience.2020.04.006
Guillot, A., and Collet, C. (2005). Contribution from neurophysiological and psychological methods to the study of motor imagery. Brain Res. Rev. 50, 387–397. doi: 10.1016/j.brainresrev.2005.09.004
Halder, S., Agorastos, D., Veit, R., Hammer, E. M., Lee, S., Varkuti, B., et al. (2011). Neural mechanisms of brain-computer interface control. NeuroImage 55, 1779–1790. doi: 10.1016/j.neuroimage.2011.01.021
Halder, S., Varkuti, B., Kübler, A., Rosenstiel, W., Sitaram, R., and Birbaumer, N. (2013). Prediction of brain-computer interface aptitude from individual brain structure. Front. Hum. Neurosci. 7:105. doi: 10.3389/fnhum.2013.00105
Hammer, E. M., Halder, S., Blankertz, B., Sannelli, C., Dickhaus, T., Kleih, S., et al. (2012). Psychological predictors of SMR-BCI performance. Biol. Psychol. 89, 80–86. doi: 10.1016/j.biopsycho.2011.09.006
Haufe, S., and Ewald, A. (2019). A Simulation framework for benchmarking EEG-based brain connectivity estimation methodologies. Brain Topogr. 32, 625–642. doi: 10.1007/s10548-016-0498-y
Huang, Y., Parra, L. C., and Haufe, S. (2016). The New York Head-A precise standardized volume conductor model for EEG source localization and tES targeting. NeuroImage 140, 150–162. doi: 10.1016/j.neuroimage.2015.12.019
Kicić, D., Lioumis, P., Ilmoniemi, R., and Nikulin, V. (2008). Bilateral changes in excitability of sensorimotor cortices during unilateral movement: combined electroencephalographic and transcranial magnetic stimulation study. Neuroscience 152, 1119–1129. doi: 10.1016/j.neuroscience.2008.01.043
Klopp, J., Marinkovic, K., Clarke, J., Chauvel, P., Nenov, V., and Halgren, E. (2001). Timing and localization of movement-related spectral changes in the human peri-rolandic cortex: intracranial recordings. Neuroimage 14, 391–405. doi: 10.1006/nimg.2001.0828
Lemm, S., Blankertz, B., Dickhaus, T., and Müller, K.-R. (2011). Introduction to machine learning for brain imaging. Neuroimage 56, 387–399. doi: 10.1016/j.neuroimage.2010.11.004
Leuthardt, E. C., Schalk, G., Wolpaw, J. R., Ojemann, J. G., and Moran, D. W. (2004). A brain computer interface using electrocorticographic signals in humans. J. Neural Eng. 1, 63–71. doi: 10.1088/1741-2560/1/2/001
Mahjoory, K., Nikulin, V. V., Botrel, L., Linkenkaer-Hansen, K., Fato, M. M., and Haufe, S. (2017). Consistency of EEG source localization and connectivity estimates. NeuroImage 152(Suppl. C), 590–601. doi: 10.1016/j.neuroimage.2017.02.076
Makris, N., Goldstein, J. M., Kennedy, D., Hodge, S. M., Caviness, V. S., Faraone, S. V., et al. (2006). Decreased volume of left and total anterior insular lobule in schizophrenia. Schizophr. Res. 83, 155–171. doi: 10.1016/j.schres.2005.11.020
Millán, J. d. R., Rupp, R., Müller-Putz, G. R., Murray-Smith, R., Giugliemma, C., Tangermann, M., et al. (2010). Combining Brain-Computer interfaces and assistive technologies: state-of-the-art and challenges. Front. Neurosci. 4:161. doi: 10.3389/fnins.2010.00161
Min, B.-K., Dähne, S., Ahn, M.-H., Noh, Y.-K., and Müller, K.-R. (2016). Decoding of top-down cognitive processing for SSVEP-controlled BMI. Sci. Rep. 6:36267. doi: 10.1038/srep36267
Mukaka, M. (2012). Statistics corner: a guide to appropriate use of correlation coefficient in medical research. Malawi Med. J. 24, 69–71.
Müller, K.-R., Anderson, C. W., and Birch, G. E. (2003). Linear and nonlinear methods for brain-computer interfaces. IEEE Trans. Neural Syst. Rehabil. Eng. 11, 165–169. doi: 10.1109/TNSRE.2003.814484
Müller-Putz, G., Leeb, R., Tangermann, M., Höhne, J., Kübler, A., Cincotti, F., et al. (2015). Towards noninvasive hybrid brain-computer interfaces: framework, practice, clinical application, and beyond. Proc. IEEE 103, 926–943. doi: 10.1109/JPROC.2015.2411333
Neuper, C., and Pfurtscheller, G. (2001). Event-related dynamics of cortical rhythms: frequency-specific features and functional correlates. Int. J. Psychophysiol. 43, 41–58. doi: 10.1016/S0167-8760(01)00178-7
Neuper, C., Scherer, R., Reiner, M., and Pfurtscheller, G. (2005). Imagery of motor actions: differential effects of kinesthetic and visual-motor mode of imagery in single-trial EEG. Cogn. Brain Res. 25, 668–677. doi: 10.1016/j.cogbrainres.2005.08.014
Ni, Z., Gunraj, C., Nelson, A. J., Yeh, I.-J., Castillo, G., Hoque, T., et al. (2008). Two phases of interhemispheric inhibition between motor related cortical areas and the primary motor cortex in human. Cereb. Cortex 19, 1654–1665. doi: 10.1093/cercor/bhn201
Nierhaus, T., Vidaurre, C., Sannelli, C., Müller, K.-R., and Villringer, A. (2019). Immediate brain plasticity after one hour of brain-computer interface (BCI). J. Physiol. doi: 10.1113/JP278118
Nikulin, V., Hohlefeld, F., Jacobs, A., and Curio, G. (2008). Quasi-movements: a novel motor-cognitive phenomenon. Neuropsychologia 46, 727–742. doi: 10.1016/j.neuropsychologia.2007.10.008
Nikulin, V. V., Linkenkaer-Hansen, K., Nolte, G., Lemm, S., Müller, K. R., Ilmoniemi, R. J., et al. (2007). A novel mechanism for evoked responses in the human brain. Eur. J. Neurosci. 25, 3146–3154. doi: 10.1111/j.1460-9568.2007.05553.x
Nolte, G., Bai, O., Wheaton, L., Mari, Z., Vorbach, S., and Hallett, M. (2004). Identifying true brain interaction from EEG data using the imaginary part of coherency. Clin. Neurophysiol. 115, 2292–2307. doi: 10.1016/j.clinph.2004.04.029
Nolte, G., Ziehe, A., Nikulin, V. V., Schlögl, A., Krämer, N., Brismar, T., et al. (2008). Robustly estimating the flow direction of information in complex physical systems. Phys. Rev. Lett. 100:234101. doi: 10.1103/PhysRevLett.100.234101
Pascual-Marqui, R. D. (2007). Discrete, 3D distributed, linear imaging methods of electric neuronal activity. Part 1: exact, zero error localization. arXiv preprint arXiv:0710.3341.
Pascual-Marqui, R. D., Lehmann, D., Koukkou, M., Kochi, K., Anderer, P., Saletu, B., et al. (2011). Assessing interactions in the brain with exact low-resolution electromagnetic tomography. Philos. Trans. A Math. Phys. Eng. Sci. 369, 3768–3784. doi: 10.1098/rsta.2011.0081
Pernet, C., Latinus, M., Nichols, T., and Rousselet, G. (2015). Cluster-based computational methods for mass univariate analyses of event-related brain potentials/fields: a simulation study. Journal of Neurosci. Methods 250, 85–93. doi: 10.1016/j.jneumeth.2014.08.003
Pfurtscheller, G., Brunner, C., Schlögl, A., and Lopes da Silva, F. H. (2006). Mu rhythm (de)synchronization and EEG single-trial classification of different motor imagery tasks. NeuroImage 31, 153–159. doi: 10.1016/j.neuroimage.2005.12.003
Pfurtscheller, G., and Neuper, C. (1997). Motor imagery activates primary sensorimotor area in humans. Neurosci. Lett. 239, 65–68. doi: 10.1016/S0304-3940(97)00889-6
Pfurtscheller, G., Stancák, A. J., and Edlinger, G. (1997). On the existence of different types of central beta rhythms below 30 Hz. Electroencephalogr. Clin. Neurophysiol. 102, 316–325. doi: 10.1016/S0013-4694(96)96612-2
Pineda, J. A. (2005). The functional significance of mu rhythms: translating “seeing” and “hearing” into “doing”. Brain Res. Rev. 50, 57–68. doi: 10.1016/j.brainresrev.2005.04.005
Porro, C. A., Francescato, M. P., Cettolo, V., Diamond, M. E., Baraldi, P., Zuiani, C., et al. (1996). Primary motor and sensory cortex activation during motor performance and motor imagery: a functional magnetic resonance imaging study. J. Neurosci. 16, 7688–7698. doi: 10.1523/JNEUROSCI.16-23-07688.1996
Ramos-Murguialday, A., and Birbaumer, N. (2015). Brain oscillatory signatures of motor tasks. J. Neurophysiol. 113, 3663–3682. doi: 10.1152/jn.00467.2013
Ricci, S., Tatti, E., Mehraram, R., Panday, P., and Ghilardi, M. (2019). “Beta band frequency differences between motor and frontal cortices in reaching movements,” in IEEE International Conference on Rehabilitation Robotics: [Proceedings], Vol. 2019 (Toronto), 1254–1259. doi: 10.1109/ICORR.2019.8779373
Robinson, N., Thomas, K., and Vinod, A. (2018). Neurophysiological predictors and spectro-spatial discriminative features for enhancing SMR-BCI. J. Neural Eng. 15:066032. doi: 10.1088/1741-2552/aae597
Salmelin, R., and Hari, R. (1994). Spatiotemporal characteristics of sensorimotor neuromagnetic rhythms related to thumb movement. Neuroscience 60, 537–550. doi: 10.1016/0306-4522(94)90263-1
Samek, W., Blythe, D., Curio, G., Müller, K.-R., Blankertz, B., and Nikulin, V. (2016). Multiscale temporal neural dynamics predict performance in a complex sensorimotor task. Neuroimage 141, 291–303. doi: 10.1016/j.neuroimage.2016.06.056
Sannelli, C., Vidaurre, C., Müller, K., and Blankertz, B. (2019). A large scale screening study with a SMR-based BCI: Categorization of BCI users and differences in their SMR activity. PLoS ONE 14:e0207351. doi: 10.1371/journal.pone.0207351
Sannelli, C., Vidaurre, C., Müller, K.-R., and Blankertz, B. (2011). CSP patches: an ensemble of optimized spatial filters: an evaluation study. J. Neural Eng. 8:025012. doi: 10.1088/1741-2560/8/2/025012
Sannelli, C., Vidaurre, C., Müller, K.-R., and Blankertz, B. (2016). Ensembles of adaptive spatial filters increase BCI performance: an online evaluation. J. Neural Eng. 13:046003. doi: 10.1088/1741-2560/13/4/046003
Sehm, B., Schfer, A., Kipping, J., Margulies, D., Conde, V., Taubert, M., et al. (2012). Dynamic modulation of intrinsic functional connectivity by transcranial direct current stimulation. J. Neurophysiol. 108, 3253–3263. doi: 10.1152/jn.00606.2012
Sugata, H., Hirata, M., Yanagisawa, T., Shayne, M., Matsushita, K., Goto, T., et al. (2014). Alpha band functional connectivity correlates with the performance of brain-machine interfaces to decode real and imagined movements. Front. Hum. Neurosci. 8:620. doi: 10.3389/fnhum.2014.00620
Suk, H.-I., Fazli, S., Mehnert, J., Müller, K.-R., and Lee, S.-W. (2014). Predicting BCI subject performance using probabilistic spatio-temporal filters. PLoS ONE 9:e87056. doi: 10.1371/journal.pone.0087056
Tatti, E., Ricci, S., Mehraram, R., Lin, N., George, S., Nelson, A. B., et al. (2019). Beta modulation depth is not linked to movement features. Front. Behav. Neurosci. 13:49. doi: 10.3389/fnbeh.2019.00049
Valdés-Hernández, P. A., Ojeda-González, A., Martínez-Montes, E., Lage-Castellanos, A., Virués-Alba, T., Valdés-Urrutia, L., et al. (2010). White matter architecture rather than cortical surface area correlates with the EEG alpha rhythm. NeuroImage 49, 2328–2339. doi: 10.1016/j.neuroimage.2009.10.030
Vidaurre, C., and Blankertz, B. (2010). Towards a cure for BCI illiteracy. Brain Topogr. 23, 194–198. doi: 10.1007/s10548-009-0121-6
Vidaurre, C., Murguialday, A. R., Haufe, S., Gómez, M., Müller, K.-R., and Nikulin, V. (2019). Enhancing sensorimotor BCI performance with assistive afferent activity: an online evaluation. NeuroImage 199, 375–386. doi: 10.1016/j.neuroimage.2019.05.074
Vidaurre, C., Pascual, J., Ramos-Murguialday, A., Lorenz, R., Blankertz, B., Birbaumer, N., et al. (2013). Neuromuscular electrical stimulation induced brain patterns to decode motor imagery. Clin. Neurophysiol. 124, 1824–1834. doi: 10.1016/j.clinph.2013.03.009
Vidaurre, C., Sannelli, C., Müller, K.-R., and Blankertz, B. (2011a). Co-adaptive calibration to improve BCI efficiency. J. Neural Eng. 8:025009. doi: 10.1088/1741-2560/8/2/025009
Vidaurre, C., Sannelli, C., Müller, K.-R., and Blankertz, B. (2011b). Machine-learning-based coadaptive calibration for brain-computer interfaces. Neural Comput. 23, 791–816. doi: 10.1162/NECO_a_00089
Vidaurre, C., Scherer, R., Cabeza, R., Schlögl, A., and Pfurtscheller, G. (2007). Study of discriminant analysis applied to motor imagery bipolar data. Med. Bio Eng. Comput. 45, 61–68. doi: 10.1007/s11517-006-0122-5
von Carlowitz-Ghori, K., Bayraktaroglu, Z., Waterstraat, G., Curio, G., and Nikulin, V. (2015). Voluntary control of corticomuscular coherence through neurofeedback: a proof-of-principle study in healthy subjects. Neuroscience 290, 243–254. doi: 10.1016/j.neuroscience.2015.01.013
Waldert, S., Preissl, H., Demandt, E., Braun, C., Birbaumer, N., Aertsen, A., et al. (2008). Hand movement direction decoded from MEG and EEG. J. Neurosci. 28, 1000–1008. doi: 10.1523/JNEUROSCI.5171-07.2008
Wolpaw, J. (2007). Brain-computer interfaces as new brain output pathways. J. Physiol. 579:613. doi: 10.1113/jphysiol.2006.125948
Wolpaw, J., Birbaumer, N., McFarland, D., Pfurtscheller, G., and Vaughan, T. (2002). Brain-computer interfaces for communication and control. Clin. Neurophysiol. 113, 767–791. doi: 10.1016/S1388-2457(02)00057-3
Wolpert, D., Ghahramani, Z., and Jordan, M. (1995). An internal model for sensorimotor integration. Science 269, 1880–1882. doi: 10.1126/science.7569931
Zhang, R., Xu, P., Chen, R., Li, F., Guo, L., Li, P., et al. (2015). Predicting inter-session performance of SMR-based brain-computer interface using the spectral entropy of resting-state EEG. Brain Topogr. 28, 680–690. doi: 10.1007/s10548-015-0429-3
Keywords: connectivity, sensorimotor signals, BCI performance, μ-band, BCI efficiency, pre-stimulus
Citation: Vidaurre C, Haufe S, Jorajuría T, Müller K-R and Nikulin VV (2020) Sensorimotor Functional Connectivity: A Neurophysiological Factor Related to BCI Performance. Front. Neurosci. 14:575081. doi: 10.3389/fnins.2020.575081
Received: 22 June 2020; Accepted: 16 November 2020;
Published: 18 December 2020.
Edited by:
Paul Watters, Independent Researcher, Melbourne, AustraliaReviewed by:
Soha Saleh, Kessler Foundation, United StatesJosé Ramón Villar, University of Oviedo, Spain
Copyright © 2020 Vidaurre, Haufe, Jorajuría, Müller and Nikulin. This is an open-access article distributed under the terms of the Creative Commons Attribution License (CC BY). The use, distribution or reproduction in other forums is permitted, provided the original author(s) and the copyright owner(s) are credited and that the original publication in this journal is cited, in accordance with accepted academic practice. No use, distribution or reproduction is permitted which does not comply with these terms.
*Correspondence: Carmen Vidaurre, Y2FybWVuLnZpZGF1cnJlQHVuYXZhcnJhLmVz; Klaus-Robert Müller, a2xhdXMtcm9iZXJ0Lm11ZWxsZXJAdHUtYmVybGluLmRl; Vadim V. Nikulin, bmlrdWxpbkBjYnMubXBnLmRl