 Asif Adil
 Vijay Kumar
 Arif Tasleem Jan
 Mohammed Asger
- 1Department of Computer Sciences, Baba Ghulam Shah Badshah University, Rajouri, India
- 2Department of Biotechnology, Yeungnam University, Gyeongsan, South Korea
- 3School of Biosciences and Biotechnology, Baba Ghulam Shah Badshah University, Rajouri, India
Rapid cost drops and advancements in next-generation sequencing have made profiling of cells at individual level a conventional practice in scientific laboratories worldwide. Single-cell transcriptomics [single-cell RNA sequencing (SC-RNA-seq)] has an immense potential of uncovering the novel basis of human life. The well-known heterogeneity of cells at the individual level can be better studied by single-cell transcriptomics. Proper downstream analysis of this data will provide new insights into the scientific communities. However, due to low starting materials, the SC-RNA-seq data face various computational challenges: normalization, differential gene expression analysis, dimensionality reduction, etc. Additionally, new methods like 10× Chromium can profile millions of cells in parallel, which creates a considerable amount of data. Thus, single-cell data handling is another big challenge. This paper reviews the single-cell sequencing methods, library preparation, and data generation. We highlight some of the main computational challenges that require to be addressed by introducing new bioinformatics algorithms and tools for analysis. We also show single-cell transcriptomics data as a big data problem.
Introduction
The human body exhibits a diverse range of cells that undergo transit from one state to another in life (development, disease, and regeneration). Though derived from the same zygote, the cell, with its types and states, is greatly influenced by the internal processes and external factors (Song et al., 2019). In its progression through proliferation and the differentiation states to generate multiple cell types for organ formation, complex heterogeneities in the cellular architecture are observed. The cellular heterogeneity in terms of morphology, function, and gene expression profiles lie between various tissues, but has also been observed among the same cell types that allow them to perform different roles. Dysregulation in any particular cell type (irrespective of tissues, organs, and organ-system) influences the entire system that progresses to disorders and even severe diseases like cancer (Macaulay et al., 2017).
Recent technological advancements have enabled biologists to profile cells at individual levels on a variety of omics layers (genomes, transcriptomes, epigenomes, and proteomes) (Hu et al., 2016); among these, single cell (SC) transcriptomics is widely studied. The cells of a human body, being heterogeneous, often show a drastic variation at the individual level (Wang and Bodovitz, 2010; Xin et al., 2016). The SC experiments were found much conclusive compared with bulk cell sequencing that involves sequencing in bulk (assuming cells of a particular type are identical) and estimating an average of expressions. The SC transcriptomics was awarded as method of the year by Nature in 2013 (Xue et al., 2015). With the advent of next-generation sequencing, it becomes possible to develop sequencing methods to probe the dynamics of the genome and variations thereof. Of them, RNA sequencing (RNA-seq)-mediated transcriptomic profiling revealed information of novel RNA species that deepened our understanding of the transcriptome dynamics (Tang et al., 2009; Wang et al., 2009; Ozsolak and Milos, 2011). Lately, these sequencing approaches have been extended to study intra-population heterogeneity of SCs (Wills et al., 2013), whereby it enabled the study of cell fates, their transition to different subtypes, and the dynamics of gene expression masked in bulk population studies (Altschuler and Wu, 2010; Trapnell et al., 2014). Compared with bulk sequencing, where libraries are prepared from thousands of cells, libraries for single-cell RNA sequencing (SC-RNA-seq) are cell-specific towards investigating cellular functionalities of DNA and RNA in different cellular subsets (Gross et al., 2015; Xue et al., 2015). Though SC-RNA-seq has revealed novel findings in different cellular backgrounds, it poses specific challenges: Pre-processing of the SC-RNA-seq data is majorly different from bulk RNA-seq, stricter protocols for library preparation and low starting material. Another challenge is the lack of analytical approaches required to accommodate large datasets generated during SC-RNA-seq experiments. Keeping this in view, we investigated the methods adopted in SC experiments, sequencing approaches, and challenges thereof, as part of realizing the goal of precision medicine.
Single-Cell RNA Sequence Profiling Techniques
With the first report in 2009, a surge in the SC transcriptomics methods capable of sequencing millions of cells with great accuracy and viability in a short span of time was observed (Tang et al., 2009). These methods are generally different from each other in terms of cell isolation methods, cell lysis procedure, amplification process, cDNA generation, transcript coverage, and Unique Molecular Identifier (UMI) tagging (at either 3′ end or 5′ end). The most critical distinction in the SC-RNA profiling techniques is that some provide full-length transcript coverage and some only partially sequence from either 3′ end or 5′ end of the transcript (Chen et al., 2019). Table 1 highlights widely used SC-RNA profiling methods in terms of different properties.

Table 1. Current SC-RNA-seq profiling techniques, based on transcript coverage and UMI insertion possibility.
Optimal Methodology of Single-Cell Transcriptomics
Of the various sequencing platforms, Drop-seq, InDrop, and 10× Chromium are well-known platforms for sequencing hundreds and thousands of cells in an unbiased manner (Kulkarni et al., 2019). In SC transcriptomics, each cell needs to be isolated from its originating tissue. The Droplet-based techniques, which at the core use microfluidics to attach cells with beads containing a unique barcode, are widely incorporated to separate cells. The performance criteria for isolation methods are based on three parameters: throughput, purity, and recovery (Tomlinson et al., 2013; Gross et al., 2015). Throughput indicates the number of cells that can be isolated per unit time, purity refers to the number of cells collected after separation from tissue, and recovery is the final amount of the target cells, in hand, after separation. The morphological complexity of cells like those of the central nervous system (CNS) makes the separation process a little challenging. The segregation process exposes them to specific environmental, chemical, and harsh dissociation steps that often bias data analysis (Kulkarni et al., 2019). The dissociation of intact cells from a frozen postmortem tissue is also challenging, as cell membranes are prone to damage from mechanical and physical stresses as part of the freeze–thaw process (McGann et al., 1988). Though each cell separation methods currently in use shows an advantage different for the above three parameters, it becomes imperative to select a well-suited method for the isolation of a cell. The current methodology of cell separation is broadly categorized into two groups based on (1) cellular properties like cell density, cell shape, cell size, etc., and (2) biological characteristics of a cell that comprises affinity methods (Tomlinson et al., 2013). Tables 2, 3 show some of the widely used methods concerning the operational mode, throughput, advantages, and disadvantages.
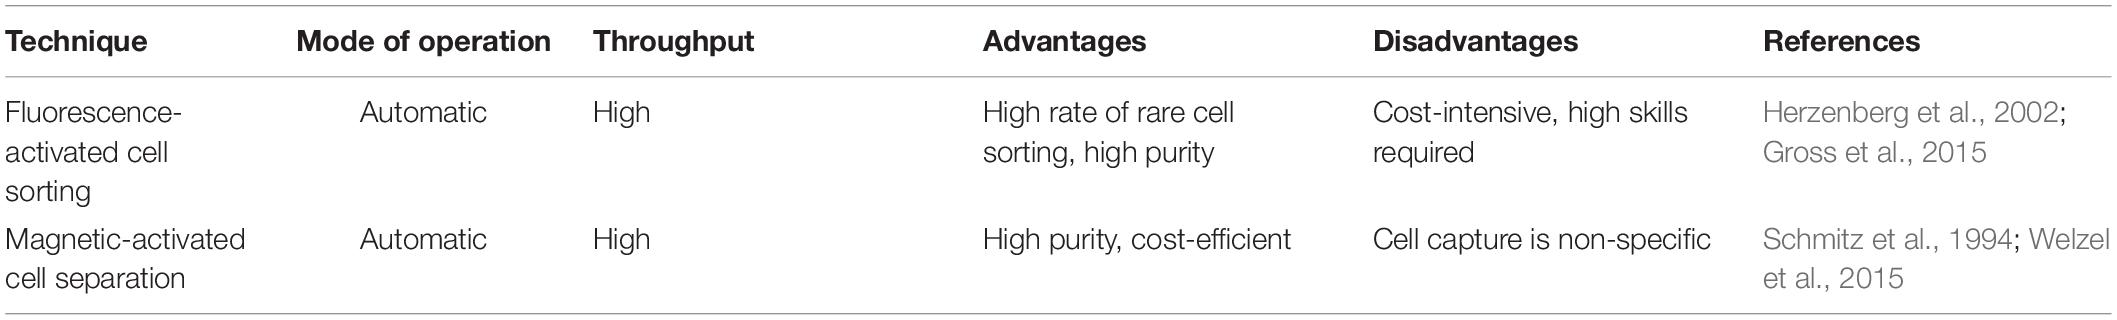
Table 2. Commonly used methods for cell isolation based on biological characteristics.
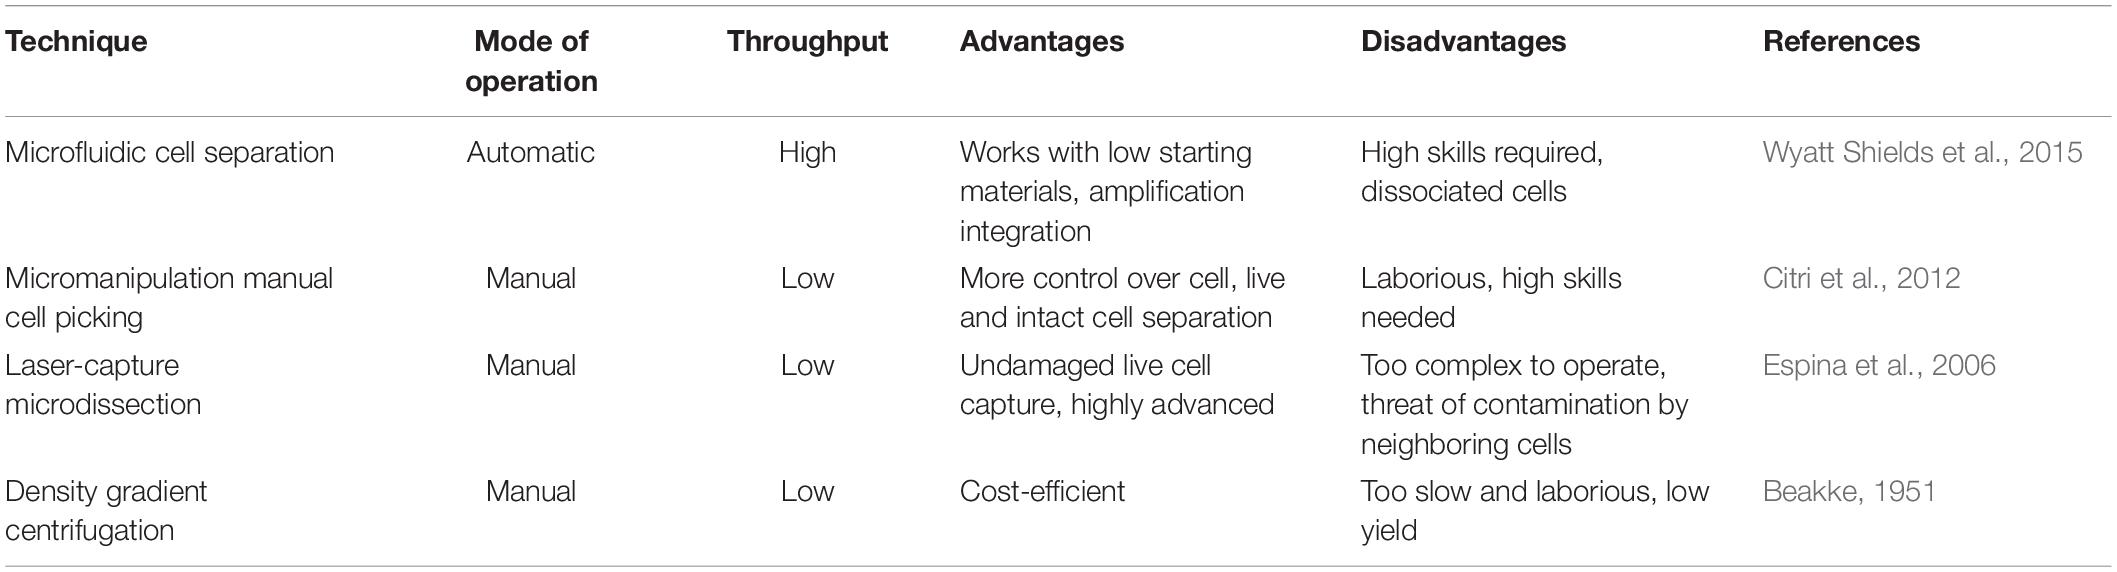
Table 3. Commonly used methods for cell isolation on the bases of physical characteristics.
Though high-throughput SC-RNA approaches such as 10× Chromium allows analysis of cells in an unbiased manner, it lacks in providing an in-depth information on sequence diversity, splicing, and chimeric transcripts generated in the process (Lebrigand et al., 2020). The problem is overcome by performing Nanopore long-read sequencing [using a cell barcode (cellBC) assignment to long reads] to obtain a full-length sequence corresponding to the 10× Chromium system’s data. As SC library preparation requires robust amplification, chimeric cDNA generation and amplification bias issues are currently addressed by employing a 3′ or 5′ end tag-based approach (Trombetta et al., 2015; Natarajan et al., 2019). The sequence length method determines the quality of alignment across the total length of a gene, while tag-based methods integrate UMIs at either 3′ end or 5′ end of the transcript (Kivioja et al., 2012; Smith et al., 2017; Sena et al., 2018). The UMI addition makes it easier to identify and quantify the individual transcripts by eliminating PCR artifacts and minimizes false annotation of PCR-generated chimeric cDNAs as novel transcripts. The full length-based methodology provides an all-inclusive coverage of the reads, yet they contribute a bias for long genes, as the genes with shorter length are often missed (Phipson et al., 2017). Additionally, the higher sequencing error rate of long-read sequencers and UMI problems account for a serious issue pertaining to these platforms (Gupta et al., 2018; Lebrigand et al., 2020; Volden and Vollmers, 2020). Despite this, the Tag-based methods have shown a fair dominance in SC-RNA library preparation for quantifying the transcripts in SC analysis when cell number is large (Figure 1).
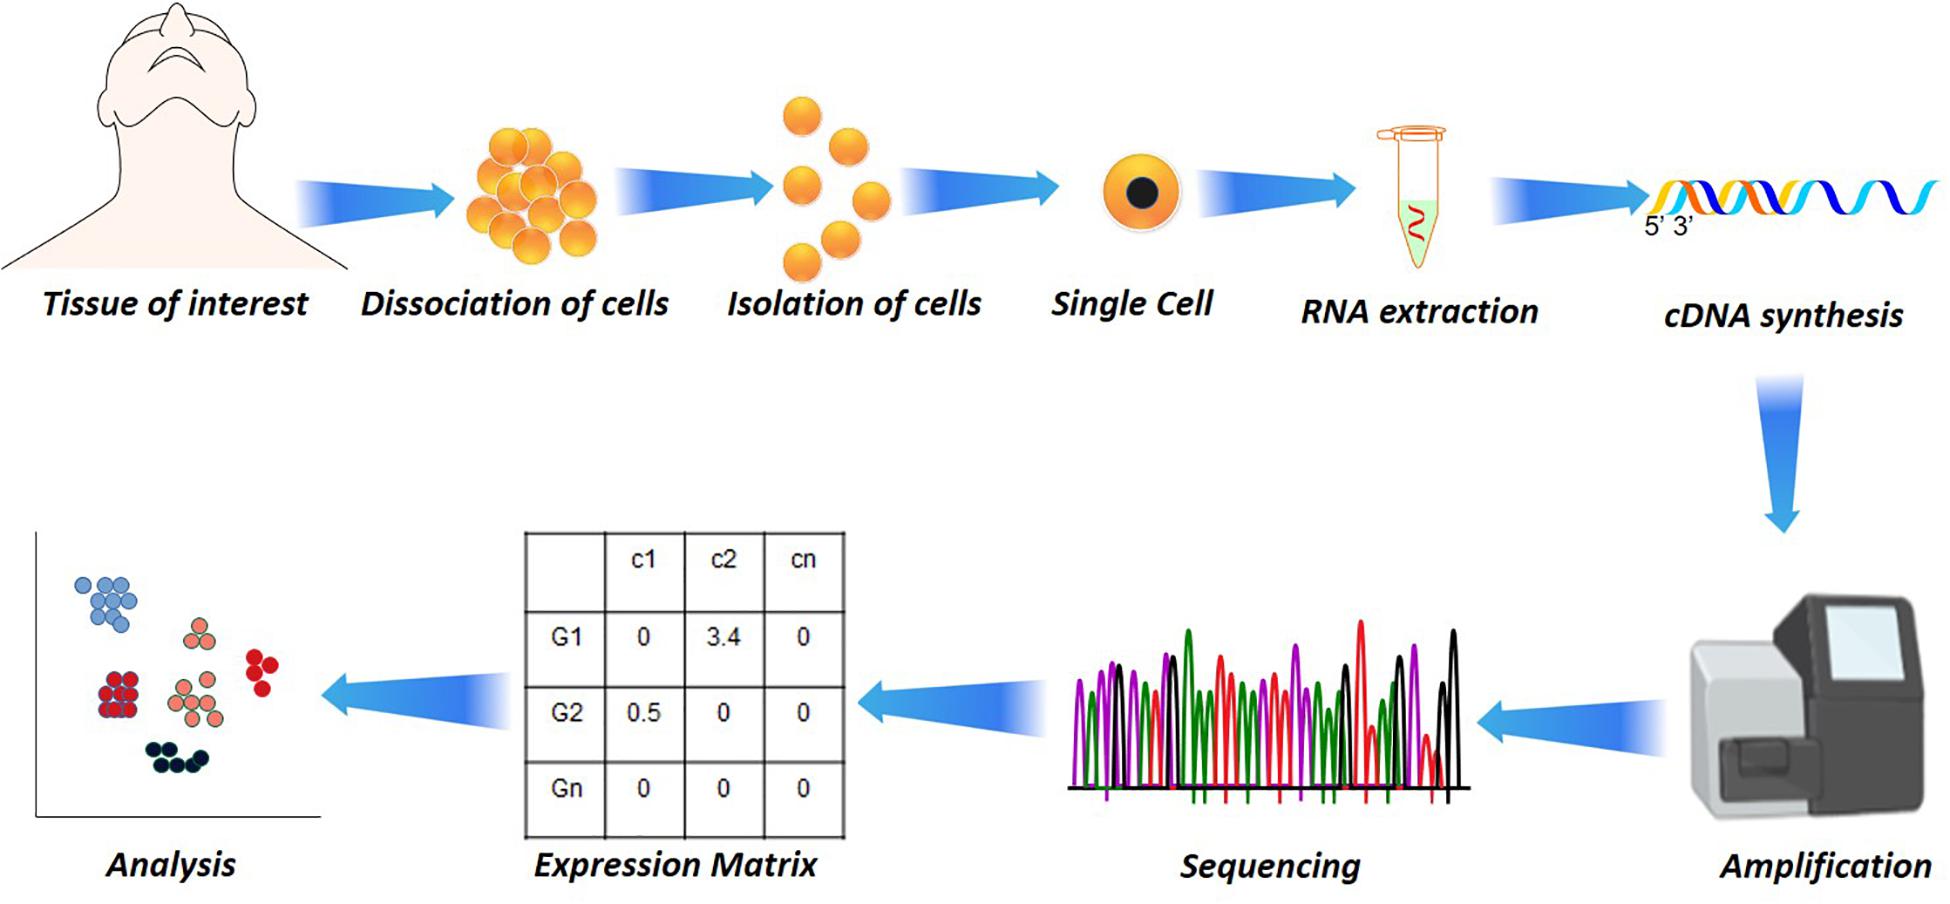
Figure 1. Single-cell analysis in disease and health. Starting from the dissociation of target cells from the target tissue/organ, their isolation based on fluorescence-activated cell sorting (FACS) or other microfluidic techniques to RNA extraction. The RNA extraction is followed by cDNA synthesis by reverse transcriptase, followed by amplification and sequencing. From the sequencing, the reads are aligned and subjected to quantification that results in a quantification matrix or Gene Expression Matrix.
Quantification of Expression and Quality Control
Like bulk RNA-seq, the transcripts in SC-RNA are sequenced into reads that generate the raw fastq data. The quality of the sequence reads generated in a sequencing method is considered an important quality indicator of SC-RNA-seq data. As the alignment of the transcript reads for SC-RNA-seq is same as bulk RNA-seq, the methods and tools used for the gene or transcript quantification for bulk RNA-seq can also be used for quantifying transcripts generated by SC-RNA-seq (Li and Homer, 2010; Fonseca et al., 2012). HISAT2 (Kim et al., 2019), TopHat2 (Kim et al., 2013), and STAR (Dobin et al., 2013) are currently the most popular alignment tools, which can map billions of reads to a reference transcriptome with greater accuracy and high speed. Transcriptome reconstruction can be either de novo (for samples lacking reference genome) or reference based, also called genome-guided assembly (Chen et al., 2011). However, the former technique sometimes lacks accuracy in comparison with the reference-based assembly approach (Garber et al., 2011). For SC-RNA-seq methods that generate data on a whole-transcriptome basis, Smart-seq2 (Picelli et al., 2014) and MATQ-seq (Sheng and Zong, 2019) use Cufflinks, RSEM, Stringtie, etc., for the quantification of transcripts, while methods that incorporate the 3′ end UMI tagging [like Drop-seq (Macosko et al., 2015), InDrop (Klein et al., 2015), MARS-seq (Jaitin et al., 2014), etc.] require specific algorithms to generate the expression count for the transcript. Another efficient tool for the UMI-based methods was developed by Huang and Sanguinetti (2017) for calculating the expression count of SCs accurately. Table 4 provides information about the current tools for read alignment and expression quantification. The SC-RNA-seq exhibits certain limitations, which results in higher technical noise (Kolodziejczyk et al., 2015). In SC-RNA-seq data, many transcripts appear to be lost during reverse transcription due to the small number and low capture efficiency of RNA molecules in SCs (Saliba et al., 2014). Consequently, in one cell, some transcripts are highly expressed but are missing in another cell. This pattern is described as a “dropout” event. It has been reported that even the most sensitive protocol for SC-RNA-seq fails to detect some of the transcripts as part of Dropout events (Haque et al., 2017). When the cells are dissociated or isolated, a certain number of cells become dead or get destroyed. The SC-RNA-seq methods generate low-quality data from these cells (Ilicic et al., 2016). After alignment and quantification of the transcripts, the quality control check of cells is necessary to remove low-quality cells for an accurate downstream analysis.
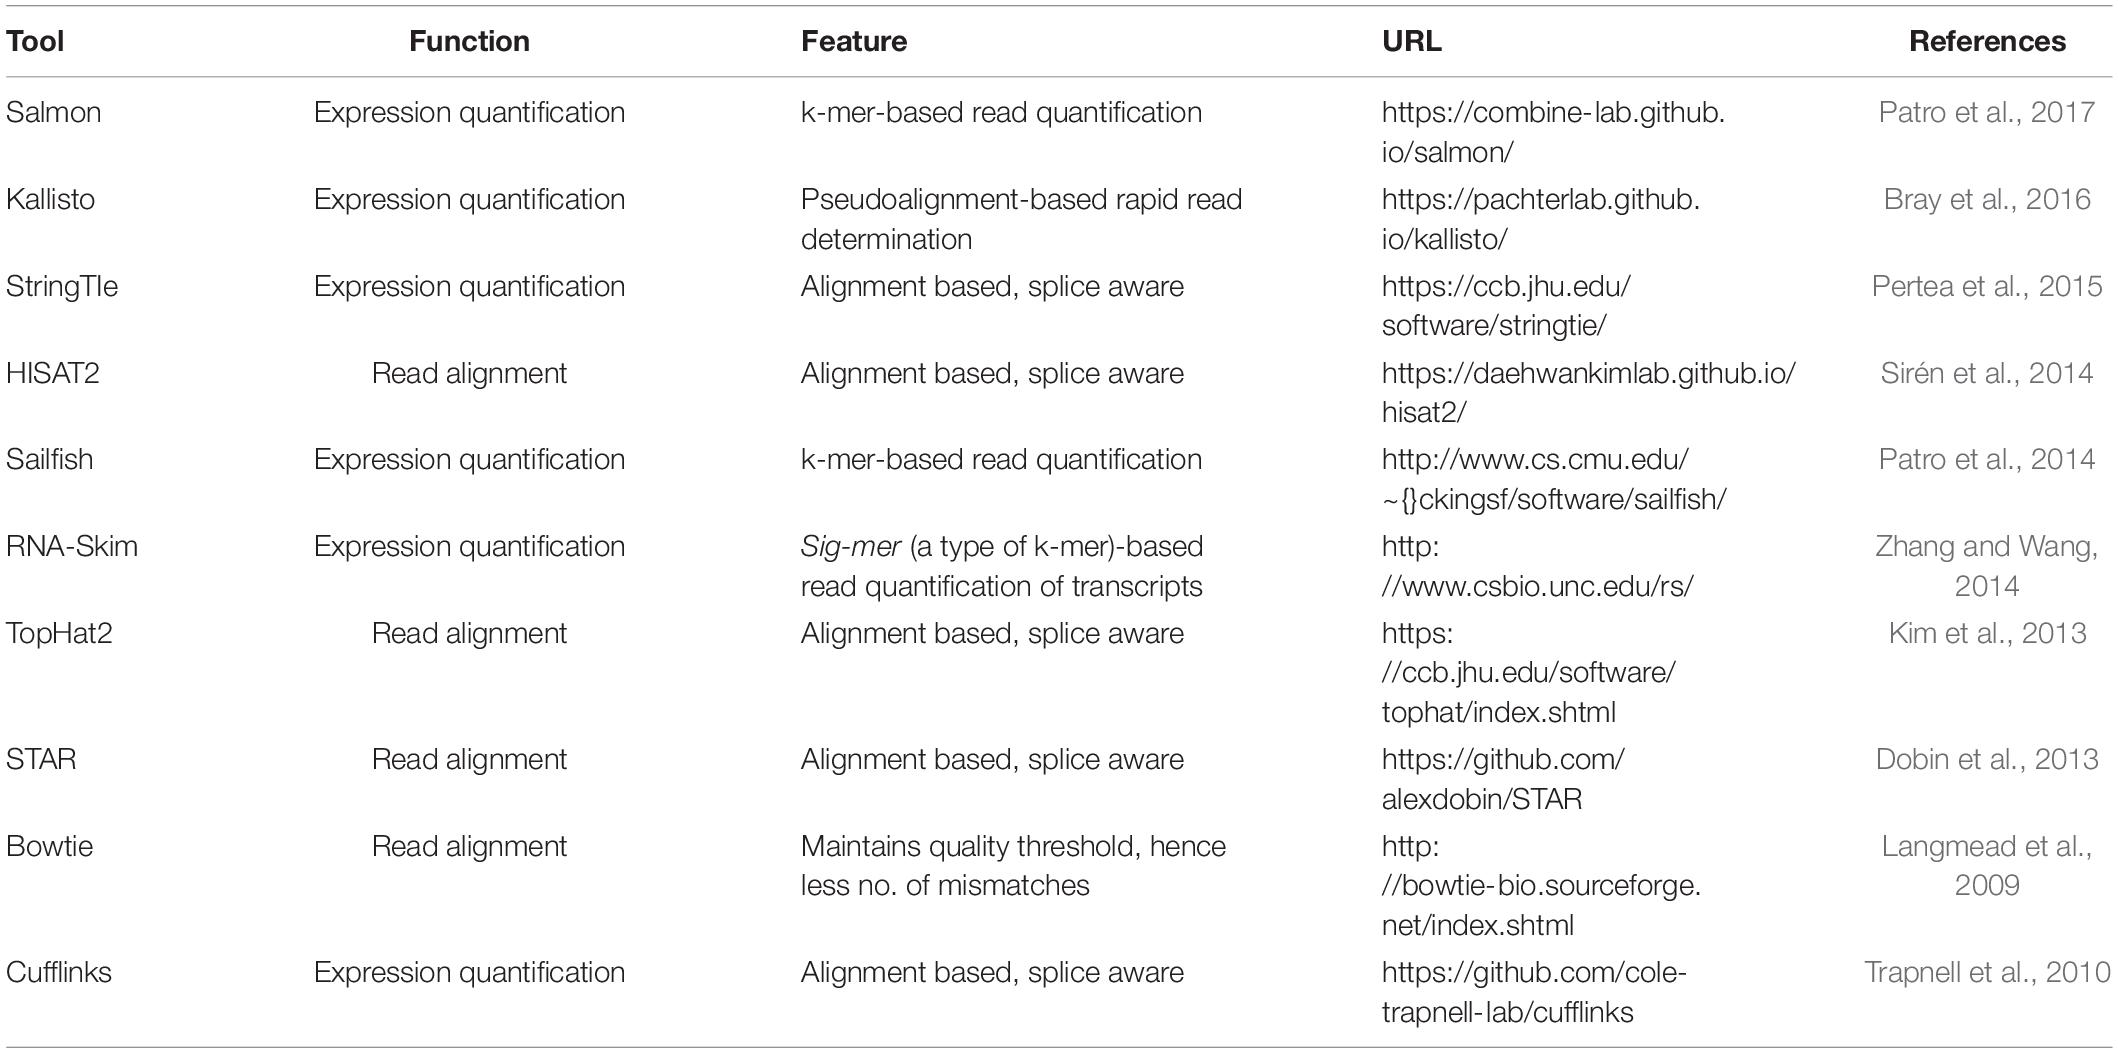
Table 4. Widely used tools for read alignment and expression quantification.
Challenges Impeding Single-Cell RNA sequence Data Analysis
Though SC-RNA-seq has deepened our understanding of the cellular heterogeneity and molecular basis of life, it is impeded by several technical and computational challenges. The foremost among them is that its datasets exhibit a considerable amount of noise attributed to meager starting materials that often causes faulty downstream analysis and erroneous results (Brennecke et al., 2013). The SC-RNA-seq data analysis is performed as subtle execution in computational steps; read alignment, expression count generation, cell quality control, normalizing the data, and then further downstream analysis including SC clustering, differential gene expression (DGE), pseudo-temporal analysis, etc. In addition to low starting materials, the technical noise in the datasets is contributed by various factors, like batch effects (Haghverdi et al., 2018) and the low capture efficiency of protocols (Hwang et al., 2018). A few of the analytical steps, including read alignment and generation of count matrix, can be resolved using already available computational methods designed for bulk RNA-seq. However, data processing tasks like normalization, DGE analysis, cell imputation, and dimensionality reduction, etc., call for the development of novel computational techniques, algorithms, and tools for smooth execution of SC-RNA-seq data analysis. The nature of the challenges that SC-RNA-seq data possess, including big data problem (Costa, 2012; Yu and Lin, 2016; Angerer et al., 2017; He et al., 2017), is highlighted in the following subsections:
Normalization
In SC-RNA-seq, coverage of sequences between the libraries exhibit systematic differences from experimental procedures, dropout events, depth of the sequencing, and other technical effects (Stegle et al., 2015). These differences must be corrected by normalizing the data such that there is no interference in the comparison of the gene expression between cells. Being crucial, normalization of the SC-RNA-seq datasets eventually leads to lucid downstream analysis, including identifying different cell subsets and revealing differential expression of genes. In bulk RNA-seq, expression counts from various libraries are usually normalized by computing the fragments per kilobase of transcript counts of per million mapped fragments (FPKM) (Mortazavi et al., 2008), transcripts per million (TPM) (Li and Dewey, 2011), reads per kilobase of transcripts per million mapped reads (RPKM), upper quartile (UQ) (Bullard et al., 2010), DESeq (Love et al., 2014), removed unwanted variation (RUV) (Risso et al., 2014), and Gamma regression model (Ding et al., 2015). Generally, there are two types of normalization: (1) normalization of data within the sample, and (2) normalization of the data between the sample (Vallejos et al., 2015, 2017). In the former, FPKM/RPKM or TPM are used to exclude gene-specific biases (Vallejos et al., 2017) such as guanine–cytosine (GC) content and gene length, while in the latter, the normalization method tunes the sample-specific differences such as sequencing depth and capture efficiency. While ignoring the underlying stochasticity, normalization generates a relative expression estimate (Stegle et al., 2015), assuming the overall processed RNA per sample is equal (AlJanahi et al., 2018; Olsen and Baryawno, 2018). The bulk-based strategies for normalization have been reported unsuitable for SC-RNA-seq datasets because the datasets are highly zero-inflated and have higher technical noise. Multiple methods have been developed for normalizing the SC-RNA-seq data (Vallejos et al., 2015; Lun et al., 2016; Sengupta et al., 2016; Bacher et al., 2017; Yip et al., 2017). However, O(nlogn) is considered more efficient than others in performing normalization of SC-RNA-seq data (Yip et al., 2017).
Dimensionality Reduction
High dimensionality is yet another challenge that SC-RNA-seq data present. Owing to the data coming from cells showing high dimensions, i.e., a large number of genes, it is necessary to reduce (while optimally preserving the critical properties) the set of random variables and work with the principle variables which describe the data profoundly (Andrews and Hemberg, 2019). The two most frequently used methods for dimensionality reduction are principal component analysis (PCA) (Van Der Maaten et al., 2009) and T-distribution stochastic neighbor embedding (t-SNE) (Van Der Maaten and Hinton, 2008; Kobak and Berens, 2019). PCA uses a linear process to transform a set of variables (possibly correlated) into an uncorrelated variable known as a principal component, while t-SNE is a non-linear probability distribution-based approach. Both PCA and t-SNE methods of dimensionality reduction have certain limitations (Chen et al., 2019); based on the assumption that approximately all the data are distributed normally, PCA does not effectively amount to the underlying complexities in the structure of SC-RNA-seq data, and t-SNE has a larger time complexity reaching O(n2) (Pezzotti et al., 2017). The most recent algorithm employed for dimensionality reduction “UMAP” (Uniform Manifold Approximation and Projection) (McInnes et al., 2018; Becht et al., 2019) outperforms PCA and t-SNE for SC-RNA-seq in terms of high reproducibility and meaningful organization of cells (Becht et al., 2018). UMAP is a non-linear graph-based algorithm that tends to identify the closest neighbors of a data point and assigns them a larger weight, thereby preserving the topological structure of the data. The idea is to project a low-dimensional representation of the data while preserving the nearest neighbours of an individual data point (i.e., cells). This helps to group more closely related neighbours and partly conserves the relation of points in the “long-range” using the intermediate data points. Although the interpretation of the distances in a reduced space becomes difficult, UMAP has been largely able to uncover the elusive features of the data. UMAP is computationally faster than t-SNE, preserves the global structure, and maintains the continuity of cell subsets (Becht et al., 2018). At the core, UMAP assumes the subsistence of a “manifold structure” in the data. This assumption makes it find the manifolds in the noise of data. Since SC-RNA-seq suffers from a significant amount of noise, it is necessary to consider it before applying UMAP (McInnes et al., 2018).
Another method to perform dimensionality reduction is the linear discriminant analysis (LDA). LDA is a supervised dimensionality reduction method that tends to maximize the separability between the predetermined classes, using the covariance of “between-class” and “within-class.” It first calculates the mean of the distances between the classes and then the mean of distances within the classes. The goal is to find a projection to maximize the ratio of between-class variability to the lower within-class variability (Tharwat et al., 2017; Qiao and Meister, 2020).
The SC-RNA-seq exhibits potential challenges similar to text mining, such as polysemy and synonymy, noise, and sparsity. Recently, a popular text mining technique, latent semantic analysis (LSA), has been used in SC-RNA-seq dimensionality reduction (Cheng et al., 2019). LSA at core uses a linear algebra-based method, called singular value decomposition (SVD), to cluster the semantically similar terms. SVD approximates a low-rank matrix to the given cell-gene matrix, such that the dimensions of the new matrix are much less than the original. This approximation is made by taking a combined product of the matrices of left-singular vector, right-singular vector, and the diagonal singular values.
Differential Gene Expression Analysis
The expression of genes is stochastic in a cell; expression values thus observed are quite heterogeneous at the individual level among seemingly similar cells. The DGE analysis helps to understand the innate cellular processes and stochasticity of gene expressions (McDavid et al., 2013). The problem faced in DGE analysis is identifying genes that are largely expressed in a group of cells without any or no preliminary information of primary cell subtypes (Stegle et al., 2015). Additionally, gene expressions in individual cells show multimodality (Kippner et al., 2014). As expression variability of genes between cells of the same type indicates transcriptional heterogeneity (Johnson et al., 2015; Angermueller et al., 2016), it needs robust computational approaches to detect the true heterogeneity. In addition to multimodality, the sparsity due to—but not limited to—dropout events brings irregularities in the data, consequent of which the differential genes are difficult to detect. Various parametric as well as non-parametric approaches like Single-cell Differential Expression, Model-based Analysis of Single-cell Transcriptome (MAST), D3E, scDD, SigEMD, and DEsingle (Kharchenko et al., 2014; Finak et al., 2015; Delmans and Hemberg, 2016; Korthauer et al., 2016; Miao et al., 2018; Wang and Nabavi, 2018) have been developed/proposed for the DGE analysis in the SC-RNA-seq data. However, these tools try to manage either the gene dropouts or multimodality (Wang et al., 2019). For the subtle DGE analysis, these two crucial challenges need to be taken care of together.
Cluster Analysis
Cluster analysis of SC-RNA-seq data is required to identify both known and unknown rare cell types (Menon, 2018). Along with the technical dropout events, the cells show a huge variation in gene expression levels even from the same set. As mentioned above, SC-RNA-seq suffers from massive inflation of zeros. There are three reasons for the observation of zeros in data: (1) the transcript was absent explicitly, hence a “true zero”; (2) the depth of sequencing was very low, and the transcript was present but not accounted for; and (3) at the time of library preparation, the transcript could not be captured or failed to amplify. The measurements from the latter two are considered to be the “false zeros.” The concentration of too many zeros in the data brings in irregularities. These technical and biological factors lead to significant noise, due to which cluster analysis becomes challenging. For this, methods like Seurat, DropClust, and SCANPY (Satija et al., 2015; Ntranos et al., 2016; Yip et al., 2017; Sinha et al., 2018) have been proposed for clustering of SCs. There are certain limitations associated with these as well. Seurat and SCANPY work well with large datasets but underperforms when the dataset is smaller (Kiselev et al., 2019). The anticipated complexity in data and the rate of generation of SC data will be a challenge for all these tools. UMAP is yet another method for cluster identification of SC-RNA-seq data; however, as UMAP tends to preserve the local-topological structure, it is rather difficult to establish a relationship between clusters when the underlying cell subtypes are unknown.
In addition to the sparsity in data, SC-RNA-seq data suffer from a huge level of noise from faulty experimental designs usually referred to as “batch-effects.” The noise in the data may contribute to the overfitting of the data. The overfitting can be avoided using regularization. Regularization is a process of restricting or reducing the features at the time of modeling.
So far, the clustering methods cluster the cells as per the transcription similarity, but the biological annotation of cell clusters remains a challenge. A possible solution could come from the generation of the data itself, as the more data are accumulated, the more can unknown clusters be matched with the previously known clusters. Another popular approach for cluster annotation is to use Gene Ontology (GO) analysis of the marker genes (Ashburner et al., 2000).
Single-Cell Spatial Transcriptomics and RNA Velocity
Spatial transcriptomics (ST) gives measurement of gene expression changes with reference to geographical coordinates of the cells in tissues. It allows measurements of the transcripts with an advantage of conserving the spatial information, providing an additional analytical edge (Burgess, 2019). ST conform to in situ methods like seqFISH (Shah et al., 2016), seqFISH+ (Eng et al., 2019), FISSEQ (Fluorescence in situ Sequence) (Lee et al., 2015), MERFISH (Chen et al., 2015), and SC-RNA-seq-based methods like slide-seq (Rodriques et al., 2019) and Niche-seq (Medaglia et al., 2017). In situ labeling of the transcripts in tissues is advantageous for visualizing the location; however, a chance of molecular overcrowding results in fluorescence signal overlap. This overcrowding can be overcome by using SC spatial RNA-seq; however, the dissociation of cells prior to sequencing makes it difficult to link the transcriptomes back to their original locations (Burgess, 2019). These complementary strengths and limitations make it necessary to integrate the datasets generated by each technology.
In ST, a pair of images are generated, one containing whole tissue with fairly visible spots and the other having clearly visible fluorescence array spots (Wong et al., 2018). To leverage the ST, the image data from ST need to be integrated with the SC-RNA-seq data. As the principle challenges in both ST and SC-RNA-seq are the sparsity of the data and noise from technical and biological sources, an accurate data normalization and transformation is necessary before any downstream analysis (Wagner et al., 2016). Few tools have been developed to determine the cell types with respect to their spatial identities (Edsgärd et al., 2018; Svensson et al., 2018; Dries et al., 2019; Queen et al., 2019). These tools lack interactive processing of images and fails in providing a comprehensive three-dimensional view of the tissue. Recently, STUtility (Bergenstråhle et al., 2020b)—an R package using non-negative matrix factorization (NMF) for reducing the dimensions, spatial correlation (based on Pearson correlation), and K-means clustering—was found capable of providing a holistic view of the expression in tissues. SpatialCPie (Bergenstråhle et al., 2020a) is another easy-to-use R package that uses clustering at various resolutions to interactively uncover the gene expression patterns. Elosua-Bayes et al. (2021) developed SPOTlight, which uses NMF along with non-negative least squares (NNLS). NMF helps in dimensional reduction, followed by selection of marker genes using seurat package and then using NNLS to deconvolute each captured location (Elosua-Bayes et al., 2021).
The SC-RNA measurements have advanced our understanding of the intrinsic cellular functionalities; however, the destruction of cells in the process ceases the possibility of further resampling for an additional transcriptional state analysis. A new methodology, RNA velocity, is capable of deducing the future transcriptional state of a cell (La Manno et al., 2018). The idea behind the study is that the transcriptional upregulation of gene at a particular stage leads to the short-spanned abundance of unspliced transcripts. Similarly, the downregulation of the gene at a point of time results in a decrease of spliced transcripts. The ratio of this variation between unspliced and spliced transcripts is used to estimate the future state of a cell.
Single-Cell Multi-omics and Data Integration
Biological activities in cells are perplexing, and the measurements of these processes show contrasting variation at temporal and histological levels. To comprehensively understand the intricate biological process of cells and organisms, it is necessary to investigate them at a multi-omics scale. Contingent upon the research question, SC experiments have flexed its reach to variety of layers, the majority of which include the following: (1) SCI-seq for Single-cell Genome Sequencing (Vitak et al., 2017), (2) scBS-seq for Single-cell DNA methylation (Smallwood et al., 2014), (3) scATAC-seq for Single-cell chromatin accessibility (Buenrostro et al., 2015), (4) CITE-seq for cell Surface Proteins (Stoeckius et al., 2017), (5) scCHIP-seq for Histone Modifications (Gomez et al., 2013), and (6) scGESTALT (Frieda et al., 2017) and MEMOIR (Raj et al., 2018) for chromosomal conformation. A universal challenge for all the SC technologies is that the measurements from a very low starting material led to generation of highly sparse and extremely noisy data. Hence, the integration of this data requires a statistically sound and robust computational framework. A primary challenge thereof remains to find an empirical strategy to normalize, batch-effect correction and linking the data from different sources so that the biological meaning and inference remain uncompromised.
For the integration and analysis of the SC multi-omics data, several methods developed for the variety of SC-mono-omics data have been fused or extended further to fulfill the requirement. However, each tool follows a different strategy for the analysis, which can be categorized as follows: (1) correlation and unsupervised cluster analysis; (2) data integration of different samples from a single measurement type and a single experiment type, e.g., SC-RNA-seq; (3) analysis and integration of data from different experiments and a single measurement type across different samples, e.g., sc-Spatial Transcriptomics; (4) integration of data from SC population, with more than one measurement type, different samples, and a single experiment; and (5) integration of data across multiple cells, multiple experiments, and multiple measurement types, e.g., combination of the SC-RNA-seq, scATAC, scCHIP-seq, CITE-seq, etc., of different cells collected at different time points (Stuart et al., 2019; Lähnemann et al., 2020; Lee et al., 2020).
Computational methods and tools for integration of biological data are evolving gradually. A number of techniques have been developed that have been discussed in section “Cluster Analysis.” Seurat (Butler et al., 2018) is currently at the top of integrative analysis of SC multi-omics data, integrating the datasets based on the second principle. Along with Seurat, mutual nearest neighbor (MNN)-based method (Haghverdi et al., 2018) has been exploited to analyze the data combined on the basis of the second category. For the fourth category, analytical methods developed for bulk cellular analysis like MOFA (Argelaguet et al., 2018), MINT (Rohart et al., 2017a), mixOmics (Rohart et al., 2017b), and DIABLO (Singh et al., 2019) are being utilized. Cardelino (McCarthy et al., 2018), MATCHER (Welch et al., 2017), and cloealign (Campbell et al., 2019) are currently the tools used for integrative analysis under the fourth category. To our knowledge, there are no tools available for the last category.
Big Data Pertaining to Single-Cell RNA Sequencing
The data-intensive scientific discoveries rely on three paradigms—theory, experimentation, and simulation modeling (Tolle et al., 2011). As big data is described with three characteristics (volume, velocity, and variety) (Stephens et al., 2015; Adil et al., 2016), data generated by SC-RNA-seq are tantamount to these three quantitative characteristics (Ivanov et al., 2013). With the introduction of new methods in microfluidics (Zare and Kim, 2010), combinatorial indexing procedures (Fan et al., 2015), and rapid drop in the sequencing cost, SC assay profiling has widely become a routine practice among biologists for analyzing millions of cells in hours, paving the way for the accumulation of a large amount of data. The most popular next-generation sequencing platform, Illumina HiSeq, results in the accumulation of around 100 gigabytes of raw RNA-seq data per study. It usually takes hours to align these raw data to their reference genome. SC experiments generating petabytes of data on a variety of layers contribute to the big data paradigm. A human genome has 20,000–25,000 genes composed of 3 million base pairs, totaling to 100 gigabytes of data, equivalent to 102,400 photos1; it is expected that more or less “25 petabytes” of genomic data will be generated annually around the globe by the year 2030 (Khoury et al., 2020). It is anticipated that human genomic data can potentially overtake the data produced by online social networks (Check Hayden, 2015). The Human Cell Atlas (HCA)—a project to prepare a reference map of each cell in the human body at various stages, will accumulate a massive amount of data by the end of its completion (Regev et al., 2017). There is a need for comprehensive integration of big data and SC-RNA-seq technologies. A large number of publications on SC-RNA and big data have emerged lately (Figure 2A). The datasets of 4.5 million cells are already published in Data2, the largest of which contains more than 1.5 million CD34+ hematopoietic cells of human bone marrow (Setty et al., 2019) and 1.3 million transcriptomes of mouse brain cells (Figures 2B,C).
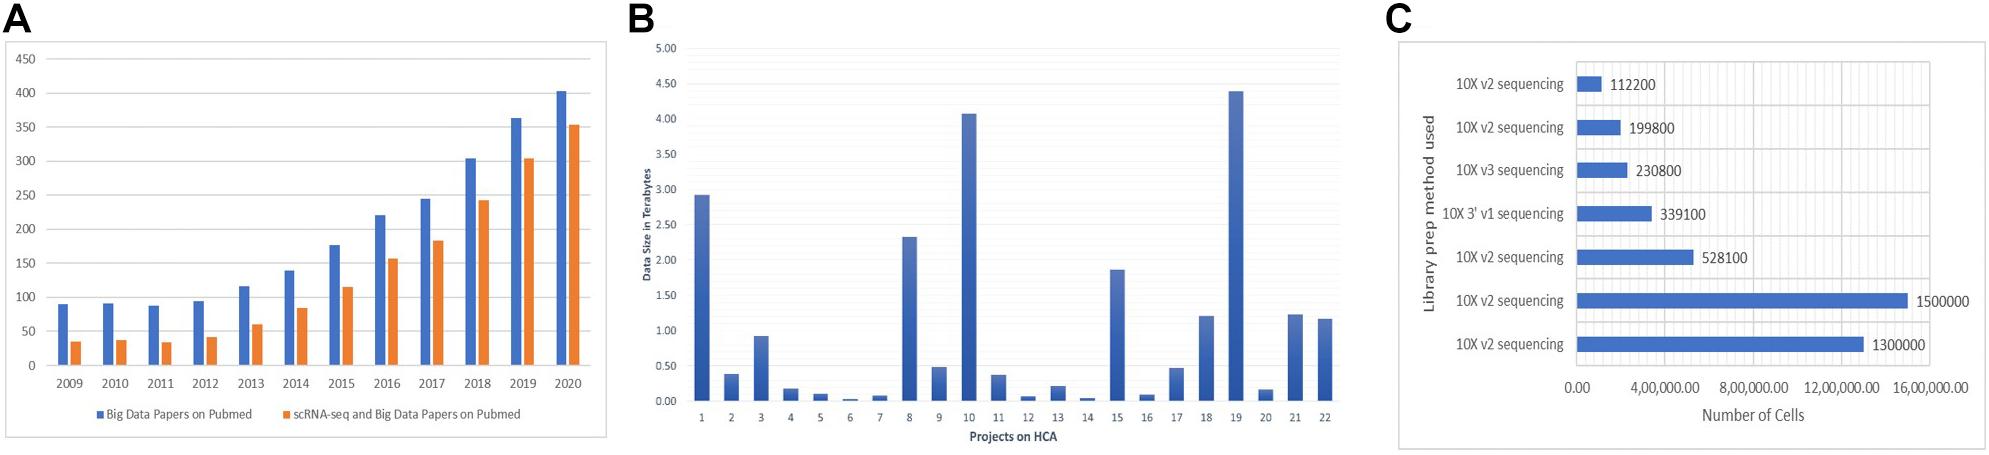
Figure 2. (A) There is a steep rise every year for the publications of studies addressing the big data and SC-RNA-seq. For big data papers on PubMed, we used the query “[big data (All Fields) AND MapReduce (All Fields) AND Hadoop (All fields)].” For SC-RNA-seq and big data papers on PubMed, we used “[(scRNA-seq OR Big Data) OR (Single-cell AND big data)].” (B,C) Numbers were collected from the Human Cell Atlas Data portal of some exemplary projects.
Consequently, the data acquired from these experiments constitute a data revolution in the field of SC biology (Lähnemann et al., 2019). As SC-RNA-seq data have a greater potential of uncovering the hidden patterns at the molecular level, the data pertaining to it thus require an extremely parallel, scalable, and statistically sound computational framework as its handling tools. Big data technologies like Apache’s Hadoop (Taylor, 2010; O’Driscoll et al., 2013) and Spark (Zaharia et al., 2016; Guo et al., 2018) embody the required computational parallelism and data distribution mechanisms. Hadoop uses MapReduce technology for parallel and scalable processing (Dean and Ghemawat, 2008) to disintegrate the larger problems into smaller subproblems on a distributed file system called Hadoop Distributed File System (HDFS). Incorporating big data technologies in the analysis of rapidly increasing SC genomics data will help in transforming and processing it with limitless scalability and fault tolerance at a very low cost.
Conclusion and Future Perspective
As a consequence of meager RNA capture rate, low starting materials, and challenging experimental protocols, the SC-RNA-seq faces computational and analytical challenges. The noise and sparsity due to the technical (dropout events) and biological factors make the downstream analysis of SC-RNA-seq data a complicated task. Additionally, the rapidity in the development of new and exciting experimental methods for SC-RNA-seq is paving the way for a large accumulation of data. This large agglomeration of data is nothing but the genomic face of “big data.” These two challenges together give rise to a new paradigm of Big Single-Cell Data Science. Although a plethora of algorithms and computational tools have already been developed, it is essential to address these challenges collectively and produce a robust, accurate, parallel, and scalable framework.
Author Contributions
MA and ATJ conceived the idea, edited the manuscript, and contributed to the compilation of data for designing of figures. AA, VK, and ATJ contributed to the writing of the manuscript. All authors contributed to the article and approved the submitted version.
Funding
ATJ is grateful to DST-SERB for financial support (CRG/2019/004106) that helped in to establishing the infrastructural facilities.
Conflict of Interest
The authors declare that the research was conducted in the absence of any commercial or financial relationships that could be construed as a potential conflict of interest.
Acknowledgments
The authors would like to thank their colleagues for the help in improving the contents of the manuscript.
Footnotes
References
Adil, A., Kar, H. A., Jangir, R., and Sofi, S. A. (2016). “Analysis of multi-diseases using big data for improvement in healthcare,” in Proceedings of the 2015 IEEE UP Section Conference on Electrical Computer and Electronics, UPCON 2015, Allahabad. doi: 10.1109/UPCON.2015.7456696
AlJanahi, A. A., Danielsen, M., and Dunbar, C. E. (2018). An introduction to the analysis of single-cell RNA-sequencing data. Mol. Ther. Methods Clin. Dev. 10, 189–196. doi: 10.1016/j.omtm.2018.07.003
Altschuler, S. J., and Wu, L. F. (2010). Cellular heterogeneity: do differences make a difference? Cell 141, 559–563. doi: 10.1016/j.cell.2010.04.033
Andrews, T. S., and Hemberg, M. (2019). M3Drop: dropout-based feature selection for scRNASeq. Bioinformatics (Oxford, England) 35, 2865–2867. doi: 10.1093/bioinformatics/bty1044
Angerer, P., Simon, L., Tritschler, S., Wolf, F. A., Fischer, D., and Theis, F. J. (2017). Single cells make big data: new challenges and opportunities in transcriptomics. Curr. Opin. Syst. Biol. 4, 85–91. doi: 10.1016/j.coisb.2017.07.004
Angermueller, C., Clark, S. J., Lee, H. J., Macaulay, I. C., Teng, M. J., Hu, T. X., et al. (2016). Parallel single-cell sequencing links transcriptional and epigenetic heterogeneity. Nat. Methods 13, 229–232. doi: 10.1038/nmeth.3728
Argelaguet, R., Velten, B., Arnol, D., Dietrich, S., Zenz, T., Marioni, J. C., et al. (2018). Multi-omics factor analysis—a framework for unsupervised integration of multi-omics data sets. Mol. Syst. Biol. 14:8124. doi: 10.15252/msb.20178124
Ashburner, M., Ball, C. A., Blake, J. A., Botstein, D., Butler, H., Cherry, J. M., et al. (2000). Gene ontology: tool for the unification of biology. Nat. Genet. 25, 25–29. doi: 10.1038/75556
Bacher, R., Chu, L. F., Leng, N., Gasch, A. P., Thomson, J. A., Stewart, R. M., et al. (2017). SCnorm: robust normalization of single-cell RNA-seq data. Nat. Methods 14, 584–586. doi: 10.1038/nmeth.4263
Beakke, M. K. (1951). Density gradient centrifugation: a new separation technique. J. Am. Chem. Soc. 73, 1847–1848. doi: 10.1021/ja01148a508
Becht, E., Dutertre, C.-A., Kwok, I., Ng, L. G., Ginhoux, F., and Newell, E. (2018). Evaluation of UMAP as an alternative to t-SNE for single-cell data. bioRxiv [Preprint]. doi: 10.1101/298430
Becht, E., McInnes, L., Healy, J., Dutertre, C. A., Kwok, I. W. H., Ng, L. G., et al. (2019). Dimensionality reduction for visualizing single-cell data using UMAP. Nat. Biotechnol. 37, 38–44. doi: 10.1038/nbt.4314
Bergenstråhle, J., Bergenstråhle, L., and Lundeberg, J. (2020a). SpatialCPie: an R/Bioconductor package for spatial transcriptomics cluster evaluation. BMC Bioinform. 21:161. doi: 10.1186/s12859-020-3489-7
Bergenstråhle, J., Larsson, L., and Lundeberg, J. (2020b). Seamless integration of image and molecular analysis for spatial transcriptomics workflows. BMC Genomics 21:482. doi: 10.1186/s12864-020-06832-3
Bray, N. L., Pimentel, H., Melsted, P., and Pachter, L. (2016). Near-optimal probabilistic RNA-seq quantification. Nat. Biotechnol. 34, 525–527. doi: 10.1038/nbt.3519
Brennecke, P., Anders, S., Kim, J. K., Kołodziejczyk, A. A., Zhang, X., Proserpio, V., et al. (2013). Accounting for technical noise in single-cell RNA-seq experiments. Nat. Methods 10, 1093–1098. doi: 10.1038/nmeth.2645
Buenrostro, J. D., Wu, B., Litzenburger, U. M., Ruff, D., Gonzales, M. L., Snyder, M. P., et al. (2015). Single-cell chromatin accessibility reveals principles of regulatory variation. Nature 523, 486–490. doi: 10.1038/nature14590
Bullard, J. H., Purdom, E., Hansen, K. D., and Dudoit, S. (2010). Evaluation of statistical methods for normalization and differential expression in mRNA-Seq experiments. BMC Bioinformatics 11:94. doi: 10.1186/1471-2105-11-94
Burgess, D. J. (2019). Spatial transcriptomics coming of age. Nat. Rev. Genet. 20:317. doi: 10.1038/s41576-019-0129-z
Butler, A., Hoffman, P., Smibert, P., Papalexi, E., and Satija, R. (2018). Integrating single-cell transcriptomic data across different conditions, technologies, and species. Nat. Biotechnol. 36, 411–420. doi: 10.1038/nbt.4096
Campbell, K. R., Steif, A., Laks, E., Zahn, H., Lai, D., McPherson, A., et al. (2019). Clonealign: statistical integration of independent single-cell RNA and DNA sequencing data from human cancers. Genome Biol. 20:54. doi: 10.1186/s13059-019-1645-z
Check Hayden, E. (2015). Genome researchers raise alarm over big data. Nature 312–314. doi: 10.1038/nature.2015.17912
Chen, G., Ning, B., and Shi, T. (2019). Single-cell RNA-seq technologies and related computational data analysis. Front. Genet. 10:317. doi: 10.3389/fgene.2019.00317
Chen, G., Wang, C., and Shi, T. L. (2011). Overview of available methods for diverse RNA-Seq data analyses. Sci. China Life Sci. 54, 1121–1128. doi: 10.1007/s11427-011-4255-x
Chen, K. H., Boettiger, A. N., Moffitt, J. R., Wang, S., and Zhuang, X. (2015). Spatially resolved, highly multiplexed RNA profiling in single cells. Science 348:6090. doi: 10.1126/science.aaa6090
Cheng, C., Easton, J., Rosencrance, C., Li, Y., Ju, B., Williams, J., et al. (2019). Latent cellular analysis robustly reveals subtle diversity in large-scale single-cell RNA-seq data. Nucleic Acids Res. 47:e143. doi: 10.1093/nar/gkz826
Citri, A., Pang, Z. P., Südhof, T. C., Wernig, M., and Malenka, R. C. (2012). Comprehensive qPCR profiling of gene expression in single neuronal cells. Nat. Protoc. 7, 118–127. doi: 10.1038/nprot.2011.430
Dean, J., and Ghemawat, S. (2008). MapReduce: simplified data processing on large clusters. Commun. ACM 51, 107–113. doi: 10.1145/1327452.1327492
Delmans, M., and Hemberg, M. (2016). Discrete distributional differential expression (D3E) - a tool for gene expression analysis of single-cell RNA-seq data. BMC Bioinform. 17:110. doi: 10.1186/s12859-016-0944-6
Ding, B., Zheng, L., Zhu, Y., Li, N., Jia, H., Ai, R., et al. (2015). Normalization and noise reduction for single cell RNA-seq experiments. Bioinformatics 31, 2225–2227. doi: 10.1093/bioinformatics/btv122
Dobin, A., Davis, C. A., Schlesinger, F., Drenkow, J., Zaleski, C., Jha, S., et al. (2013). STAR: Ultrafast universal RNA-seq aligner. Bioinformatics 29, 15–21. doi: 10.1093/bioinformatics/bts635
Dries, R., Zhu, Q., Eng, C. H. L., Sarkar, A., Bao, F., George, R. E., et al. (2019). Giotto, a pipeline for integrative analysis and visualization of single-cell spatial transcriptomic data. bioRxiv [Preprint]. doi: 10.1101/701680
Edsgärd, D., Johnsson, P., and Sandberg, R. (2018). Identification of spatial expression trends in single-cell gene expression data. Nat. Methods 15, 339–342. doi: 10.1038/nmeth.4634
Elosua-Bayes, M., Nieto, P., Mereu, E., Gut, I., and Heyn, H. (2021). SPOTlight: seeded NMF regression to deconvolute spatial transcriptomics spots with single-cell transcriptomes. Nucleic Acids Res. gkab043. doi: 10.1093/nar/gkab043
Eng, C. H. L., Lawson, M., Zhu, Q., Dries, R., Koulena, N., Takei, Y., et al. (2019). Transcriptome-scale super-resolved imaging in tissues by RNA seqFISH+. Nature 568:235. doi: 10.1038/s41586-019-1049-y
Espina, V., Wulfkuhle, J. D., Calvert, V. S., VanMeter, A., Zhou, W., Coukos, G., et al. (2006). Laser-capture microdissection. Nat. Protoc. 1, 586–603. doi: 10.1038/nprot.2006.85
Fan, H. C., Fu, G. K., and Fodor, S. P. A. (2015). Combinatorial labeling of single cells for gene expression cytometry. Science 347:1258367. doi: 10.1126/science.1258367
Finak, G., McDavid, A., Yajima, M., Deng, J., Gersuk, V., Shalek, A. K., et al. (2015). MAST: A flexible statistical framework for assessing transcriptional changes and characterizing heterogeneity in single-cell RNA sequencing data. Genome Biol. 16:278. doi: 10.1186/s13059-015-0844-5
Fonseca, N. A., Rung, J., Brazma, A., and Marioni, J. C. (2012). Tools for mapping high-throughput sequencing data. Bioinformatics 28, 3169–3177. doi: 10.1093/bioinformatics/bts605
Frieda, K. L., Linton, J. M., Hormoz, S., Choi, J., Chow, K. H. K., Singer, Z. S., et al. (2017). Synthetic recording and in situ readout of lineage information in single cells. Nature 541, 59–64. doi: 10.1038/nature20777
Garber, M., Grabherr, M. G., Guttman, M., and Trapnell, C. (2011). Computational methods for transcriptome annotation and quantification using RNA-seq. Nat. Methods 8, 469–477. doi: 10.1038/nmeth.1613
Gomez, D., Shankman, L. S., Nguyen, A. T., and Owens, G. K. (2013). Detection of histone modifications at specific gene loci in single cells in histological sections. Nat. Methods 10, 171–177. doi: 10.1038/nmeth.2332
Gross, A., Schoendube, J., Zimmermann, S., Steeb, M., Zengerle, R., and Koltay, P. (2015). Technologies for single-cell isolation. Int. J. Mol. Sci. 16, 16897–16919. doi: 10.3390/ijms160816897
Guo, R., Zhao, Y., Zou, Q., Fang, X., and Peng, S. (2018). Bioinformatics applications on apache spark. GigaScience 7:giy098. doi: 10.1093/gigascience/giy098
Gupta, I., Collier, P. G., Haase, B., Mahfouz, A., Joglekar, A., Floyd, T., et al. (2018). Single-cell isoform RNA sequencing characterizes isoforms in thousands of cerebellar cells. Nat. Biotechnol. 36, 1197–1202. doi: 10.1038/nbt.4259
Haghverdi, L., Lun, A. T. L., Morgan, M. D., and Marioni, J. C. (2018). Batch effects in single-cell RNA-sequencing data are corrected by matching mutual nearest neighbors. Nat. Biotechnol. 36, 421–427. doi: 10.1038/nbt.4091
Haque, A., Engel, J., Teichmann, S. A., and Lönnberg, T. (2017). A practical guide to single-cell RNA-sequencing for biomedical research and clinical applications. Genome Med. 9, 1–12. doi: 10.1186/s13073-017-0467-4
Hashimshony, T., Senderovich, N., Avital, G., Klochendler, A., de Leeuw, Y., Anavy, L., et al. (2016). CEL-Seq2: Sensitive highly-multiplexed single-cell RNA-Seq. Genome Biol. 17:77. doi: 10.1186/s13059-016-0938-8
He, K. Y., Ge, D., and He, M. M. (2017). Big data analytics for genomic medicine. Int. J. Mol. Sci. 18, 1–18. doi: 10.3390/ijms18020412
Herzenberg, L. A., Parks, D., Sahaf, B., Perez, O., Roederer, M., and Herzenberg, L. A. (2002). The history and future of the fluorescence activated cell sorter and flow cytometry: a view from Stanford. Clin. Chem. 48, 1819–1827.
Hu, P., Zhang, W., Xin, H., and Deng, G. (2016). Single cell isolation and analysis. Front. Cell Dev. Biol. 4:116. doi: 10.3389/fcell.2016.00116
Huang, Y., and Sanguinetti, G. (2017). BRIE: transcriptome-wide splicing quantification in single cells. Genome Biol. 18:123. doi: 10.1186/s13059-017-1248-5
Hwang, B., Lee, J. H., and Bang, D. (2018). Single-cell RNA sequencing technologies and bioinformatics pipelines. Exp. Mol. Med. 50, 1–14. doi: 10.1038/s12276-018-0071-8
Ilicic, T., Kim, J. K., Kolodziejczyk, A. A., Bagger, F. O., McCarthy, D. J., Marioni, J. C., et al. (2016). Classification of low quality cells from single-cell RNA-seq data. Genome Biol. 17:29. doi: 10.1186/s13059-016-0888-1
Islam, S., Zeisel, A., Joost, S., La Manno, G., Zajac, P., Kasper, M., et al. (2014). Quantitative single-cell RNA-seq with unique molecular identifiers. Nat. Methods 11, 163–166. doi: 10.1038/nmeth.2772
Ivanov, T., Korfiatis, N., and Zicari, R. V. (2013). On the Inequality of the 3V’s of Big Data Architectural Paradigms: A Case For Heterogeneity. Available online at: https://arxiv.org/abs/1311.0805
Jaitin, D. A., Kenigsberg, E., Keren-Shaul, H., Elefant, N., Paul, F., Zaretsky, I., et al. (2014). Massively parallel single-cell RNA-seq for marker-free decomposition of tissues into cell types. Science 343, 776–779. doi: 10.1126/science.1247651
Johnson, M. B., Wang, P. P., Atabay, K. D., Murphy, E. A., Doan, R. N., Hecht, J. L., et al. (2015). Single-cell analysis reveals transcriptional heterogeneity of neural progenitors in human cortex. Nat. Neurosci. 18, 637–646. doi: 10.1038/nn.3980
Kharchenko, P. V., Silberstein, L., and Scadden, D. T. (2014). Bayesian approach to single-cell differential expression analysis. Nat. Methods 11, 740–742. doi: 10.1038/nmeth.2967
Khoury, M. J., Armstrong, G. L., Bunnell, R. E., Cyril, J., and Iademarco, M. F. (2020). The intersection of genomics and big data with public health: opportunities for precision public health. PLoS Med. 17:e1003373. doi: 10.1371/journal.pmed.1003373
Kim, D., Paggi, J. M., Park, C., Bennett, C., and Salzberg, S. L. (2019). Graph-based genome alignment and genotyping with HISAT2 and HISAT-genotype. Nat. Biotechnol. 37, 907–915. doi: 10.1038/s41587-019-0201-4
Kim, D., Pertea, G., Trapnell, C., Pimentel, H., Kelley, R., and Salzberg, S. L. (2013). TopHat2: accurate alignment of transcriptomes in the presence of insertions, deletions and gene fusions. Genome Biol. 14:R36. doi: 10.1186/gb-2013-14-4-r36
Kippner, L. E., Kim, J., Gibson, G., and Kemp, M. L. (2014). Ingle cell transcriptional analysis reveals novel innate immune cell types. PeerJ 2:e452. doi: 10.7717/peerj.452
Kiselev, V. Y., Andrews, T. S., and Hemberg, M. (2019). Challenges in unsupervised clustering of single-cell RNA-seq data. Nat. Rev. Genet. 20, 273–282. doi: 10.1038/s41576-018-0088-9
Kivioja, T., Vähärautio, A., Karlsson, K., Bonke, M., Enge, M., Linnarsson, S., et al. (2012). Counting absolute numbers of molecules using unique molecular identifiers. Nat. Methods 9, 72–74. doi: 10.1038/nmeth.1778
Klein, A. M., Mazutis, L., Akartuna, I., Tallapragada, N., Veres, A., Li, V., et al. (2015). Droplet barcoding for single-cell transcriptomics applied to embryonic stem cells. Cell 161, 1187–1201. doi: 10.1016/j.cell.2015.04.044
Kobak, D., and Berens, P. (2019). The art of using t-SNE for single-cell transcriptomics. Nat. Commun. 10:5416. doi: 10.1038/s41467-019-13056-x
Kolodziejczyk, A. A., Kim, J. K., Svensson, V., Marioni, J. C., and Teichmann, S. A. (2015). The technology and biology of single-cell RNA sequencing. Mol. Cell 58, 610–620. doi: 10.1016/j.molcel.2015.04.005
Korthauer, K. D., Chu, L. F., Newton, M. A., Li, Y., Thomson, J., Stewart, R., et al. (2016). A statistical approach for identifying differential distributions in single-cell RNA-seq experiments. Genome Biol. 17:222. doi: 10.1186/s13059-016-1077-y
Kulkarni, A., Anderson, A. G., Merullo, D. P., and Konopka, G. (2019). Beyond bulk: a review of single cell transcriptomics methodologies and applications. Curr. Opin. Biotechnol. 58, 129–136. doi: 10.1016/j.copbio.2019.03.001
La Manno, G., Soldatov, R., Zeisel, A., Braun, E., Hochgerner, H., Petukhov, V., et al. (2018). RNA velocity of single cells. Nature 560, 494–498. doi: 10.1038/s41586-018-0414-6
Lähnemann, D., Köster, J., Szczurek, E., Mccarthy, D. J., Hicks, S. C., Mark, D., et al. (2019). 12 grand challenges in single-cell data science. PeerJ 7:e27885v3. doi: 10.7287/peerj.preprints.27885v2
Lähnemann, D., Köster, J., Szczurek, E., McCarthy, D. J., Hicks, S. C., Robinson, M. D., et al. (2020). Eleven grand challenges in single-cell data science. Genome Biol. 21:31. doi: 10.1186/s13059-020-1926-6
Langmead, B., Trapnell, C., Pop, M., and Salzberg, S. L. (2009). Ultrafast and memory-efficient alignment of short DNA sequences to the human genome. Genome Biol. 10:R25. doi: 10.1186/gb-2009-10-3-r25
Lebrigand, K., Magnone, V., Barbry, P., and Waldmann, R. (2020). High throughput error corrected Nanopore single cell transcriptome sequencing. Nat. Commun. 11, 1–8. doi: 10.1038/s41467-020-17800-6
Lee, J., Hyeon, D. Y., and Hwang, D. (2020). Single-cell multiomics: technologies and data analysis methods. Exp. Mol. Med. 52, 1428–1442. doi: 10.1038/s12276-020-0420-2
Lee, J. H., Daugharthy, E. R., Scheiman, J., Kalhor, R., Ferrante, T. C., Terry, R., et al. (2015). Fluorescent in situ sequencing (FISSEQ) of RNA for gene expression profiling in intact cells and tissues. Nat. Protoc. 10, 442–458. doi: 10.1038/nprot.2014.191
Li, B., and Dewey, C. N. (2011). RSEM: accurate transcript quantification from RNA-Seq data with or without a reference genome. BMC Bioinform. 12:323. doi: 10.1186/1471-2105-12-323
Li, H., and Homer, N. (2010). A survey of sequence alignment algorithms for next-generation sequencing. Brief. Bioinform. 11, 473–483. doi: 10.1093/bib/bbq015
Love, M. I., Huber, W., and Anders, S. (2014). Moderated estimation of fold change and dispersion for RNA-seq data with DESeq2. Genome Biol. 15:550. doi: 10.1186/s13059-014-0550-8
Lun, A. T. L., Bach, K., and Marioni, J. C. (2016). Pooling across cells to normalize single-cell RNA sequencing data with many zero counts. Genome Biol. 17:75. doi: 10.1186/s13059-016-0947-7
Macaulay, I. C., Ponting, C. P., and Voet, T. (2017). Single-cell multiomics: multiple measurements from single cells. Trends Genet. 33, 155–168. doi: 10.1016/j.tig.2016.12.003
Macosko, E. Z., Basu, A., Satija, R., Nemesh, J., Shekhar, K., Goldman, M., et al. (2015). Highly parallel genome-wide expression profiling of individual cells using nanoliter droplets. Cell 161, 1202–1214. doi: 10.1016/j.cell.2015.05.002
McCarthy, D. J., Rostom, R., Huang, Y., Kunz, D. J., Danecek, P., Bonder, M. J., et al. (2018). Cardelino: integrating whole exomes and single-cell transcriptomes to reveal phenotypic impact of somatic variants. bioRxiv [Preprint]. doi: 10.1101/413047
McDavid, A., Finak, G., Chattopadyay, P. K., Dominguez, M., Lamoreaux, L., Ma, S. S., et al. (2013). Data exploration, quality control and testing in single-cell qPCR-based gene expression experiments. Bioinformatics 29, 461–467. doi: 10.1093/bioinformatics/bts714
McGann, L. E., Yang, H. Y., and Walterson, M. (1988). Manifestations of cell damage after freezing and thawing. Cryobiology 25, 178–185. doi: 10.1016/0011-2240(88)90024-7
McInnes, L., Healy, J., Saul, N., and Großberger, L. (2018). UMAP: uniform manifold approximation and projection. J. Open Source Softw. 3:861. doi: 10.21105/joss.00861
Medaglia, C., Giladi, A., Stoler-Barak, L., De Giovanni, M., Salame, T. M., Biram, A., et al. (2017). Spatial reconstruction of immune niches by combining photoactivatable reporters and scRNA-seq. Science 358, 1622–1626. doi: 10.1126/science.aao4277
Menon, V. (2018). Clustering single cells: a review of approaches on high-and low-depth single-cell RNA-seq data. Brief. Funct. Genomics 18:434. doi: 10.1093/bfgp/ely001
Miao, Z., Deng, K., Wang, X., and Zhang, X. (2018). DEsingle for detecting three types of differential expression in single-cell RNA-seq data. Bioinformatics (Oxford, England) 34, 3223–3224. doi: 10.1093/bioinformatics/bty332
Mortazavi, A., Williams, B. A., McCue, K., Schaeffer, L., and Wold, B. (2008). Mapping and quantifying mammalian transcriptomes by RNA-Seq. Nat. Methods 5, 621–628. doi: 10.1038/nmeth.1226
Natarajan, K. N., Miao, Z., Jiang, M., Huang, X., Zhou, H., Xie, J., et al. (2019). Comparative analysis of sequencing technologies for single-cell transcriptomics. Genome Biol. 20:70. doi: 10.1186/s13059-019-1676-5
Ntranos, V., Kamath, G. M., Zhang, J. M., Pachter, L., and Tse, D. N. (2016). Fast and accurate single-cell RNA-seq analysis by clustering of transcript-compatibility counts. Genome Biol. 17, 1–14. doi: 10.1186/s13059-016-0970-8
O’Driscoll, A., Daugelaite, J., and Sleator, R. D. (2013). Big data”, Hadoop and cloud computing in genomics. J. Biomed. Inform. 46, 774–781. doi: 10.1016/j.jbi.2013.07.001
Olsen, T. K., and Baryawno, N. (2018). Introduction to single-cell RNA sequencing. Curr. Protoc. Mol. Biol. 122:57. doi: 10.1002/cpmb.57
Ozsolak, F., and Milos, P. M. (2011). RNA sequencing: Advances, challenges and opportunities. Nat. Rev. Genet. 12, 87–98. doi: 10.1038/nrg2934
Patro, R., Duggal, G., Love, M. I., Irizarry, R. A., and Kingsford, C. (2017). Salmon provides fast and bias-aware quantification of transcript expression. Nat. Methods 14, 417–419. doi: 10.1038/nmeth.4197
Patro, R., Mount, S. M., and Kingsford, C. (2014). Sailfish enables alignment-free isoform quantification from RNA-seq reads using lightweight algorithms. Nat. Biotechnol. 32, 462–464. doi: 10.1038/nbt.2862
Pertea, M., Pertea, G. M., Antonescu, C. M., Chang, T. C., Mendell, J. T., and Salzberg, S. L. (2015). StringTie enables improved reconstruction of a transcriptome from RNA-seq reads. Nat. Biotechnol. 33, 290–295. doi: 10.1038/nbt.3122
Pezzotti, N., Lelieveldt, B. P. F., Van Der Maaten, L., Höllt, T., Eisemann, E., and Vilanova, A. (2017). Approximated and user steerable tSNE for progressive visual analytics. IEEE Trans. Visualization Comp. Graphics 23, 1739–1752. doi: 10.1109/TVCG.2016.2570755
Phipson, B., Zappia, L., and Oshlack, A. (2017). Gene length and detection bias in single cell RNA sequencing protocols. F1000Research 6:595. doi: 10.12688/f1000research.11290.1
Picelli, S., Faridani, O. R., Björklund, ÅK., Winberg, G., Sagasser, S., and Sandberg, R. (2014). Full-length RNA-seq from single cells using Smart-seq2. Nat. Protoc. 9, 171–181. doi: 10.1038/nprot.2014.006
Qiao, M., and Meister, M. (2020). Factorized Linear Discriminant Analysis for Phenotype-Guided Representation Learning of Neuronal Gene Expression Data. Available online at: https://arxiv.org/abs/2010.02171v4
Queen, R., Cheung, K., Lisgo, S., Coxhead, J., and Cockell, S. (2019). Spaniel: analysis and interactive sharing of spatial transcriptomics data. bioRxiv [Preprint]. doi: 10.1101/619197
Raj, B., Wagner, D. E., McKenna, A., Pandey, S., Klein, A. M., Shendure, J., et al. (2018). Simultaneous single-cell profiling of lineages and cell types in the vertebrate brain. Nat. Biotechnol. 36, 442–450. doi: 10.1038/nbt.4103
Ramskold, D., Luo, S., Wang, Y., Li, R., Deng, Q., Omid, R., et al. (2013). Full-Length mRNA-Seq from single Cell levels of RNA and individual circulating tumor cells. Nat. Biotechnol. 30, 777–782. doi: 10.1038/nbt.2282.Full-Length
Regev, A., Teichmann, S., Lander, E., Amit, I., Benoist, C., Birney, E., et al. (2017). Science forum: the human cell atlas. eLife 6:e27041.
Risso, D., Ngai, J., Speed, T. P., and Dudoit, S. (2014). Normalization of RNA-seq data using factor analysis of control genes or samples. Nat. Biotechnol. 32, 896–902. doi: 10.1038/nbt.2931
Rodriques, S. G., Stickels, R. R., Goeva, A., Martin, C. A., Murray, E., Vanderburg, C. R., et al. (2019). Slide-seq: a scalable technology for measuring genome-wide expression at high spatial resolution. Science 363, 1463–1467. doi: 10.1126/science.aaw1219
Rohart, F., Eslami, A., Matigian, N., Bougeard, S., and Lê Cao, K. A. (2017a). MINT: a multivariate integrative method to identify reproducible molecular signatures across independent experiments and platforms. BMC Bioinform. 18:128. doi: 10.1186/s12859-017-1553-8
Rohart, F., Gautier, B., Singh, A., and Lê Cao, K. A. (2017b). mixOmics: an R package for ‘omics feature selection and multiple data integration. PLoS Comput. Biol. 13:1005752. doi: 10.1371/journal.pcbi.1005752
Saliba, A. E., Westermann, A. J., Gorski, S. A., and Vogel, J. (2014). Single-cell RNA-seq: Advances and future challenges. Nucleic Acids Res. 42, 8845–8860. doi: 10.1093/nar/gku555
Satija, R., Farrell, J. A., Gennert, D., Schier, A. F., and Regev, A. (2015). Spatial reconstruction of single-cell gene expression data. Nat. Biotechnol. 33, 495–502. doi: 10.1038/nbt.3192
Schmitz, B., Radbruch, A., Kümmel, T., Wickenhauser, C., Korb, H., Hansmann, M. L., et al. (1994). Magnetic activated cell sorting (MACS) - a new imrnunomagnetic method for megakarvocvtic cell isolation. Eur. J. Heamatol. 52, 267–275.
Sena, J. A., Galotto, G., Devitt, N. P., Connick, M. C., Jacobi, J. L., Umale, P. E., et al. (2018). Unique Molecular Identifiers reveal a novel sequencing artefact with implications for RNA-Seq based gene expression analysis. Sci. Rep. 8:13121. doi: 10.1038/s41598-018-31064-7
Sengupta, D., Rayan, N. A., Lim, M., Lim, B., and Prabhakar, S. (2016). Fast, scalable and accurate differential expression analysis for single cells. bioRxiv [Preprint]. doi: 10.1101/049734
Setty, M., Kiseliovas, V., Levine, J., Gayoso, A., Mazutis, L., and Pe’er, D. (2019). Characterization of cell fate probabilities in single-cell data with Palantir. Nat. Biotechnol. 37, 451–460. doi: 10.1038/s41587-019-0068-4
Shah, S., Lubeck, E., Zhou, W., and Cai, L. (2016). In situ transcription profiling of single cells reveals spatial organization of cells in the mouse hippocampus. Neuron 92, 342–357. doi: 10.1016/j.neuron.2016.10.001
Sheng, K., and Zong, C. (2019). Single-cell RNA-Seq by multiple annealing and tailing-based quantitative single-cell RNA-Seq (MATQ-Seq). Methods Mol. Biol. 1979, 57–71. doi: 10.1007/978-1-4939-9240-9_5
Singh, A., Shannon, C. P., Gautier, B., Rohart, F., Vacher, M., Tebbutt, S. J., et al. (2019). DIABLO: an integrative approach for identifying key molecular drivers from multi-omics assays. Bioinformatics 35, 3055–3062. doi: 10.1093/bioinformatics/bty1054
Sinha, D., Kumar, A., Kumar, H., Bandyopadhyay, S., and Sengupta, D. (2018). Dropclust: Efficient clustering of ultra-large scRNA-seq data. Nucleic Acids Res. 46:e36. doi: 10.1093/nar/gky007
Sirén, J., Välimäki, N., and Mäkinen, V. (2014). HISAT2 - fast and sensitive alignment against general human population. IEEE/ACM Trans. Comput. Biol. Bioinform. 11, 375–388. doi: 10.1109/TCBB.2013.2297101
Smallwood, S. A., Lee, H. J., Angermueller, C., Krueger, F., Saadeh, H., Peat, J., et al. (2014). Single-cell genome-wide bisulfite sequencing for assessing epigenetic heterogeneity. Nat. Methods 11, 817–820. doi: 10.1038/nmeth.3035
Smith, T., Heger, A., and Sudbery, I. (2017). UMI-tools: modeling sequencing errors in Unique Molecular Identifiers to improve quantification accuracy. Genome Res. 27, 491–499. doi: 10.1101/gr.209601.116
Song, Y., Xu, X., Wang, W., Tian, T., Zhu, Z., and Yang, C. (2019). Single cell transcriptomics: Moving towards multi-omics. Analyst 144, 3172–3189. doi: 10.1039/c8an01852a
Stegle, O., Teichmann, S. A., and Marioni, J. C. (2015). Computational and analytical challenges in single-cell transcriptomics. Nat. Rev. Genet. 16, 133–145. doi: 10.1038/nrg3833
Stephens, Z. D., Lee, S. Y., Faghri, F., Campbell, R. H., Zhai, C., Efron, M. J., et al. (2015). Big data: astronomical or genomical? PLoS Biol. 13:e1002195. doi: 10.1371/journal.pbio.1002195
Stoeckius, M., Hafemeister, C., Stephenson, W., Houck-Loomis, B., Chattopadhyay, P. K., Swerdlow, H., et al. (2017). Simultaneous epitope and transcriptome measurement in single cells. Nat. Methods 9:2579.
Stuart, T., Butler, A., Hoffman, P., Hafemeister, C., Papalexi, E., Mauck, W. M., et al. (2019). Comprehensive integration of single-cell data. Cell 177, 1888–1902.e21. doi: 10.1016/j.cell.2019.05.031
Svensson, V., Teichmann, S. A., and Stegle, O. (2018). SpatialDE: Identification of spatially variable genes. Nat. Methods 15, 343–346. doi: 10.1038/nmeth.4636
Tang, F., Barbacioru, C., Wang, Y., Nordman, E., Lee, C., Xu, N., et al. (2009). mRNA-Seq whole-transcriptome analysis of a single cell. Nat. Methods 6, 377–382. doi: 10.1038/nmeth.1315
Taylor, R. C. (2010). An overview of the Hadoop/MapReduce/HBase framework and its current applications in bioinformatics. BMC Bioinform. 11:S1. doi: 10.1186/1471-2105-11-S12-S1
Tharwat, A., Gaber, T., Ibrahim, A., and Hassanien, A. E. (2017). Linear discriminant analysis: a detailed tutorial. AI Commun. 30, 169–190. doi: 10.3233/AIC-170729
Tolle, K. M., Tansley, D. S. W., and Hey, A. J. G. (2011). The fourth Paradigm: Data-intensive scientific discovery. Proc. IEEE 99, 1334–1337. doi: 10.1109/JPROC.2011.2155130
Tomlinson, M. J., Tomlinson, S., Yang, X. B., and Kirkham, J. (2013). Cell separation: Terminology and practical considerations. J. Tissue Eng. 4, 1–14. doi: 10.1177/2041731412472690
Trapnell, C., Cacchiarelli, D., Grimsby, J., Pokharel, P., Li, S., Morse, M., et al. (2014). The dynamics and regulators of cell fate decisions are revealed by pseudotemporal ordering of single cells. Nat. Biotechnol. 32, 381–386. doi: 10.1038/nbt.2859
Trapnell, C., Williams, B. A., Pertea, G., Mortazavi, A., Kwan, G., Van Baren, M. J., et al. (2010). Transcript assembly and quantification by RNA-Seq reveals unannotated transcripts and isoform switching during cell differentiation. Nat. Biotechnol. 28, 511–515. doi: 10.1038/nbt.1621
Trombetta, J., Gennert, D., Lu, D., and Sattija, R. (2015). Preparation of single-cell RNA-seq libraries for NGS. Curr. Protoc. Mol. Biol. 19, 161–169. doi: 10.3851/IMP2701.Changes
Vallejos, C. A., Marioni, J. C., and Richardson, S. (2015). BASiCS: Bayesian analysis of single-cell sequencing data. PLoS Comput. Biol. 11:e1004333. doi: 10.1371/journal.pcbi.1004333
Vallejos, C. A., Risso, D., Scialdone, A., Dudoit, S., and Marioni, J. C. (2017). Normalizing single-cell RNA sequencing data: challenges and opportunities. Nat. Methods 14, 565–571. doi: 10.1038/nmeth.4292.Normalizing
Van Der Maaten, L. J. P., and Hinton, G. E. (2008). Visualizing high-dimensional data using t-sne. J. Machine Learn. Res. 9, 2579–2605.
Van Der Maaten, L. J. P., Postma, E. O., and Van Den Herik, H. J. (2009). “Dimensionality reduction: a comparative review,” in Technical Report TiCC-TR 2009-005 (Tilburg: Tillburg University).
Vitak, S. A., Torkenczy, K. A., Rosenkrantz, J. L., Fields, A. J., Christiansen, L., Wong, M. H., et al. (2017). Sequencing thousands of single-cell genomes with combinatorial indexing. Nat. Methods 472, 90–94. doi: 10.1038/nmeth.4154
Volden, R., and Vollmers, C. (2020). Highly multiplexed single-cell full-length cDNA Sequencing of human immune cells with 10X genomics and R2C2. bioRxiv [Preprint]. doi: 10.1101/2020.01.10.902361
Wagner, A., Regev, A., and Yosef, N. (2016). Revealing the vectors of cellular identity with single-cell genomics. Nat. Biotechnol. 34, 1145–1160. doi: 10.1038/nbt.3711
Wang, D., and Bodovitz, S. (2010). Single cell analysis: the new frontier in “omics.”. Trends Biotechnol. 28, 281–290. doi: 10.1016/j.tibtech.2010.03.002
Wang, T., Li, B., Nelson, C. E., and Nabavi, S. (2019). Comparative analysis of differential gene expression analysis tools for single-cell RNA sequencing data. BMC Bioinform. 20:40. doi: 10.1186/s12859-019-2599-6
Wang, T., and Nabavi, S. (2018). SigEMD: a powerful method for differential gene expression analysis in single-cell RNA sequencing data. Methods 145, 25–32. doi: 10.1016/j.ymeth.2018.04.017
Wang, Z., Gerstein, M., and Snyder, M. (2009). RNA-Seq: A revolutionary tool for transcriptomics. Nat. Rev. Genet. 10, 57–63. doi: 10.1038/nrg2484
Welch, J. D., Hartemink, A. J., and Prins, J. F. (2017). MATCHER: manifold alignment reveals correspondence between single cell transcriptome and epigenome dynamics. Genome Biol. 18:138. doi: 10.1186/s13059-017-1269-0
Welzel, G., Seitz, D., and Schuster, S. (2015). Magnetic-activated cell sorting (MACS) can be used as a large-scale method for establishing zebrafish neuronal cell cultures. Sci. Rep. 5:7959. doi: 10.1038/srep07959
Wills, Q. F., Livak, K. J., Tipping, A. J., Enver, T., Goldson, A. J., Sexton, D. W., et al. (2013). Single-cell gene expression analysis reveals genetic associations masked in whole-tissue experiments. Nat. Biotechnol. 31, 748–752. doi: 10.1038/nbt.2642
Wong, K., Navarro, J. F., Bergenstråhle, L., Ståhl, P. L., and Lundeberg, J. (2018). ST Spot Detector: a web-based application for automatic spot and tissue detection for spatial transcriptomics image datasets. Bioinformatics 34, 1966–1968. doi: 10.1093/bioinformatics/bty030
Wyatt Shields, C. IV, Reyes, C. D., and López, G. P. (2015). Microfluidic cell sorting: a review of the advances in the separation of cells from debulking to rare cell isolation. Lab Chip 5, 1230–1249. doi: 10.1039/c4lc01246a
Xin, Y., Kim, J., Ni, M., Wei, Y., Okamoto, H., Lee, J., et al. (2016). Use of the Fluidigm C1 platform for RNA sequencing of single mouse pancreatic islet cells. Proc. Natl. Acad. Sci. U.S.A. 113, 3293–3298. doi: 10.1073/pnas.1602306113
Xue, R., Li, R., and Bai, F. (2015). Single cell sequencing: technique, application, and future development. Sci. Bull. 60, 33–42. doi: 10.1007/s11434-014-0634-6
Yip, S. H., Wang, P., Kocher, J. P. A., Sham, P. C., and Wang, J. (2017). Linnorm: improved statistical analysis for single cell RNA-seq expression data. Nucleic Acids Res. 45:e179. doi: 10.1093/nar/gkx828
Yu, P., and Lin, W. (2016). Single-cell transcriptome study as big data. Genomics Proteomics Bioinform. 14, 21–30. doi: 10.1016/j.gpb.2016.01.005
Zaharia, M., Franklin, M. J., Ghodsi, A., Gonzalez, J., Shenker, S., Stoica, I., et al. (2016). Apache spark. Commun. ACM 59, 56–65. doi: 10.1145/2934664
Zare, R. N., and Kim, S. (2010). Microfluidic platforms for single-cell analysis. Annu. Rev. Biomed. Eng. 12, 187–201. doi: 10.1146/annurev-bioeng-070909-105238
Zhang, Z., and Wang, W. (2014). RNA-skim: a rapid method for RNA-Seq quantification at transcript level. Bioinformatics 30, i283–i292. doi: 10.1093/bioinformatics/btu288
Keywords: single-cell transcriptomics, Sc-RNA-seq, big data, single-cell big data, normalization, single-cell analysis, downstream analysis
Citation: Adil A, Kumar V, Jan AT and Asger M (2021) Single-Cell Transcriptomics: Current Methods and Challenges in Data Acquisition and Analysis. Front. Neurosci. 15:591122. doi: 10.3389/fnins.2021.591122
Received: 03 August 2020; Accepted: 19 March 2021;
Published: 22 April 2021.
Edited by:
Kumardeep Chaudhary, Icahn School of Medicine at Mount Sinai, United StatesReviewed by:
Ankush Sharma, University of Oslo, NorwayXun Zhu, University of Hawaii Cancer Center, United States
Copyright © 2021 Adil, Kumar, Jan and Asger. This is an open-access article distributed under the terms of the Creative Commons Attribution License (CC BY). The use, distribution or reproduction in other forums is permitted, provided the original author(s) and the copyright owner(s) are credited and that the original publication in this journal is cited, in accordance with accepted academic practice. No use, distribution or reproduction is permitted which does not comply with these terms.
*Correspondence: Arif Tasleem Jan, YXRhc2xlZW1AYmdzYnUuYWMuaW4=; Mohammed Asger, bWFzZ2VyZ2hhemlAYmdzYnUuYWMuaW4=
†These authors have contributed equally to this work