 Fuhao Zheng
 Fang Hou
 Ruru Chen
 Jianhui Mei
 Pingping Huang
 Bingzhen Chen
 Yuwen Wang
- Eye Hospital, Wenzhou Medical University, Wenzhou, China
Purpose: To investigate whether the severity of symptoms of visual fatigue might be associated with clinical visual measures and basic visual functions, such as accommodation, vergence, and contrast sensitivity.
Methods: In this study, 104 students were recruited (25 males, 79 females, Age 23.4 ± 2.5) for this study. Those with high myopia, strabismus, anisometropia, eye disease or history of ophthalmological surgery were excluded. The included subjects completed a questionnaire that assesses the severity of visual fatigue. Then, binocular accommodative facility, vergence facility and contrast sensitivity using a quick contrast sensitivity function approach were measured in a random sequence. Next, the correlations between each symptom of visual fatigue in the questionnaire and accommodative facility, vergence facility and contrast sensitivity were examined.
Results: Factor analysis indicated that visual fatigue, as captured by the scores of a subset of the questionnaire items, could be strongly related to binocular accommodative facility and binocular contrast sensitivity, but not to vergence facility. We also found that binocular accommodative facility and contrast sensitivity at high spatial frequencies are related.
Conclusion: Our findings suggest that visual fatigue is related to the ability of human observers to encode visual details through their binocular vision.
Introduction
Visual fatigue refers to a group of somatic or perceptive symptoms that usually occur following using a computer, reading, or other performing near visual activities (Bhanderi et al., 2008). The prevalence of visual fatigue is 12.4-32.2% in children below 18 years (Ip et al., 2006; Sterner et al., 2006; Tiwari et al., 2011; Tiwari, 2013) and 46–71% in university students around the world (Bhanderi et al., 2008; Han et al., 2013; Hashemi et al., 2019). Moreover, the prevalence of visual fatigue has been increasing (Sheppard and Wolffsohn, 2018).
Common symptoms of visual fatigue are blurred vision, diplopia, and illusory movement or flicker of words at a near viewing distance. These characteristics are related to near vision and binocular anomalies (Chen, 1986; Sheedy et al., 2003; Blehm et al., 2005; García-Muñoz et al., 2014). A questionnaire has been used as a quick method to assess the severity of symptoms and distinguish patients with symptoms from those who have normal vision (García-Muñoz et al., 2014).
Visual acuity is measured to evaluate the severity of visual fatigue. For instance, the larger the visual extent required to resolve a spatial pattern, the more severe the visual fatigue (Leroy, 2016). However, measurement of visual acuity might not be ideal. For example, blurred vision is a cardinal symptom of visual fatigue. Patients who suffer from visual fatigue often complain about blurred vision. However, studies show that their visual acuity is normal (Vilela et al., 2015). A 10-year follow-up study about visual fatigue reveals no relationship among visual fatigue and age, sex, seniority of work, visual acuity, and refractory disorders (Larese et al., 2019). In addition, a visual acuity test only utilizes optotypes with high degrees of contrast. Therefore, it might not reflect the visual performance in the real world (Marmor, 1986) where visual targets could appear at a relatively lower contrast, such as high spatial frequency content. High spatial frequency information can appear at a relatively lower contrast because the contrast sensitivity for higher spatial frequency content is much lower in humans. For this reason, measurement of contrast sensitivity across spatial frequency might better capture the ability of human observers to detect and encode the details (Arden, 1978; Marmor, 1986). In addition, studies show that contrast sensitivity, but not visual acuity, is impaired in patients who have visual disorders such as high myopia, asthenopia, foggy vision, and ocular hypertension (Quant, 1992; Järvinen and Hyvärinen, 1997; Gandolfi et al., 2005). These findings suggest that contrast sensitivity, rather than visual acuity, might be a more appropriate measure to diagnose a wide range of visual disorders.
Additionally, visual fatigue can occur to demands on early visual functions such as focusing and converging the eyes at a near object (Wilkins, 1995; Scheiman and Wick, 2014). Thus, accommodative and binocular dysfunctions might play a pivotal role in causing visual fatigue (Rosenfield, 2011; Sheppard and Wolffsohn, 2018; Golebiowski et al., 2020). Accommodation function is measured by accommodative amplitude and accommodative facility. Vergence function is measured by phoria, fusional range reserves, and vergence facility (Scheiman and Wick, 2014). Importantly, facility of accommodation and binocular vision can be more informative than the amplitude of accommodation and vergence (Liu et al., 1979; Hennessey et al., 1984; Scheiman and Wick, 2014) for clinical assessment. For instance, vergence facility and accommodative facility are central indexes of binocular vision (Buzzelli, 1991; Grisham et al., 2007; Palomo-Alvarez and Puell, 2008; Dusek et al., 2010; Quaid and Simpson, 2013; Scheiman and Wick, 2014). Many patients suffering from visual fatigue experience a decline in vergence or accommodative facility (Hennessey et al., 1984; Levine et al., 1985; Momeni-Moghaddam et al., 2014). Moreover, patients, whose amplitudes of accommodation and vergence are normal, have been shown to have severe visual symptoms if their accommodative and vergence facility are abnormal (Gall and Wick, 2003).
In this study, we investigated relationships between subjective symptoms (i.e., each item score of the questionnaire) and results from visual measurements, such as contrast sensitivity and accommodative and vergence facility. Contrast sensitivity, accommodation, vergence were measured using a qCSF method and lenses and prism flippers in 104 college students, respectively.
Materials and Methods
Participants
This study followed the tenets of the Declaration of Helsinki and was approved by the Hospital Committee of Wenzhou Medical University for the Protection of Human Subjects. For this study, 104 college students, 25 males and 79 females, ranged from 18 to 30 years (M = 23.4, SD = 2.5), were recruited from Wenzhou Medical University. Those with eye disease, ocular surgery, history of amblyopic or strabismus had been excluded. Their refractive error was between +1.00 Diopter (D) and −6.00 Diopter (D), astigmatism was less than 1.25 D. Their visual acuity was above or corrected to 20/20 with a normal monocular accommodative amplitude. All subjects were naïve to the purpose of the study.
Questionnaire
A questionnaire of visual discomfort (Yang and James, 2011) was used to evaluate subjective symptoms of visual fatigue (see Appendix Table 1). In this paper, we define subjective symptom as each item in the questionnaire. Before their clinical examination, all subjects were asked to finish the questionnaire. Scores of the questionnaire for each symptom ranged from 0 (none) to 4 (extremely so). Visual fatigue was defined as the presence of one or more visual symptoms (subjective symptoms #2,3,6,7,9,10,13) (Han et al., 2013). In our study, there were about 53 of 104 (50.96%) participants who had more than one subjective symptom (score of symptoms is no less than two, which is the mean of the empirical distribution of the scores from all our participants) in the questionnaire, so they were categorized as having visual fatigue.
Procedure
First, all subjects were asked to finish the questionnaire. Then accommodative facility and vergence facility were examined in a brightly lit room. Binocular contrast sensitivity was measured in a dark room on another day. All subjects performed the tests with best-corrected glasses. Some subject had good visual acuity without glasses, but some were corrected to 20/20. They had to wear their best-corrected glasses if they had ametropia.
Accommodative Facility test
Binocular accommodative facility was measured using a flipper lens. A card had 6/9 (20/30) sized of letters. The card was positioned at a viewing distance of 40 cm. The participants were asked to report if the letters were clear while they were viewed with alternating +2.00 D and −2.00 D lenses. As an index of binocular accommodative facility, the number of cycles per minute (cpm) was measured. It denotes the ability of the observers to clear the plus lens followed by the minus lens. Any difficulties in responding between +2.00 D and −2.00 D was noted (Chen et al., 2021). F(+) means that the subjects had more difficulty in +2.00 D, whereas F(−) means that they experienced more difficulty in −2.00 D.
Vergence Facility test
Vergence facility was evaluated at a viewing distance of 40 cm with a flipper prism. The power for the flippers was chosen as 3△BI/12△BO. A vertical column of small letter “E” at a 20/30 [6/9] size was presented as an accommodative target. The subjects observed the fixation target while their vision underwent best-correction. They reported when there was a clear and one visual target. We changed the flipper prism from BI to BO and from BO to BI, which makes up one cycle. Vergence facility was measured as cycles per minute, which is the number of cycles that each observer reported as clear and single visual percept for 1 min. In other words, this test measured the ability of the participants to form a fusion through BI and BO prisms. We noted if there were difficulty in the fusion through the BI and BO prisms during testing (Momeni-Moghaddam et al., 2014).
Quick CSF test
We measured binocular contrast sensitivity using a qCSF method, which was written in MATLAB (MathWorks, Natick, MA) with PsychToolBox extensions (Kleiner et al., 2007). Stimuli (Zheng et al., 2018) were displayed on a gamma-corrected screen (KD-55 × 9300E, SONY, Tokyo, Japan). The display had a spatial resolution of 1920 × 1080 pixels and a refresh rate of 60 Hz. Each pixel subtended 0.908° at a viewing distance of 4 m. Observers viewed the display binocularly with their best corrections in a dark room.
In the CSF test, the participants were asked to perform a 10-digit identification task. Ten digits stimuli (0∼9, see Figure 1) were filtered using a raised cosine filter (Chung et al., 2002; Hou et al., 2016). The quick CSF changes the stimulus parameters based on the most recent response of the observer. In other words, a quick CSF algorithm automatically selects the most optimal contrast and spatial frequency of the stimulus for each subsequent trial (Lesmes et al., 2010). The responses of the observer revised posterior probability of the stimulus parameters.
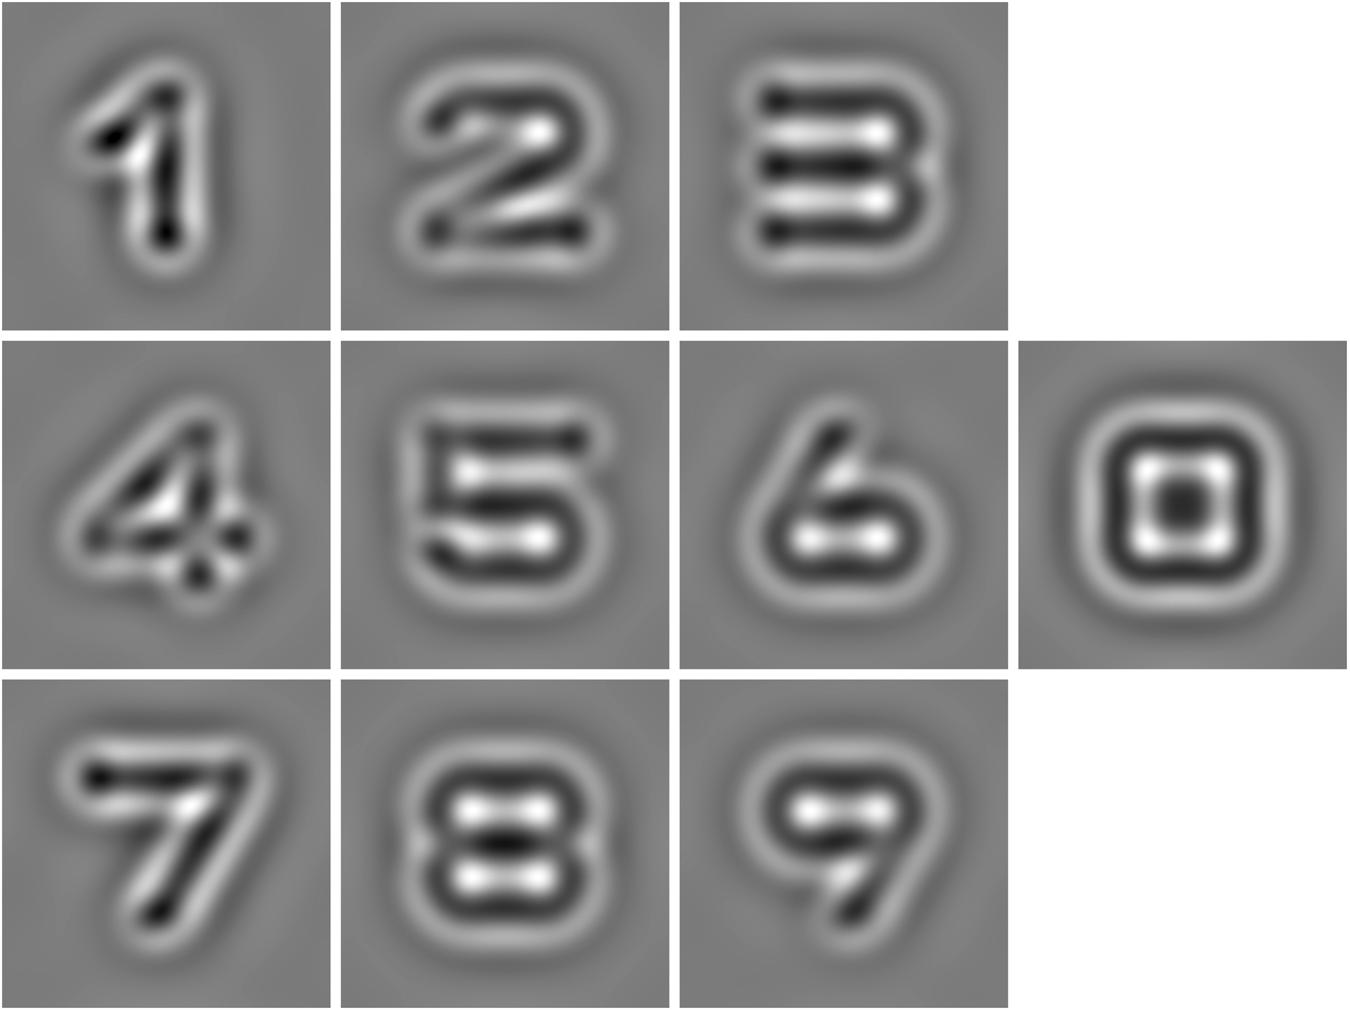
Figure 1. Ten Band-pass filtered digits were used as stimuli in the qCSF method.
Before starting the experiment, the observers spent 5 min adapting to the dark in the testing room. Besides the stimulus with the optimal contrast and spatial frequency (selected from the Bayesian posterior probability), two stimuli at higher contrasts were displayed during each trial. The presentation of these two additional stimuli enhanced the subject’s task performance. The three digits were randomly sampled from the 10 digits stimuli with replacement. Their positions were aligned in a single row; the distance between the neighboring digits was 1.1 times of the letter size. These three digits were displayed at the same spatial frequency but not in contrast.
Observers verbally identified the numbers. The experimenter recorded the response with the computer. When uncertain, observers reported by saying “I don’t know,” which was categorized as incorrect. There was no feedback to the response. A new trial began 500 ms after the subjects verbally identified the numbers (Hou et al., 2016).
Data Analysis
The number of cpm of binocular accommodative facility and vergence facility was analyzed. There were 21 subjects who experienced difficulty during the accommodative facility test for +2.00D, and 7 subjects for −2.00D, two of whom had double vision in −2.00D. For vergence facility, there were 16 subjects who experienced difficulty in achieving fusion in 12△BO and 3 subjects in 3△BI. Since the number of subjects of infacility was too small to yield a reliable statistical result, we did not do further analysis.
We used a qCSF method, which is a parametric procedure, to estimate the entire CSF curve. After estimating a CSF, we computed the area under a curve. We used the areal measure as an index to describe contrast sensitivity as a function of spatial frequency. We computed four variations of the areal measure. These were an area under low frequency (1.5–3 cpd) of the CSF curve (Low CSF), the area under middle frequency (3–12 cpd) of the CSF curve (Mid CSF), the area under high spatial frequency (12–18 cpd) of the CSF curve (High CSF), and the area under the log CSF curve (AULCSF), which is a summary metric of the CSF function (Applegate et al., 1998; Oshika et al., 2006; Yan et al., 2010). They have been reported that the area under log CSF curve is correlated with optical aberration of the human eye and has been used as an image quality indicator (Barten, 1999). The area in different spatial frequency ranges may be a powerful metric to represent different aspects of visual performance. Moreover, a cutoff spatial frequency (Cut-off SF) was calculated; it is a spatial frequency at which the contrast threshold of CSF is 0.50 and characterizes the high frequency resolution of the visual system (Regan and Beverley, 1983; Kwon and Legge, 2011; Zhang et al., 2015). The illustration of these areal measures and Cut-off SF is shown in Figure 2.
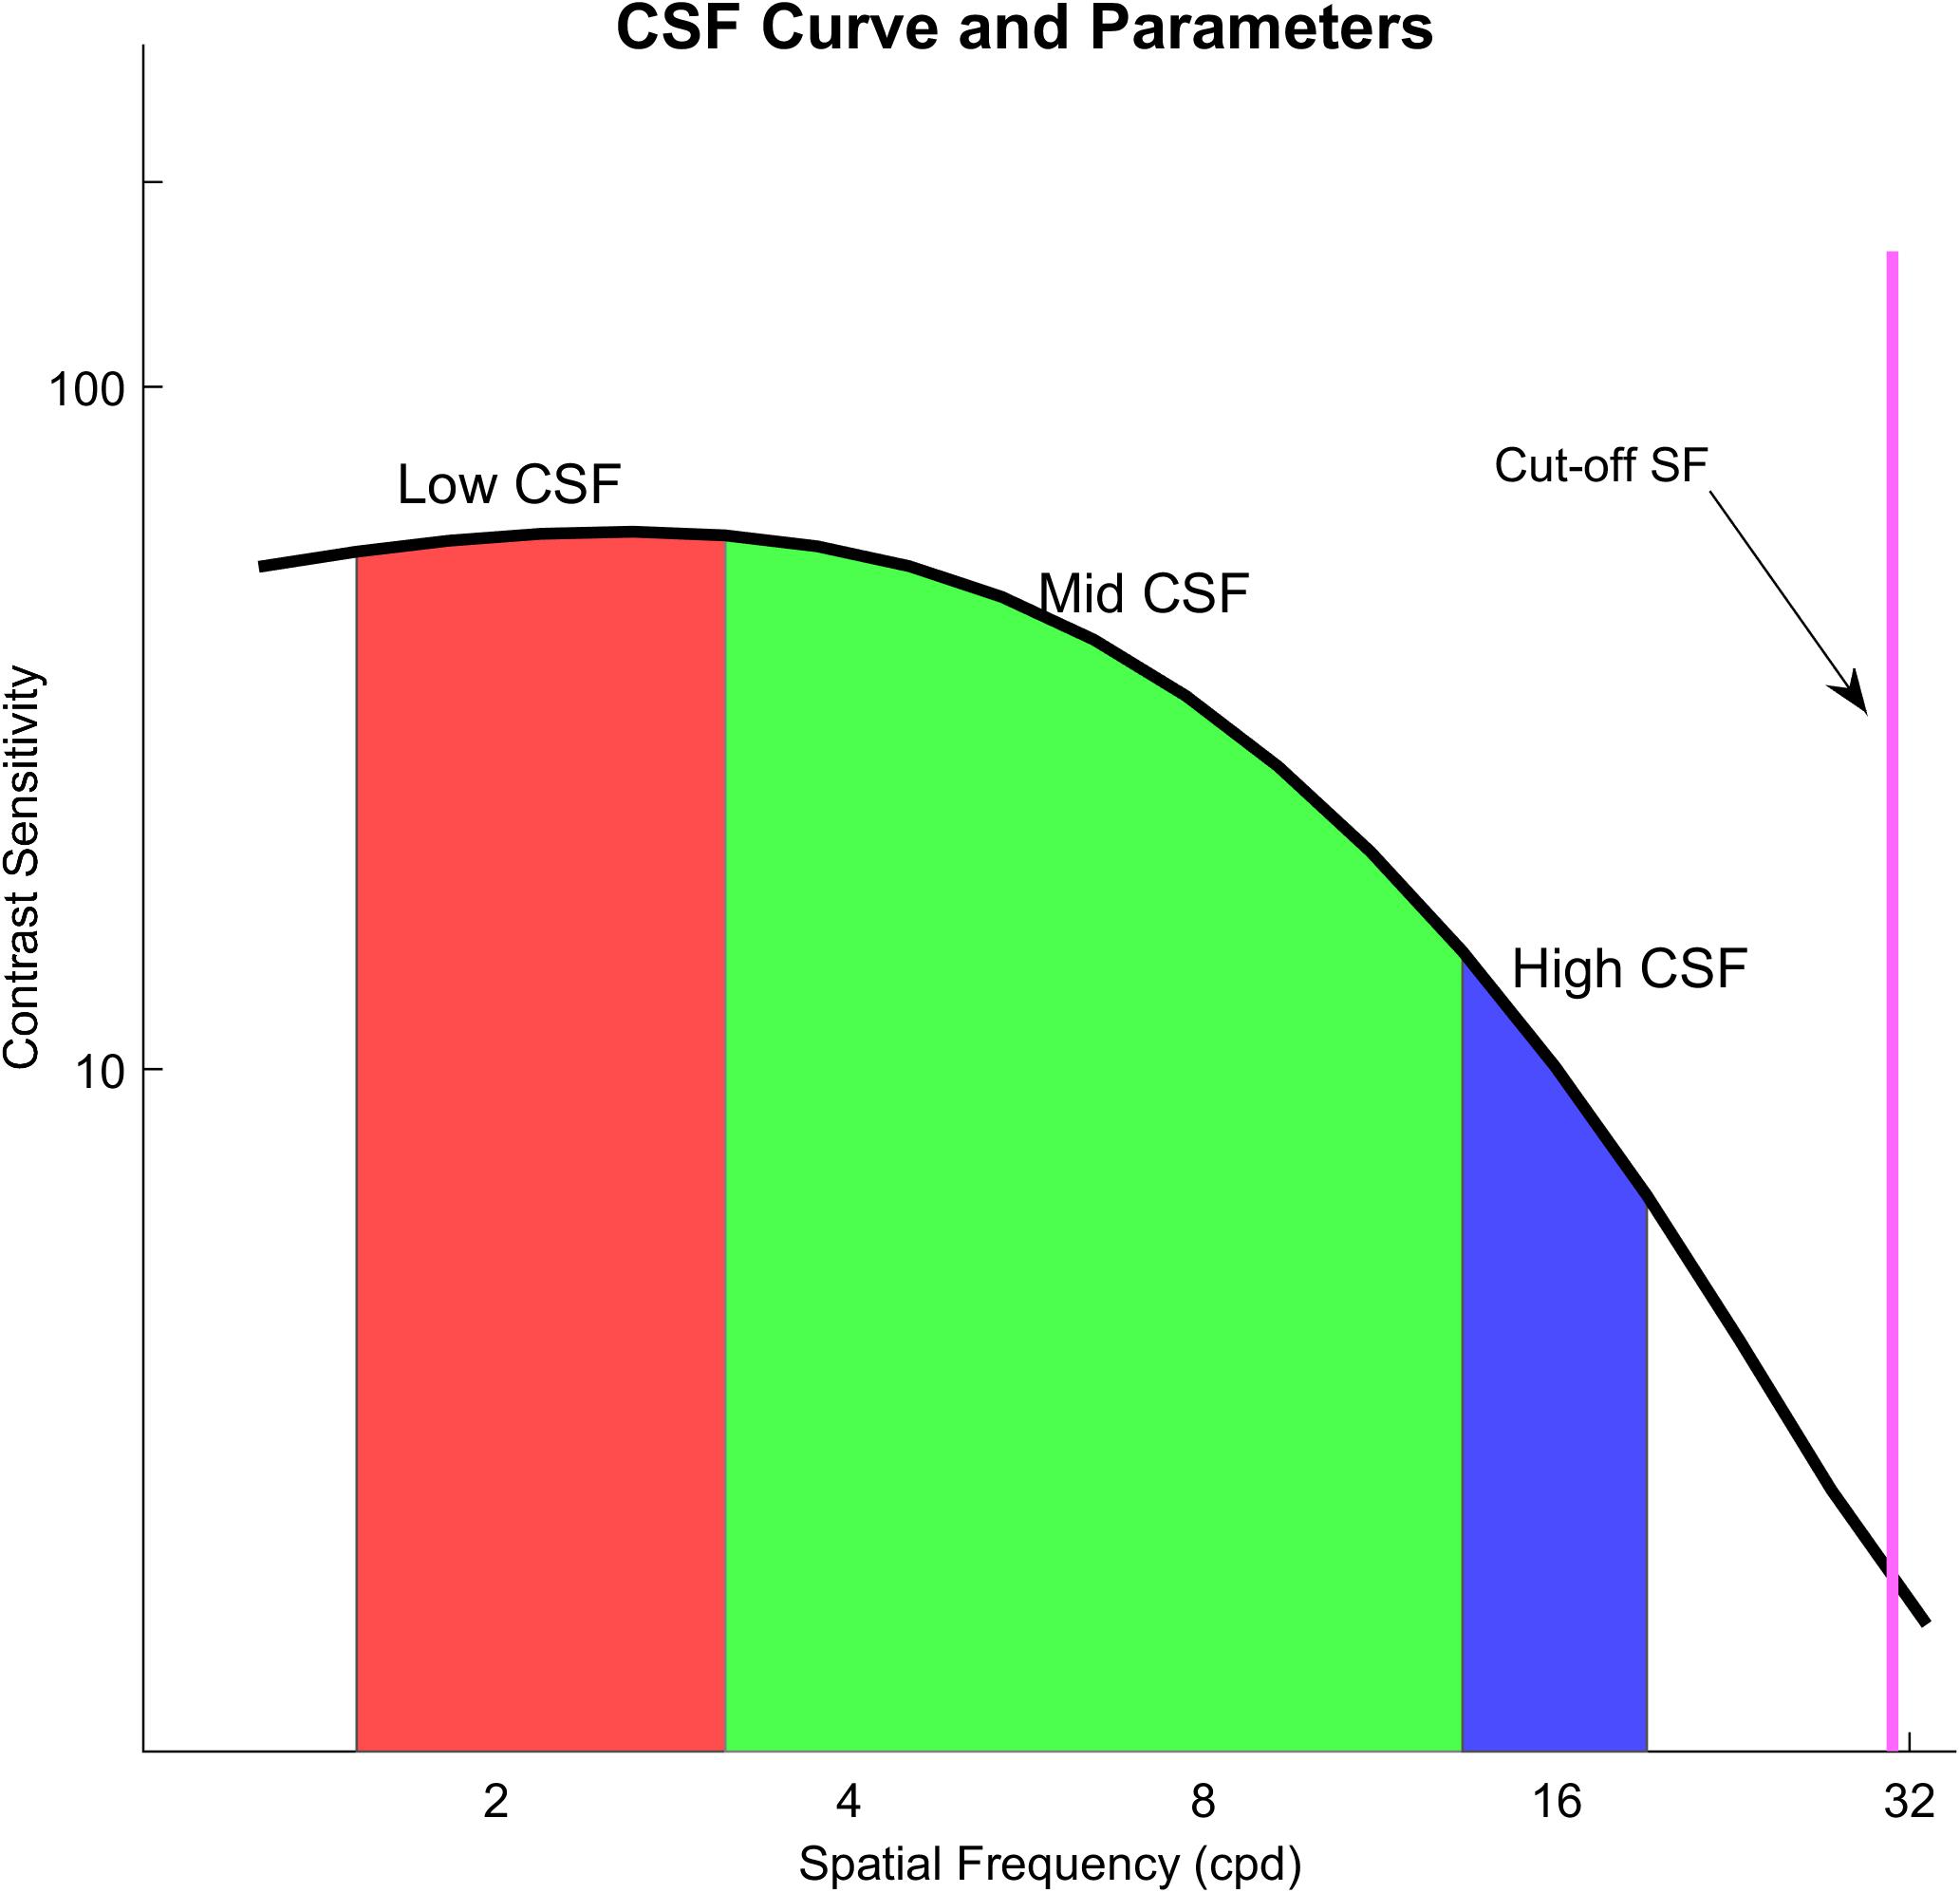
Figure 2. The black curve in the figure is the contrast sensitivity curve; the red area means an area under low frequency (1.5–3 cpd) of the CSF curve (Low CSF); the green area means the area under middle frequency (3–12 cpd) of the CSF curve (Mid CSF); the blue area means the area under high spatial frequency (12–18 cpd) of the CSF curve (High CSF); the purple line shows Cut-off SF.
A Shapiro-Wilk test was used to evaluate whether the data were normally distributed. The score of each item in the questionnaire, data of Low CSF and Cut-off SF had non-normal distributions. On the other hand, datasets of binocular accommodative facility, vergence facility, Mid CSF, High CSF had normal distributions. We compared binocular accommodative facility, vergence facility and contrast sensitivity between participants with or without visual fatigue. For normally distributed datasets, we used methods such as two independent sample t-test or a Pearson correlation test. Otherwise, we used a Mann-Whitney U test or a Spearman correlation test.
To map out the association between different subjective symptoms, we performed factor analysis using 15 items of the questionnaire. All the scores from the questionnaire were first standardized before factor analysis. To confirm whether factor analysis was appropriate for our datasets, we performed the Kaiser-Meyer-Olkin (KMO) test, which revealed 0.817; this is much higher than the necessary 0.7 which warrants factor analysis. Moreover, we performed Bartlett’s Test of Sphericity to see if the scores of the 15 items were unrelated to each other. It revealed p < 0.05, indicating that our datasets were related to each other. Hence, Bartlett’s Test also indicated that factor analysis was necessary.
Factor analysis enabled us to find latent factors (exogenous variables) that influenced the scores of the items in the questionnaire (endogenous variables). Next, we also examined the relationship between the latent factors and clinical measurements of visual functions, such as Cut-off SF, binocular accommodative facility, and vergence facility. Varimax with Kaiser Normalization was the rotation method to find rotated component. To make matrix clearer, we suppressed small coefficients when their absolute values were below 0.50. Then, multiple linear regression was used among variates with significant correlation.
The statistical analyses were performed using the software package SPSS (Windows version 22.0; IBM-SPSS). As for statistical significance, an alpha of 0.05 was established to reject the null hypothesis. When necessary, Bonferroni correction was applied.
Results
In our study, scores of the subjective symptoms in the questionnaire, visual acuity, Low CSF, Cut-off SF were not normally distributed, and binocular accommodative facility, vergence facility, Mid CSF, High CSF, and AULCSF were normally distributed (shown in Figure 3). Total points of the questionnaire in 104 participants ranged from 0 to 16 out of 28 (median = 6, Q1 = 4, Q3 = 8.125). Median of visual acuity (log MAR) was 0.00, the first quartile was −0.08 and the third quartile was 0.00. Parameters of CSF (Low CSF: median = 0.70, Q1 = 0.68, Q3 = 0.73); Mid CSF: M = 0.95, SD = 0.09; High CSF: M = 0.29, SD = 0.09; AULCSF: M = 1.68, SD = 0.14; Cut-off SF: median = 28.30, Q1 = 24.78, Q3 = 31.10), binocular accommodative facility (M = 10.29, SD = 4.31) and vergence facility (M = 12.25, SD = 5.50) were detected from participants, respectively.
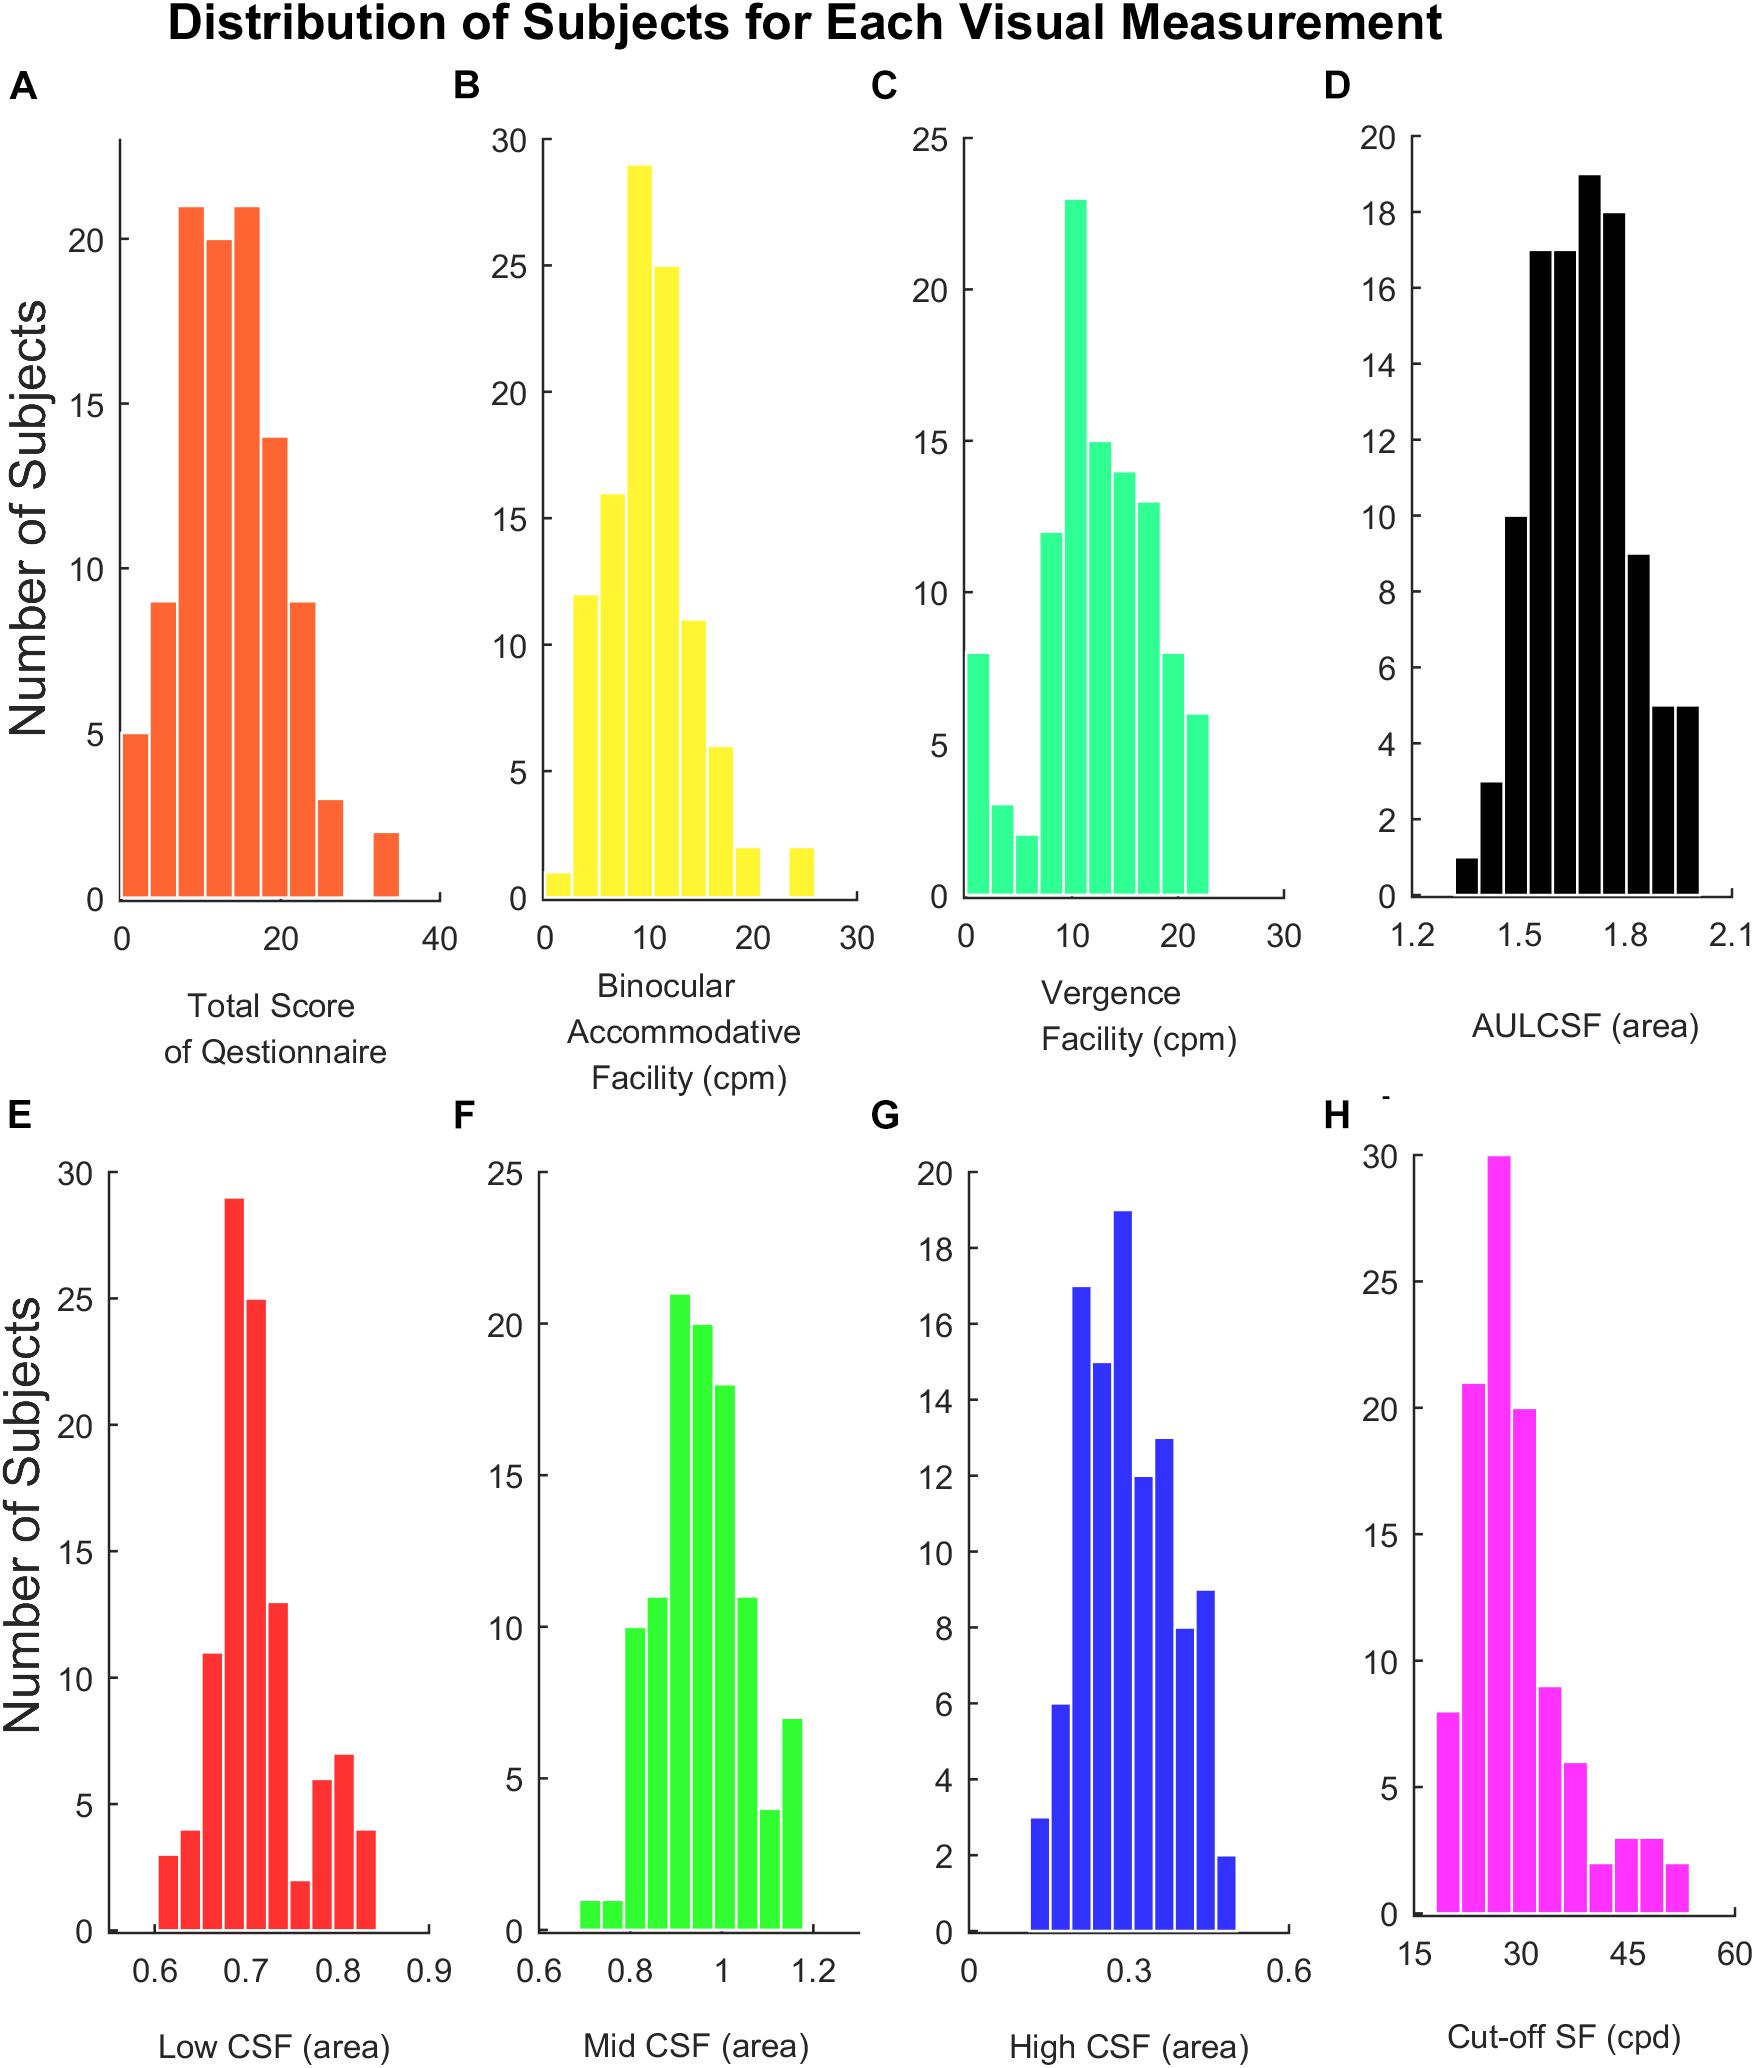
Figure 3. (A) Histograms of total score of the questionnaire. (B) Binocular accommodative facility. (C) Vergence facility. (D) AULCSF. (E) Low CSF. (F) Mid CSF. (G) High CSF. (H) Cut-off SF.
Those with more than one subjective symptom of visual symptoms were categorized as symptomatic of visual fatigue (see Methods). There were significant differences between asymptomatic (N = 51) and symptomatic (N = 53) participants in binocular accommodative facility [t(102) = 2.508, P = 0.013], vergence facility [t(102) = 2.944, P = 0.004], Cut-off SF (Z = −2.270, P = 0.023), shown in Figure 4. There was no significant difference in AULCSF, Low CSF, Mid CSF, and High CSF.
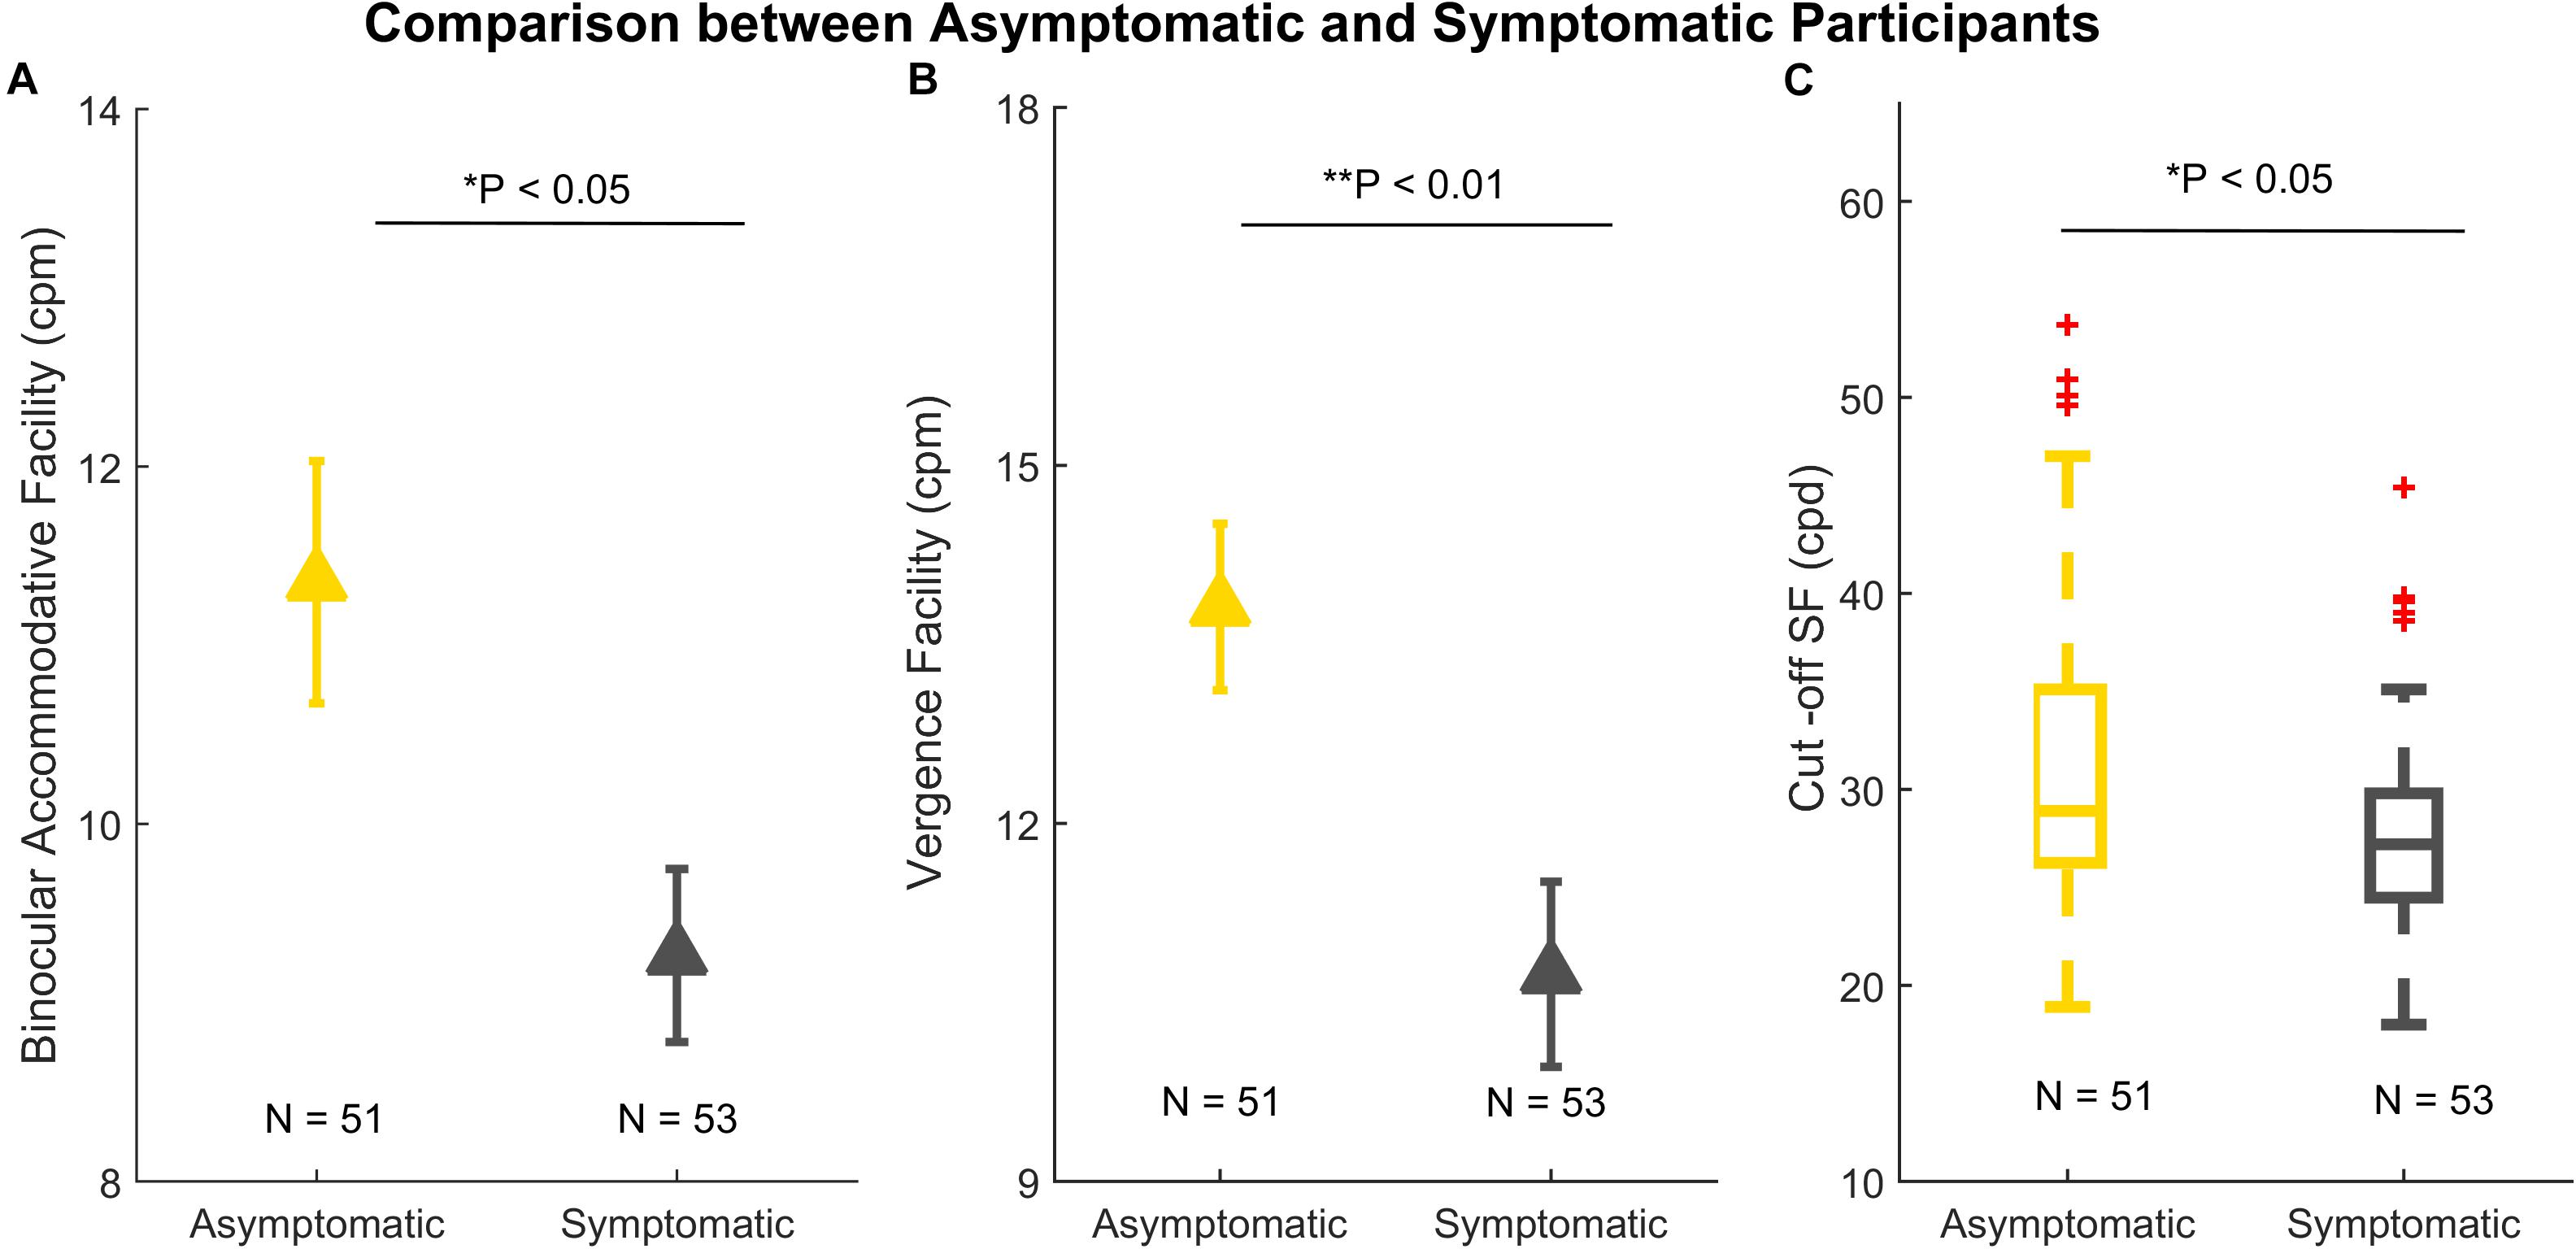
Figure 4. Comparison between asymptomatic (N = 51) and symptomatic participants (N = 53). (A) Binocular accommodative facility. (B) Vergence facility. (C) A boxplot of Cut-off SF. In panels (A) and (B), the error bars denote standard errors. In panel (C), the line within each box is the median. The box spans the interquartile range (Q1 and Q3). The whiskers represent 1.5 × interquartile above the upper quartile (Q3) and below the lower quartile (Q1). The red crosses outside the whiskers are outliers. *p < 0.05; **p < 0.01.
Factor Analysis
The scores of the 15 items in the questionnaire showed inter-correlation amongst clusters of items (shown by the Bartlett’s test). For this reason, we performed factor analysis. We found that we could reduce our entire dataset based on four factors (shown in Table 1) because there were four factors which had eigenvalues larger than 1. These four factors are disorientation and difficulty in focusing, discomfort after near work, unclear mind and physical discomfort.
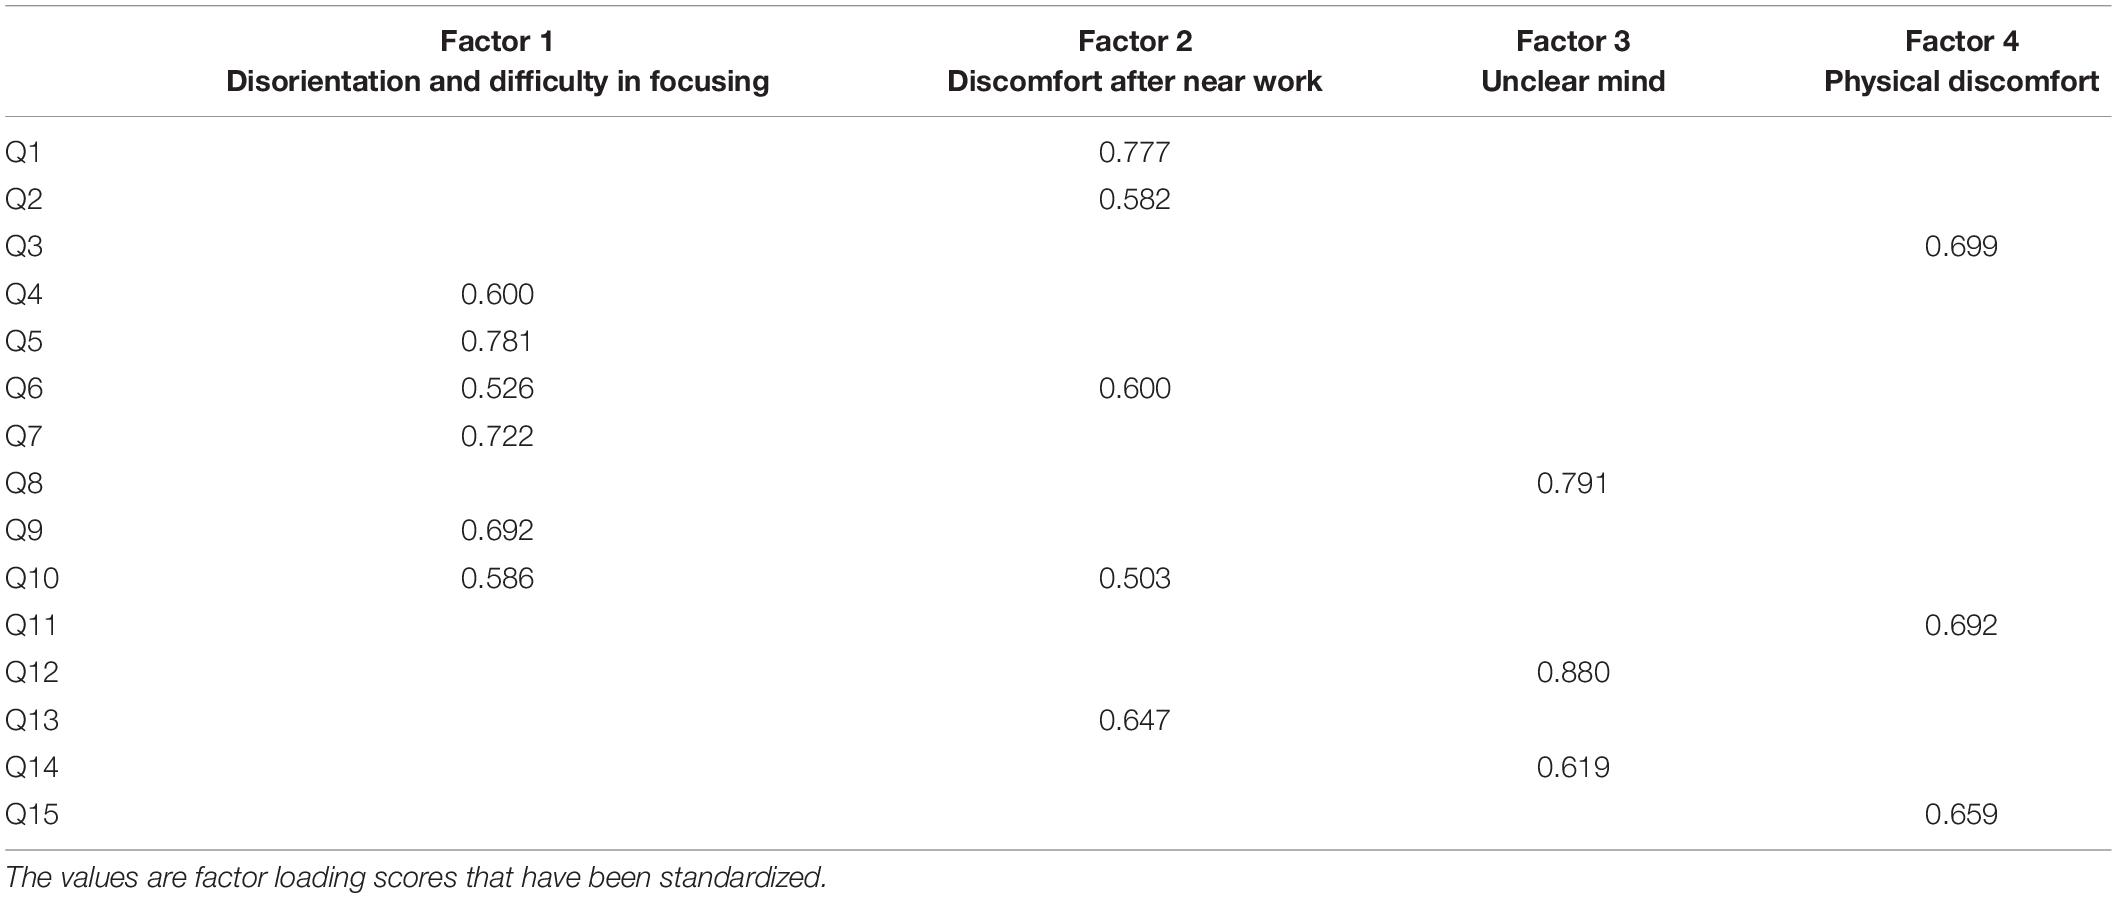
Table 1. Factor analysis for 15 items in the questionnaire after Varimax with Kaiser Normalization.
We believe that factor #2 (discomfort after near work) is most representative of visual fatigue because factor #1 (disorientation and difficulty in focusing) is associated with both physical and visual discomfort, whereas factor #2 is strictly associated with visual discomfort. For this reason, we performed bivariate correlation between the factor “discomfort after near work” and results from clinical visual measurements but not between the other factors and the visual measurements. The results are shown in Figure 5, which indicates that the factor “discomfort after near work” is strongly associated with binocular accommodative facility (Spearman’s r = −0.328, p < 0.001) and Cut-off SF (Spearman’s r = −0.284, P = 0.0018), but not with vergence facility (Spearman’s r = −0.121, P = 0.111).
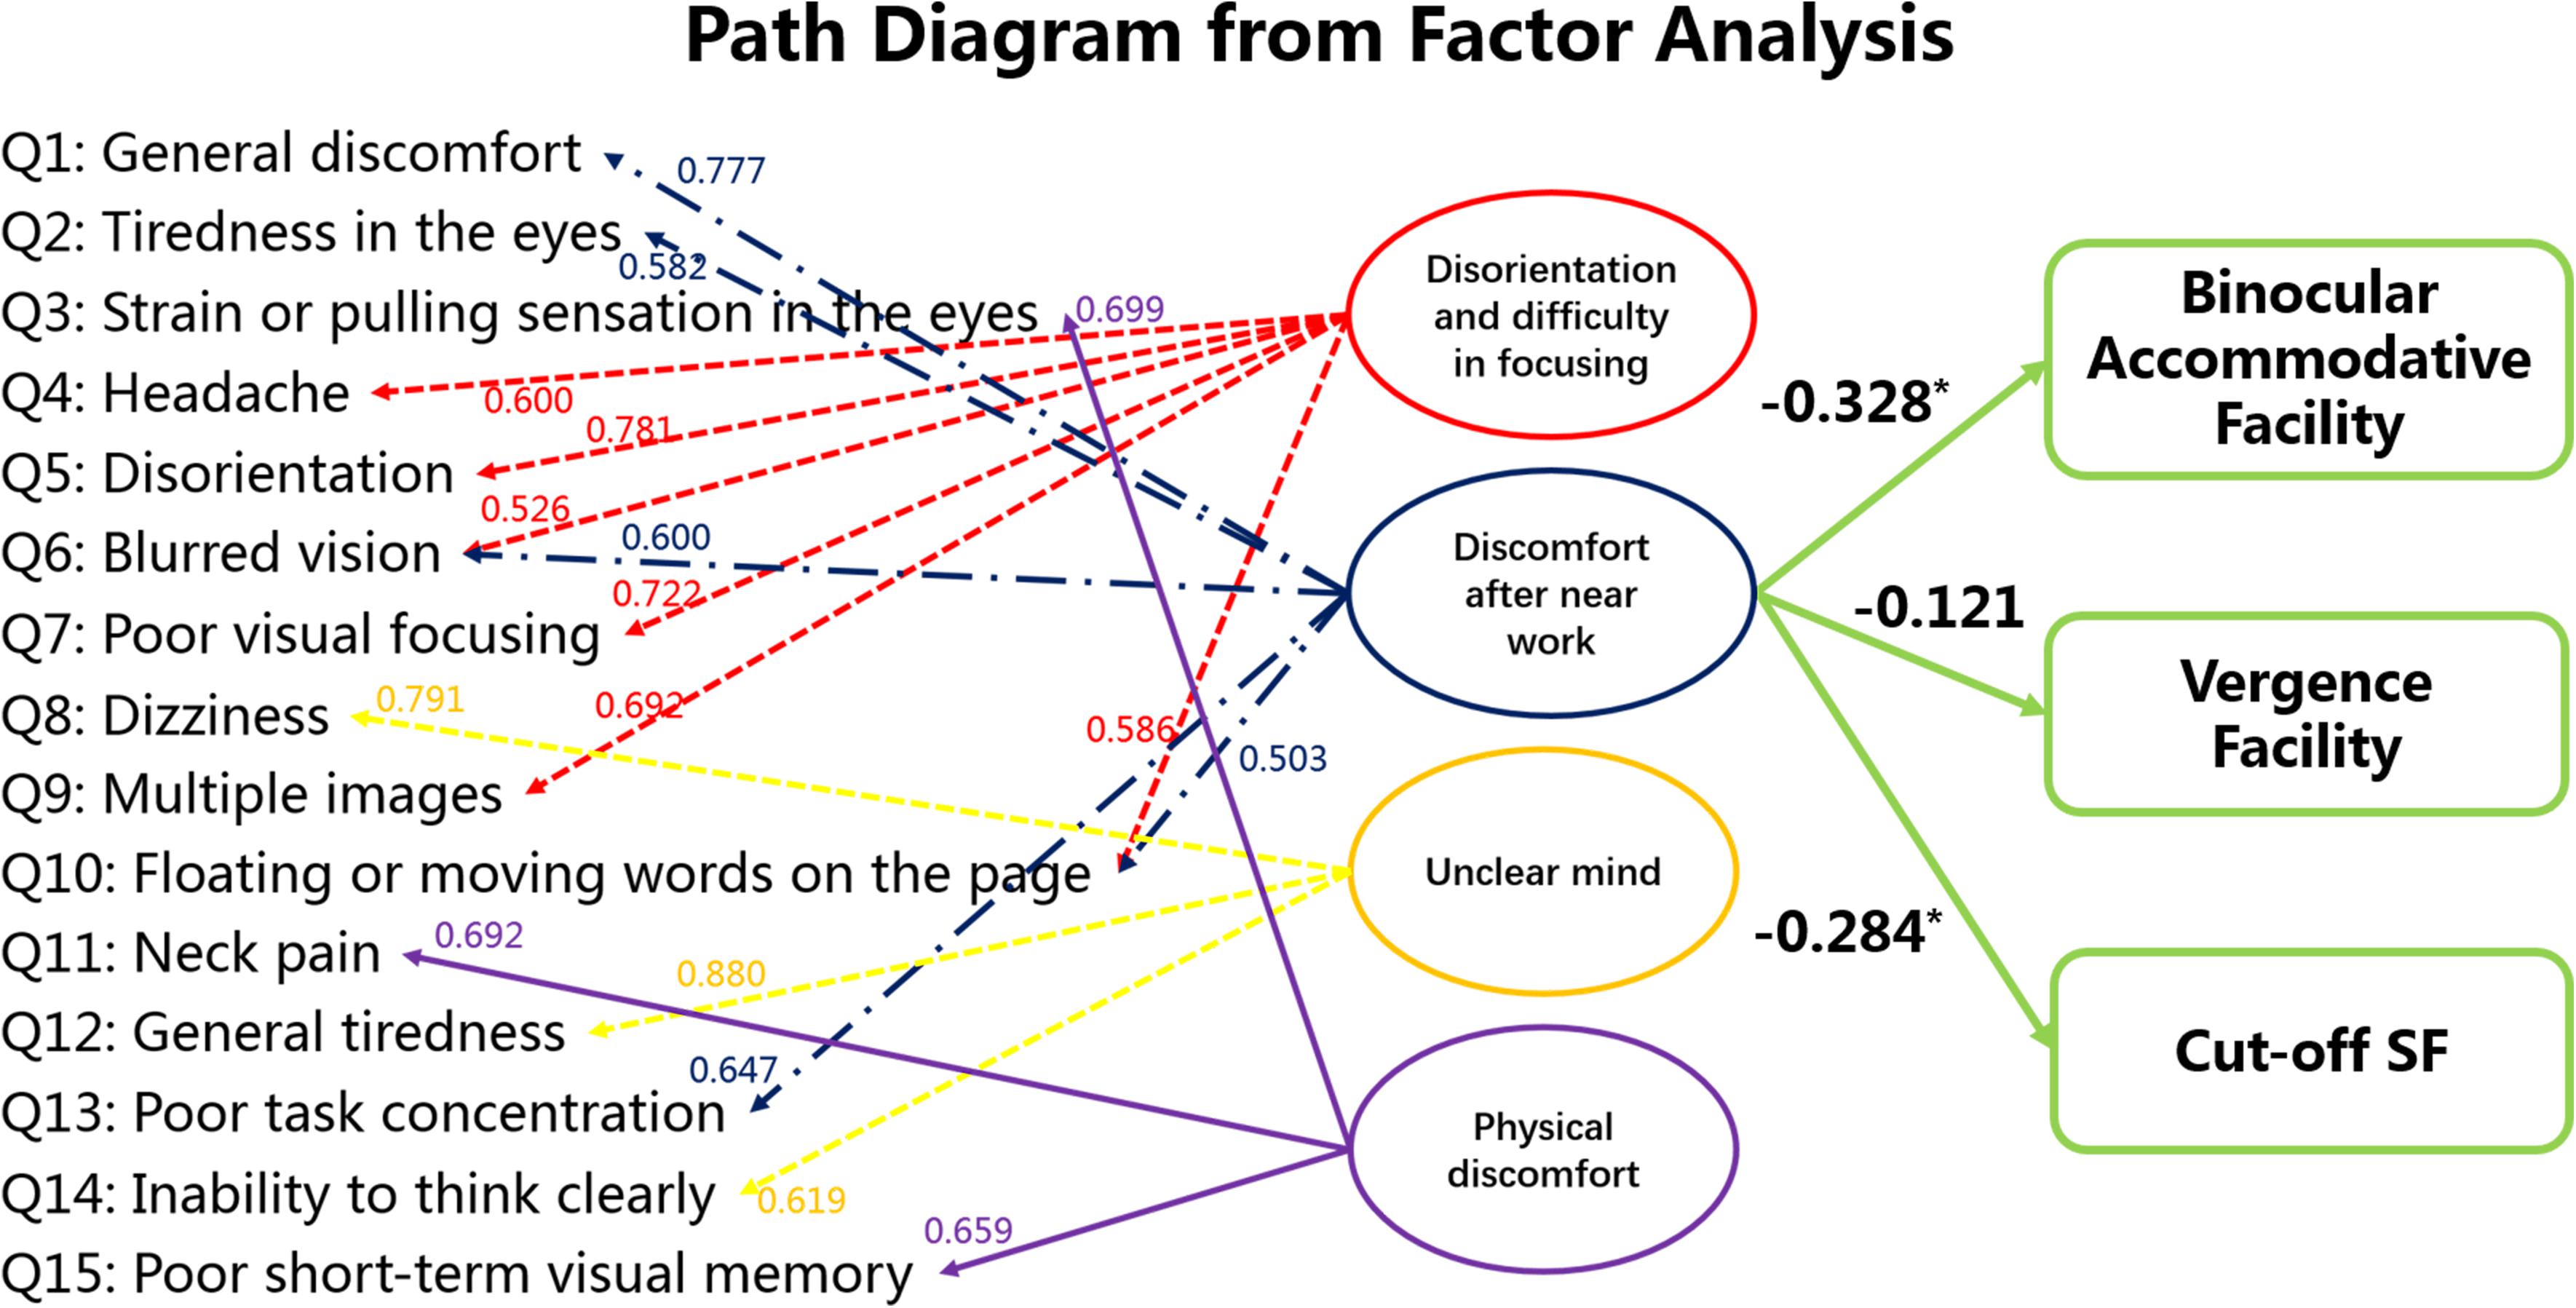
Figure 5. Statistical analysis among subjective symptoms and visual functions (binocular accommodative facility, vergence facility and Cut-off SF). The values between the score of each item in the questionnaire and the latent factors indicate the standardized factor loading scores from the factor analysis. Factor #2 is the focus here because it seems to be strictly concerned with visual fatigue. The values between the latent factor “discomfort after near work” and the visual measures were obtained from bivariate correlation. *p < 0.05.
In addition, multiple linear regression between the factor ‘discomfort after near work’ (Y) and binocular accommodative facility (X1) and Cut-off SF (X2) was Y = −0.215∗X1 −0.278∗X2 (F = 9.196, P < 0.001). The values between the latent factor “discomfort after near work” and the visual measures indicate binocular accommodative facility and Cut-off SF are sensitive measurements that may also inform about visual fatigue.
Relationships Among the Clinical Visual Measurements
Binocular accommodative facility was correlated positively with vergence facility (Pearson’s r = 0.249, P = 0.011).
Correlation coefficients between binocular accommodative facility/vergence facility and contrast sensitivity are listed in Table 2. Binocular accommodative facility was moderately correlated with High CSF (Pearson’s r = 0.267, P = 0.006), but not so with Low CSF (Spearman’s r = 0.198, P = 0.044) and Mid CSF (Pearson’s r = 0.180, P = 0.068). Vergence facility was moderately correlated with Low CSF (Spearman’s r = −0.271, P = 0.005), but not with Mid CSF (Pearson’s r = −0.213, P = 0.028) and High CSF (Pearson’s r = −0.026, P = 0.793).
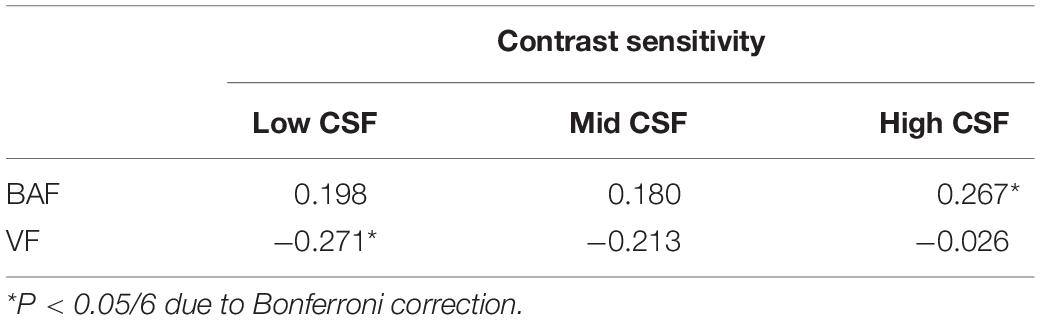
Table 2. Correlation coefficients (r) between binocular accommodative facility (BAF)/vergence facility (VF) and contrast sensitivity (Low CSF, Mid CSF, High SF) in 104 participants.
Discussion
In our study, we investigated whether there is an association between the scores of the questionnaire about visual fatigue and results from clinical visual measurements. We performed factor analysis to find associations between the exogenous latent factors (ex. visual fatigue) and endogenous scores of the questionnaire. Then we performed a bivariate correlation analysis between the latent factor “discomfort after near work,” which represents visual fatigue, and the results from clinical visual measurements for binocular accommodative facility, vergence facility and contrast sensitivity. Lastly, we assessed whether there is an association between the measures from the clinical visual measurements themselves.
Relationship Between Visual Fatigue and Visual Clinical Measurements Based on Factor Analysis
Factor analysis showed that visual fatigue, which is represented by the factor “discomfort after near work,” is strongly correlated with the results of binocular accommodative facility and Cut-off SF but not with vergence facility (see Figure 5). This finding is unexpected because both binocular accommodative facility and vergence facility are related to binocular vision. However, as our results from the subsequent section indicate, results between vergence facility and High CSF are not correlated, whereas those between binocular accommodative facility and High CSF are correlated. These findings indicate that binocular accommodative facility captures not only binocular visual function but also the ability of observers to encode visual details (i.e., high spatial frequency content). Hence, our results from factor analysis indicate that visual fatigue is strongly correlated with the ability of the adult observers to encode visual details at the binocular (cut-off SF, binocular accommodative facility) level.
Moreover, the subsequent section (section #2) of our study indicates that binocular accommodative facility is correlated with vergence facility. This finding indicates that binocular accommodative facility, rather than vergence facility, might be a more sensitive index. A high incidence rate of binocular vision dysfunction in Chinese young adults has been reported (Ma et al., 2019). For this reason, it is critical to come up with a sensitive quantitative measurement to evaluate visual fatigue caused by binocular dysfunction.
In our study, all participants had 20/20 or corrected to 20/20 in their visual acuity, but there were some individuals who reported blurred vision. This observation seems to be in line with results from some studies which indicate that the experience of mild symptoms of asthenopia and foggy vision can decrease contrast sensitivity even if the visual acuity remains intact (Quant, 1992; Järvinen and Hyvärinen, 1997). Since high spatial frequency information can appear at a relatively lower contrast, the contrast sensitivity for higher spatial frequency content is much lower in humans. For this reason, a measurement of contrast sensitivity, Cut-off SF, which reveals the best resolution of visual performance, might better capture the ability of human observers to detect and encode the details (Arden, 1978; Marmor, 1986) than the measurement of visual acuity.
These results indicate that symptoms originating from accommodative and binocular dysfunction primarily impact the feeling of eyes and visual performance. Cut-off SF and binocular accommodative facility seem to be robust predictors of visual fatigue.
Correlations Among Accommodative Facility, Vergence Facility, and Contrast Sensitivity
Our results show that there are moderate correlations between accommodation/vergence and contrast sensitivity. We found that binocular accommodative facility is positively correlated with High CSF (shown in Table 2). Our results are consistent with those from previous studies. To illustrate, Muck (Mucke et al., 2010) reported that dynamic accommodation is related with contrast sensitivity at high spatial frequency. The faster the dynamic response, the more reduced the contrast sensitivity for high but not low spatial frequency (Mucke et al., 2010). To perform well in an accommodative facility test, individuals should have a good contrast sensitivity for high spatial frequency.
We found a strong negative correlation (p < 0.01) between vergence facility and Low CSF. This indicates that when Low CSF is lower, vergence facility is better. Vergence causes a rapid shift of the retina image, which causes one to neglect high spatial frequency information (Campbell and Wurtz, 1978; Burr and Ross, 1982). Suppression of low spatial frequency content takes place during convergence eye movement (i.e., vergence dynamics) (Mucke et al., 2013). This recent study agrees to what we report here, namely no correlation between vergence facility and High CSF, and the negative correlation between vergence facility and Low CSF (shown in Table 2).
Moreover, according to our results, symptomatic participants had worse binocular accommodative facility and vergence facility than asymptomatic ones. There are many studies that show similar findings to our results. For example, Hennessey et al. (1984); Levine et al. (1985) and Momeni-Moghaddam et al. (2014) found that accommodative facility and vergence facility are primary functions for accommodation and vergence. They also found that these two functions have a strong relationship with symptoms of visual fatigue (Garcia-Munoz et al., 2014). In addition, accommodative facility and vergence facility are important for reading (Dusek et al., 2011; CITT-ART Investigator Group et al., 2015). Compared to static accommodative amplitude and fusional range, dynamic function, such as facility, could be more pertinent to reading performance (Buzzelli, 1991; Grisham et al., 2007; Palomo-Alvarez and Puell, 2008; Dusek et al., 2010; Quaid and Simpson, 2013).
Moreover, our study uses the qCSF method (Lesmes et al., 2010), which is quick and reliable (Hou et al., 2010; Lesmes, 2010; Hou et al., 2016). In this study, we show that the correlation between clinical characteristics and areal measure from CSF can be used to explain the relationship between binocular dysfunction and visual performance (contrast sensitivity). This approach can be used not just for assessing visual fatigue but also other visual disorders.
In summary, visual fatigue disrupts the binocular ability of adult observers to encode fine details from their visual environment. Binocular accommodative facility and Cut-off SF were sensitive indexes to detect the influence of visual fatigue.
Data Availability Statement
The raw data supporting the conclusions of this article will be made available by the authors, without undue reservation.
Ethics Statement
The studies involving human participants were reviewed and approved by the Ethics Committee of Affiliated eye hospital of Wenzhou Medical University. The patients/participants provided their written informed consent to participate in this study.
Author Contributions
FZ, FH, and WYW contributed to conception and design of the study and performed the statistical analysis. FZ, JM, PH, and BC organized the database. FZ wrote the first draft of the manuscript. All authors contributed to manuscript revision, read, and approved the submitted version.
Funding
This work was supported by the National Key R&D Program of China (2016YFB0401203 to WYW), Science and Technology Planning Project of Zhejiang Province (LGF19H120002), and Science Project of Wenzhou Science & Technology Bureau (Y20190645).
Conflict of Interest
The authors declare that the research was conducted in the absence of any commercial or financial relationships that could be construed as a potential conflict of interest.
Acknowledgments
We thank Chunwen Tao and Weiwei Lu for their help in data collection in this study. We thank Seung Hyun (Sam) Min (www.ses21.com) for editing the manuscript.
References
Applegate, R. A., Howland, H. C., Sharp, R. P., Cottingham, A. J., and Yee, R. W. (1998). Corneal aberrations and visual performance after radial keratotomy. J. Refract. Surg. 14, 397–407. doi: 10.3928/1081-597x-19980701-05
Arden, G. B. (1978). The importance of measuring contrast sensitivity in cases of visual disturbance. Br. J. Ophthalmol. 62, 198–209. doi: 10.1136/bjo.62.4.198
Barten, P. G. J. (1999). Contrast Sensitivity of the Human Eye and Its Effects on Image Quality. USA: SPIE.
Bhanderi, D. J., Choudhary, S., and Doshi, V. G. (2008). A community-based study of asthenopia in computer operators. Indian J. Ophthalmol. 56, 51–55. doi: 10.4103/0301-4738.37596
Blehm, C., Vishnu, S., Khattak, A., Mitra, S., and Yee, R. W. (2005). Computer vision syndrome: a review. Surv. Ophthalmol. 50, 253–262.
Burr, D. C., and Ross, J. (1982). Contrast sensitivity at high velocities. Vision Res. 22, 479–484. doi: 10.1016/0042-6989(82)90196-1
Buzzelli, A. R. (1991). Stereopsis, accommodative and vergence facility: do they relate to dyslexia? Optom. Vis. Sci. 68, 842–846. doi: 10.1097/00006324-199111000-00002
Campbell, F. W., and Wurtz, R. H. (1978). Saccadic omission: why we do not see a grey-out during a saccadic eye movement. Vision Res. 18, 1297–1303. doi: 10.1016/0042-6989(78)90219-5
Chen, A. M., Roberts, T. L., Cotter, S. A., Kulp, M. T., Sinnott, L. T., Borsting, E. J., et al. (2021). Effectiveness of vergence/accommodative therapy for accommodative dysfunction in children with convergence insufficiency. Ophthalmic. Physiol. Opt. 41, 21–32.
Chen, M. K. (1986). The epidemiology of self-perceived fatigue among adults. Prev. Med. 15, 74–81. doi: 10.1016/0091-7435(86)90037-x
Chung, S. T. L., Legge, G. E., and Tjan, B. S. (2002). Spatial-frequency characteristics of letter identification in central and peripheral vision. Vision Res. 42, 2137–2152. doi: 10.1016/s0042-6989(02)00092-5
CITT-ART Investigator Group, M., Mitchell, G. L., Cotter, S. A., Kulp, M., Chase, C., et al. (2015). Convergence Insufficiency Treatment Trial - Attention and Reading Trial (CITT-ART): design and Methods. Vis. Dev. Rehabil. 1, 214–228. doi: 10.31707/vdr2015.1.3.p214
Dusek, W. A., Pierscionek, B. K., and McClelland, J. F. (2011). An evaluation of clinical treatment of convergence insufficiency for children with reading difficulties. BMC Ophthalmol. 11:21. doi: 10.1186/1471-2415-11-21
Dusek, W., Pierscionek, B. K., and McClelland, J. F. (2010). A survey of visual function in an Austrian population of school-age children with reading and writing difficulties. BMC Ophthalmol. 10:16. doi: 10.1186/1471-2415-10-16
Gall, R., and Wick, B. (2003). The symptomatic patient with normal phorias at distance and near: what tests detect a binocular vision problem? Optometry 74, 309–322.
Gandolfi, S. A., Cimino, L., Sangermani, C., Ungaro, N., Mora, P., and Tardini, M. G. (2005). Improvement of spatial contrast sensitivity threshold after surgical reduction of intraocular pressure in unilateral high-tension glaucoma. Invest Ophthalmol. Vis. Sci. 46, 197–201. doi: 10.1167/iovs.04-0199
García-Muñoz, Á, Carbonell-Bonete, S., and Cacho-Martínez, P. (2014). Symptomatology associated with accommodative and binocular vision anomalies. J. Optom. 7, 178–192. doi: 10.1016/j.optom.2014.06.005
Garcia-Munoz, A., Carbonell-Bonete, S., and Cacho-Martinez, P. (2014). Symptomatology associated with accommodative and binocular vision anomalies. J. Optom. 7, 178–192. doi: 10.1016/j.optom.2014.06.005
Golebiowski, B., Long, J., Harrison, K., Lee, A., Chidi-Egboka, N., and Asper, L. (2020). Smartphone Use and Effects on Tear Film, Blinking and Binocular Vision. Curr. Eye Res. 45, 428–434. doi: 10.1080/02713683.2019.1663542
Grisham, D., Powers, M., and Riles, P. (2007). Visual skills of poor readers in high school. Optometry 78, 542–549. doi: 10.1016/j.optm.2007.02.017
Han, C. C., Liu, R., Liu, R. R., Zhu, Z. H., Yu, R. B., and Ma, L. (2013). Prevalence of asthenopia and its risk factors in Chinese college students. Int. J. Ophthalmol. 6, 718–722.
Hashemi, H., Saatchi, M., Yekta, A., Ali, B., Ostadimoghaddam, H., Nabovati, P., et al. (2019). High Prevalence of Asthenopia among a Population of University Students. J Ophthalmic Vis. Res. 14, 474–482.
Hennessey, D., Iosue, R. A., and Rouse, M. W. (1984). Relation of symptoms to accommodative infacility of school-aged children. Am. J. Optom. Physiol. Opt. 61, 177–183. doi: 10.1097/00006324-198403000-00005
Hou, F., Huang, C. B., Lesmes, L., Feng, L. X., Tao, L., Zhou, Y. F., et al. (2010). qCSF in clinical application: efficient characterization and classification of contrast sensitivity functions in amblyopia. Invest Ophthalmol. Vis. Sci. 51, 5365–5377. doi: 10.1167/iovs.10-5468
Hou, F., Lesmes, L. A., Kim, W., Gu, H., Pitt, M. A., Myung, J. I., et al. (2016). Evaluating the performance of the quick CSF method in detecting contrast sensitivity function changes. J. Vis. 16:18. doi: 10.1167/16.6.18
Ip, J. M., Robaei, D., Rochtchina, E., and Mitchell, P. (2006). Prevalence of eye disorders in young children with eyestrain complaints. Am. J. Ophthalmol. 142, 495–497. doi: 10.1016/j.ajo.2006.03.047
Järvinen, P., and Hyvärinen, L. (1997). Contrast sensitivity measurement in evaluations of visual symptoms caused by exposure to triethylamine. Occup. Environ. Med. 54, 483–486. doi: 10.1136/oem.54.7.483
Kleiner, M. B., Brainard, D. H., Pelli, D. G., Ingling, A., and Broussard, C. (2007). What’s new in Psychtoolbox-3? Perception 36, 301–307.
Kwon, M., and Legge, G. E. (2011). Spatial-frequency cutoff requirements for pattern recognition in central and peripheral vision. Vision Res. 51, 1995–2007. doi: 10.1016/j.visres.2011.06.020
Larese, F. F., Drusian, A., Ronchese, F., and Negro, C. (2019). Video Display Operator Complaints: a 10-Year Follow-Up of Visual Fatigue and Refractive Disorders. Int. J. Environ. Res. Public Health 16:2501. doi: 10.3390/ijerph16142501
Lesmes, L. A. (2010). Bayesian adaptive estimation of the contrast sensitivity function: The quick CSF method. J. Vis. 10, 1–21. doi: 10.1167/10.3.17
Lesmes, L. A., Lu, Z. L., Baek, J., and Albright, T. D. (2010). Bayesian adaptive estimation of the contrast sensitivity function: the quick CSF method. J. Vis. 10, 17, 11–21.
Levine, S., Ciuffreda, K. J., Selenow, A., and Flax, N. (1985). Clinical assessment of accommodative facility in symptomatic and asymptomatic individuals. J. Am. Optom. Assoc. 56, 286–290.
Liu, J. S., Lee, M., Jang, J., Ciuffreda, K. J., Wong, J. H., Grisham, D., et al. (1979). Objective assessment of accommodation orthoptics. I. Dynamic insufficiency. Am. J. Optom. Physiol. Opt. 56, 285–294. doi: 10.1097/00006324-197905000-00002
Ma, M. M., Yeo, A. C. H., Scheiman, M., and Chen, X. (2019). Vergence and Accommodative Dysfunctions in Emmetropic and Myopic Chinese Young Adults. J. Ophthalmol. 2019:5904903.
Marmor, M. F. (1986). Contrast sensitivity versus visual acuity in retinal disease. Br. J. Ophthalmol. 70, 553–559. doi: 10.1136/bjo.70.7.553
Momeni-Moghaddam, H., Goss, D. A., and Dehvari, A. (2014). Vergence facility with stereoscopic and nonstereoscopic targets. Optom. Vis. Sci. 91, 522–527. doi: 10.1097/opx.0000000000000227
Mucke, S., Manahilov, V., Strang, N. C., Seidel, D., Gray, L. S., and Shahani, U. (2010). Investigating the mechanisms that may underlie the reduction in contrast sensitivity during dynamic accommodation. J. Vis. 10:5. doi: 10.1167/10.5.5
Mucke, S., Strang, N. C., Aydin, S., Mallen, E. A., Seidel, D., and Manahilov, V. (2013). Spatial frequency selectivity of visual suppression during convergence eye movements. Vision Res. 89, 96–101. doi: 10.1016/j.visres.2013.07.008
Oshika, T., Okamoto, C., Samejima, T., Tokunaga, T., and Miyata, K. (2006). Contrast Sensitivity Function and Ocular Higher-Order Wavefront Aberrations in Normal Human Eyes. Ophthalmology 113, 1807–1812. doi: 10.1016/j.ophtha.2006.03.061
Palomo-Alvarez, C., and Puell, M. C. (2008). Accommodative function in school children with reading difficulties. Graefes Arch. Clin. Exp. Ophthalmol. 246, 1769–1774. doi: 10.1007/s00417-008-0921-5
Quaid, P., and Simpson, T. (2013). Association between reading speed, cycloplegic refractive error, and oculomotor function in reading disabled children versus controls. Graefes Arch. Clin. Exp. Ophthalmol. 251, 169–187. doi: 10.1007/s00417-012-2135-0
Quant, J. R. (1992). The effect of sleep deprivation and sustained military operations on near visual performance. Aviat Space Environ. Med. 63, 172–176.
Regan, D., and Beverley, K. I. (1983). Visual fields described by contrast sensitivity, by acuity, and by relative sensitivity to different orientations. Invest. Ophthalmol. Vis. Sci. 24, 754–759.
Rosenfield, M. (2011). Computer vision syndrome: a review of ocular causes and potential treatments. Ophthalmic Physiol. Opt. 31, 502–515. doi: 10.1111/j.1475-1313.2011.00834.x
Scheiman, M., and Wick, B. (2014). Clinical Management of Binocular Vision- Heterophoric, Accommodative, and Eye Movement Disorders. Philadelphia, PA: Lippincott, Williams & Wilkins.
Sheedy, J. E., Hayes, J. N., and Engle, J. (2003). Is all asthenopia the same? Optom. Vis. Sci. 80, 732–739. doi: 10.1097/00006324-200311000-00008
Sheppard, A. L., and Wolffsohn, J. S. (2018). Digital eye strain: prevalence, measurement and amelioration. BMJ Open Ophthalmol. 3:e000146. doi: 10.1136/bmjophth-2018-000146
Sterner, B., Gellerstedt, M., and Sjostrom, A. (2006). Accommodation and the relationship to subjective symptoms with near work for young school children. Ophthalmic Physiol. Opt. 26, 148–155. doi: 10.1111/j.1475-1313.2006.00364.x
Tiwari, R. R. (2013). Eyestrain in working children of footwear making units of Agra, India. Indian Pediatr. 50, 411–413. doi: 10.1007/s13312-013-0117-x
Tiwari, R. R., Saha, A., and Parikh, J. R. (2011). Asthenopia (eyestrain) in working children of gem-polishing industries. Toxicol. Ind. Health 27, 243–247. doi: 10.1177/0748233710386407
Vilela, M. A., Pellanda, L. C., Fassa, A. G., and Castagno, V. D. (2015). Prevalence of asthenopia in children: a systematic review with meta-analysis. J. Pediatr. 91, 320–325. doi: 10.1016/j.jped.2014.10.008
Yan, F. F., Hou, F., Lu, Z. L., Hu, X., and Huang, C. B. (2010). qCSF in Clinical Application: efficient Characterization and Classification of Contrast Sensitivity Functions in Amblyopia. Invest Ophthalmol. Vis. Sci. 7, 5365– 5377.
Yang, S., and James, S. E. (2011). Effects of Vergence and Accommodative Responses on Viewer’s Comfort in Viewing 3D Stimuli. United States: Pacific University College of Optometry.
Zhang, X., An, X., Liu, H., Peng, J., Cai, S., Wang, W., et al. (2015). The Topographical Arrangement of Cutoff Spatial Frequencies across Lower and Upper Visual Fields in Mouse V1. Entific Rep. 5:7734.
Zheng, H., Wang, C., Cui, R., He, X., Shen, M., Lesmes, L. A., et al. (2018). Measuring the Contrast Sensitivity Function Using the qCSF Method With 10 Digits. Transl. Vis Sci. Technol. 7:9. doi: 10.1167/tvst.7.6.9
Appendix
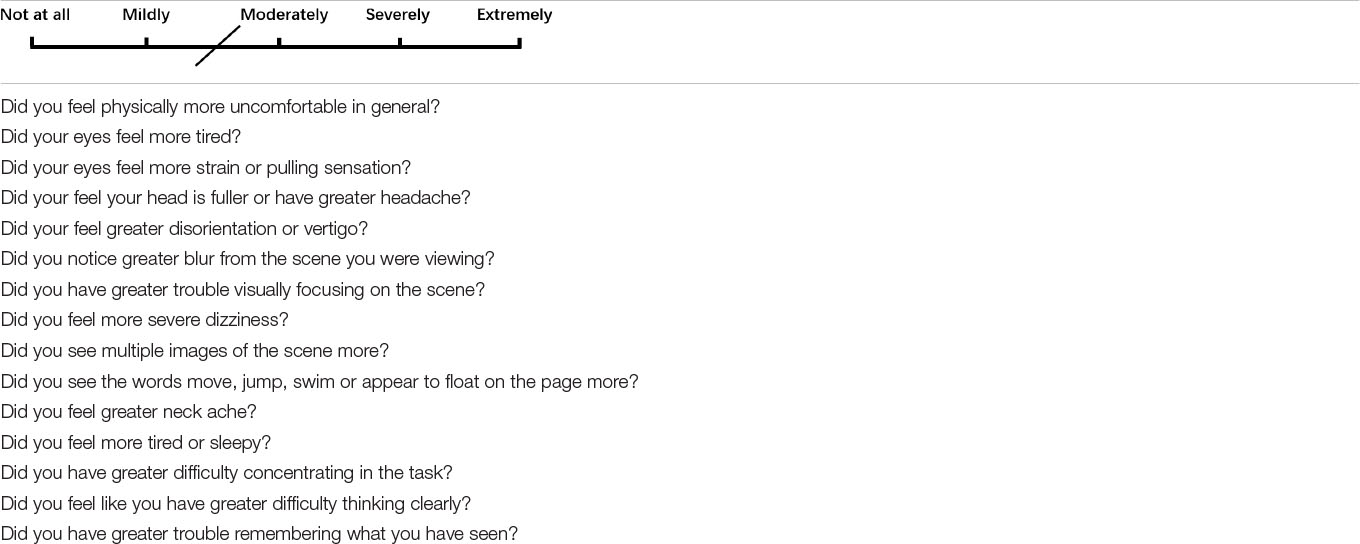
Appendix Table 1. Visual discomfort questionnaire(Yang and James, 2011). Subjects used a pen to mark the degree of visual symptoms (0 to 4) on paper, 0 for not at all and 4 for extremely likely.
Keywords: visual fatigue, contrast sensitivity, subjective symptoms, vergence facility, binocular accommodative facility, factor analysis, binocular vision
Citation: Zheng F, Hou F, Chen R, Mei J, Huang P, Chen B and Wang Y (2021) Investigation of the Relationship Between Subjective Symptoms of Visual Fatigue and Visual Functions. Front. Neurosci. 15:686740. doi: 10.3389/fnins.2021.686740
Received: 27 March 2021; Accepted: 17 June 2021;
Published: 15 July 2021.
Edited by:
Zhikuan Yang, Central South University, ChinaReviewed by:
Bin Zhang, Nova Southeastern University, United StatesShuai Chang, South China Normal University, China
Copyright © 2021 Zheng, Hou, Chen, Mei, Huang, Chen and Wang. This is an open-access article distributed under the terms of the Creative Commons Attribution License (CC BY). The use, distribution or reproduction in other forums is permitted, provided the original author(s) and the copyright owner(s) are credited and that the original publication in this journal is cited, in accordance with accepted academic practice. No use, distribution or reproduction is permitted which does not comply with these terms.
*Correspondence: Yuwen Wang, d3l3LTA3MjFAMTYzLmNvbQ==