 William Pham1*
 Miranda Lynch1
 Gershon Spitz1,2
 Terence O’Brien1,3,4,5
 Lucy Vivash1,3,4,5
 Benjamin Sinclair1,3,4*
 Meng Law1,6,7
- 1Department of Neuroscience, Central Clinical School, Monash University, Melbourne, VIC, Australia
- 2Monash-Epworth Rehabilitation Research Centre, Turner Institute for Brain and Mental Health, School of Psychological Sciences, Monash University, Melbourne, VIC, Australia
- 3Department of Neurology, Alfred Hospital, Melbourne, VIC, Australia
- 4Department of Medicine, The Royal Melbourne Hospital, University of Melbourne, Melbourne, VIC, Australia
- 5Department of Neurology, The Royal Melbourne Hospital, University of Melbourne, Melbourne, VIC, Australia
- 6Department of Radiology, Alfred Health Hospital, Melbourne, VIC, Australia
- 7Department of Electrical and Computer Systems Engineering, Monash University, Melbourne, VIC, Australia
The glymphatic system is responsible for waste clearance in the brain. It is comprised of perivascular spaces (PVS) that surround penetrating blood vessels. These spaces are filled with cerebrospinal fluid and interstitial fluid, and can be seen with magnetic resonance imaging. Various algorithms have been developed to automatically label these spaces in MRI. This has enabled volumetric and morphological analyses of PVS in healthy and disease cohorts. However, there remain inconsistencies between PVS measures reported by different methods of automated segmentation. The present review emphasizes that importance of voxel-wise evaluation of model performance, mainly with the Sørensen Dice similarity coefficient. Conventional count correlations for model validation are inadequate if the goal is to assess volumetric or morphological measures of PVS. The downside of voxel-wise evaluation is that it requires manual segmentations that require large amounts of time to produce. One possible solution is to derive these semi-automatically. Additionally, recommendations are made to facilitate rigorous development and validation of automated PVS segmentation models. In the application of automated PVS segmentation tools, publication of image quality metrics, such as the contrast-to-noise ratio, alongside descriptive statistics of PVS volumes and counts will facilitate comparability between studies. Lastly, a head-to-head comparison between two algorithms, applied to two cohorts of astronauts reveals how results can differ substantially between techniques.
The glymphatic system and perivascular spaces
In the human body, the lymphatic system is the main pathway for waste clearance (Cueni and Detmar, 2008). Generally, lymphatic organs are concentrated in regions of higher energy consumption and production of metabolic waste (Louveau et al., 2018). The lymphatic system, however, does not appear to extend to the nervous system, despite the brain’s vast metabolic demands (Iliff et al., 2013). Instead, the maintenance and waste management of the neuronal environment is governed by the glymphatic system (Hladky and Barrand, 2014; Bakker et al., 2016; Plog and Nedergaard, 2018). Aptly named, the glymphatic system eliminates waste in the brain with a system of glial cells and cerebrospinal fluid (CSF).
The prevailing understanding of glymphatic clearance involves the convective fluid flow of CSF through perivascular spaces (PVS), which are formed and lined by glial cells. At the microscopic scale, the glymphatic system comprises perivascular spaces surrounding the cerebral vasculature, also termed perivascular units (Figure 1; Troili et al., 2020). CSF produced in the choroid plexus traverses through the subarachnoid space to irrigate perforating blood vessels. As these vessels penetrate deeper into the cortex, the meningeal layers become continuous with astrocytic endfeet, forming a CSF-filled chamber that encapsulates the cerebral vascular tree (Jessen et al., 2015). The astrocytic end feet densely express aquaporin-4 channels (AQP4) which facilitate the exchange of CSF and interstitial fluid (ISF) between PVS and extracellular spaces (Iliff et al., 2013; Huguenard et al., 2017).
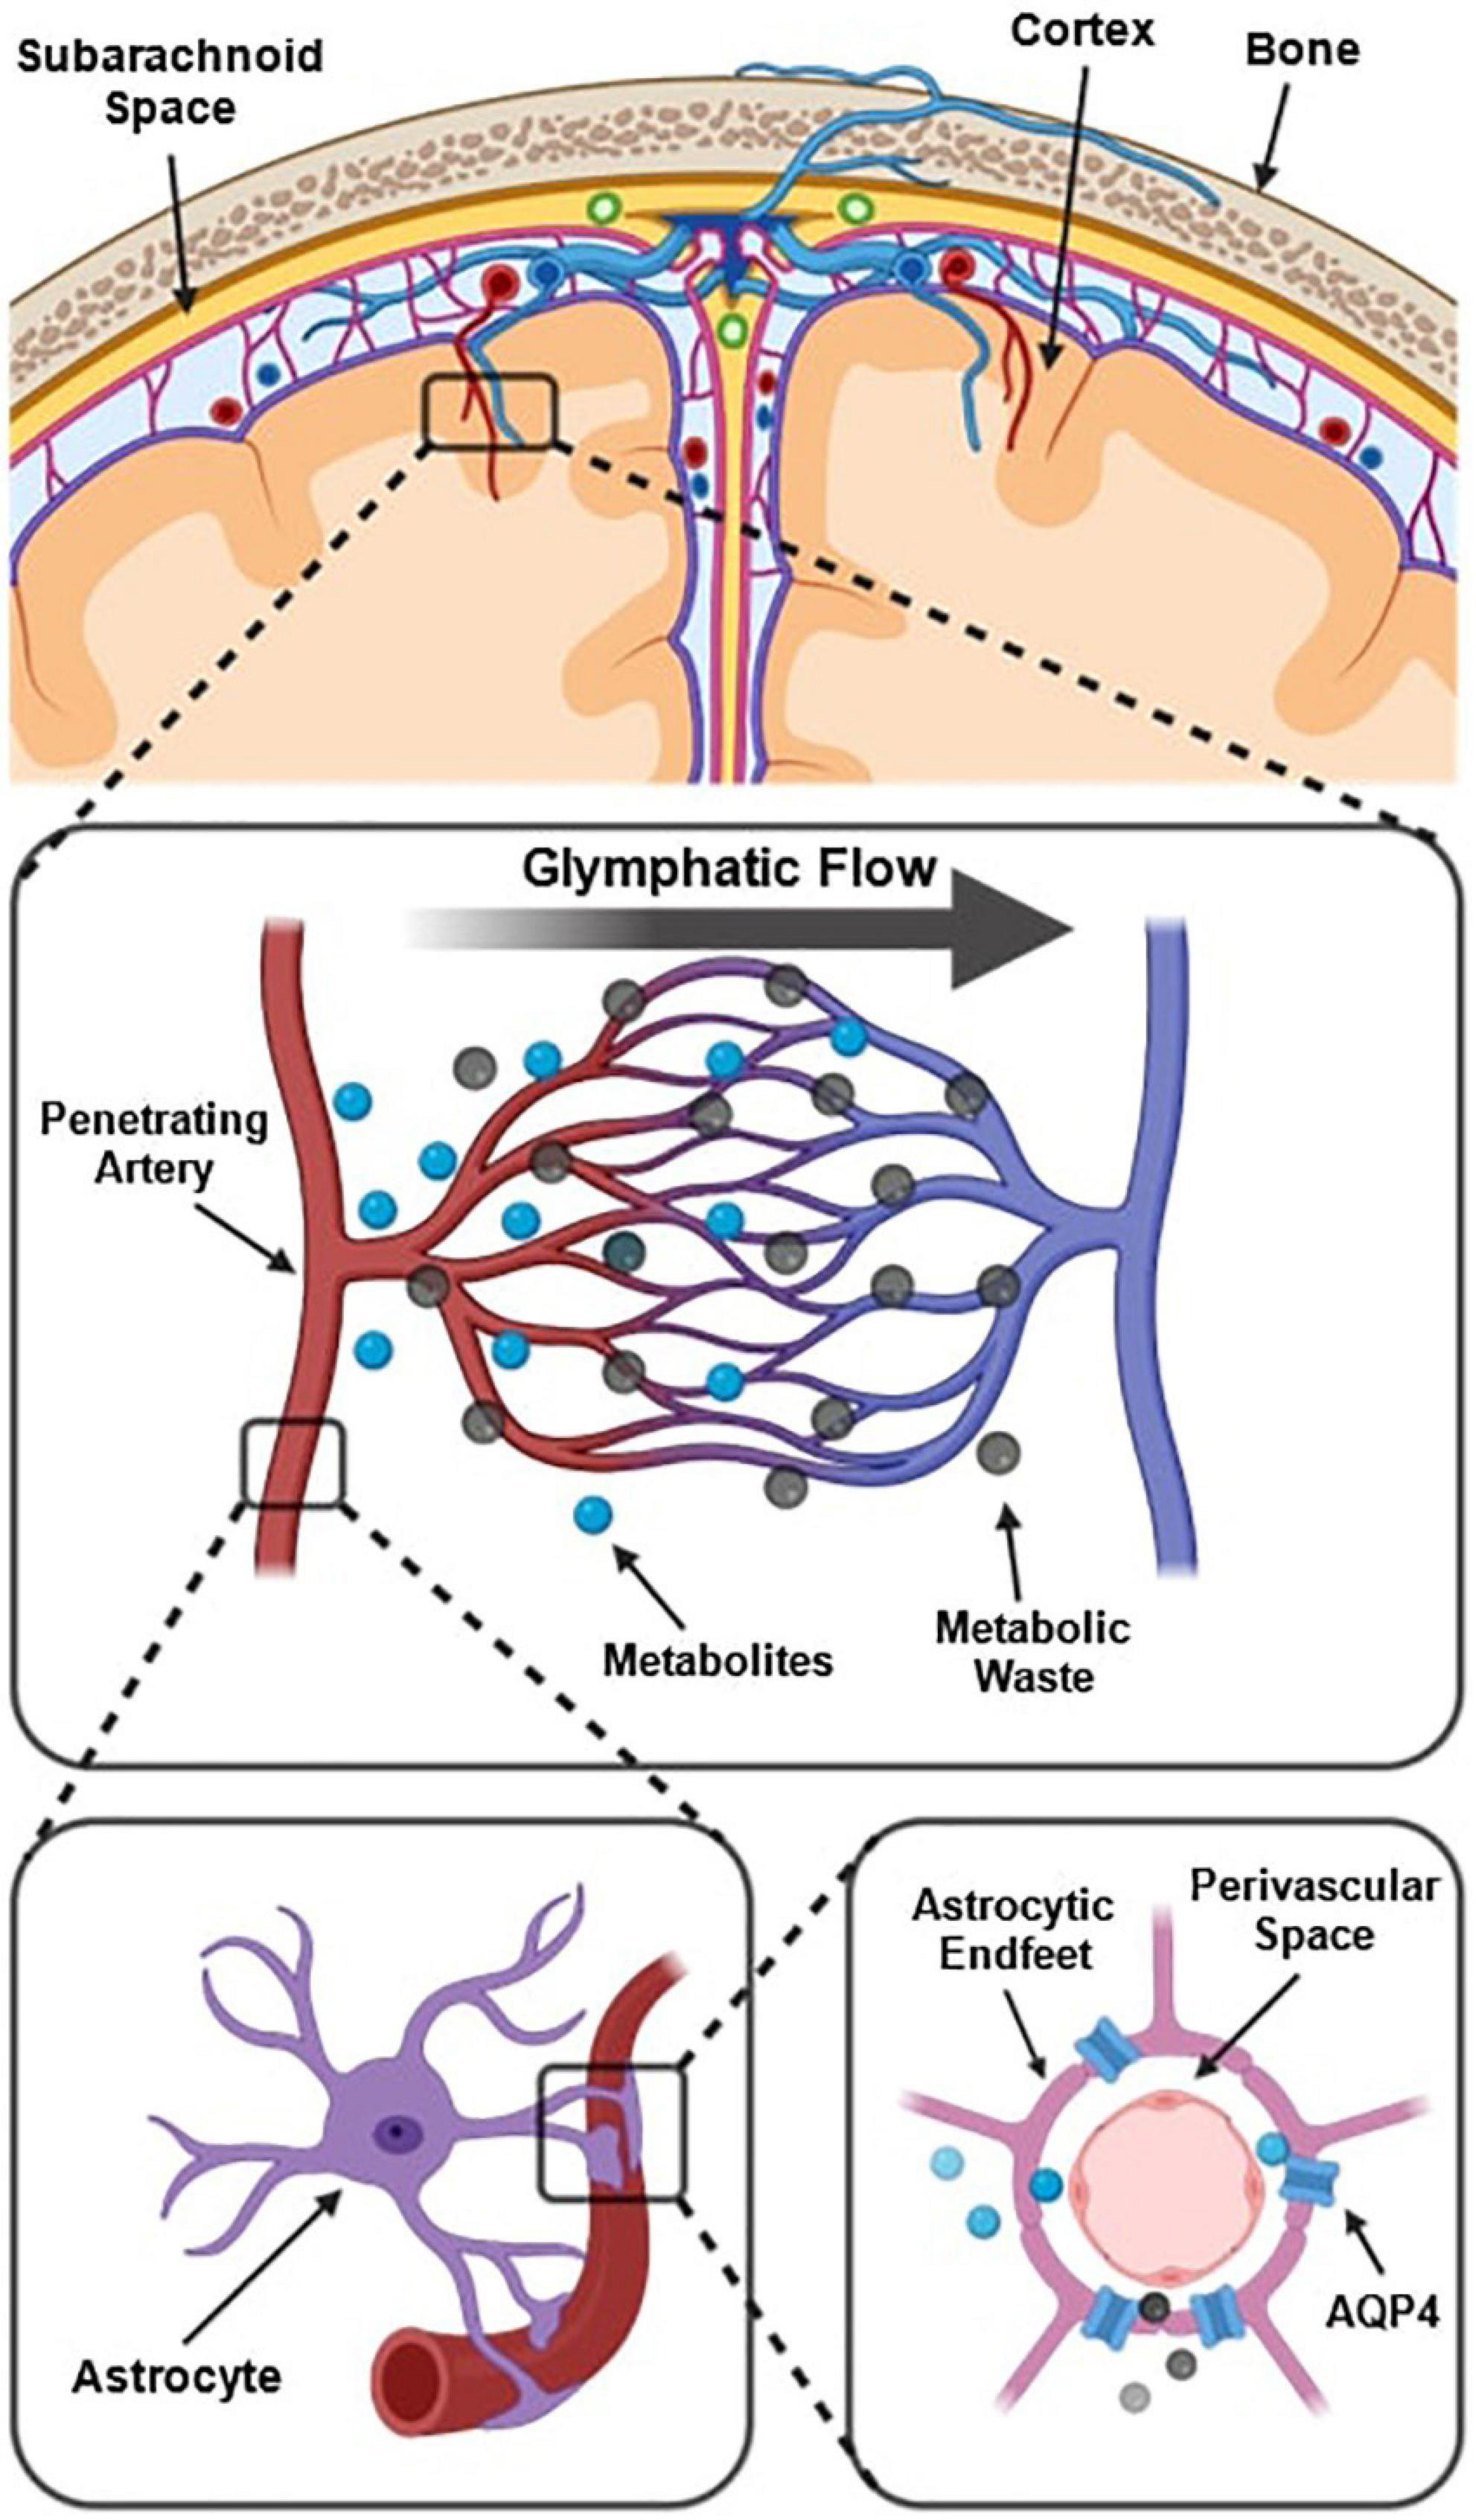
Figure 1. Schematic of the perivascular unit adapted from Troili et al. (2020). (Top) Arteries and veins from the subarachnoid space penetrate the parenchyma, perpendicular to the cortical surface. (Middle) Metabolites are extruded from arterioles and into the extracellular space, whilst metabolic waste flows towards the perivenular spaces for glymphatic clearance from the neuropil. (Bottom left) Astrocytic endfeet enclosing a penetrating arteriole which forms the perivascular space. (Bottom right) Aquaporin-4 trans-membrane channels line the astrocytic end-feet and facilitate the exchange of cerebrospinal fluid and interstitial fluid between PVS and extracellular space. Reproduced under the Creative Commons Attribution 4.0 International License (https://creativecommons.org/licenses/by/4.0/).
Multiple models have been proposed to explain the fluid flow that occurs in and around perivascular spaces (Hladky and Barrand, 2014, 2022; Bohr et al., 2022). According to one widely held model, CSF flushes out from the periarteriolar spaces, via mechanisms including convective fluid flow and arterial pulsations, into the interstitial space to flush waste metabolites towards perivenular spaces (Figure 1; Troili et al., 2020). At the perivenular spaces, interstitial waste is directed to major areas of CSF clearance and fluid filtration via dural glymphatic drainage pathways such as the venous sinuses (Albayram et al., 2022). This is known as glymphatic flow (Xie et al., 2013; Rasmussen et al., 2018).
The glymphatic system
Much of our understanding of the glymphatic system stems from animal models. Animal models have provided evidence suggesting that the clearance of metabolic waste in the interstitial space is modulated by sleep/wake states, and that the restorative effects of sleep may largely be due to glymphatic processes. For example, Xie et al. (2013) used a mouse model to demonstrate that the glymphatic system is most active during sleep, compared to awake or anesthetized mice (Xie et al., 2013). Additionally, glymphatic flow appears to be facilitated by shrinkage of the neuronal environment leading to greater interstitial space (Jessen et al., 2015). The importance of AQP4 channels in glymphatic functioning was outlined by Iliff et al. (2012), when AQP4 knock-out mice showed reduced clearance of amyloid-β by 55% and developed memory deficits. Iliff et al. (2012) also showed that this system preferentially mediates the filtration of solutes of smaller molecular size (<3 kDa), having clear implications in neurodegenerative diseases characterized by the harmful accumulation of small neurotoxins such as amyloid-β (Iliff et al., 2012; Huguenard et al., 2017). In disease models, glymphatic functions appear to be attenuated. For example, mouse models of Alzheimer’s disease (AD) exhibited reduced clearance of amyloid-β from the extracellular space (Harrison et al., 2020). Similarly, in a diabetes mellitus mouse model, glymphatic flow was attenuated with delayed clearance of contrast agents from the interstitial space (Jiang et al., 2017; Zhang et al., 2019).
In humans, contrast-enhanced magnetic resonance imaging has been used to show greater clearance of contrast agents shortly after sleep, compared to waking activity, providing further evidence that the glymphatic clearance may be most active during sleep (Lee et al., 2021). Moreover, dysfunctions of the glymphatic system have been associated with many diseases in humans, including cerebral small vessel disease, AD, and multiple sclerosis (Ge et al., 2005; Mogensen et al., 2021; Natário et al., 2021; Benveniste and Nedergaard, 2022). For example, ex vivo examination of histological slices from the white matter of an AD patient revealed enlarged perivascular spaces (Figure 2) compared to an age-matched control (Roher et al., 2003). The majority of in vivo research in humans, however, uses magnetic resonance imaging to evaluate the extent of perivascular space enlargements.
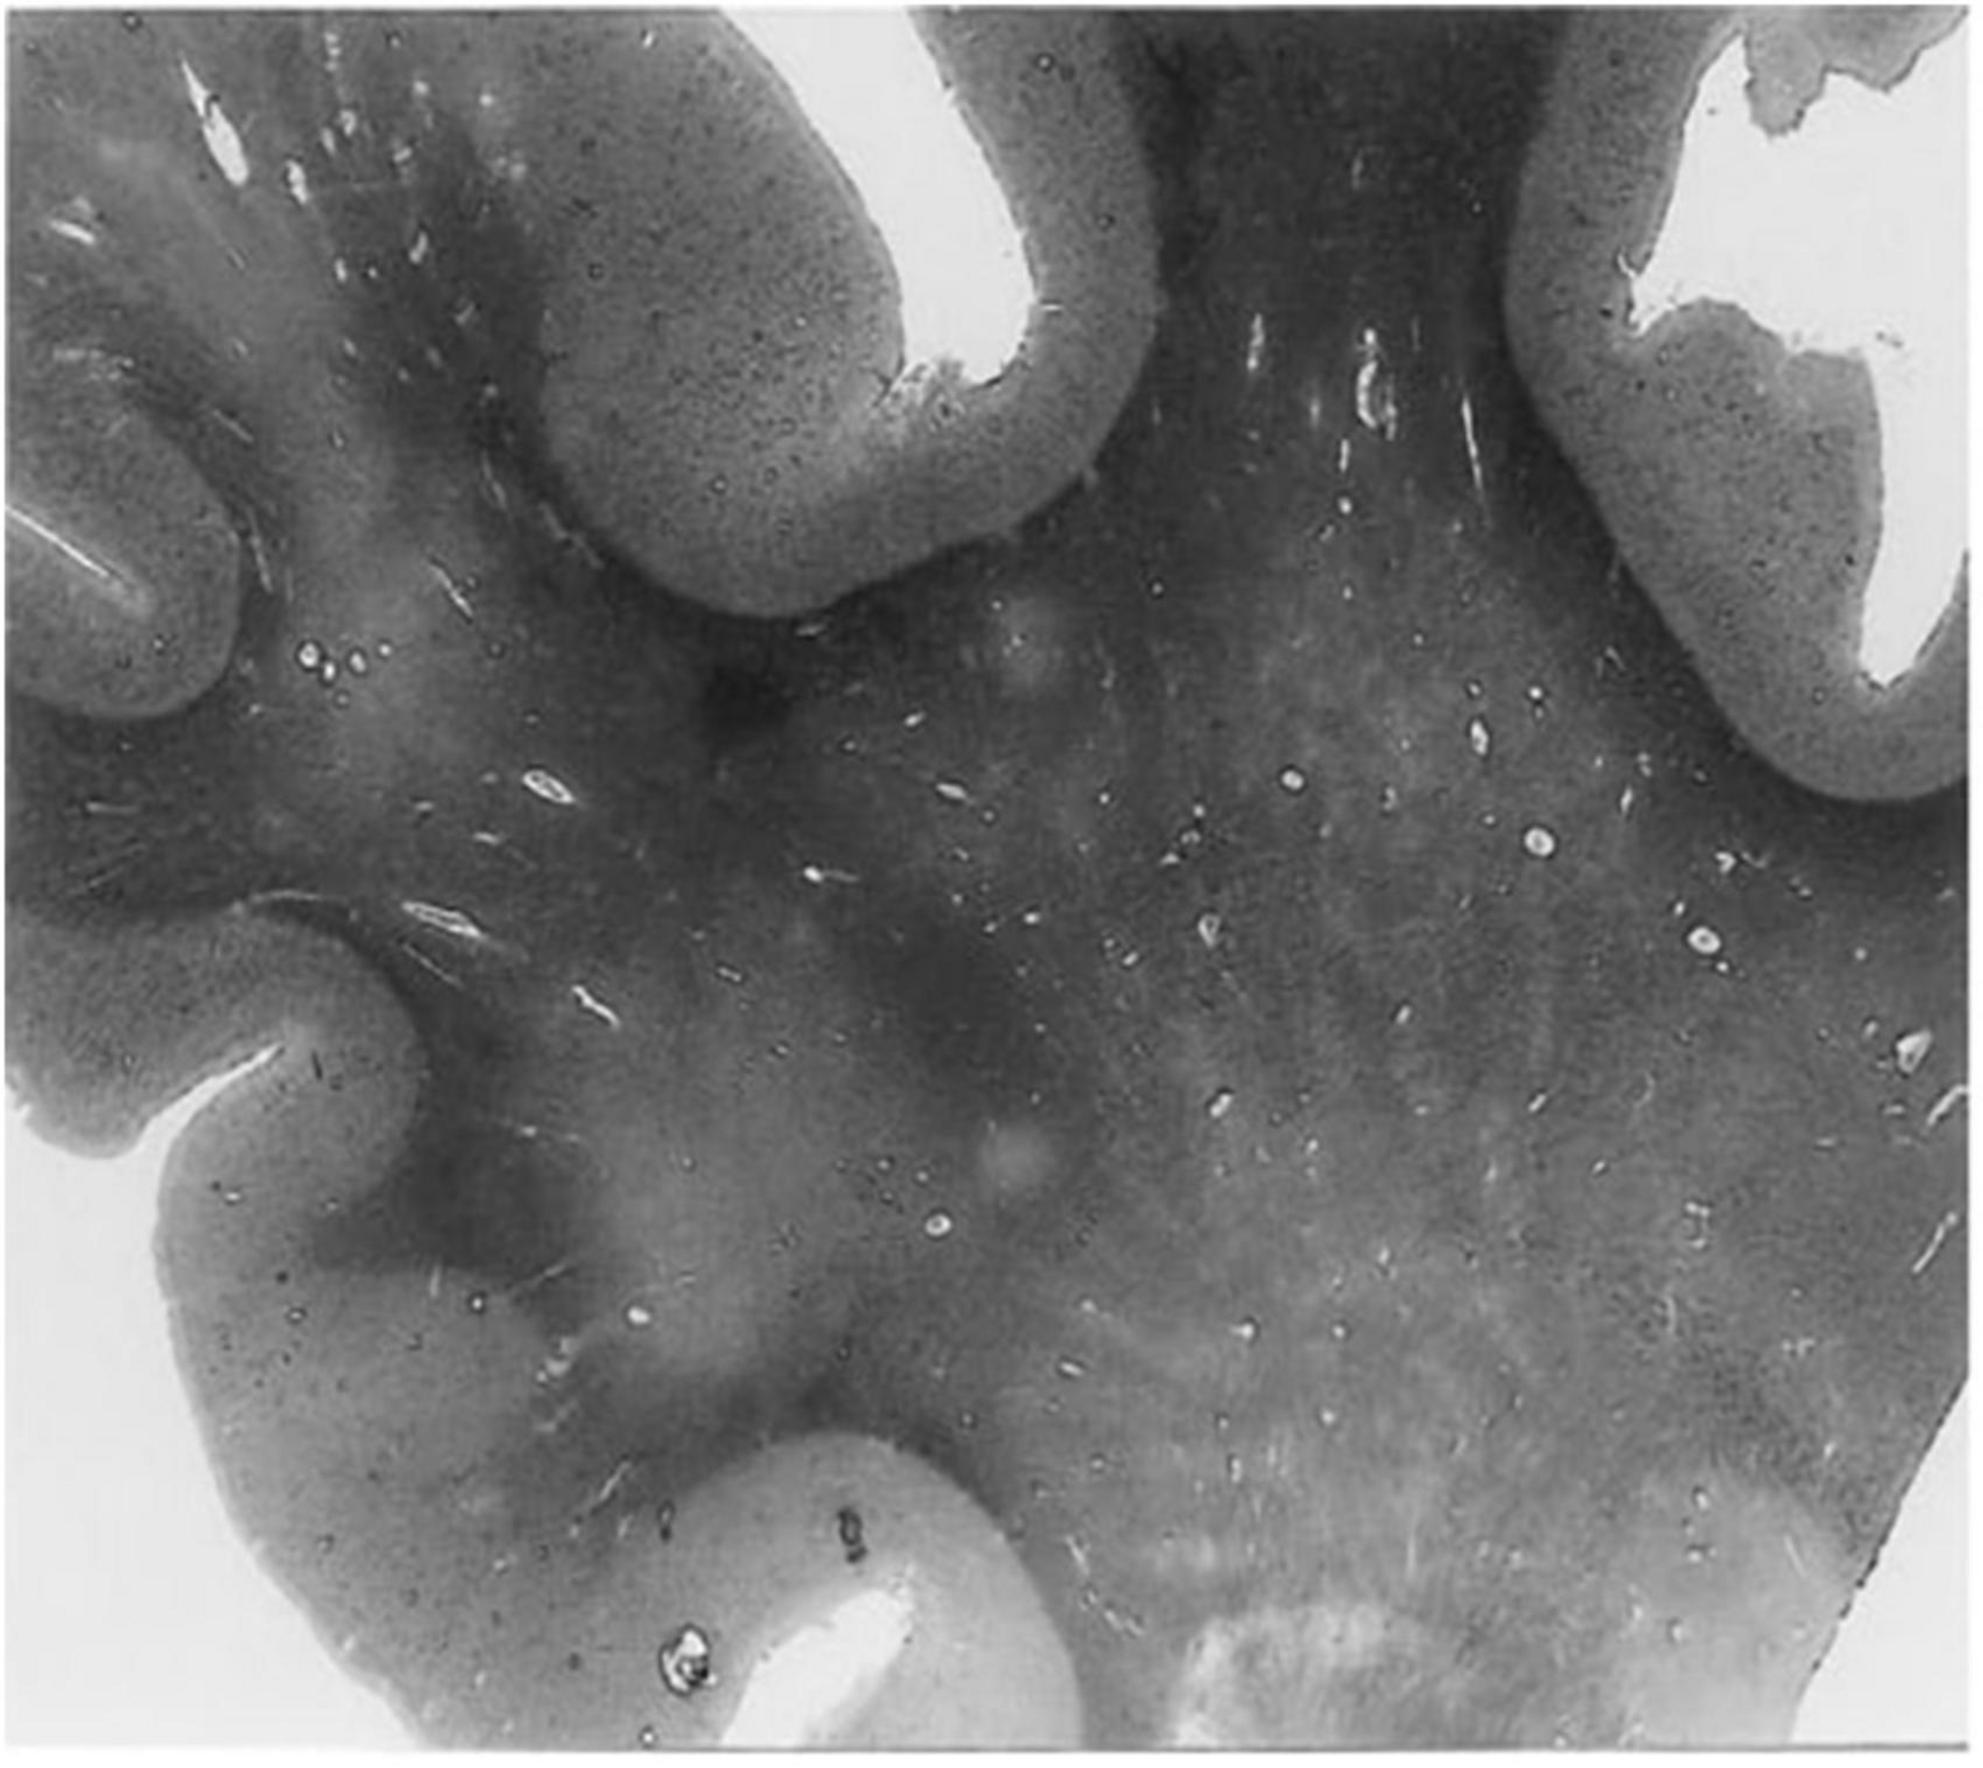
Figure 2. A histological slice of the superior frontal gyrus from an Alzheimer’s disease patient with numerous enlarged perivascular spaces in the white matter (Roher et al., 2003). PVS appear as bright tubular structures and are mainly present in white matter as opposed to gray matter. Adapted from Roher et al. (2003) and reproduced with permission from Springer Nature, conveyed via the Copyright Clearance Center, Inc.
Characterization of perivascular spaces
Perivascular spaces were first discovered in the early 1800s and described as état criblé, or diffusely enlarged, for their widespread occurrence in the basal ganglia. They are also known as Virchow-Robin spaces, after Virchow and Robin who hypothesized them to be spaces that are continuous with perineuronal spaces (Woollam and Millen, 1955). Since the arrival of neuroimaging techniques in the late 1980s, enlarged PVS have been observed in vivo (Wardlaw et al., 2020).
Magnetic resonance imaging (MRI) is the current standard for in vivo assessment of PVS in humans. MRI is used to evaluate PVS visibility as a proxy measure of glymphatic dysfunction, and potential occlusion of drainage pathways (Rasmussen et al., 2018). PVSs, particularly when enlarged, are observable in MRI scans (Figures 3, 4; Kwee and Kwee, 2007). Structurally, PVS are long tubular structures that follow cerebral blood vessels (Wardlaw et al., 2013). On MR scans, their appearance depends on the viewing plane and the MRI weighting sequence. On both T1 and T2 weighted images, PVSs are CSF isointense. Thus, they are hypointense or dark on T1 images and hyperintense or light on T2 (Kwee and Kwee, 2007). When viewed along a parallel axis, such as the sagittal or coronal planes, PVS appear as long tubular shapes. On axial slices, PVS appear as small ovoid structures typically less than 3 mm in diameter (Figure 3; Wardlaw et al., 2013). In rare cases, giant tumefactive PVS can exceed 15 mm in diameter (Salzman et al., 2005).
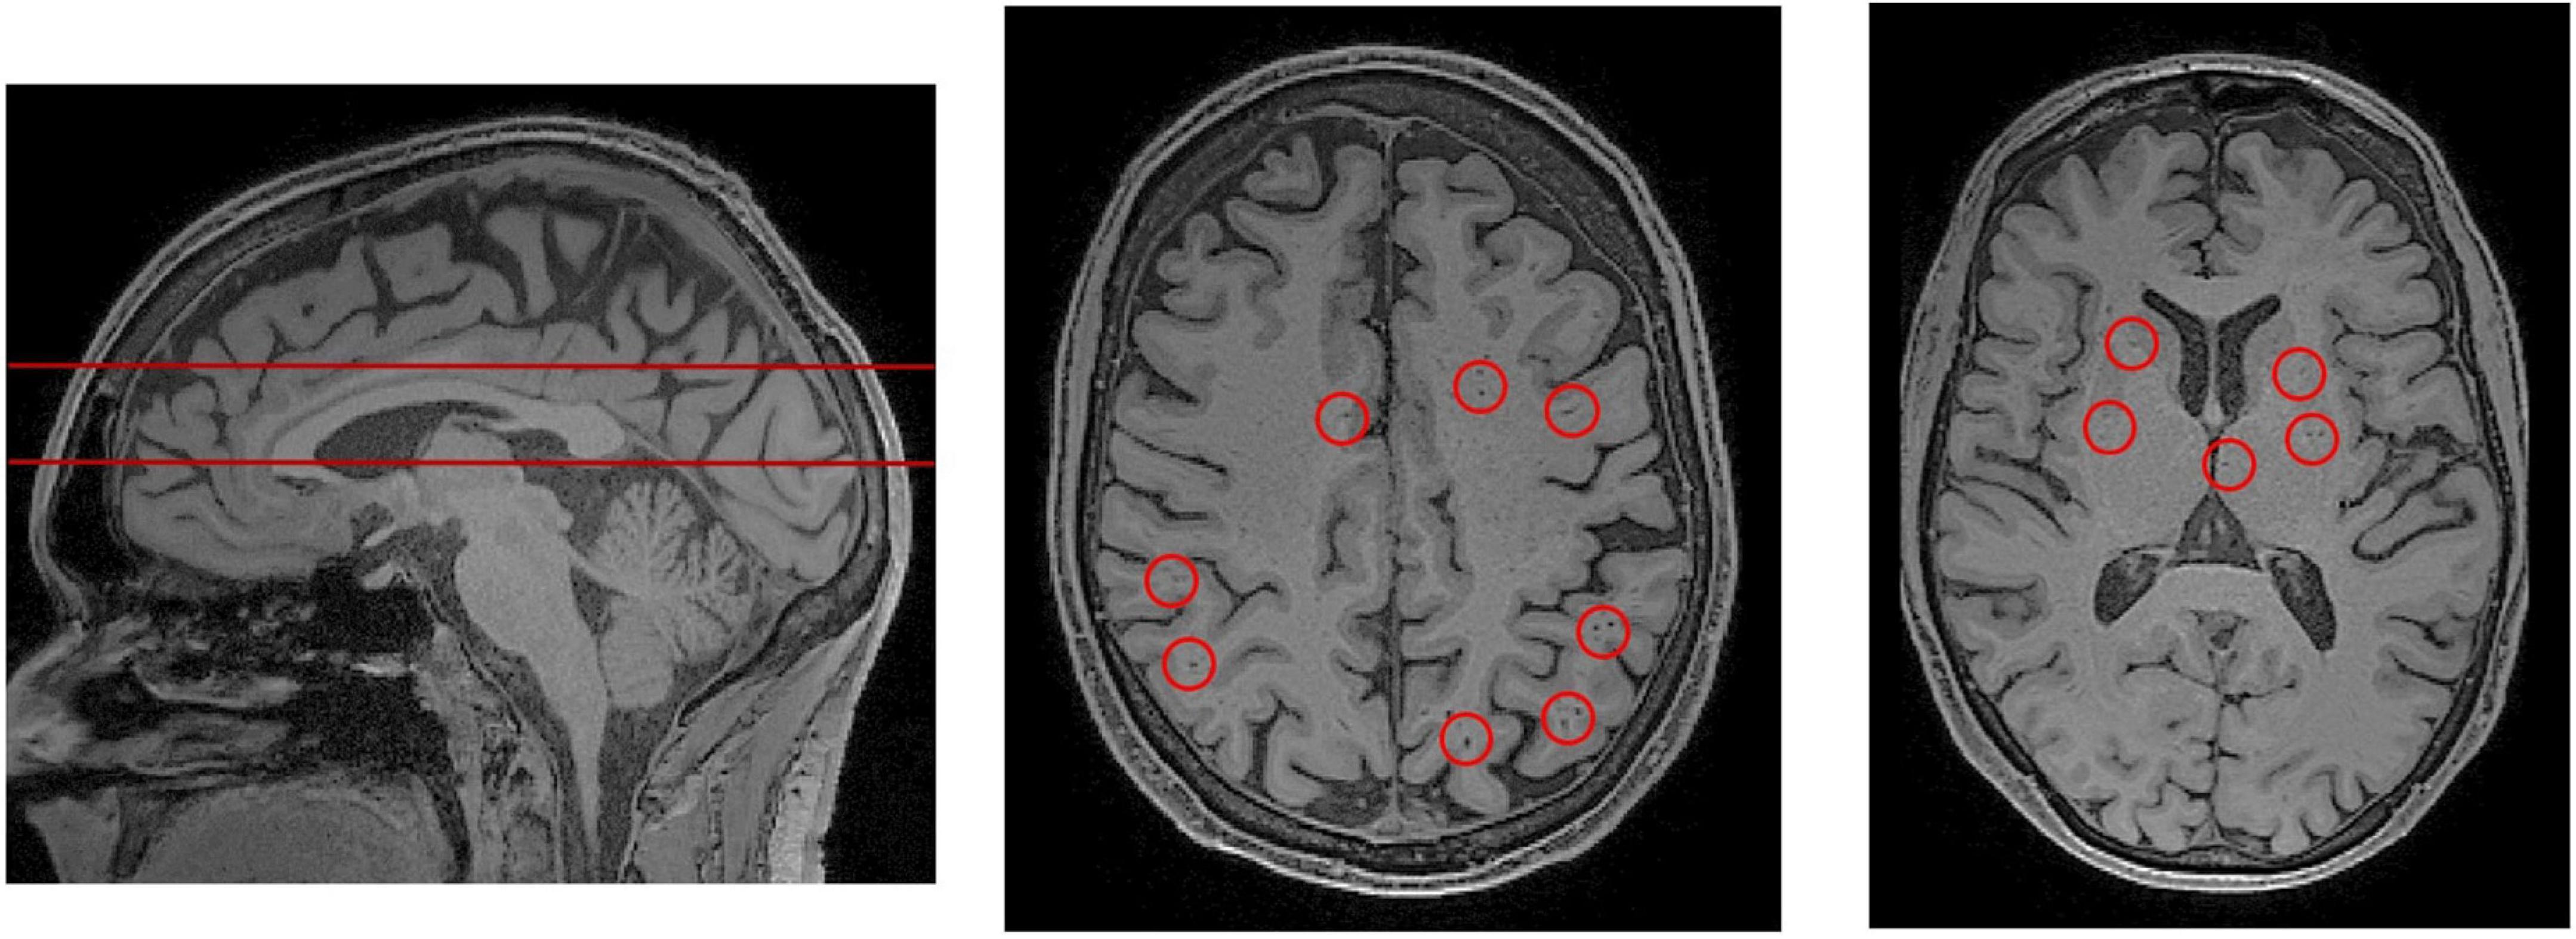
Figure 3. PVS rating scales rely on representative axial slices to assess the severity of PVS enlargement. (Left) A sagittal view of the brain, from a T1-weighted MRI scan. The red lines indicate the axial slices that have been selected for visual PVS rating. The upper line was chosen to assess PVS in the centrum semiovale, and the lower line was chosen for the basal ganglia. The centrum semiovale is the mass of white matter above the lateral ventricles. (Middle) An axial slice of the centrum semiovale corresponding to the top line. (Right) An axial slice of the basal ganglia corresponding to the bottom line. Visible perivascular spaces are outlined by red circles. For an extensive review of rating scales, please refer to Paradise et al. (2020).
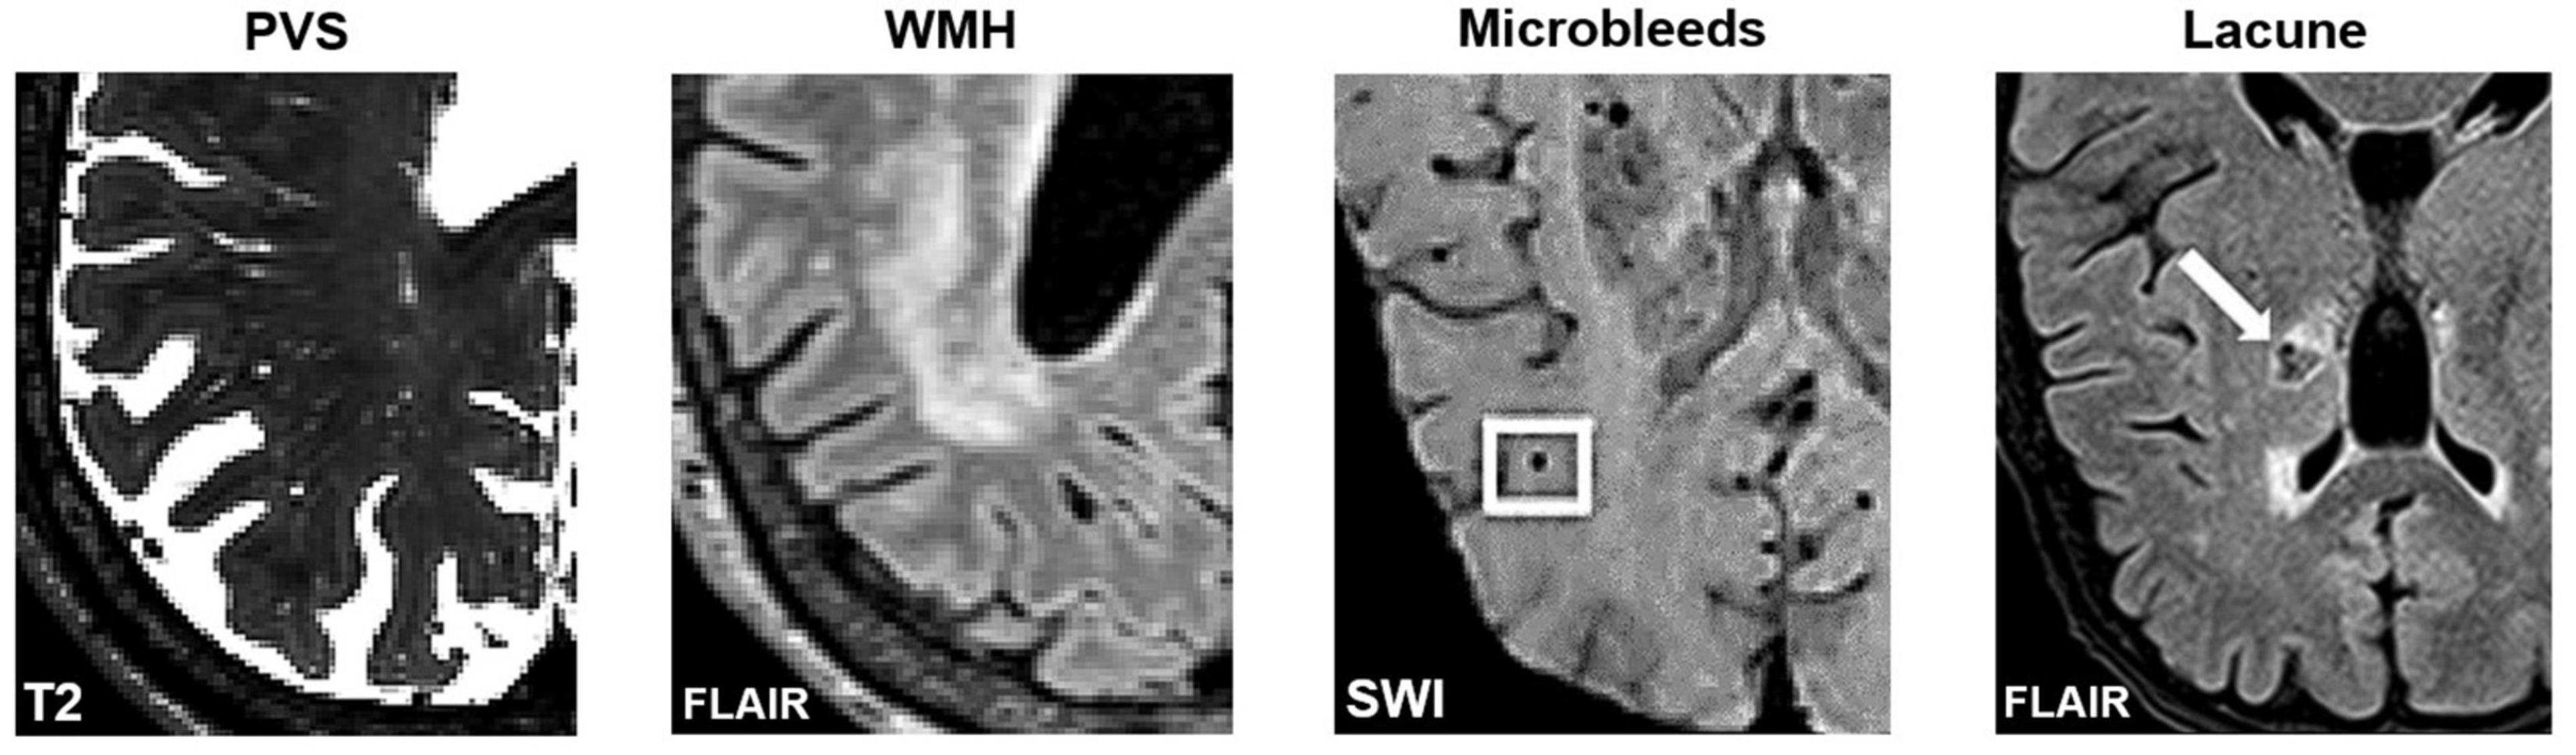
Figure 4. Axial slices of MRI-visible brain lesions, including PVS, white matter hyperintensities, microbleeds, and lacunes. PVS appear as hyperintense and tubular shapes in T2-weighted MRI scans (Left). White matter hyperintensities are prominent on FLAIR images (Middle-Left). Other lesions that can be confused with PVS include microbleeds (Middle-Right) and lacunes (Right). In FLAIR scans, lacunes are surrounded by a hyperintense rim, whereas PVS are not. Imaging artifacts such as Gibbs ringing, and motion artifacts can also hinder the automated detection of PVS. Figures of microbleeds and lacunes were adapted from Chesebro et al. (2021) and Li et al. (2019), respectively. The figures are reproduced under the Creative Commons Attribution 4.0 International License (https://creativecommons.org/licenses/by/4.0/). FLAIR, Fluid attenuated inversion recovery; SWI, susceptibility-weighted imaging.
The severity of PVS enlargement is graded by a rater according to established visual rating scales (Figure 3; Patankar et al., 2005; Adams et al., 2013; Potter et al., 2015a; Paradise et al., 2020). Subsequently, these severity scores are associated with features of interest including disease markers and risk factors. Using visual rating scales, the severity of PVS enlargement has been associated with and subsequently proposed as a potential biomarker of various neurodegenerative disorders such as cerebral small vessel disease, AD, neuroinflammation in multiple sclerosis, and cerebral amyloid angiopathies (Hansen et al., 2015; Bakker et al., 2016; Ramirez et al., 2016; Rasmussen et al., 2018; Granberg et al., 2020). Notably, a general weakness of T1 and T2 MRI sequences is that it cannot differentiate between perivenular and periarteriolar spaces (Wardlaw et al., 2020).
Perivascular spaces occur throughout the brain. The most commonly examined regions are the centrum semiovale (CS) and the basal ganglia (BG) (Figure 3). The CS is the mass of white matter (WM) superior to the lateral ventricles, and the BG, which is adjacent to the lateral ventricles and includes the caudate and putamen. Importantly, the anatomy and pathology of PVS are different between regions. In the white matter, blood vessels from the subpial space penetrate the cortical surface and into the parenchyma, are lined by a single leptomeningeal layer: the pia mater (Pollock et al., 1997). In the basal ganglia, penetrating blood vessels are lined by two leptomeningeal layers that connect to the subarachnoid space (Pollock et al., 1997). Thus, the pathophysiology of PVS differ substantially between these two regions (Wardlaw et al., 2020). For a review of the differences between cortical and basal perivascular spaces, please refer to Wardlaw et al. (2020).
Many grading scales have been developed to quantitatively assess the severity of PVS in MRI (Patankar et al., 2005; Adams et al., 2013; Wardlaw et al., 2013; Laveskog et al., 2018; Paradise et al., 2020). The most widely adopted is Wardlaw’s scale which assesses PVS severity in the CS, BG and midbrain (Potter et al., 2015c). According to Wardlaw’s scale, the rater selects a single representative axial slice for each region. If PVSs are observable in the midbrain, it is assigned a score of 1, otherwise it is assigned a score of 0. For the CS and BG, each PVS is counted (Figure 3) and the region is rated according to a 5-point rating scale (0 = no PVS found; 1 = 1–10; 2 = 11–20; 3 = 21–40, 4 = more than 40 present). The 5-point rating scale has high inter-rater and test-retest reliability, and has been used to objectively link PVS and glymphatic dysfunction with markers of disease (Paradise et al., 2020).
Limitations of visual rating scales
By assigning a simple rating to different counts of PVS, the grading scale is a highly replicable and convenient method of assessing perivascular spaces (Paradise et al., 2020). However, the reduction of PVS counts to a simple severity score restricts deeper analyses of glymphatic dysfunction that may be region-specific or associated with specific morphological changes (Zong et al., 2016; Barisano et al., 2021b). For example, asymmetric distributions of PVS between hemispheres has been related to an increased risk of post-stroke and post-traumatic epilepsy (Duncan et al., 2018; Yu et al., 2022). When there is a large difference in PVS counts between hemispheres, Wardlaw’s scale instructs the rater to use the hemisphere with the higher PVS count (Potter et al., 2015b,c). Moreover, longitudinal analyses of PVS are difficult to perform due to the coarseness of the grading scale, and the use of different scales between publications has led to difficulties comparing results and conducting meta-analyses (Granberg et al., 2020).
Multiple algorithms have been developed to facilitate or improve the consistency of PVS grading (Descombes et al., 2004; Zong et al., 2016; González-Castro et al., 2017; Dubost et al., 2019a,b; Jung et al., 2019; Sepehrband et al., 2019; Goryawala et al., 2021; Williamson et al., 2022). For example, Jung et al. (2019) applied a convolutional neural network (CNN) to increase the signal-to-noise ratio (SNR) of PVS, thereby enhancing its appearance and improving detection (Figure 5; Jung et al., 2019). Others have automated the quantification of PVS in axial slices to assign severity scores (Dubost et al., 2019a,b). However, these algorithms do not enable the volumetric or morphological examination of perivascular spaces visible in MRI (Valdes Hernandez et al., 2013). Thus, the remaining review will focus on methods for automatically segmenting perivascular spaces.
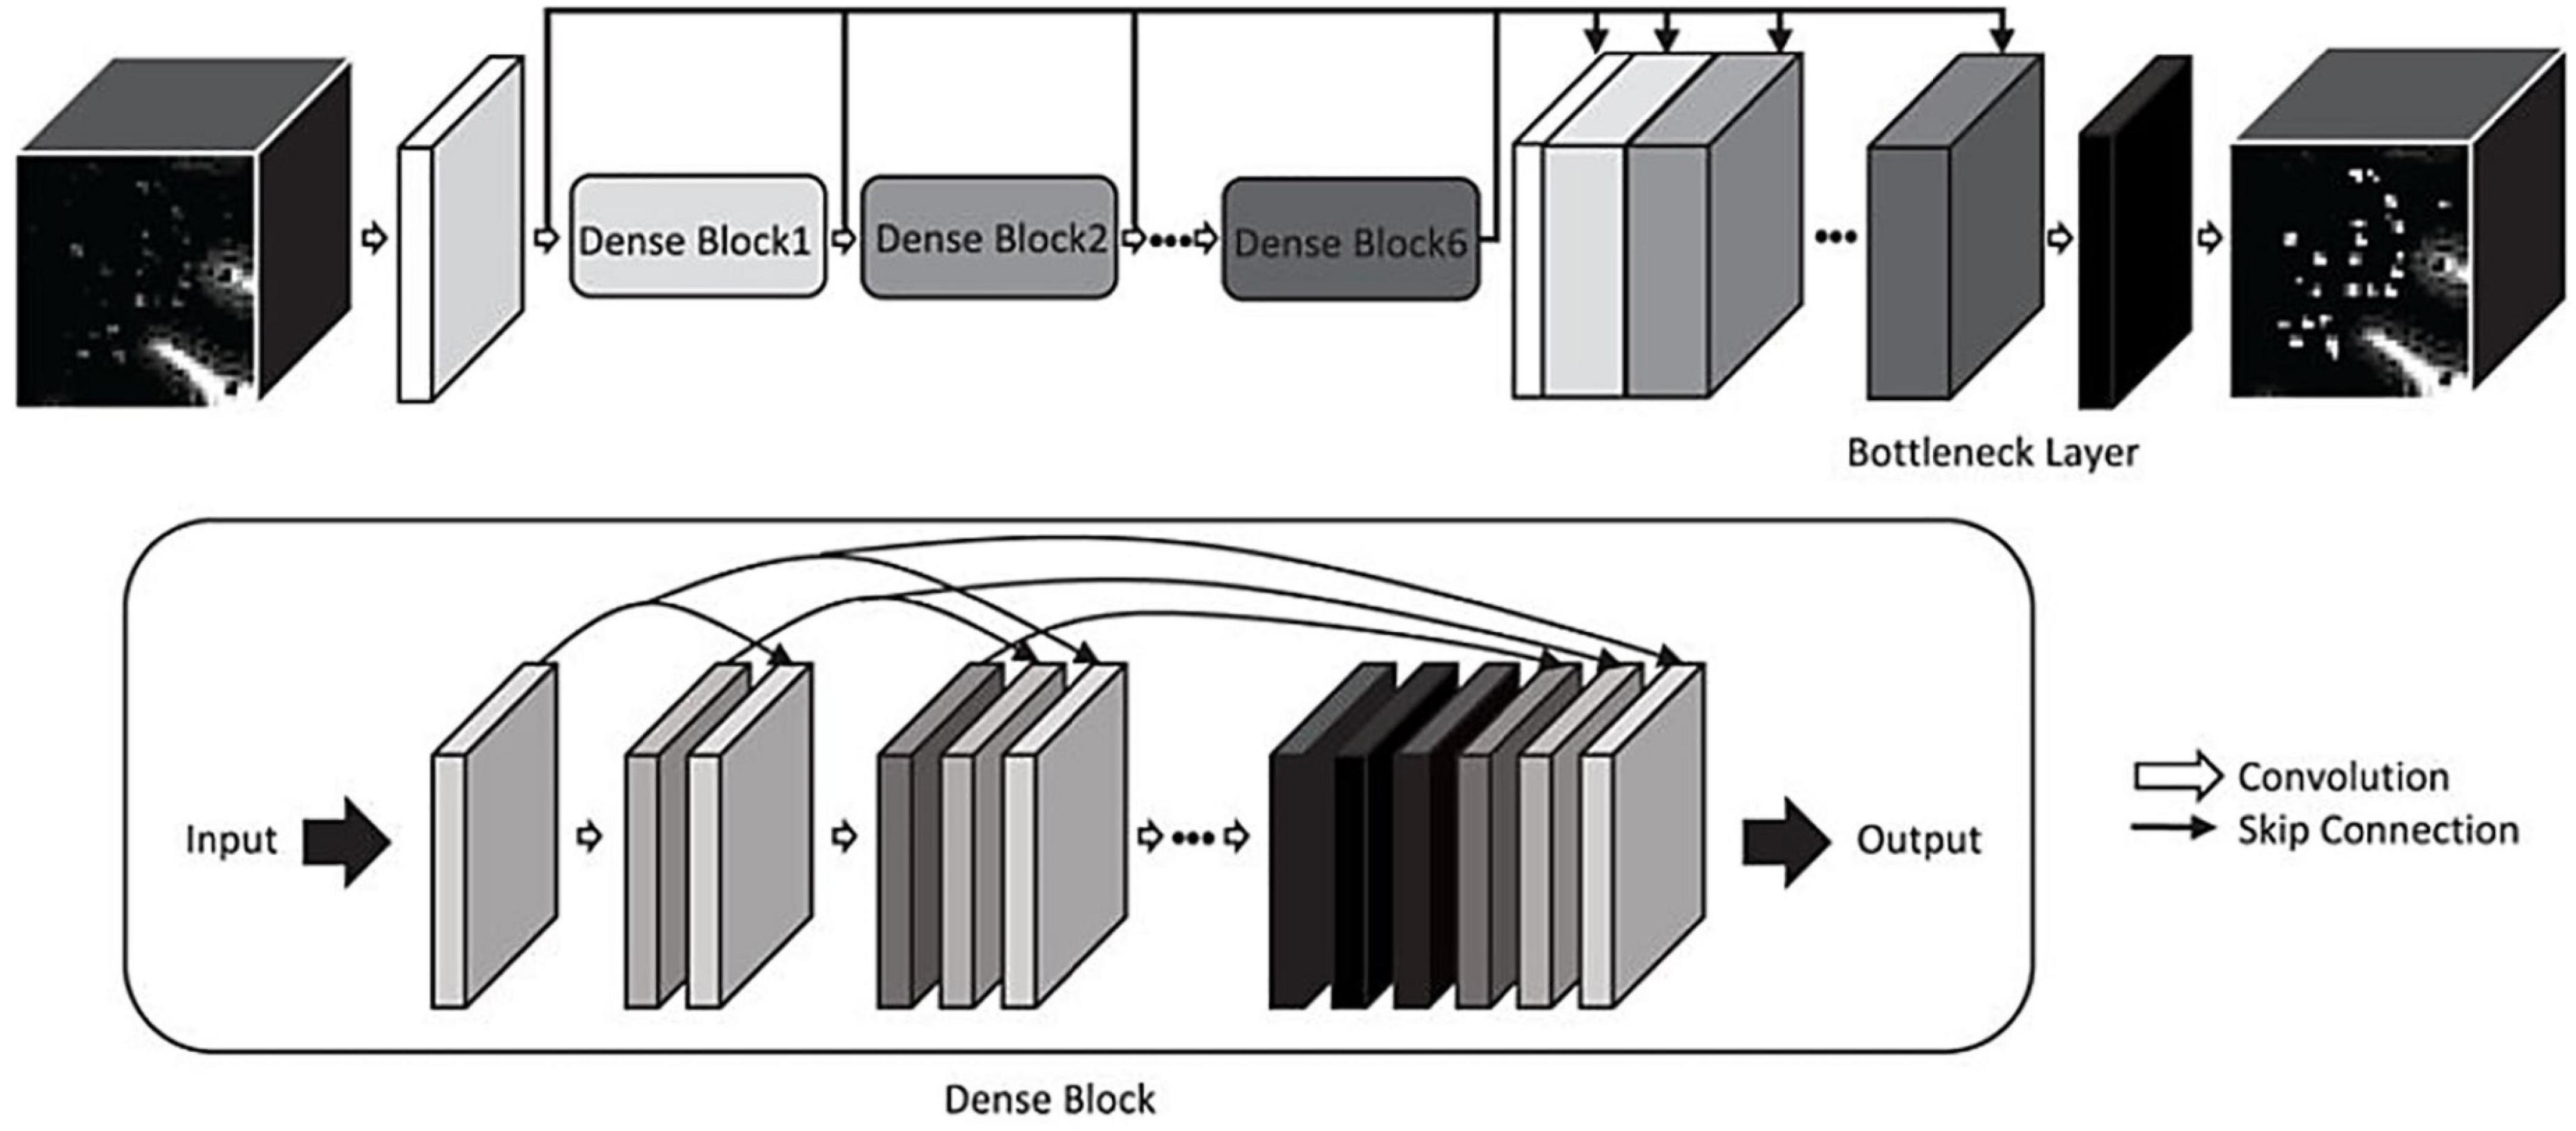
Figure 5. A convolutional neural network for enhancing PVS visibility in T2-weighted MRI images (Jung et al., 2019). © IEEE 2019.
Automated segmentation of perivascular spaces
Perivascular spaces are small structures that occur repeatedly throughout the brain. The average volume of a single MRI-visible perivascular space is less than 5 mm3, whilst the total PVS volume in a young and healthy individual can average 5,000 mm3 (Zong et al., 2016; Barisano et al., 2021b). With a resolution of 1 mm3 isotropic (each voxel is 1 mm in length, width, and height), this would require manual labeling of 5,000 voxels to complete PVS segmentation in the average subject. Thus, manual delineation of 3D PVS is laborious and time-consuming. Despite this, the manual segmentation of perivascular spaces is a worthy endeavor for which multiple research groups have dedicated time and resources, in order to develop high quality algorithms (Park et al., 2016; Zong et al., 2016; Zhang et al., 2017; Boespflug et al., 2018; Lian et al., 2018; Schwartz et al., 2019; Smith et al., 2020, Preprint; Sepehrband et al., 2021; Lynch et al., 2022, Preprint). The goal of automatic segmentation algorithms is to label such structures, eliminating the need for manual labeling, thereby expediting detailed analyses of PVS.
Several studies have published automated methods for segmenting perivascular spaces (Table 1; Ramirez et al., 2016; Ballerini et al., 2017; Dubost et al., 2017; Lian et al., 2018). Broadly, these algorithms can be categorized as either (1) classical image processing techniques or (2) machine learning (ML) algorithms. Both have been applied with varying levels of success.
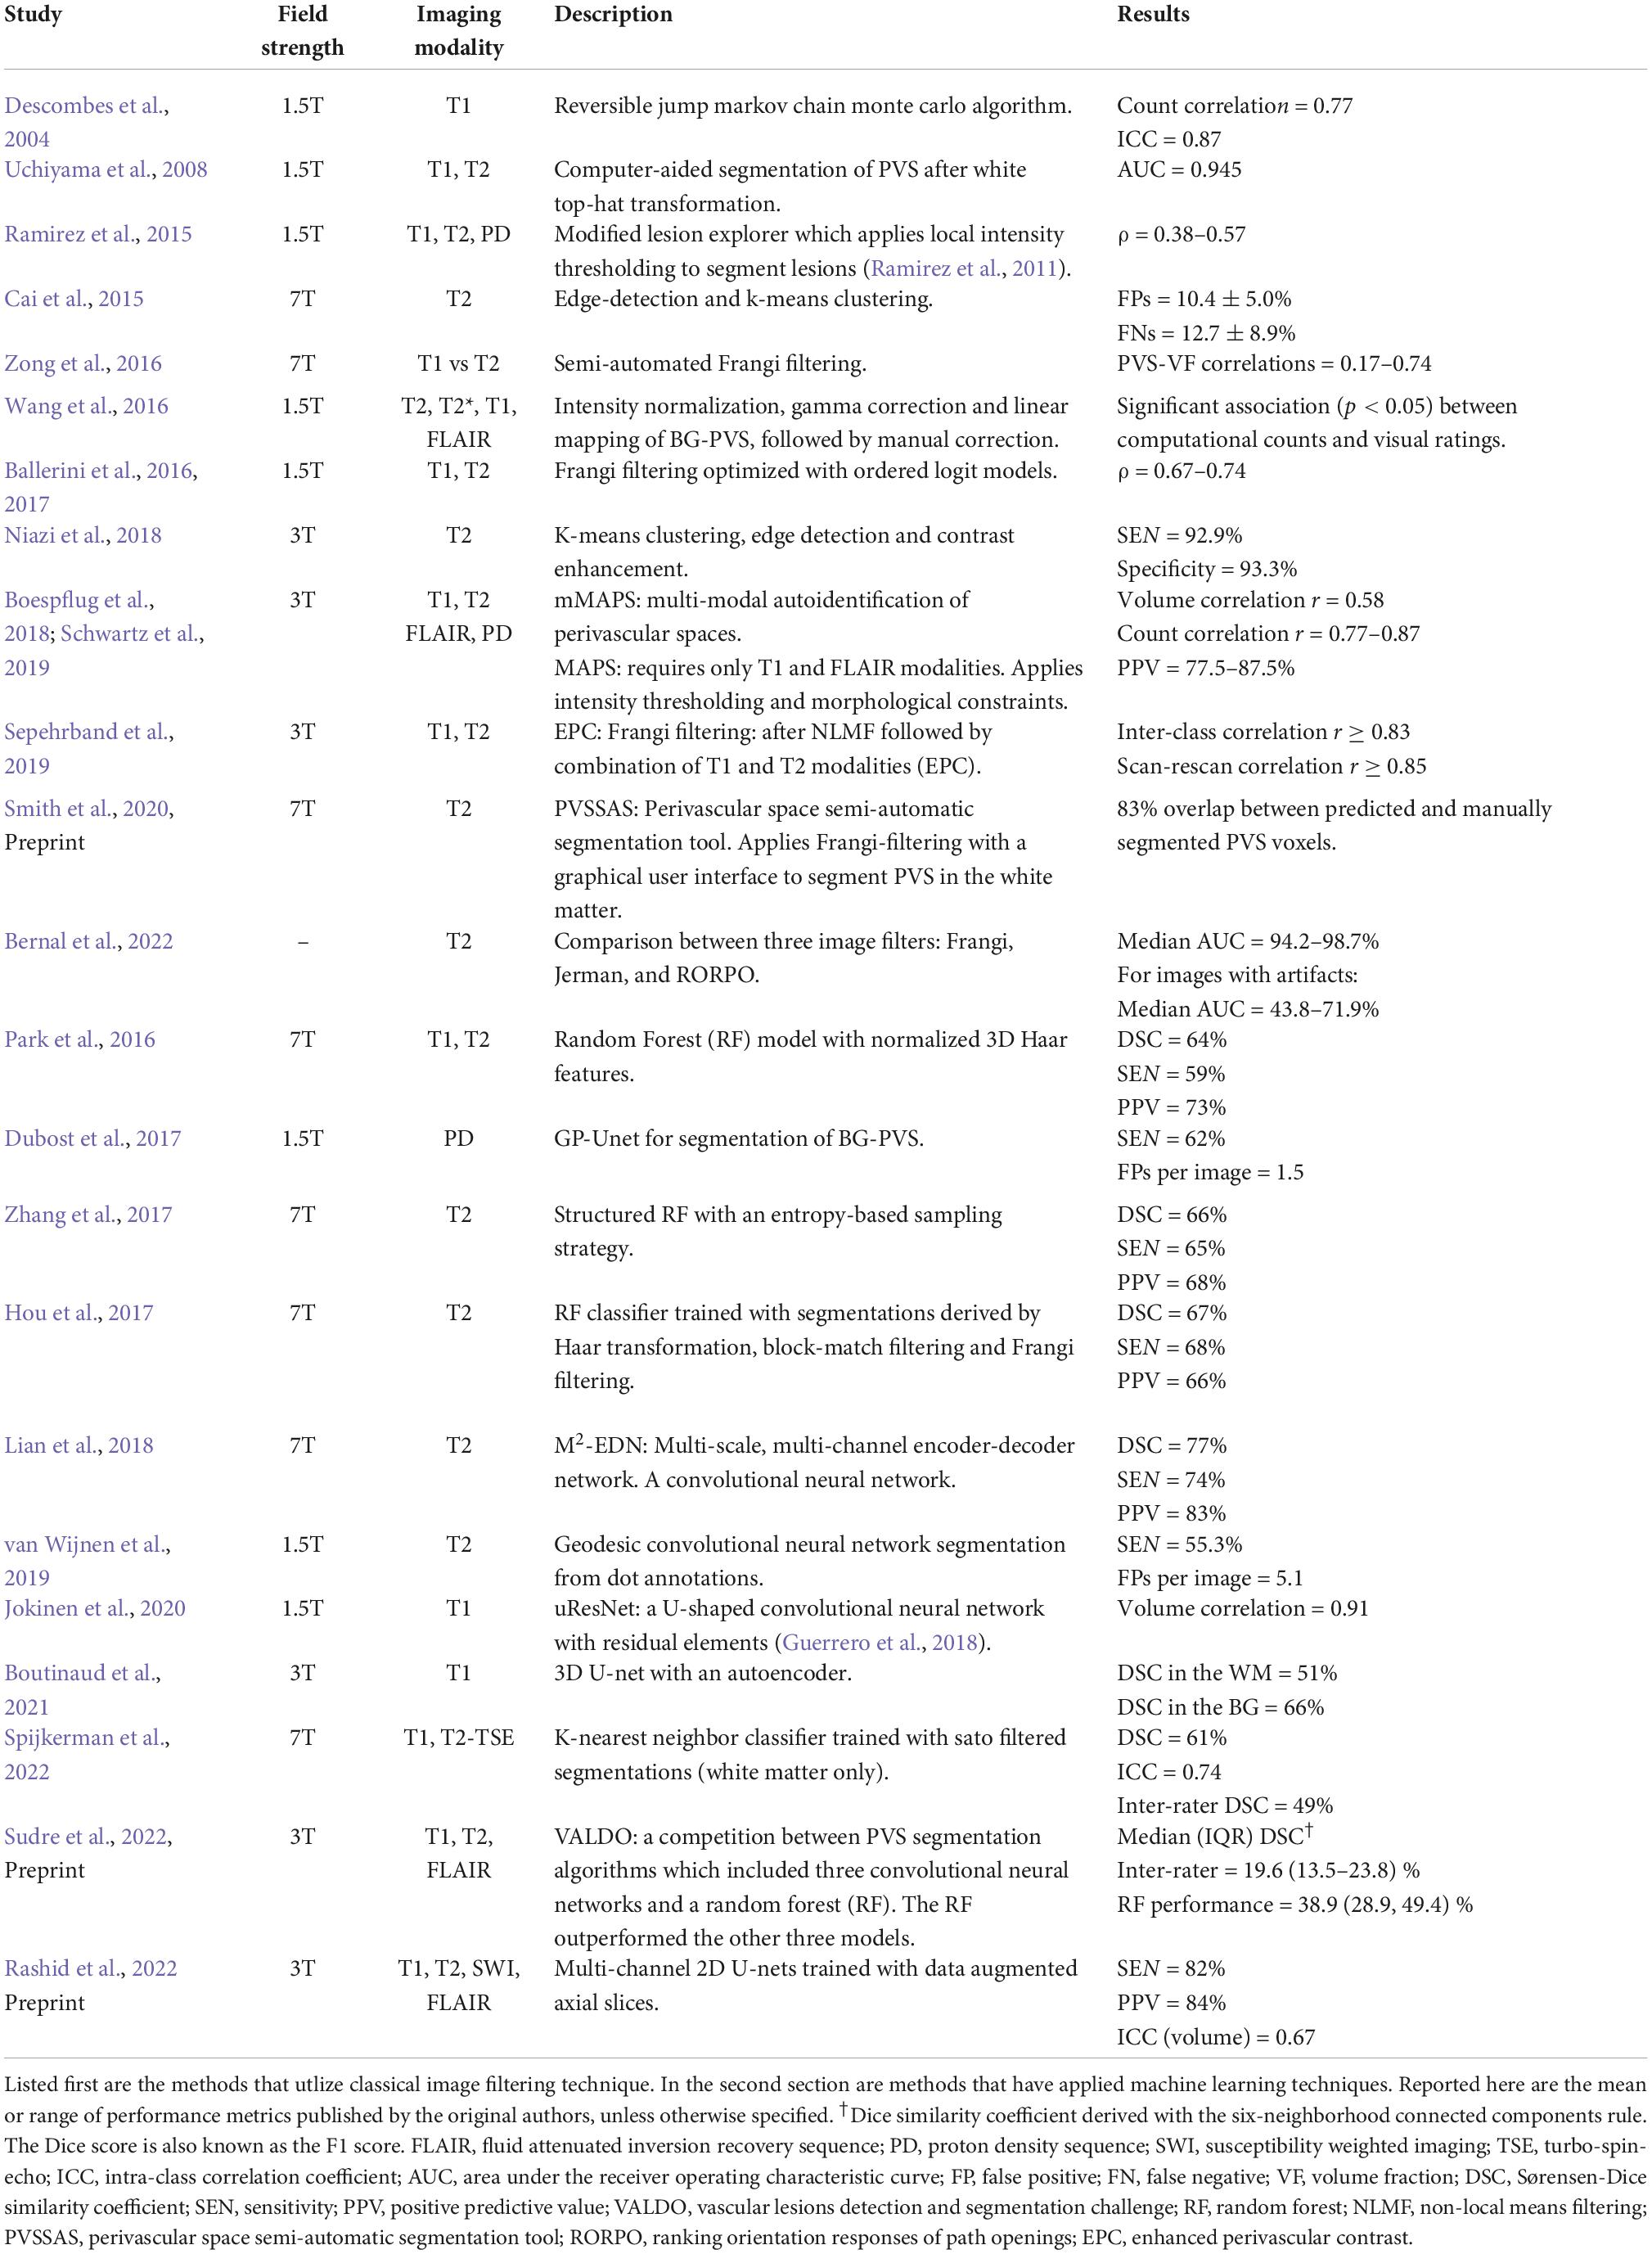
Table 1. Summary of PVS segmentation methods and their results.
In the classical approaches, a computerized pipeline with explicit parameters is set-up and optimized to search for PVS (Ballerini et al., 2016, 2017). For example, seed clusters selected based on intensity thresholds within the white matter can be filtered based on their size, linearity, length, and width (Figure 6; Boespflug et al., 2018). One disadvantage of these methods is that they often require further optimization for different datasets depending on the imaging protocols (Ballerini et al., 2016).
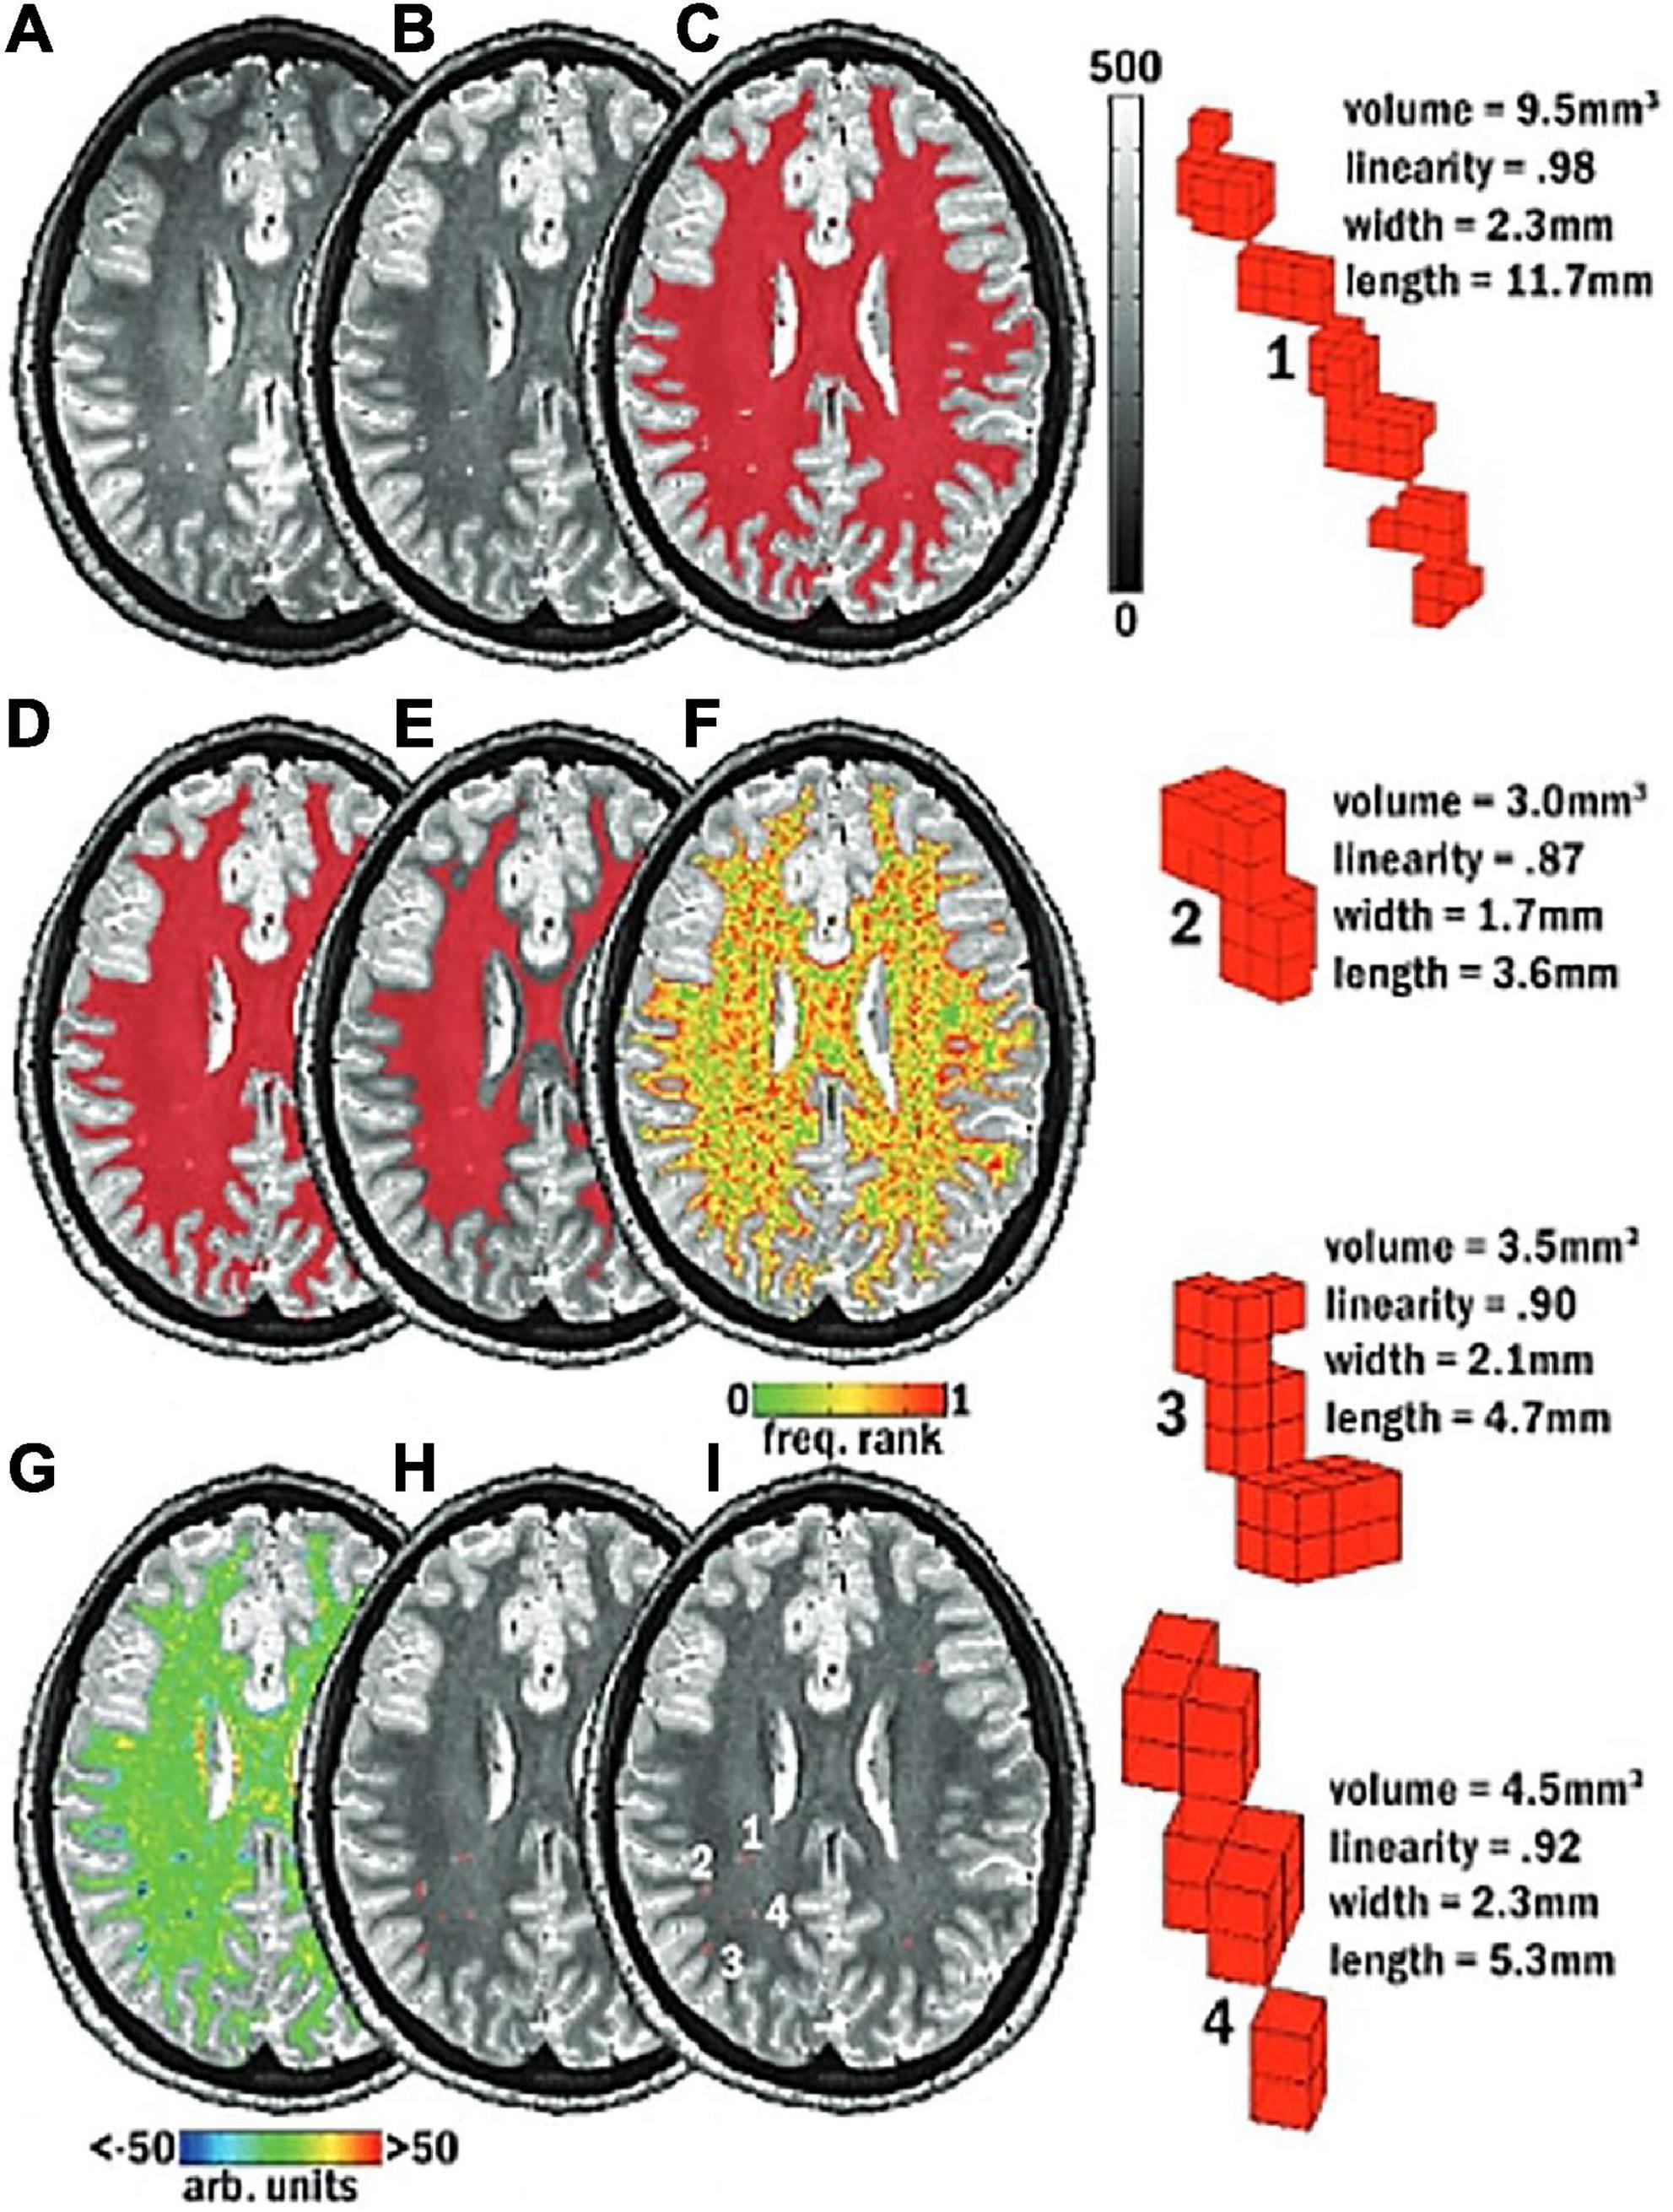
Figure 6. Schematic of the mMAPS (multi-modal auto-identification of perivascular spaces) pipeline for the automated segmentation of PVS adapted from Piantino et al. (2020). It relies on the sequential application of image filters, intensity thresholds, and morphological constraints to delineate PVS voxels. (A) A T2-weighted MRI image is acquired. (B) Voxel intensities are normalized. (C) White matter (WM) mask (red) applied. (D) Holes in the WM mask are filled. (E) Edges of the WM mask are eroded. (F) Frequency map of the voxel intensities. (G) Map of the local intensity differences. (H) Seed clusters resulting from the previous steps are extracted and filtered with morphological constraints. (I) The final segmentation map. Reproduced with permission of the American Society of Neuroradiology, from Piantino et al. (2020), conveyed through the Copyright Clearance Center, Inc.
In comparison, ML-based algorithms undergo training with example data to perform a certain task (Bengio, 2013). In PVS segmentation, the algorithm is trained with manually labeled images, over many iterations or epochs, to learn the features associated with PVS. After training, ML algorithms can be used to label PVS structures on new and unseen data. Although the initial stages are computationally expensive, the results are generally worthwhile as ML algorithms can learn complex features that cannot be defined via classical techniques (Bengio et al., 2012).
Evaluation of segmentation performance
In the evaluation of image segmentation algorithms, the true positives, false positives, and false negatives are tallied to compute three main metrics: the Sørensen–Dice coefficient or F1 score, the sensitivity or detection rate, and the positive predictive value (PPV) (Equation 1) (Dice, 1945; Lian et al., 2018; Jung et al., 2019; Siddique et al., 2021).
Equation 1. DSC, Sørensen–Dice similarity coefficient; SEN, sensitivity; PPV, positive predictive value; TP, true positives; TN, true negatives; FP, false positives; FN, false negatives.
The Dice score is a measure of overall segmentation performance (Dice, 1945). A higher Dice score means better overall performance. The sensitivity is the percentage of all PVS voxels that are detected by the algorithm. Whereas the PPV is the percentage of predicted voxels that were correctly labeled as PVS. These metrics assess different aspects of the algorithm’s ability to delineate perivascular spaces. Together, they are useful for gauging the tendencies of an algorithm’s segmentation ability. For example, higher sensitivity than PPV indicates the algorithm prioritizes detection over accuracy. Whereas higher PPV vs. sensitivity indicates the algorithm prefers accuracy or correctness over detection.
However, the Dice coefficient is not infallible. A common problem in medical image segmentation tasks, and especially PVS segmentation is that of noisy labels (Karimi et al., 2019). Due to a number of reasons such as poor image quality, rater fatigue or time constraints, the ground truth can encompass a number of false positives and false negatives that affects that Dice coefficient (Wardlaw et al., 2013; Moses et al., 2022). Thus, the sources of error that affects the Dice score are:
(1) Error in the ground truth (human labels).
(2) Error in the algorithm prediction.
The Dice score aims to measure the latter, but if the ground truth is not reliable, then its ability to do so is impaired, and resultant Dice scores are distorted. In the ideal scenario, the ground truth is perfect and therefore any decrement in the Dice score is purely due to algorithm error. However, to attain this perfect ground truth would require high inter and intra-rater agreement, and robust standards for PVS delineation. To a great extent this has been achieved with 2D rating scales, e.g., STRIVE and UNIVERSE, demonstrating high-concordance across research groups (Wardlaw et al., 2013; Adams et al., 2015). Currently, there is no guideline for the voxel-wise segmentation of perivascular spaces in either T1 or T2-weighted MRI data.
Variations of the Dice metric have been employed, such as the Dice score with 6-neighborhood connected components rule, wherein predicted PVS voxels are deemed true-positives if they are adjacent to a real PVS voxel (Sudre et al., 2022, Preprint). These do not address the inherent issue of noisy labels in PVS segmentation, rather they merely inflate the reported scores. Such modifications make it difficult for comparisons to be made to similar studies that have employed the traditional Dice metric (Equation 1). It also obfuscates the fact that PVS segmentation is a more difficult task compared to other medical imaging problems, where inter-rater Dice scores of 70%+ are commonplace, as opposed to PVS segmentation where inter-rater Dice scores are usually below 50% (Sudre et al., 2022, Preprint; Liu et al., 2022; Spijkerman et al., 2022). This is likely due to the nature of the task, as PVS are small, numerous and occur repeatedly throughout the brain, whilst other lesion detection tasks such as for tumors or stroke lesions require delineation of a single, large and prominent object. Thus, the Dice score is not a perfect metric, but it is the most rigorous one for the evaluation of algorithm performance in PVS segmentation.
To our knowledge, no study has directly addressed this problem of noisy labels in PVS segmentation. One review that has examined solutions to address noisy labels in medical images, suggest the use of semi-automatic annotations, wherein models are trained on incomplete data, then used to aid the human in the detection of undetected case (Karimi et al., 2019).
Several studies have employed semi-automated methods, e.g., with the Frangi filter, to efficiently generate PVS maps (Park et al., 2016; Sepehrband et al., 2021; Langan et al., 2022; Ranti et al., 2022). Subsequently, these masks can be compared to the raw predictions to derive Dice similarity coefficients, and thus measure model performance. The downside is that segmentation performance is likely to be overestimated, compared to Dice scores derived with independently generated manual segmentations.
Whilst the evaluation metrics may be biased, the practical benefit is that considerable amounts of time and resources are saved, since correction of automated segmentations may be less time-consuming than purely manual segmentations. Whether this advantage outweighs the disadvantage of a biased model evaluation should be up to the individual researcher. Interestingly, if a machine learning model is trained on a small subset of purely manual PVS labels, and subsequently used to generate a large sample of semi-automated segmentations, then the bias might be diminished, compared to semi-automated Frangi labels, since the model was originally trained on purely human labels.
Furthermore, visual comparisons between model predictions and the ground truth are often conducted (Figure 7). Certain weaknesses of the algorithm can then be uncovered, and the algorithm adjusted retrospectively. Visual inspection is important, since PVS can be easily confounded with other lesions or imaging artifacts including lacunes, white matter hyperintensities (WMH) and microbleeds (Figure 4; Wardlaw et al., 2013; Lian et al., 2018).
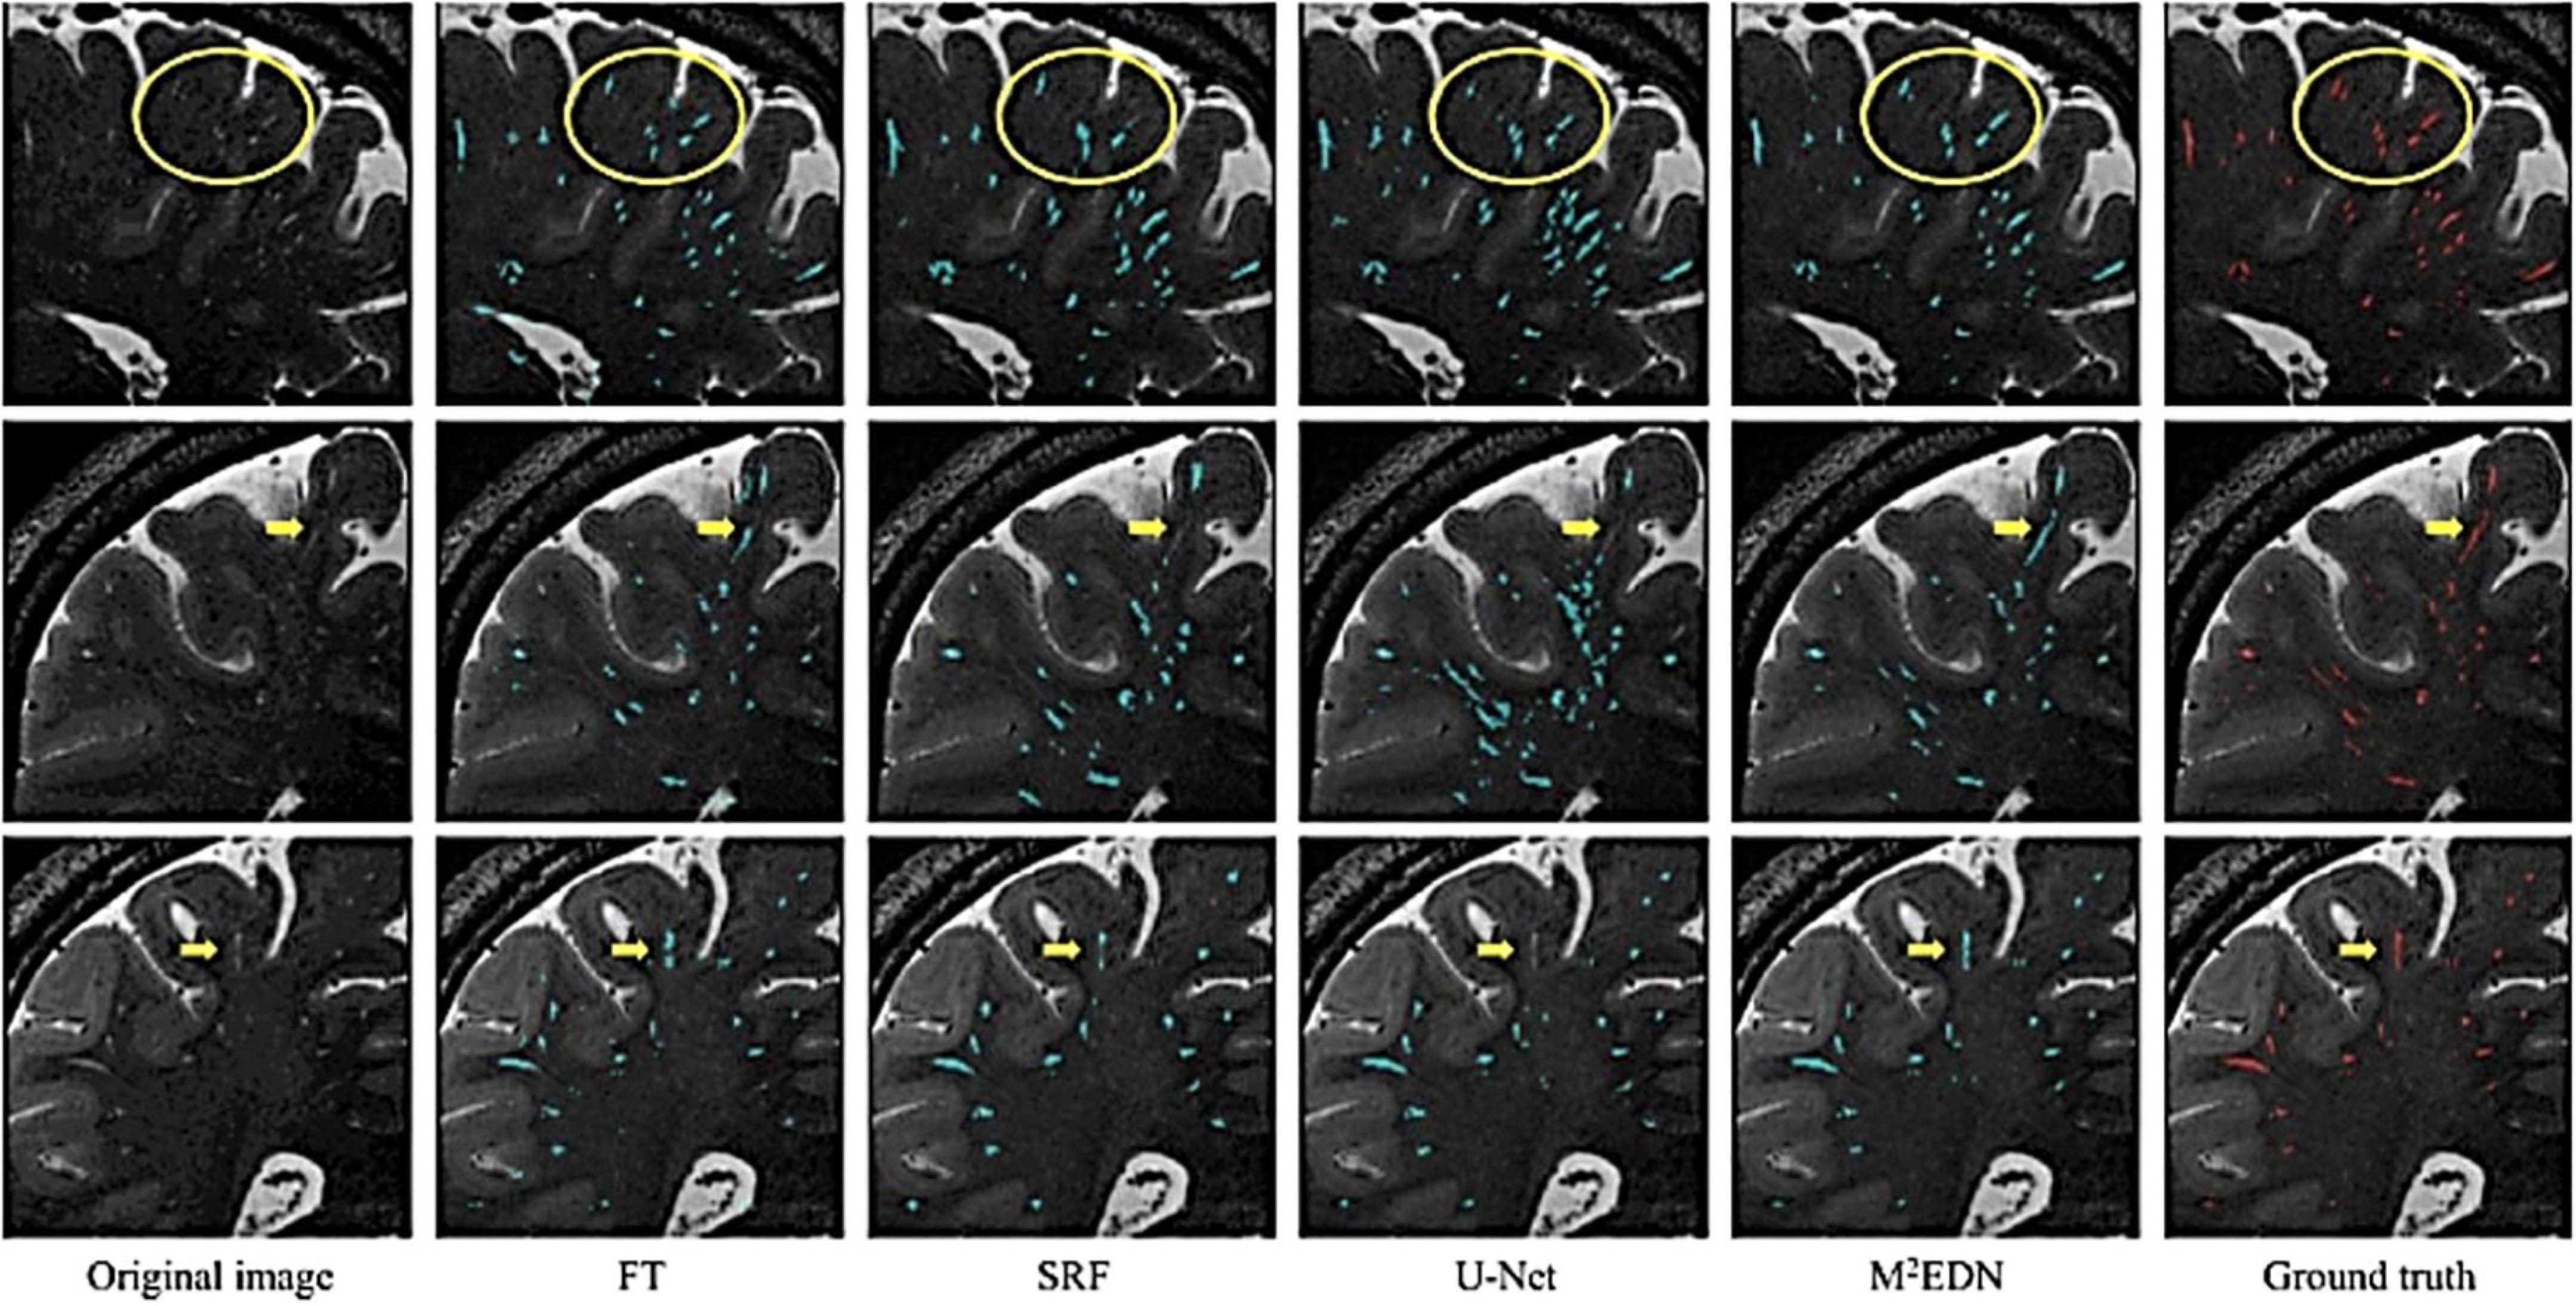
Figure 7. Visual assessment of predicted PVS segmentations from different algorithms to the ground truth, adapted from Lian et al. (2018). Visual comparisons are used to compare algorithms to each other and the ground truth. Red voxels are PVS that have been manually labeled by a human rater. Cyan voxels were predicted to be PVS by the respective automated method. Yellow arrows and circles indicate low contrast perivascular spaces that can be used to differentiate segmentation ability of different methods. FT, Frangi filtering; SRF, structured random forest; M2EDN, multi-channel, multi-scale encoder-decoder network. Reprinted from Lian et al. (2018), with permission from Elsevier, conveyed through the Copyright Clearance Center, Inc.
Another common method of validating segmentation performance is to compare quantitative measures of PVS produced from segmentations, such as total PVS volumes or counts, with conventional PVS ratings (Boespflug et al., 2018; Schwartz et al., 2019). A high correlation coefficient is expected and ensures newer algorithms are commensurate with established methods. Importantly, the aforementioned methods of assessing algorithm performance are not infallible and can be misleading when incorrectly applied. These will be further discussed in more detail alongside recommendations to avoid such problems.
Existing approaches
An example of a traditional approach to segmentation is the multimodal auto-identification of perivascular spaces (mMAPs) algorithm by Boespflug et al. (2018). This method determines the likelihood of a voxel being a PVS, based on its intensity on co-registered T1, T2, FLAIR (Fluid attenuated inversion recovery) and Proton density (PD) weighted images. Voxels exceeding a certain probability are grouped into clusters, which are then deemed to be PVS if they are sufficiently linear in shape. Their application demonstrated strong correlations to visual rating scores by experts (r > 0.65) (Boespflug et al., 2018). Importantly, mMAPS required four imaging modalities: T1, FLAIR, Proton Density, and T2 sequences.
Schwartz et al. (2019) adapted the mMAPS algorithm to segment perivascular spaces using only two imaging modalities (T1-weighted and FLAIR images) from the Alzheimer’s Disease Neuroimaging Initiative (ADNI) dataset (Jack et al., 2008; Boespflug et al., 2018; Schwartz et al., 2019). Both the correlation coefficient, comparing PVS volumes to visual PVS ratings (r > 0.7), and PPVs (77.5–87.5%) were high. Worth noting is that neither Dice coefficients nor sensitivity scores were published. PPV alone is an incomplete assessment of the algorithm. For example, if an algorithm correctly labeled 100 voxels in an image with 1000 PVS voxels, its PPV would be 100%, neglecting the remaining 900 voxels it missed resulting in a Dice coefficient of only 18%. Nevertheless, the application of mMAPS to commonly acquired T1-weighted images marks an important step towards automated PVS segmentation in clinical settings.
Another common approach utilizes image filters to highlight perivascular spaces. In this context, filters are operations that calculate the resemblance of voxels and its neighbors, to features of interest such as tubes or edges. For example, the Frangi filter calculates the “vesselness” of voxels after taking into account surrounding values in order to highlight vessel-like structures (Frangi et al., 1998; Ballerini et al., 2016).
One notable approach combined both T1 and T2 scans from a single subject to produce an image with enhanced perivascular contrast or EPC (Figure 8; Sepehrband et al., 2019). By dividing the T1 image by its co-registered T2-weighted counterpart, the contrast between tissue types is enhanced, and therefore PVS clusters more discernible from the white matter. Subsequently, optimized Frangi filtering was applied to automatically label PVS voxels (Frangi et al., 1998; Ballerini et al., 2016). With EPC, the PVS-to-white matter contrast was substantially greater than in either the T1 or T2 image alone, and the number of manually detected PVS was significantly increased (Sepehrband et al., 2019). However, compared to T1 or T2 alone, EPC did not significantly improve count correlations with expert evaluations (Sepehrband et al., 2019).
Figure 8. The enhanced perivascular contrast (EPC) pipeline proposed by Sepehrband et al. (2019). In EPC, a T1-weighted image is combined with a co-registered T2-weighted image to improve the visibility of PVS. (A) Subsequently, non-local means filtering is applied and PVS are automatically segmented by a Frangi filter. (B) Comparisons between Frangi filtered PVS from a lone T1 image (top), a lone T2 image (middle), and combined modalities in EPC (bottom). Segmented voxels are labeled in red. Reproduced under the Creative Commons Attribution 4.0 International License (https://creativecommons.org/licenses/by/4.0/).
Typically, Dice scores are used to compare the prediction of an algorithm to a ground truth that was generated independently, usually by manual human segmentation. However, in this study, the strong Dice scores reported (74–95%) were comparing the predicted PVS maps before and after manual correction (Sepehrband et al., 2021). Therefore, these scores are biased and should be expected to perform slightly worse when compared against independently produced segmentations.
Importantly, Sepehrband et al.’s (2021) reported Dice scores highlight how the metrics can be misleading. Dice scores of algorithm predictions before and after manual correction resulted in an average of 95% (Sepehrband et al., 2021). However, when the segmentations were further corrected aided by FLAIR images, this resulted in an average Dice score of 74%. FLAIR images are often used to differentiate PVS structures from confounds such as WMH and lacunes, thus are able to identify false positives (Wardlaw et al., 2013). Clearly, the quality of the segmentations has improved after FLAIR-accompanied corrections, yet the Dice metric has declined by more than 20% (Sepehrband et al., 2021). The implication here is that, without an accompanying FLAIR image the PVS measurements would have been inflated by false positives, via inclusion of WMHs mistaken as PVS. It also suggests Frangi filtering may not be suitable for investigating PVS in disease cohorts without the additional FLAIR modality (Frangi et al., 1998; Ballerini et al., 2016). Notably, the correction for FLAIR WMHs may have removed PVS that reside within the WMHs.
Machine learning approaches
Machine learning algorithms differ from classical methods in that they automatically learn the features of their target object, such as its shape, intensity, and location. The main ML models that have been applied to PVS segmentation are random forests and CNN.
The first instance of machine learning for automated segmentation of PVS, was done by Park et al. (2016) using a random forest model. With the help of a Frangi filter, 17 MRI images were manually segmented and used to train random forest models. Compared to models trained with intensity thresholded images or vessel-ness filtered images, the random forest performed best when trained on normalized Haar filters, enabling it to learn discriminative PVS features (Park et al., 2016). Dice scores for the optimal model averaged 64%. Sensitivity was lower at 59%, and PPV was 73%. Importantly, high-resolution MRI images, 7 Tesla (T), with both T1 and T2 modalities were used. The labels used to train the random forests were initiated using a Frangi filter, then refined manually, i.e., semi-automatically. As such the resultant random forests would likely be biased to detect voxels more strongly detected by the Frangi filter.
Similarly, Zhang et al. (2017) used a structured random forest to delineate PVS in 7T images. Here, three different filters based on vascularity were used to differentiate PVS from background voxels. This was supplemented with an entropy-based sampling strategy to select regions of interest from the image. Similar to Park et al. (2016), an average 66% Dice score, 65% sensitivity and 68% PPV was achieved (Zhang et al., 2017).
The first instance of automated PVS segmentation using a fully CNN was by Lian et al. (2018). Lian et al. (2018) applied a multi-scale and multi-channel CNN architecture for this task, named the M2EDN (Figure 9). The multi-scale feature enables the model to incorporate both small and large contextual details to improve PVS detection. Frangi filtering was also used as a secondary input channel, providing more information to the model, and lastly initial predictions from the network were used as a third channel of information to refine predictions in the With 7T, T2-weighted data achieved an average Dice score of 77% was achieved (sensitivity = 74%, PPV = 83%), superseding the previous machine learning approaches with similar data parameters (Lian et al., 2018).
Figure 9. The M2EDN neural network architecture proposed by Lian et al. (2018). M2EDN stands for multi-scale, multi-dimensional encoder-decoder network. The model features a Frangi filter segmentation as a second input channel. Conv, convolution; ReLU, rectified linear unit; Pool, max pooling. Reprinted from Lian et al. (2018), with permission from Elsevier, conveyed through the Copyright Clearance Center, Inc.
To extend this work, it is necessary to explore methods of automated segmentation with lower quality datasets that are more accessible than 7T images. Boutinaud et al. (2021) employed another CNN called the u-net with an autoencoder to segment 3T, T1 images (Boutinaud et al., 2021). Typically, model parameters are initialized randomly. However, an autoencoder enables meaningful initialization of model parameters to optimize the performance of the final model (Kingma and Welling, 2013). In this case, it is unclear whether the inclusion of an autoencoder improved performance. Trained on 40 manually labeled images, the model achieved a voxel-wise Dice score of 51% in the white matter and 66% in the basal ganglia. Notably, for PVS clusters larger than 10 mm3, Dice scores above 90% could be reliably achieved (Boutinaud et al., 2021).
The noticeable decrement in performance compared to previous ML approaches can be attributed to the lower image quality and resolution of the data (7T vs. 3T) (Lian et al., 2018). However, Wang et al. (2021) recently published a study applying Lian et al.’s (2018) CNN to 3T, T2-weighted data with a Dice score of 70%. A similar performance level was achieved when the same CNN was applied to T1-weighted images, suggesting that the multi-channel and multi-scale architecture is superior to a regular u-net with an autoencoder (Kingma and Welling, 2013; Huang et al., 2021). For an in-depth discussion of each of the techniques, please refer to previous work (Barisano et al., 2022a; Moses et al., 2022).
Limitations of automated segmentations
With the automated delineation of perivascular spaces, new ways of understanding the glymphatic system are possible. However, these studies are based on algorithms with certain disadvantages. The conventional methods relying on image processing techniques require further parameter optimization for different datasets (Ballerini et al., 2016; Smith et al., 2020, Preprint; Boutinaud et al., 2021; Bernal et al., 2022). Currently, only one fully automatic segmentation pipeline is freely available, making it difficult to replicate previous methods (Boutinaud et al., 2021). Most machine learning approaches were trained or tested with data from high field (7T) MRI scanners that are not commonly used clinically (Park et al., 2016; Zhang et al., 2017; Lian et al., 2018). Several algorithms require multiple imaging modalities (Boespflug et al., 2018; Sepehrband et al., 2021). However, the primary MRI sequences acquired are T1 or T2-weighted images, with FLAIR sequences less commonly acquired (Schwartz et al., 2019).
Currently, there is no gold standard for automated 3D PVS segmentation in either T1 or T2 data leading to highly heterogenous methodologies and results across research groups. The issue is further compounded by the different scanner protocols and processing methods being utilized. Factors affecting the SNR and contrast-to-noise (CNR) ratios of PVS, including field strength, signal weighting, or resolution will attenuate PVS detection (Zong et al., 2016). Therefore, PVS detection techniques applied to either T1, T2, or both, and for different image qualities, are yet to be adopted as the gold standard.
The ideal PVS auto-segmentation tool should meet the following criteria:
(1) Open source and freely available, alongside optimized parameters or trained weights for datasets of different image qualities. Publication of algorithms in code repositories such as Github enable external reproducibility.
(2) High performance in regards to voxel-wise evaluations including Dice coefficients, sensitivity and PPV metrics based on ground truth manual segmentations.
(3) Able to segment PVS throughout the brain, including the gray and white matter, basal ganglia, hippocampus, and brainstem.
(4) Robust to noise and able to differentiate PVS from structurally similar objects such WMH, lacunes, microbleeds, and imaging artifacts (Figure 4).
Recommendations for model development
To objectively adhere to the criteria, we make the following recommendations, which relate to establishing the validity, robustness and reproducibility of the model.
(1) Validate segmentation performance on multiple open access datasets.
(2) Benchmark against previously published and optimized algorithms.
(3) Evaluate against high quality manual segmentations.
(4) Publish PVS voxel counts and volumes, image quality metrics including CNR, field strength, and voxel size as descriptive variables.
(5) Report all relevant segmentation metrics: Dice scores, sensitivity and PPV.
(6) Evaluate algorithm robustness on a noisy dataset, including images with MRI artifacts, and PVS mimics, e.g., lacunes, microbleeds, and WMHs (Wardlaw et al., 2013).
(7) Publish visual examples of algorithm predictions with 3D renders and 2D slices, displaying PVS both cross-sectionally and lengthwise. Examples should be either the default contrast that was input into the algorithm or contrast adjusted to improve the visibility of PVS.
Points 1–2 relate to establishing the reproducibility and benchmarking of the algorithm. Validation of algorithm should be completed on multiple open access datasets of inhomogeneous image qualities. Segmentation of PVS can be conducted in tools such as ITKSnap, Freeview, or Osiris (Yushkevich et al., 2006; Fischl, 2012; Othman et al., 2016). Publication of manual segmentations and predictions on open access datasets would contribute significantly towards progress in PVS research. Moreover, publishing source codes and pipelines would enable fair comparisons and benchmarking of PVS detection methods, allowing for direct comparisons between approaches. In this regard, ML approaches with trained weights should be compared to fully optimized versions of traditional methods, e.g., the Frangi filter, for a fair comparison.
Points 3–5 relate to validating the performance of the algorithm. Currently, as there is no consensus for automated methods of PVS segmentation. The gold standard of manual segmentation should be used as a benchmark for judging algorithm performance. Semi-automated methods of model validation may result in inflated and biased Dice scores (Sepehrband et al., 2021; Langan et al., 2022; Ranti et al., 2022). Another reason for inflated Dice scores may be the under-labeling of PVS, which lowers number of PVS that the algorithm is required to detect. This can be observed by lower-than-expected average counts of PVS voxels and volumes. In the same way a study publishes the sample size, and the percentage of subjects that developed a disease, publishing counts of PVS voxels in the ground truth would make the resulting Dice scores more meaningful. An algorithm that performs well on images with a small number of PVS may not perform as well for MRI scans with greater volumes of PVS.
Noisy labels are inherent in neuroimaging segmentations. Many factors can cause PVS voxels to go undetected by manual raters, including experience, time constraints, image quality and contrast, and the inclusion/exclusion criteria. Therefore, an experienced neuroradiologist should validate the integrity of ground truth segmentations. A detailed guide for detecting PVS in T2 MRI images has been published by Potter et al. (2015c). As this guide primarily focuses on T2-weighted axial slices for the purpose of assigning PVS enlargement scores according to a rating scale, we make further recommendations to aid segmenters in producing high-quality 3D PVS segmentations:
(1) All voxels within a cluster should be labeled such that no hypointense or hyperintense voxels connected to that cluster remain visible, in T1 or T2-weighted images, respectively.
(2) Where there are cerebral blood vessels there are PVS, including the white matter, gray matter, basal ganglia, hippocampus, and brainstem (Figure 10).
Figure 10. 3D PVS segmentation from a T1-weighted MRI scan. PVS voxels are labeled in red (top row), and the corresponding unlabeled slices are in the bottom row. Basal ganglia PVS are visible in the axial (left), sagittal (middle), and coronal (right) slices.
(3) In the white matter, PVS are generally directed towards the ventricles (Figure 10).
(4) In the basal ganglia, PVS following the lenticulostriate arteries are most obvious in the sagittal views, appearing to travel superiorly with an anterior curvature (Figure 10).
(5) To distinguish PVS from WMHs, where available, FLAIR images should be used (Wardlaw et al., 2013). WMHs are visible on all three sequences: T1 (as hypointense), T2, and FLAIR. On FLAIR sequences, the PVS are not visible but WMHs are.
Given their numerosity and at times inconspicuous appearance of PVS in MRI, inexperienced raters may find it difficult to detect and label PVS clusters in their entirety (Wardlaw et al., 2013). PVS clusters should be labeled when there is sufficient evidence based on features such as voxel intensity, cluster size (e.g., >4 voxels), directionality, and brain region. Additionally, segmentation software such as ITKSnap allow for manual contrast adjustments (Yushkevich et al., 2006). Contrast adjustment can be very useful, as varying contrast or brightness levels may be required for different regions of the image, e.g., due to bias field inhomogeneities. To improve PVS visibility in one region of the image may require brightening, whereas other regions may require darkening.
The visibility of PVS is strongly associated with image quality. The field strength of the MRI scanner has been shown to significantly affect PVS detection (Barisano et al., 2021a). However, this does not take into account preprocessing methods where images are enhanced to increase PVS visibility. For example, by combining 3T T1 and T2 images in the EPC pipeline, it is likely that the CNR for PVS are greater than 7T data without preprocessing (Sepehrband et al., 2019). Ultimately, CNR is the most direct and comparable metric of PVS visibility for a given dataset, considering variables including scanner field strength, and preprocessing methods. Publication of SNR and CNR values are useful for determining whether appropriate comparisons between studies with different datasets can be made, since models developed on data of lower SNR may not be applicable to higher SNR datasets. This will be further discussed in section “Recommendations for future research and clinical applications.”
Equations 2. SNR, signal-to-noise ratio; CNR, contrast-to-noise ratio; MEANGM, mean gray matter intensity; SDAIR, standard deviation of the intensity or empty voxels outside the head; MEANWM, mean of the white matter intensity. These metrics should be calculated with respect to PVS voxels and within the bounds of the 3D brain extracted volume. These equations apply for T1-weighted images. For T2-weighted images, the MEANWM and MEANPVS are interchanged.
Alternative methods of assessing segmentation performance include PVS count correlations or interclass concordance correlations. These are convenient assessments of reliability and accuracy of PVS cluster quantification, but not voxel-wise segmentation performance, and therefore voxel-based volumetric assessments of PVS. One critique of the Frangi filter is that its performance deteriorates as the size of a PVS cluster increases (Bernal et al., 2022). The implication for PVS research is that PVS counts, rather than volumes, are more likely to demonstrate statistical differences. Thus, count correlations for validation of segmentation performance do not convincingly demonstrate high PVS detection at a voxel-level, and Dice metrics should be preferred.
Findings from related fields of neuroimaging and lesion detection can offer useful insights applicable to PVS segmentation. In MRI lesion segmentation of patients with multiple sclerosis, inter-rater dice scores (between two human raters) around 60% are typical (Egger et al., 2017). For these tasks, there are a small number of large lesions to be detected in a single brain scan. In comparison, PVS occur repeatedly and throughout the brain, numbering in the hundreds. Given that PVS are more numerous and diffuse, one would expect that inter-rater dice scores for the task of PVS segmentation to be much lower. Two publications have assessed inter-rater agreement in PVS segmentation, with median or average inter-rater Dice scores of 26.7 and 49% (Spijkerman et al., 2022) implying that segmentation algorithms exceeding this 50% Dice threshold has superseded human performance (Spijkerman et al., 2022). Necessarily, visual inspections should be conducted to verify that the model outperforms the human labels. Broadly, the algorithm should be critiqued based on its ability to consistently detect all PVS clusters labeled by the human, and whether it can reliably label all PVS voxels belonging to each cluster. In the ideal scenario, where the human segmentation is free of error and imperfection, a Dice score of 100% would indicate a perfect prediction. In practice, the segmentation of medical images often includes noisy labels, i.e., false positives and false negatives, thus such Dice scores are not realistic.
If a model has genuinely outperformed manual segmentations, then presumably it has labeled not only all PVS detected by the rater, but also PVS that evaded human detection. In this case, a high Dice score should be observed alongside a very high sensitivity score and a lower PPV, as the model is presumably detecting more PVS clusters than were labeled manually. This may indeed be the case for Sepehrband et al.’s (2021) approach with non-local means filtering and the Frangi filter (Dice = 74%, Sensitivity = 98%, PPV = 61%) (Figure 8). Thus, all three metrics serve complementary roles to assess model predictions. Furthermore, recording Dice scores for different regions ensures the model performs adequately throughout the brain white matter, basal ganglia, midbrain, and hippocampus. Performance in one region might not be indicative of performance in another region as the appearance and anatomy of PVS in the white matter differ substantially from PVS in the BG (Figure 10). Not only are these regions different structurally, but the morphology of PVS may differ between regions. For example, PVS inferior to the putamen tend to be larger in width and volume, then those that are above the level of the putamen (Pullicino et al., 1995; Wardlaw et al., 2013; Bouvy et al., 2014).
Moreover, testing the robustness of the algorithm in noisy data with image artifacts and PVS confounds will be useful. This is especially important when the algorithm is to be applied in disease cohorts, where such lesions and PVS mimics are commonly observed. If algorithms are to be useful in characterizing PVS in disease, they need to be validated in similar data. Almost all algorithms published were developed based on “clean” images without PVS mimics that commonly occur in patients of neurodegenerative diseases. To our knowledge, only Sepehrband et al. (2021) has evaluated the effect of WMH presence on the Frangi filter. Co-registered FLAIR scans were used to manually correct PVS masks generated by the Frangi filter, and found a substantial decrement of 21% in the Dice metric (Sepehrband et al., 2021). Thus, if findings in pathological cohorts derived from these algorithms are to be trusted, they need to be validated against noisy and pathological data.
Key biological findings from perivascular spaces segmentations
Over the course of the lifespan changes in gray matter, white matter, and ventricular volumes are numerous and have been well documented (Bethlehem et al., 2022). The growth trajectory of perivascular spaces, visible in MRI, has not been as comprehensively characterized, but insights can be gleaned from multiple studies (Table 2).
Table 2. Summary of the PVS research that has resulted from 3D segmentations.
In adolescence (12–21 years old), PVS appear to be bilaterally symmetric, and tend to visible more often in the frontal and parietal lobes compared to the temporal and occipital lobes (Piantino et al., 2020). Male adolescents (mean PVS count = 98.4) also had significantly greater WM-PVS counts than females (mean PVS count = 70.7) (Piantino et al., 2020). Thus, a spatial distribution of PVS enlargement, and sex differences arise early on. The biological mechanisms behind these observations, and whether this spatial distribution is constant or changes with age is unclear.
In young adults (21–37 years old), the mean diameter of PVS in the frontal, parietal-occipital, temporal lobes and subcortical nuclei (basal ganglia and thalamus) were significantly different, with those in the subcortical nuclei, wider than the three WM regions (Zong et al., 2016). Of these four regions, the parietal-occipital lobe exhibited the highest PVS volume fraction, and the temporal lobe, exhibited the lowest volume fractions. Moreover, heatmaps of the spatial distribution of PVS location, length, and tortuosity have been generated (n = 50, age range = 27–78 years old) (Spijkerman et al., 2022). Table 3 summarizes the publications that have explored the quantitative and morphological attributes of PVS.
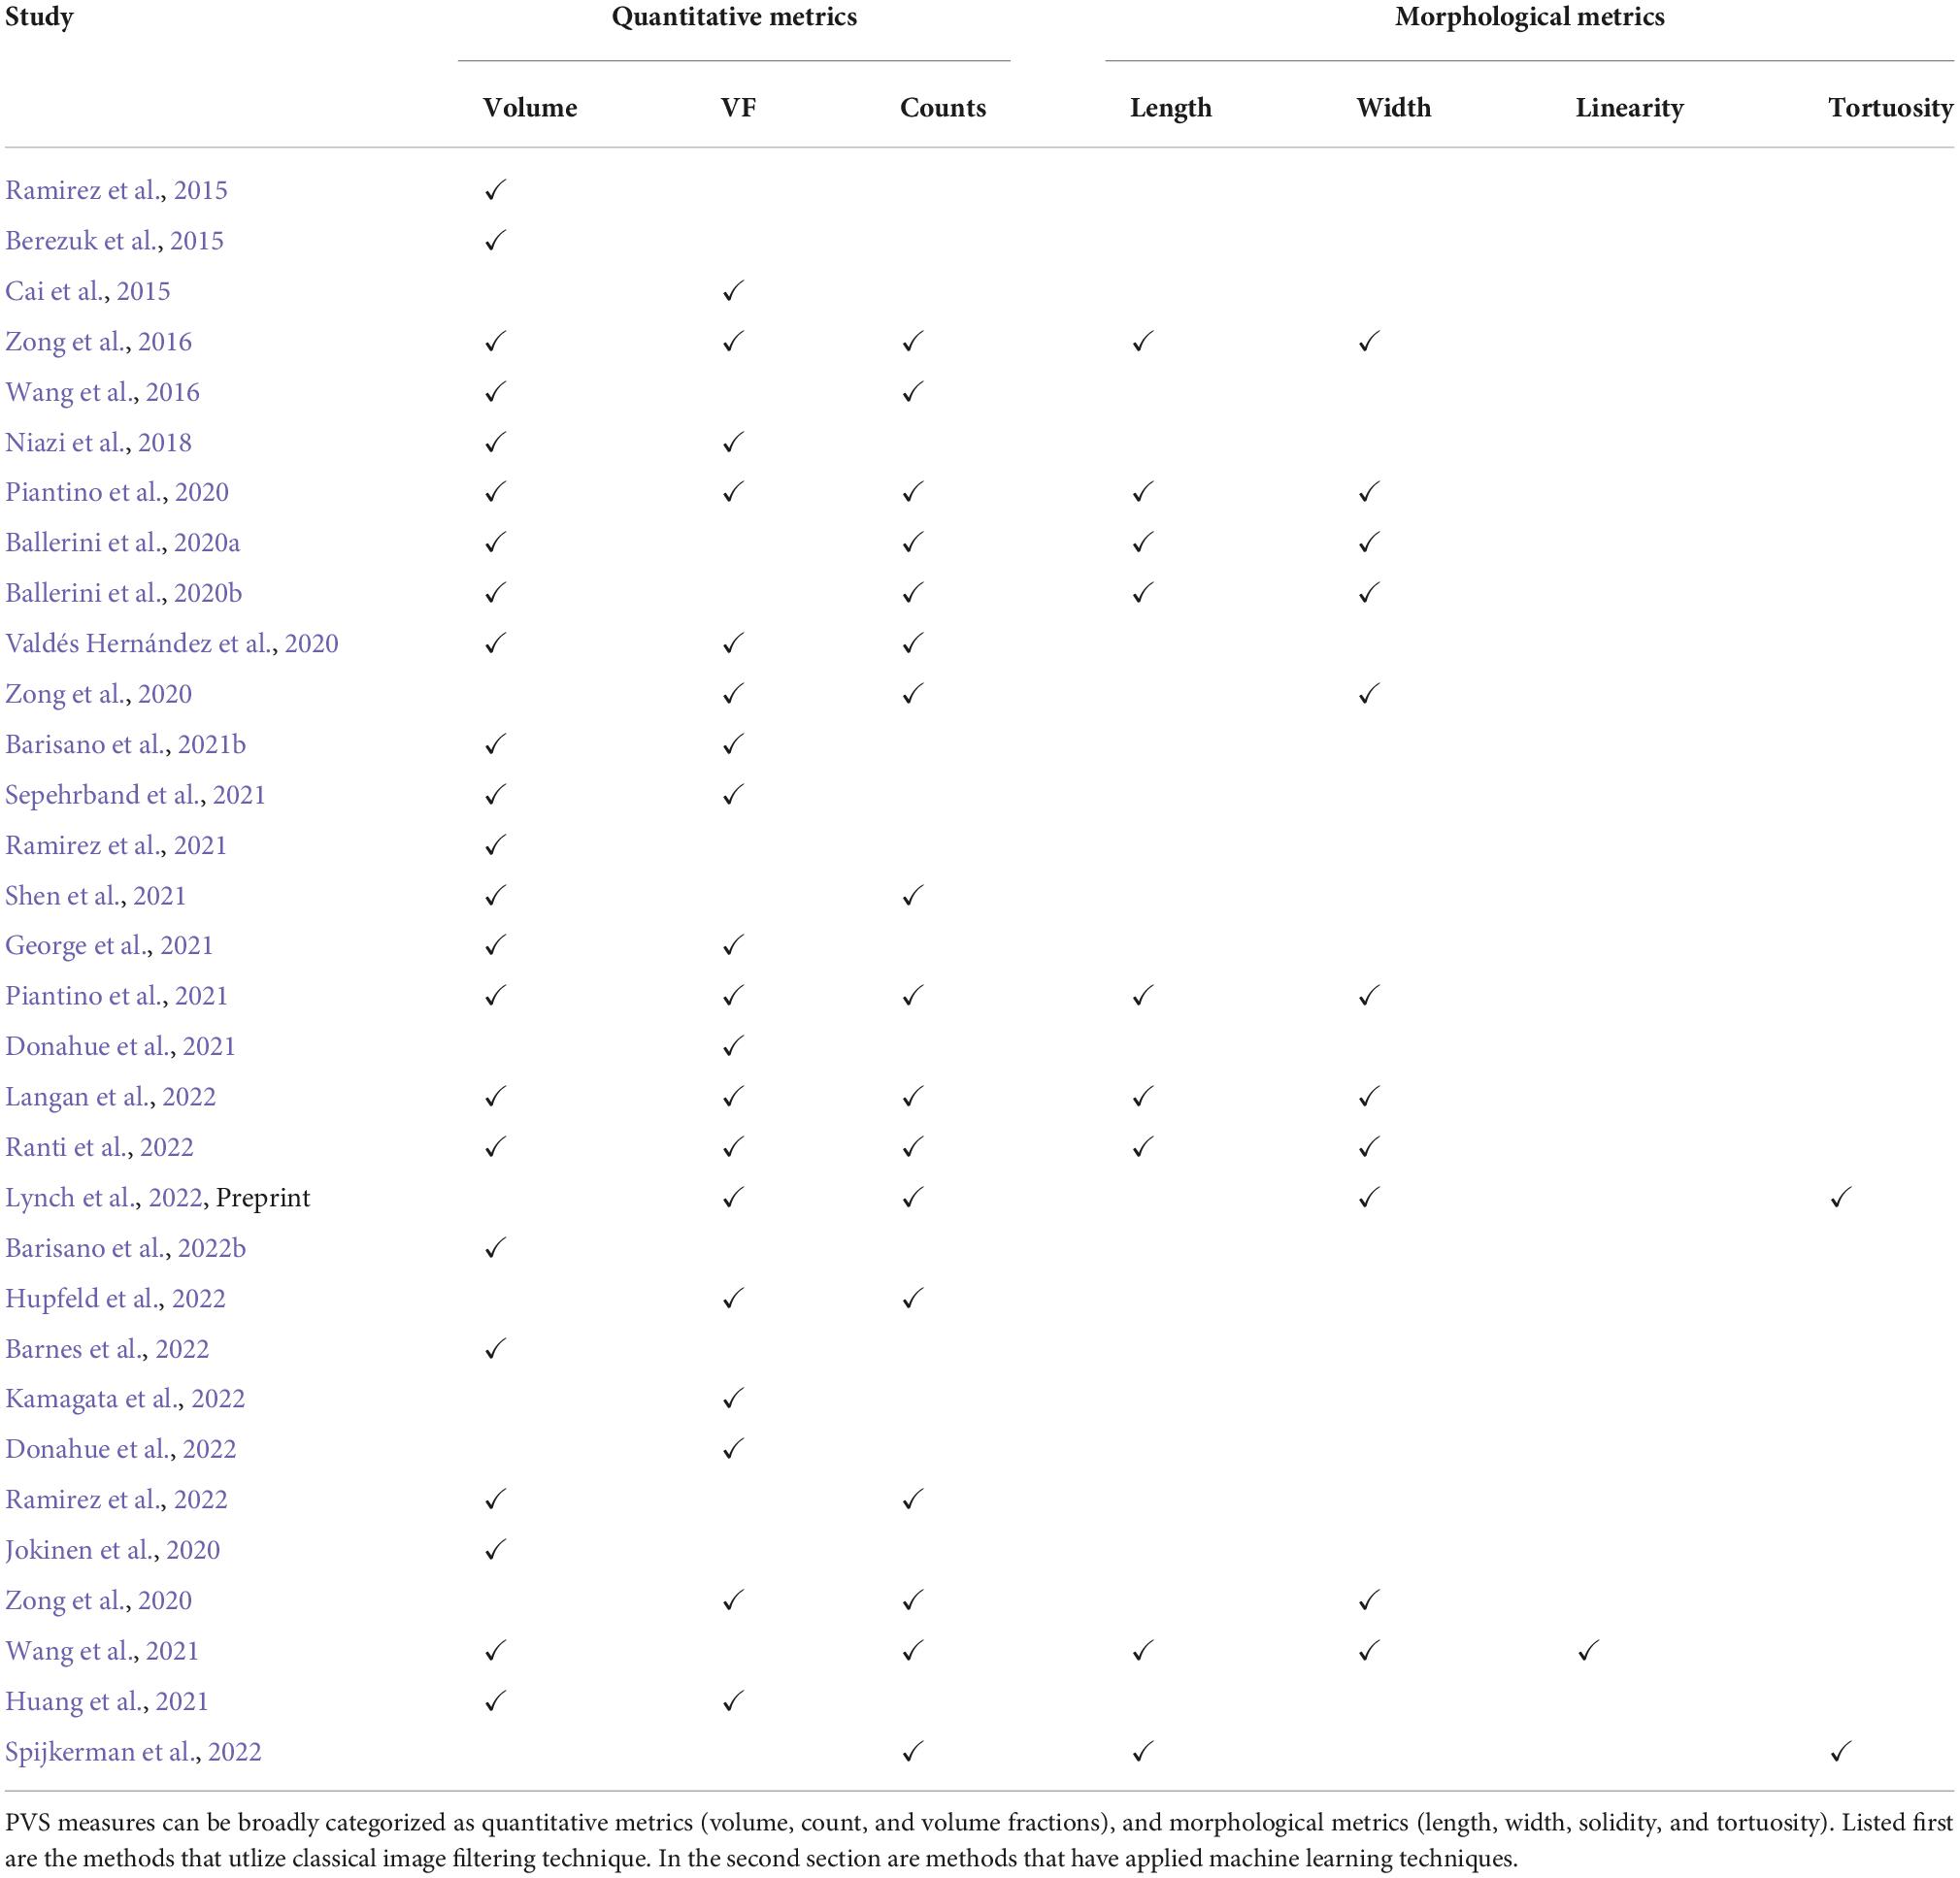
Table 3. Summary of the PVS metrics that have been investigated by previous publications.
In a cohort of healthy older adults (n = 160, mean age = 60.4 years old), both WM and BG-PVS have been associated with cerebral small vessel disease markers, such as WMHs (Wang et al., 2021). BG-PVS volumes, counts, and width, and WM-PVS counts were associated with hypertension (Wang et al., 2021). Moreover, greater WM-PVS sizes were associated with presence of diabetes. In this cohort, the median number of PVS clusters of 490 and 65, consisting of median PVS volumes of 2,371 and 166 mm3, was detected in the white matter and basal ganglia, respectively (Wang et al., 2021).
Frangi-detected WM-PVS in the Lothian Birth Cohort (LBC1936, n = 533, mean age = 72.6 years old), found that mean PVS size (volume per cluster), length and width, as opposed to counts, to be associated with WMH (Ballerini et al., 2020a). PVS size and widths were also associated with hypertension and risk of stroke (Ballerini et al., 2020a). Notably, no relationship between PVS measures with diabetes, hypercholesterolemia or presence of cardiovascular disease was found (Ballerini et al., 2020a). Moreover, PVS volume, widths, and sizes were negatively correlated with retinal markers of microvascular health, such as the fractal dimension (a measure of vascular branching) and vessel diameter of arterioles and venules in the left eye (Ballerini et al., 2020b). Consistent with this result, WM-PVS volumes were found to be negatively correlated with intracranial artery diameter in a healthy cohort of old adults (n = 103, mean age = 59.5 years old) (Huang et al., 2021).
In the same cohort of community-dwelling individuals (LBC1936), the spatial proximity of WMHs with PVS was evaluated longitudinally (n = 29, mean age = 71.9 years old), with images collected over three sessions at 3-year intervals (Barnes et al., 2022). WMHs appeared to be adjacent to or co-localized with PVS, however, statistical analyses revealed no significant associations (Barnes et al., 2022).
A cross-sectional examination of the normative PVS traits across the human lifespan, has been conducted in the Human Connectome Lifespan Project (Lynch et al., 2022, Preprint). PVS were detected via EPC and Frangi filtering. PVS volume fraction, counts, and morphological measures such as diameter and solidity were found to be highly variable across all ages (Lynch et al., 2022, Preprint). Greater PVS burden in childhood was predictive of PVS expansion across the lifespan, especially in the temporal lobes, but was inversely correlated with growth in the limbic regions (Lynch et al., 2022, Preprint). WM-PVS volume fractions appeared to increase linearly across all ages, whereas PVS counts increased linearly until approximately the age of 50 years, whereby the number of detected PVS clusters decreased (Lynch et al., 2022, Preprint).
The findings are major contributions that provide reference ranges for comparison to pathological PVS changes. However, given that EPC vastly improves the detection of PVS in MRI, these ranges need to be adjusted to reflect the lower detection rate of image qualities typical in research or clinic (Sepehrband et al., 2019). Thus, the reported ranges are currently only applicable to similar datasets where the EPC pipeline has been used.
The study of perivascular spaces can be confounded by a number of variables. For example, age, hypertension and BMI are correlated with PVS measures (Francis et al., 2019; Barisano et al., 2021b). PVS volumes are also strongly related with intracranial volumes (ICV) (Ramirez et al., 2021). Generally, this is accounted for by modeling the PVS volume as a fraction of ICV or white matter volume (WM-PVS VF) (Piantino et al., 2020; Valdés Hernández et al., 2020; Sepehrband et al., 2021).
To complicate the issue, PVS volume has been shown to change throughout the day, being smallest in the morning and increasing throughout the day in a young and healthy cohort (n = 897, mean age = 28.8 years) from the Human Connectome Project (Barisano et al., 2021b). This suggests PVS enlargement is a physiological mechanism that is responsive to the needs of the neuronal environment throughout the day. This finding confounds the notion that perivascular spaces are enlarged in response to pathology (Kwee and Kwee, 2007). This leads to a complication for the imaging of PVS: to what extent are we observing physiological PVS enlargement in healthy glymphatic functioning shown in MRI, as opposed to PVS enlargement as a result of pathological damage-causing glymphatic dysfunction?
The complex relationship of MRI-visible PVS, with sleep also remains to be elucidated. Enlarged basal ganglia PVS has been associated with self-reported measures of total time spent in bed and time asleep (Ramirez et al., 2021). Poorer sleep efficiency and reduced duration of N3 sleep phase, measured by polysomnography, has also been correlated with enlargement of the BG-PVS (Berezuk et al., 2015). Given that the glymphatic system is most active during sleep, and PVS volumes demonstrate a diurnal or circadian rhythm, it is possible that brain-wide PVS measures are impacted not only by the time of MRI scan, but also by the duration and quality of sleep from the previous night (Xie et al., 2013).
In disease, abnormal PVS measures have been observed in patients with depression, COVID-19, traumatic brain injury, Multiple Sclerosis (MS), Parkinson’s disease (PD), mild cognitive impairment (MCI), and Alzheimer’s disease (AD) (Table 2; Cai et al., 2015; Ramirez et al., 2015, 2016, 2022; Niazi et al., 2018; Donahue et al., 2021, 2022; George et al., 2021; Piantino et al., 2021; Sepehrband et al., 2021; Shen et al., 2021; Kamagata et al., 2022; Langan et al., 2022; Ranti et al., 2022).
Significant higher PVS counts, but not volumes, have been found in COVID-19 patients, compared to controls (Langan et al., 2022). In patients with major depressive disorder, the severity of PVS volume enlargement has been associated with the number of traumatic events experienced in patients diagnosed with major depressive disorder (MDD) (Ranti et al., 2022). Notably, there were no significant differences in PVS measures (counts, density, and volumes) between MDD patients and controls (Ranti et al., 2022). Similarly, in U.S. military veterans, the number of mild traumatic brain injuries (mTBI) sustained was positively correlated with both PVS volumes and counts (Piantino et al., 2021). In this cohort of veterans, an interaction between mTBI events and sleep quality was significantly associated with PVS volumes (Piantino et al., 2021).
With the use of susceptibility weighted imaging (SWI) sequences, periarteriolar spaces can be distinguished from perivenular spaces (Bouvy et al., 2014). The majority of MRI-visible perivascular spaces tend to be associated with perforating arteries, as opposed to veins (Bouvy et al., 2014; George et al., 2021). In healthy controls (n = 3), only 10.3% of MRI-visible PVS clusters were found to be perivenular, with multiple sclerosis patients (n = 3) demonstrating a significantly greater proportion of visible perivenular space (15.19%) (George et al., 2021). Although the sample sizes were quite small, the results are consistent with the notion that enlargement of perivenular spaces may be associated with inflammation and inflammatory markers.
In PD patients, magnetic resonance spectroscopy has been used to investigate the regional concentrations of inflammatory neurometabolites with respect to PVS enlargement in different regions (Donahue et al., 2022). In the frontal white matter, higher PVS volume fractions were associated with higher levels of choline-containing compounds, an inflammatory marker (Donahue et al., 2022). Whereas, PVS-VF in the anterior middle cingulate cortex was negatively correlated with levels of N-acetyl containing compounds (Donahue et al., 2022). Additionally, PVS enlargement in both the midbrain and BG has been associated with motor symptom severity (Shen et al., 2021; Ramirez et al., 2022).
Furthermore, patients diagnosed with mild cognitive impairment (MCI) appear to have a higher WM-PVS volume fraction compared to controls (Niazi et al., 2018; Kamagata et al., 2022). However, no associations between PVS-VF, in either the WM or BG, were observed with hippocampal volumes, CSF levels of Aβ42, or neuropsychological scores (Kamagata et al., 2022). In contrast, reduced WM-PVS volume fraction in the antero-superior medial temporal lobe has been observed in MCI patients compared to controls (Sepehrband et al., 2021). Additionally, this shrinkage was associated with entorhinal neurofibrillary tau tangle deposition measured by positron emission tomography (Sepehrband et al., 2021).
In AD, both greater WM-PVS volume fractions and greater BG-PVS volumes have been observed in patients compared to age-matched controls (Cai et al., 2015; Ramirez et al., 2015; Kamagata et al., 2022). The enlargement of PVS has been widely implicated in a number of neurodegenerative diseases, exclusively in cross-sectional studies. Future longitudinal studies should examine the changes that occur in PVS with disease progression, especially in the later stages of disease. Such a study would be useful to examine the effect that disease has on the growth trajectory of PVS. For example, it is unknown whether PVS enlargement continues to occur in the later stages of brain and white matter atrophy, especially when neurodegeneration is accelerated by disease.
Recommendations for future research and clinical applications
(1) Examine specific patterns of PVS enlargement, e.g., combinations of regionality, quantity (counts and volumes or volume fractions) and morphology (length, width, solidity).
(2) Focus on longitudinal studies especially given high inter- and intra-individual variability.
(3) Publish PVS counts, volumes, volume fractions, and time of MRI scans, field strength, and voxel size as descriptive variables, where possible.
(4) Publish SNR and CNR values, after applying preprocessing steps and immediately before PVS detection.
The individual labeling of PVS voxels enables more sophisticated research to be conducted in comparison to rating scales. Not only are we able to evaluate the severity of enlargement, but also analyze specific regions and morphology. This is important as the general finding of widespread PVS enlargement in response to various diseases does not offer a useful and highly specific biomarker of disease. Therefore, future research should examine specific patterns of PVS enlargement and shrinkage in response to disease severity. For example, shrinkage of PVS fraction in anterior-superior medial-temporal lobe (asMTL) of MCI patients (Sepehrband et al., 2021). It would be interesting to see whether the shrinkage of PVS volume fraction in the asMTL of MCI patients, alongside widespread PVS-VF enlargement in the WM is specific to MCI pathology and no other diseases including AD (Sepehrband et al., 2021). Although it is a paradoxical finding, it does provide support for more sophisticated analyses of PVS involving combinations of regionality and morphology. As indiscriminate and widespread enlargement of PVS in response to any type of pathology would unlikely be clinically useful.
Moreover, longitudinal studies will be most useful in assessing PVS changes specific to diseased states, given the very high inter-individual variability of PVS enlargement. There also appears to exist intra-individual variability, wherein PVS enlargement occurs in a diurnal manner, being smallest after sleep and gradually expanding throughout the day (Barisano et al., 2021b). The expansion between morning and afternoon is around 0.7 cm3 or 700 mm3. Given that the average adult brain contains around 5,000 mm3 of detectable PVS volume, diurnal variations may indeed play a significant factor to account for (±10% variation in PVS volume). Assuming an average of 8 h of sleep, this would imply that PVS volumes regularly expand on average 43.75 mm3 per waking hour (Barisano et al., 2021b). Therefore, studies should mention whether MRI scans were conducted during the morning or afternoon. This finding is especially important for PVS detection techniques of lower sensitivity, as fewer PVS are detected, findings of statistical significance may be a result of intraday variability (Ramirez et al., 2021). 009 To improve comparability, we recommend publishing average volumes and counts alongside volume fractions and MRI parameters and the resulting SNR and CNR. For a discussion of the MRI parameters that affect PVS visibility, please refer to Zong et al. (2016) and Barisano et al. (2022a).
Here we present one definition of SNR and CNR (Equation 2). Whilst there are many methods to derive them, the exact definition is unimportant. What is important is that the same definition is consistent across studies, and therefore useful as reference values. An SNR or CNR value calculated differently to the industry standard, should be explicit in its definition, as it does not serve as a useful reference, but instead potentially misleads readers by appearing to have a better or worse image quality than is present.
Currently there is no standard for PVS segmentation. This means different groups will likely end up with different CNRPVS values due to the heterogenous PVS detection protocol. In addition to inter-group differences, there are large inter-rater differences. This will lead to substantial variation in reported CNR scores if PVS signal is used. Thus, the intensity of gray matter is used instead of PVS (Equation 2). The gray matter can be reliably segmented via established methods e.g., Freesurfer, FSL, and ANTs (Dale et al., 1999; Zhang et al., 2001; Avants et al., 2014). Another reason is that the PVS intensity appears to most closely resemble GM, as opposed to CSF intensity (Zong et al., 2020; Bernal et al., 2022). Thus, CNR measures based on GM intensity should be simple to compute and highly comparable between studies.
The application of high field (7T) MRI to elucidate the anatomic and pathological extent of PVS enlargement exhibits significantly better image quality than lower field strength scanners (1.5T and 3T) (Barisano et al., 2021a). In a study examining the differences in image quality between MRI scanners different field strengths, as expected, higher Tesla scanners outperformed 1.5T images in both SNR and CNR measurements (Magnotta and Friedman, 2006). However, the quality of the 1.5T images were the most stable between scanners, exhibiting a tighter range of SNR values, compared to the 3T and 4T images (Magnotta and Friedman, 2006). In some cases, the 3T images appeared to be no different to the 1.5T in terms of SNR. To employ a useful analogy, when measuring one’s weight on bathroom scales assembled by different companies, they may report different measurements. This is analogous to the problem of variability between MRI scanners or inter-scanner variability. Here, SNR can be used to measure the comparability between scanners.
Furthermore, when the typical bathroom scale is substituted with a highly sensitive industrial grade weighing scale, slight changes in weight and even involuntary movements are detectable. Consequently, when observing one’s weight on this sensitive instrument, the measurement might not settle on a single value, and instead display a constantly varying number. Similarly, PVS measurements derived from 7T scanners, may suffer from the same intra-scanner variability, although this remains hypothetical. In this case, CNR is useful as a metric for scanner performance.
To address the problem of variability between scanners, harmonization methods such as ComBat and NeuroHarmonize have been developed (Fortin et al., 2018; Garcia-Dias et al., 2020; Pomponio et al., 2020). A word of caution with these methods: by calculating the pooled average of image quality metrics and biasing all dependent variables in a consistent manner, the PVS metrics are effectively “harmonized.” However, this can lead to erosion of PVS measurements derived from images that have greater quality than the pooled average. Magnotta and Friedman (2006) suggest three potential solutions:
(1) Adjustment of scan parameters to provide similar SNR and CNR.
(2) Development of image processing methods that are unaffected by SNR and CNR differences.
(3) Statistical approaches to control for image quality, such as the use of SNR as a covariate in data analyses.
Taking the last idea one step further, Shannon’s entropy focus criterion (EFC), an image quality metric that measures the degree to which an image has been affected by motion artifacts such as ringing or ghosting, can be adjusted for in statistical analyses (Atkinson et al., 1997). EFC is easily derived with the MRI Quality Control (MRIQC) tool, and may be especially useful for PVS studies in disease cohorts with patients who struggle to remain motionless during MRI scans (Esteban et al., 2017).
A case study of perivascular spaces in spaceflight associated neuro-ocular syndrome: How different algorithms can lead to vastly different results
Recently, two studies have been published examining the changes in perivascular spaces associated with being in a microgravity environment for 6 months. Both studies used 3T T1-weighted MRI to assess PVS changes in the brain after 6 months in space. Barisano et al. (2022b) examined participants within 2 weeks before and after 6 months of spaceflight. Hupfeld et al. (2022) conducted six scans, two before and four after. Both studies had age matched controls (Hupfeld et al., 2022). Barisano et al. (2022b) also had a group of astronauts with 2-week missions (n = 7). To detect and subsequently assess PVS quantities and morphology, Hupfeld et al. (2022) (n = 14) used MAPS in the white matter, whereas Barisano et al. (2022b) (n = 37+) applied non-local means filtering followed by Frangi filtering, in both the white matter and basal ganglia.
In each study, various non-overlapping hypotheses were tested. We will focus on the common hypotheses that were tested and as they relate to PVS:
(1) Whether previous experience in spaceflight was associated with different WM-PVS volumes or volumes fractions in pre-flight scans.
(2) Whether changes in WM-PVS volume or volume fraction, from pre- to post-flight were associated with previous days spent in space.
(3) Whether WM-PVS changes correlated with mission duration.
(4) Whether WM-PVS differences at baseline or pre-flight were associated with occurrence of spaceflight-associated neuro-ocular syndrome (SANS).
(5) Whether WM-PVS changes from pre- to post-flight were associated with occurrence of SANS.
In line with Hupfeld et al.’s (2022) suggestion of holdover effects due to previous spaceflight experience, Barisano et al. (2022b) reported high WM-PVS volumes in ROS cosmonauts who spent more time in space compared to NASA ISS astronauts (mean previous number of days in space = 266.3 vs. 88.8, mean preflight volume = 1976.4 vs. 1152.3 mm3, respectively), although this hypothesis was not directly tested. Hupfeld et al. (2022) found strong effect sizes for previous days spent in space with pre-flight PVS metrics including volumes, however, none of these reached significance (r = 0.60–0.71, p > 0.05) (Hupfeld et al., 2022).
Regarding the second hypothesis, Hupfeld et al. (2022) found that novice astronauts exhibited greater change in total PVS volume compared to experienced astronauts who exhibited a decrease in total PVS volume (p = 0.02). This association was not significant for other PVS metrics, but total PVS counts did show a trend toward significance (p = 0.068) (Hupfeld et al., 2022). In comparison, Barisano et al. (2022b) found that previous spaceflight experience was inversely correlated with changes in BG-PVS but not the WM-PVS. In other words, more time previously spent in space was associated with less change in PVS volumes of the BG due to further spaceflight exposure. Additionally, greater PVS volumes in both the BG and WM were found after 6 months of spaceflight (n > 37), which did not occur for astronauts who participated in 2-week missions (n = 7) (Barisano et al., 2022b). Conversely, Hupfeld et al. (2022) found no association of PVS volume fraction change with mission duration (n = 15, p > 0.05).
White matter-perivascular spaces volumes were larger pre- and -post flight for NASA astronauts who developed SANS, as opposed to those who didn’t, suggesting a link between PVS and SANS by Barisano et al. (2022b). Unlike Barisano et al. (2022b). and Hupfeld et al. (2022) found no difference in initial WM PVS volume fraction between SANS and non-SANS group (p = 0.41). However, neither study found the change in PVS volume before and after flight to be statistically significant different between the SANS and non-SANS group (Barisano et al., 2022b; Hupfeld et al., 2022).
In summary, of the five hypotheses that both studies examined, Barisano et al. (2022b) reached significance for three of the five, whereas Hupfeld et al. (2022) only one, with two tests trending towards significance. A number of factors could have impacted the failure to reach statistical significance such as random chance, high individual variability, small sample sizes, and methodological differences such as differing definitions for ventricular volumes. We suspect that a lower PVS detection sensitivity to be a major contributing factor to the failure to reach statistical significance.
The sensitivity of a PVS detection technique directly impacts the statistical power of the study. Lower detection rates will likely deprecate the ability of the study to rule out false negative hypotheses, i.e., have an increased Type 1 error, as fewer PVS are detected leading to lower PVS volumes. This seems to be the case in Hupfeld et al. (2022) wherein multiple tests did not reach statistical significance, but rather a trend was observed wherein p-values were close to the critical threshold.
In Figure 11, it is visually evident that the Frangi approach is much more sensitive than the approach taken by Barisano et al. (2022b) and Hupfeld et al. (2022). Furthermore, the differing PVS detection ability between the approaches can be elucidated by looking to the published PVS volumes. Whilst Barisano et al. (2022b) reported average PVS volumes (mm3), Hupfeld et al. (2022) reported PVS volumes as a fraction of white matter volume (mm3/cm3). The highest mean volume fraction reported by Hupfeld et al. (2022), was 0.53 mm3/cm3, occurring post-flight at scan six (return +180 days) in all astronauts. If a liberal white matter volume of 600 cm3 is assumed, this would imply that a mean of 318 mm3 of PVS volume was detected (Farokhian et al., 2017). In comparison, the lowest mean WM-PVS volume reported by Barisano et al. (2022b) is 768.8 mm3. This is more than double the volume reported by Hupfeld et al. (2022), despite the higher resolution and MRI coils utilized which presumably leads to better detection of PVS voxels. However, without SNR or CNR values published, it is unclear whether one study had better image quality than the other despite both conducting 3T, T1-weighted MRI scans.
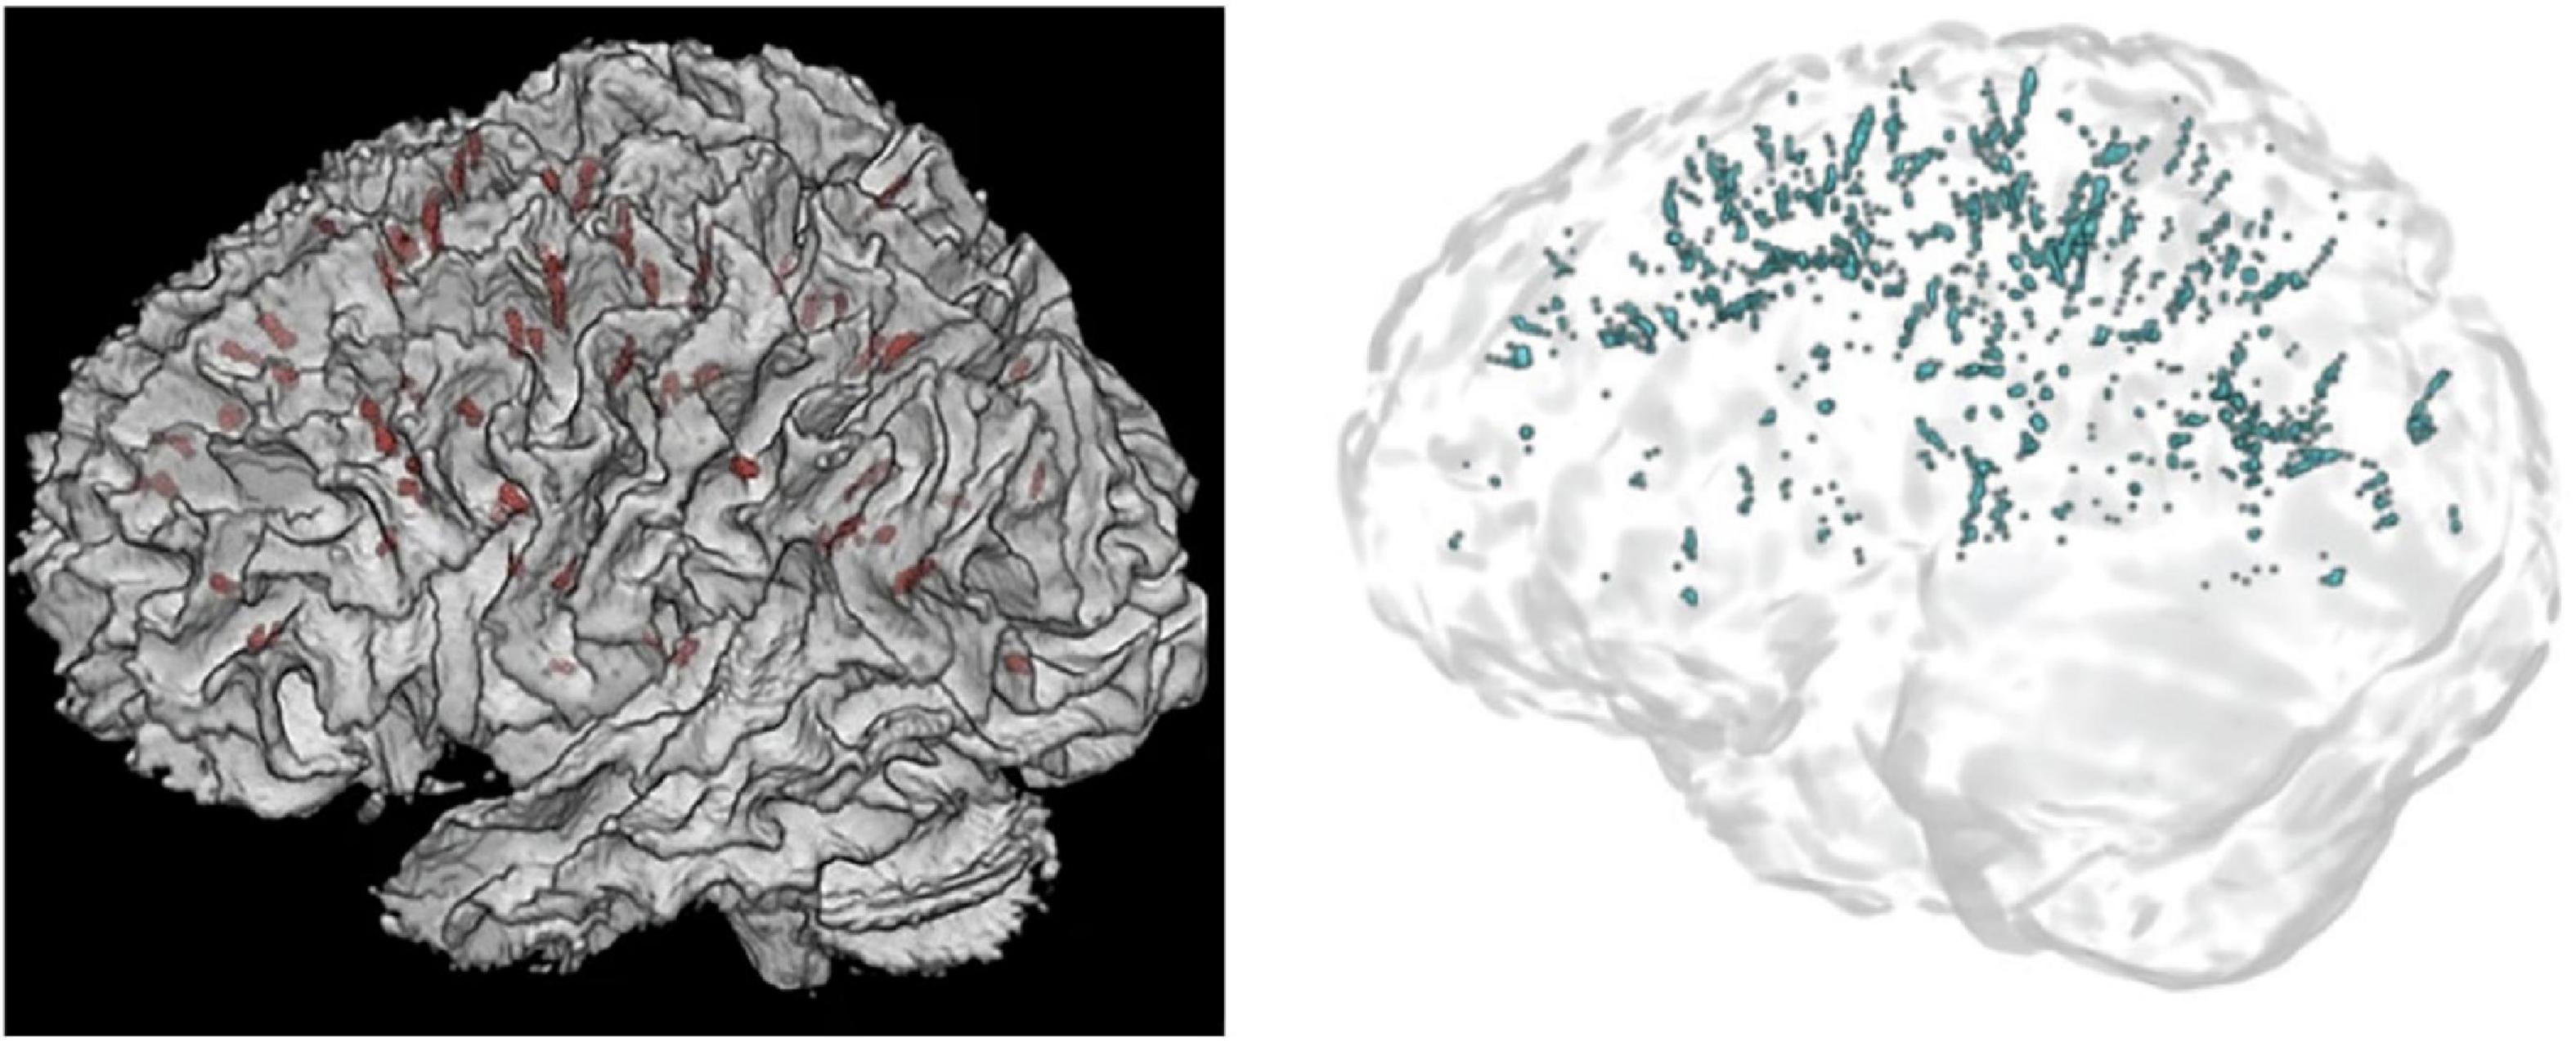
Figure 11. 3D renders of PVS segmentations in astronauts from Hupfeld et al. (2022) (left) and Barisano et al. (2022b) (right). On the left, PVS are displayed in red, whilst on the right PVS are blue. Reproduced under the Creative Commons Attribution 4.0 International License (https://creativecommons.org/licenses/by/4.0/).
These values can be further contextualized with published normative ranges of PVS volume fractions averaging 1.14%, or mean PVS volume of 5029.39 mm3 for healthy adults (n = 897, mean age = 28.8 years) from the Human Connectome Project, found using Frangi filtering, similar to Sepehrband et al. (2019; Barisano et al., 2021b; Lynch et al., 2022, Preprint). Despite being significantly younger than the cohort of studied astronauts, the average PVS volume was significantly greater (5029.39 mm3) in the former group compared to the PVS volumes of 318 mm3 and 786.8 mm3, published by Barisano et al. (2022b) and Hupfeld et al. (2022), respectively. Importantly, the normative PVS values were determined via the combination of co-registered T1 and T2 images (EPC) to substantially improve the CNR of PVS making these comparisons unfair (Sepehrband et al., 2019; Barisano et al., 2021b). It does, however, highlight that normative ranges for PVS distributions are yet to be established for commonly studied MRI sequences, in this case, for single-modality 3T, T1-weighted images, and that preprocessing techniques will have great impact on the subsequent result. Specifically, the EPC preprocessing pipeline of combining T1 and T2 images may have improved PVS visibility by a factor of six compared to unimodal detection (Sepehrband et al., 2019), again highlighting the importance of publishing image quality metrics after preprocessing steps and before PVS detection.
In comparison, Hupfeld et al. (2022) employed MAPS to segment perivascular spaces, an algorithm that has been involved in several publications. Hupfeld et al. (2022) states that the “group mean PVS values [of the astronauts] fall within the range of … a cohort of male veterans with a history of traumatic brain injury.” For this cohort of veterans (n = 56, mean age = 32 years), the mean PVS volume fraction of WM was 1.3 (SD = 1.0) mm3/cm3 (Piantino et al., 2021). Moreover, PVS characterization via mMAPS (multi-modal MAPS) in the white matter of healthy male adolescents (n = 56, mean age = 16 years), uncovered a mean total PVS volume of 334.8 (192.4) mm3 or mean PVS volume fraction of WM = 0.7 (0.4) mm3/cm3 (Piantino et al., 2020). Using mMAPS, Boespflug et al., found a mean PVS volume of 303.0 (267.7) mm3 in healthy old adults (n = 14, mean age = 85.3 years) (Boespflug et al., 2018). These findings are greater than the largest value reported for Hupfeld et al.’s (2022) cohort of astronauts (mean PVS volume fraction = 0.53 mm3/cm3, mean age = 47.46 years).
Whilst these values are roughly in line with each other, it is not consistent to find less PVS volumes in older cohorts, given that age is one of the most established predictors of PVS volume (Lynch et al., 2022, Preprint). It can be argued, however, that the results differ due to the multiple MRI modalities available in each case. Piantino et al. (2020) applied MAPS with T2, T1, and FLAIR modalities to detect PVS in adolescents. Whereas only T1-weighted images were available to Hupfeld et al. (2022). This could explain the larger PVS volumes detected in adolescents compared to significantly older but healthy astronauts.
Conclusion
Taken together, quantitative measures of perivascular spaces that have been published are highly inconsistent, not only between studies using different detection methods (e.g., MAPS and Frangi filtering) but also within studies applying the same PVS segmentation technique. This can be due to a variety of reasons, such as preprocessing methods and heterogenous image qualities. Whilst we are critical of the results published, this in no way invalidates previously published results. They merely reflect the fact that different approaches to the same problem will likely lead to different outcomes, e.g., less sensitive algorithms will likely yield less significant outcomes. Nor does this review call for a complete overhaul of established methods. Huge amounts of time and effort are dedicated in order to develop a functional pipeline for automated PVS segmentation. The present review also highlights the poor comparability of results between studies due to differing PVS detection techniques. We therefore, make recommendations to help solidify the foundations for future PVS research as they relate to developments of new detection methods in MRI and subsequent applications. Development of novel segmentation methods should focus on the Sørensen Dice similarity coefficient as the main measure of model performance. In the application of these models, publication of image quality metrics alongside MRI scanner properties, and descriptive statistics of PVS measures should facilitate comparability between studies.
Author contributions
WP wrote the manuscript. All authors contributed to edits, revisions, and approval for submission.
Conflict of interest
Outside of the present work, the authors report additional funding from: TO’B reports funding from the National Health and Medical Research Council (NHMRC), Medical Research Future Fund (MRFF), Department of Industry, Science and Resources, and the National Institute of Neurological Disorders and Stroke (NINDS). TO’B institution has also received consultancy and research funding from UCB Pharma, Eisai, ES Therapeutics, Zynerba, Praxis Pharmaceuticals, and Biogen. LV reports research funding from Biogen, Eisai, and Life Molecular Imaging, and research grants from the National Health and Medical Research Council (NHMRC), Medical Research Future Fund (MRFF), National Institute of Health (NIH), Department of Industry, Science and Resources, Victorian Accelerator Fund, Medical Research Future Fund (MRFF), and Multiple Sclerosis Research Australia (MSRA). MLa reports funding from the National Health and Medical Research Council (NHMRC), Medical Research Future Fund (MRFF), National Institute of Health (NIH), Australian Research Council (ARC), the Australian National Imaging Facility (NIF), American Society of Neuroradiology, and the Aftershock Foundation. MLa has also received consultancy and research funding from Siemens Healthineers and GE Healthcare. BS reports funding from the Department of Industry, Science, Energy, and Resources.
The remaining authors declare that the research was conducted in the absence of any commercial or financial relationships that could be construed as a potential conflict of interest.
Publisher’s note
All claims expressed in this article are solely those of the authors and do not necessarily represent those of their affiliated organizations, or those of the publisher, the editors and the reviewers. Any product that may be evaluated in this article, or claim that may be made by its manufacturer, is not guaranteed or endorsed by the publisher.
References
Adams, H. H. H., Cavalieri, M., Verhaaren, B. F. J., Bos, D., Lugt, A., van der Enzinger, C., et al. (2013). Rating Method for Dilated Virchow–Robin Spaces on Magnetic Resonance Imaging. Stroke 44, 1732–1735. doi: 10.1161/strokeaha
Adams, H. H. H., Hilal, S., Schwingenschuh, P., Wittfeld, K., van der Lee, S. J., DeCarli, C., et al. (2015). A priori collaboration in population imaging: The Uniform Neuro-Imaging of Virchow-Robin Spaces Enlargement consortium. Alzheimers Dement. 1, 513–520. doi: 10.1016/j.dadm.2015.10.004
Albayram, M. S., Smith, G., Tufan, F., Tuna, I. S., Bostancıklıoğlu, M., Zile, M., et al. (2022). Non-invasive MR imaging of human brain lymphatic networks with connections to cervical lymph nodes. Nat. Commun. 13:203. doi: 10.1038/s41467-021-27887-0
Atkinson, D., Hill, D. L. G., Stoyle, P. N. R., Summers, P. E., and Keevil, S. F. (1997). Automatic Correction of Motion Artifacts in Magnetic Resonance Images Using an Entropy Focus Criterion. IEEE Trans. Med. Imaging 16, 903–910. doi: 10.1109/42.650886
Avants, B. B., Tustison, N., and Johnson, H. (2014). Advanced Normalization Tools (ANTS) Release 2.x. Available online at: https://brianavants.wordpress.com/2012/04/13/updated-ants-compile-instructions-april-12-2012/ (accessed on Nov 4, 2022).
Bakker, E. N. T. P., Bacskai, B. J., Arbel-Ornath, M., Aldea, R., Bedussi, B., Morris, A. W. J., et al. (2016). Lymphatic Clearance of the Brain: Perivascular, Paravascular and Significance for Neurodegenerative Diseases. Cell. Mol. Neurobiol. 36, 181–194. doi: 10.1007/s10571-015-0273-8
Ballerini, L., Booth, T., Valdés Hernández, M., del, C., Wiseman, S., Lovreglio, R., et al. (2020a). Computational quantification of brain perivascular space morphologies: Associations with vascular risk factors and white matter hyperintensities. A study in the Lothian Birth Cohort 1936. Neuroimage Clin. 25:102120. doi: 10.1016/j.nicl.2019.102120
Ballerini, L., McGrory, S., Valdés Hernández, M., del, C., Lovreglio, R., Pellegrini, E., et al. (2020b). Quantitative measurements of enlarged perivascular spaces in the brain are associated with retinal microvascular parameters in older community-dwelling subjects. Cereb. Circ. Cogn. Behav. 1:100002. doi: 10.1016/j.cccb.2020.100002
Ballerini, L., Lovreglio, R., Hernández, M. D. C. V., Gonzalez-Castro, V., Maniega, S. M., Pellegrini, E., et al. (2016). Application of the Ordered Logit Model to Optimising Frangi Filter Parameters for Segmentation of Perivascular Spaces. Proc. Comput. Sci. 90, 61–67. doi: 10.1016/j.procs.2016.07.011
Ballerini, L., Lovreglio, R., Valdes-Hernandez, M., del, C., Ramirez, J., MacIntosh, B. J., et al. (2017). Perivascular Spaces Segmentation in Brain MRI Using Optimal 3D Filtering. Sci. Rep. 8:2132. doi: 10.1038/s41598-018-19781-5
Barisano, G., Sheikh-Bahaei, N., Law, M., Toga, A. W., and Sepehrband, F. (2021b). Body mass index, time of day and genetics affect perivascular spaces in the white matter. J. Cereb. Blood Flow Metab. 41, 1563–1578. doi: 10.1177/0271678X20972856
Barisano, G., Law, M., Custer, R. M., Toga, A. W., and Sepehrband, F. (2021a). Perivascular Space Imaging at Ultrahigh Field MR Imaging. Magn. Reson. Imaging Clin. N. Am. 29, 67–75. doi: 10.1016/j.mric.2020.09.005
Barisano, G., Lynch, K. M., Sibilia, F., Lan, H., Shih, N. C., Sepehrband, F., et al. (2022a). Imaging perivascular space structure and function using brain MRI. Neuroimage 257:119329. doi: 10.1016/j.neuroimage.2022.119329
Barisano, G., Sepehrband, F., Collins, H. R., Jillings, S., Jeurissen, B., Taylor, J. A., et al. (2022b). The effect of prolonged spaceflight on cerebrospinal fluid and perivascular spaces of astronauts and cosmonauts. Proc. Natl. Acad. Sci. U. S. A. 119:e2207724119. doi: 10.1073/pnas.2120439119
Barnes, A., Ballerini, L., Valdés Hernández, M., del, C., Chappell, F. M., Muñoz Maniega, S., et al. (2022). Topological relationships between perivascular spaces and progression of white matter hyperintensities: A pilot study in a sample of the Lothian Birth Cohort 1936. Front. Neurol. 13:889884. doi: 10.3389/FNEUR.2022.889884
Bengio, Y. (2013). “Deep Learning of Representations: Looking Forward,” in Statistical Language and Speech Processing. SLSP 2013. Lecture Notes in Computer Science, eds A. H. Dediu, C. Martín-Vide, R. Mitkov, and B. Truthe (Berlin: Springer).
Bengio, Y., Courville, A., and Vincent, P. (2012). Representation Learning: A Review and New Perspectives. Arxiv [Preprint]. doi: 10.48550/arXiv.1206.5538
Benveniste, H., and Nedergaard, M. (2022). Cerebral small vessel disease: A glymphopathy? Curr. Opin. Neurobiol. 72, 15–21. doi: 10.1016/j.conb.2021.07.006
Berezuk, C., Ramirez, J., Gao, F., Scott, C. J. M., Huroy, M., Swartz, R. H., et al. (2015). Virchow-Robin spaces: Correlations with polysomnography-derived sleep parameters. Sleep 38, 853–858. doi: 10.5665/sleep.4726
Bernal, J., Valdés-Hernández, M. D. C., Escudero, J., Duarte, R., Ballerini, L., Bastin, M. E., et al. (2022). Assessment of perivascular space filtering methods using a three-dimensional computational model. Magn. Reson. Imaging 93, 33–51. doi: 10.1016/j.mri.2022.07.016
Bethlehem, R. A. I., Seidlitz, J., White, S. R., Vogel, J. W., Anderson, K. M., Adamson, C., et al. (2022). Brain charts for the human lifespan. Nature 604, 525–533. doi: 10.1038/s41586-022-04554-y
Boespflug, E. L., Schwartz, D. L., Lahna, D., Pollock, J., Iliff, J. J., Kaye, J. A., et al. (2018). MR imaging-based multimodal autoidentification of perivascular spaces (mMAPS): Automated morphologic segmentation of enlarged perivascular spaces at clinical field strength. Radiology 286, 632–642. doi: 10.1148/radiol.2017170205
Bohr, T., Hjorth, P. G., Holst, S. C., Hrab, S., Kiviniemi, V., Lilius, T., et al. (2022). The glymphatic system: Current understanding and modeling. iScience 25:104987. doi: 10.1016/j.isci.2022.104987
Boutinaud, P., Tsuchida, A., Laurent, A., Adonias, F., Hanifehlou, Z., Nozais, V., et al. (2021). 3D segmentation of perivascular spaces on t1-weighted 3 tesla mr images with a convolutional autoencoder and a u-shaped neural network. Front. Neuroinform. 15:641600. doi: 10.3389/fninf.2021.641600
Bouvy, W. H., Biessels, G. J., Kuijf, H. J., Kappelle, L. J., Luijten, P. R., and Zwanenburg, J. J. M. (2014). Visualization of perivascular spaces and perforating arteries with 7 T magnetic resonance imaging. Invest. Radiol. 49, 307–313. doi: 10.1097/RLI.0000000000000027
Cai, K., Tain, R., Das, S., Damen, F. C., Sui, Y., Valyi-Nagy, T., et al. (2015). The feasibility of quantitative MRI of perivascular spaces at 7T. J. Neurosci. Methods 256, 151–156. doi: 10.1016/j.jneumeth.2015.09.001
Chesebro, A. G., Amarante, E., Lao, P. J., Meier, I. B., Mayeux, R., and Brickman, A. M. (2021). Automated detection of cerebral microbleeds on T2*-weighted MRI. Sci. Rep. 11. doi: 10.1038/s41598-021-83607-0
Cueni, L. N., and Detmar, M. (2008). The lymphatic system in health and disease. Lymphat. Res. Biol. 6, 109–122. doi: 10.1089/lrb.2008.1008
Dale, A. M., Fischl, B., and Sereno, M. I. (1999). Cortical Surface-Based Analysis: I. Segmentation and Surface Reconstruction. Neuroimage 9, 179–194. doi: 10.1006/NIMG.1998.0395
Descombes, X., Kruggel, F., Wollny, G., and Gertz, H. J. (2004). An Object-Based Approach for Detecting Small Brain Lesions: Application to Virchow-Robin Spaces. IEEE Trans. Med. Imaging 23, 246–255. doi: 10.1109/TMI.2003.823061
Dice, L. R. (1945). Measures of the Amount of Ecologic Association Between Species. Ecology 26, 297–302. doi: 10.2307/1932409
Donahue, E. K., Bui, V., Foreman, R. P., Duran, J. J., Venkadesh, S., Choupan, J., et al. (2022). Magnetic resonance spectroscopy shows associations between neurometabolite levels and perivascular space volume in Parkinson’s disease: A pilot and feasibility study. Neuroreport 33, 291–296. doi: 10.1097/wnr.0000000000001781
Donahue, E. K., Murdos, A., Jakowec, M. W., Sheikh-Bahaei, N., Toga, A. W., Petzinger, G. M., et al. (2021). Global and Regional Changes in Perivascular Space in Idiopathic and Familial Parkinson’s Disease. Mov. Disord. 36, 1126–1136. doi: 10.1002/mds.28473
Dubost, F., Adams, H., Bortsova, G., Ikram, M. A., Niessen, W., Vernooij, M., et al. (2019a). 3D regression neural network for the quantification of enlarged perivascular spaces in brain MRI. Med. Image Anal. 51, 89–100. doi: 10.1016/j.media.2018.10.008
Dubost, F., Yilmaz, P., Adams, H., Bortsova, G., Ikram, M. A., Niessen, W., et al. (2019b). Enlarged perivascular spaces in brain MRI: Automated quantification in four regions. Neuroimage 185, 534–544. doi: 10.1016/j.neuroimage.2018.10.026
Dubost, F., Bortsova, G., Adams, H., Ikram, A., Niessen, W., Vernooij, M., et al. (2017). GP-Unet: Lesion detection from weak labels with a 3D regression network. Med. Image Comput. Comput. Assist. Intervent. 2017, 214–222. doi: 10.1007/978-3
Duncan, D., Barisano, G., Cabeen, R., Sepehrband, F., Garner, R., Braimah, A., et al. (2018). Analytic tools for post-traumatic epileptogenesis biomarker search in multimodal dataset of an animal model and human patients. Front. Neuroinform. 12:86. doi: 10.3389/fninf.2018.00086
Egger, C., Opfer, R., Wang, C., Kepp, T., Sormani, M. P., Spies, L., et al. (2017). MRI flair lesion segmentation in multiple sclerosis: Does automated segmentation hold up with manual annotation? Neuroimage Clin. 13, 264–270. doi: 10.1016/j.nicl.2016.11.020
Esteban, O., Birman, D., Schaer, M., Koyejo, O. O., Poldrack, R. A., and Gorgolewski, K. J. (2017). MRIQC: Advancing the automatic prediction of image quality in MRI from unseen sites. PLoS One 12:e0184661. doi: 10.1371/journal.pone.0184661
Farokhian, F., Yang, C., Beheshti, I., Matsuda, H., and Wu, S. (2017). Age-related gray and white matter changes in normal adult brains. Aging Dis. 8, 899–909. doi: 10.14336/AD.2017.0502
Fortin, J. P., Cullen, N., Sheline, Y. I., Taylor, W. D., Aselcioglu, I., Cook, P. A., et al. (2018). Harmonization of cortical thickness measurements across scanners and sites. Neuroimage 167, 104–120. doi: 10.1016/j.neuroimage.2017.11.024
Francis, F., Ballerini, L., and Wardlaw, J. M. (2019). Perivascular spaces and their associations with risk factors, clinical disorders and neuroimaging features: A systematic review and meta-analysis. Int. J. Stroke 14, 359–371. doi: 10.1177/1747493019830321
Frangi, A. F., Niessen, W. J., Vincken, K. L., and Viergever, M. A. (1998). “Multiscale vessel enhancement filtering,” in Medical Image Computing and Computer-Assisted Intervention — MICCAI’98. MICCAI 1998. Lecture Notes in Computer Science, eds W. M. Wells, A. Colchester, and S. Delp (Berlin: Springer), doi: 10.1007/BFb0056195
Garcia-Dias, R., Scarpazza, C., Baecker, L., Vieira, S., Pinaya, W. H. L., Corvin, A., et al. (2020). Neuroharmony: A new tool for harmonizing volumetric MRI data from unseen scanners. Neuroimage 220:117127. doi: 10.1016/j.neuroimage.2020.117127
Ge, Y., Law, M., Herbert, J., and Grossman, R. I. (2005). Prominent perivenular spaces in multiple sclerosis as a sign of perivascular inflammation in primary demyelination. AJNR Am. J. Neuroradiol. 26, 2316–2319.
George, I. C., Arrighi-Allisan, A., Delman, B. N., Balchandani, P., Horng, S., and Feldman, R. (2021). A novel method to measure venular perivascular spaces in patients with MS on 7T MRI. Am. J. Neuroradiol. 42, 1069–1072. doi: 10.3174/ajnr.A7144
González-Castro, V., Valdés Hernández, M., del, C., Chappell, F. M., Armitage, P. A., Makin, S., et al. (2017). Reliability of an automatic classifier for brain enlarged perivascular spaces burden and comparison with human performance. Clin. Sci. 131, 1465–1481. doi: 10.1042/CS20170051
Goryawala, M., del Brutto Andrade, V., Saporta, A. S. D., Loewenstein, D., and Rundek, T. (2021). Automated delineation of enlarged perivascular spaces (EPVS). Alzheimers Dement. 17:e054088. doi: 10.1002/alz.054088
Granberg, T., Moridi, T., Brand, J. S., Neumann, S., Hlavica, M., Piehl, F., et al. (2020). Enlarged perivascular spaces in multiple sclerosis on magnetic resonance imaging: A systematic review and meta-analysis. J. Neurol. 267, 3199–3212. doi: 10.1007/s00415-020-09971-5
Guerrero, R., Qin, C., Oktay, O., Bowles, C., Chen, L., Joules, R., et al. (2018). White matter hyperintensity and stroke lesion segmentation and differentiation using convolutional neural networks. NeuroImage 17, 918–934. doi: 10.1016/j.nicl.2017.12.022
Hansen, T. P., Cain, J., Thomas, O., and Jackson, A. (2015). Dilated perivascular spaces in the basal ganglia are a biomarker of small-vessel disease in a very elderly population with dementia. Am. J. Neuroradiol. 36, 893–898. doi: 10.3174/AJNR.A4237
Harrison, I. F., Ismail, O., Machhada, A., Colgan, N., Ohene, Y., Nahavandi, P., et al. (2020). Impaired glymphatic function and clearance of tau in an Alzheimer’s disease model. Brain 143, 2576–2593. doi: 10.1093/brain/awaa179
Hladky, S. B., and Barrand, M. A. (2014). Mechanisms of fluid movement into, through and out of the brain: Evaluation of the evidence. Fluids Barriers CNS 11:26. doi: 10.1186/2045-8118-11-26
Hladky, S. B., and Barrand, M. A. (2022). The glymphatic hypothesis: The theory and the evidence. Fluids Barriers CNS 19:9. doi: 10.1186/s12987-021-00282-z
Hou, Y., Park, S. H., Wang, Q., Zhang, J., Zong, X., Lin, W., et al. (2017). Enhancement of Perivascular Spaces in 7 T MR Image using haar Transform of Non-local Cubes and Block-matching filtering. Sci. Rep. 7:8569. doi: 10.1038/s41598-017-09336-5
Huang, P., Zhu, Z., Zhang, R., Wu, X., Jiaerken, Y., Wang, S., et al. (2021). Factors associated with the dilation of perivascular space in healthy elderly subjects. Front. Aging Neurosci. 13:624732. doi: 10.3389/fnagi.2021.624732
Huguenard, J., Smith, A. J., Yao, X., Dix, J. A., Jin, B. J., and Verkman, A. S. (2017). Test of the “glymphatic” hypothesis demonstrates diffusive and aquaporin-4-independent solute transport in rodent brain parenchyma. Elife 6:e27679. doi: 10.7554/eLife.27679.001
Hupfeld, K. E., Richmond, S. B., McGregor, H. R., Schwartz, D. L., Luther, M. N., Beltran, N. E., et al. (2022). Longitudinal MRI-visible perivascular space (PVS) changes with long-duration spaceflight. Sci. Rep. 12:7238. doi: 10.1038/s41598-022-11593-y
Iliff, J. J., Lee, H., Yu, M., Feng, T., Logan, J., Nedergaard, M., et al. (2013). Brain-wide pathway for waste clearance captured by contrast-enhanced MRI. J. Clin. Investig. 123, 1299–1309. doi: 10.1172/JCI67677
Iliff, J. J., Wang, M., Liao, Y., Plogg, B. A., Peng, W., Gundersen, G. A., et al. (2012). A paravascular pathway facilitates CSF flow through the brain parenchyma and the clearance of interstitial solutes, including amyloid β. Sci. Transl. Med. 4:147ra111. doi: 10.1126/scitranslmed.3003748
Jack, C. R., Bernstein, M. A., Fox, N. C., Thompson, P., Alexander, G., Harvey, D., et al. (2008). The Alzheimer’s Disease Neuroimaging Initiative (ADNI): MRI methods. J. Magn. Reson. Imaging 27, 685–691. doi: 10.1002/jmri.21049
Jessen, N. A., Munk, A. S. F., Lundgaard, I., and Nedergaard, M. (2015). The glymphatic system: A beginner’s guide. Neurochem. Res. 40, 2583–2599. doi: 10.1007/s11064-015-1581-6
Jiang, Q., Zhang, L., Ding, G., Davoodi-Bojd, E., Li, Q., Li, L., et al. (2017). Impairment of the glymphatic system after diabetes. J. Cereb. Blood Flow Metab. 37, 1326–1337. doi: 10.1177/0271678X16654702
Jokinen, H., Koikkalainen, J., Laakso, H. M., Melkas, S., Nieminen, T., Brander, A., et al. (2020). Global burden of small vessel disease-Related brain changes on MRI predicts cognitive and functional decline. Stroke 51, 170–178. doi: 10.1161/STROKEAHA.119.026170
Jung, E., Chikontwe, P., Zong, X., Lin, W., Shen, D., and Park, S. H. (2019). Enhancement of perivascular spaces using densely connected deep convolutional neural network. IEEE Access 7, 18382–18391. doi: 10.1109/ACCESS.2019.2896911
Kamagata, K., Andica, C., Takabayashi, K., Saito, Y., Taoka, T., Nozaki, H., et al. (2022). Association of mri indices of glymphatic system with amyloid deposition and cognition in mild cognitive impairment and alzheimer disease. Neurology [Epub ahead of print]. doi: 10.1212/WNL.0000000000201300
Karimi, D., Dou, H., Warfield, S. K., and Gholipour, A. (2019). Deep learning with noisy labels: Exploring techniques and remedies in medical image analysis. Arxiv [Preprint]. doi: 10.48550/arXiv.1912.02911
Kingma, D. P., and Welling, M. (2013). “Auto-encoding variational bayes,” in Proceedings of the conference proceedings: Papers accepted to the international conference on learning representations (ICLR), Banff, AB. doi: 10.48550/arXiv.1312.6114
Kwee, R. M., and Kwee, T. C. (2007). Virchow-Robin spaces at MR imaging. Radiographics 27, 1071–1086. doi: 10.1148/rg.274065722
Langan, M. T., Smith, D. A., Verma, G., Khegai, O., Saju, S., Rashid, S., et al. (2022). Semi-automated segmentation and quantification of perivascular spaces at 7 Tesla in COVID-19. Front. Neurol. 13:846957. doi: 10.3389/fneur.2022.846957
Laveskog, A., Wang, R., Bronge, L., Wahlund, L. O., and Qiu, C. (2018). Perivascular spaces in old age: Assessment, distribution, and correlation with white matter hyperintensities. Am. J. Neuroradiol. 39, 70–76. doi: 10.3174/ajnr.A5455
Lee, S., Yoo, R. E., Choi, S. H., Oh, S. H., Ji, S., Lee, J., et al. (2021). Contrast-enhanced mri t1 mapping for quantitative evaluation of putative dynamic glymphatic activity in the human brain in sleep-wake states. Radiology 300, 661–668. doi: 10.1148/radiol.2021203784
Li, S., Fang, F., Cui, M., Jiang, Y., Wang, Y., Kong, X., et al. (2019). Incidental findings on brain MRI among Chinese at the age of 55–65 years: The Taizhou Imaging Study. Sci. Rep. 9. doi: 10.1038/s41598-018-36893-0
Lian, C., Zhang, J., Liu, M., Zong, X., Hung, S. C., Lin, W., et al. (2018). Multi-channel multi-scale fully convolutional network for 3D perivascular spaces segmentation in 7T MR images. Med. Image Anal. 46, 106–117. doi: 10.1016/j.media.2018.02.009
Liu, Y., Mu, F., Shi, Y., Cheng, J., Li, C., and Chen, X. (2022). Brain tumor segmentation in multimodal MRI via pixel-level and feature-level image fusion. Front. Neurosci. 16:1000587. doi: 10.3389/FNINS.2022.1000587
Louveau, A., Herz, J., Alme, M. N., Salvador, A. F., Dong, M. Q., Viar, K. E., et al. (2018). CNS lymphatic drainage and neuroinflammation are regulated by meningeal lymphatic vasculature. Nat. Neurosci. 21, 1380–1391. doi: 10.1038/s41593-018-0227-9
Lynch, K. M., Sepehrband, F., Toga, A. W., and Choupan, J. (2022). Brain perivascular space imaging across the human lifespan. Int. Soc. Magn. Reson. Med. [Preprint]. doi: 10.1101/2022.01.25.475887
Magnotta, V. A., and Friedman, L. (2006). Measurement of signal-to-noise and contrast-to-noise in the fBIRN multicenter imaging study. J. Digit. Imaging 19, 140–147. doi: 10.1007/s10278-006-0264-x
Mogensen, F. L. H., Delle, C., and Nedergaard, M. (2021). The glymphatic system (En)during inflammation. Int. J. Mol. Sci. 22:7491. doi: 10.3390/ijms22147491
Moses, J., Sinclair, B., Law, M., O’Brien, T. J., and Vivash, L. (2022). Automated Methods for Detecting and Quantitation of Enlarged Perivascular spaces on MRI. J. Magn. Reson. Imaging doi: 10.1002/JMRI.28369 [Epub ahead of print].
Natário, K. H. P., Aguiar, G. B., and Vieira, M. A. D. C. E. S. (2021). The glymphatic system and its relation with neurological diseases. Rev. Assoc. Med. Bras. 67, 620–624. doi: 10.1590/1806-9282.20200925
Niazi, M., Karaman, M., Das, S., Zhou, X. J., Yushkevich, P., and Cai, K. (2018). Quantitative MRI of perivascular spaces at 3T for early diagnosis of mild cognitive impairment. Am. J. Neuroradiol. 39, 1622–1628. doi: 10.3174/ajnr.A5734
Othman, N., Dorizzi, B., and Garcia-Salicetti, S. (2016). OSIRIS: An open source iris recognition software. Pattern Recogn. Lett. 82, 124–131. doi: 10.1016/J.PATREC.2015.09.002
Paradise, M. B., Beaudoin, M. S., Dawes, L., Crawford, J. D., Wen, W., Brodaty, H., et al. (2020). Development and validation of a rating scale for perivascular spaces on 3T MRI. J. Neurol. Sci. 409:116621. doi: 10.1016/j.jns.2019.116621
Park, S. H., Zong, X., Gao, Y., Lin, W., and Shen, D. (2016). Segmentation of perivascular spaces in 7 T MR image using auto-context model with orientation-normalized features. Neuroimage 134, 223–235. doi: 10.1016/j.neuroimage.2016.03.076
Patankar, T. F., Mitra, D., Varma, A., Snowden, J., Neary, D., and Jackson, A. (2005). Dilatation of the virchow-robin space is a sensitive indicator of cerebral microvascular disease: Study in elderly patients with dementia. AJNR Am. J. Neuroradiol. 26, 1512–1520.
Piantino, J., Boespflug, E. L., Schwartz, D. L., Luther, M., Morales, A. M., Lin, A., et al. (2020). Characterization of MR imaging-visible perivascular spaces in the white matter of healthy adolescents at 3T. Am. J. Neuroradiol. 41, 2139–2145. doi: 10.3174/ajnr.A6789
Piantino, J., Schwartz, D. L., Luther, M., Newgard, C., Silbert, L., Raskind, M., et al. (2021). Link between mild traumatic brain injury, poor sleep, and magnetic resonance imaging: Visible perivascular spaces in veterans. J. Neurotrauma 38, 2391–2399. doi: 10.1089/neu.2020.7447
Plog, B. A., and Nedergaard, M. (2018). The glymphatic system in central nervous system health and disease: Past, present, and future. Annu. Rev. Pathol. 13, 379–394. doi: 10.1146/annurev-pathol-051217-111018
Pollock, H., Hutchings, M., Weller, R. O., and Zhang, E. T. (1997). Perivascular spaces in the basal ganglia of the human brain: Their relationship to lacunes. J. Anat. 191:337. doi: 10.1046/J.1469-7580.1997.19130337.X
Pomponio, R., Erus, G., Habes, M., Doshi, J., Srinivasan, D., Mamourian, E., et al. (2020). Harmonization of large MRI datasets for the analysis of brain imaging patterns throughout the lifespan. Neuroimage 208:116450. doi: 10.1016/j.neuroimage.2019.116450
Potter, G. M., Chappell, F. M., Morris, Z., and Wardlaw, J. M. (2015a). Cerebral perivascular spaces visible on magnetic resonance imaging: Development of a qualitative rating scale and its observer reliability. Cerebrovasc. Dis. 39, 224–231. doi: 10.1159/000375153
Potter, G., Morris, Z., and Wardlaw, J. (2015c). Guide Prepared by Enlarged Perivascular Spaces (EPVS): A Visual rating Scale and User Guide. Available online at: https://www.ed.ac.uk/files/imports/fileManager/epvs-rating-scale-user-guide.pdf (accessed on Aug 17, 2022).
Potter, G. M., Doubal, F. N., Jackson, C. A., Chappell, F. M., Sudlow, C. L., Dennis, M. S., et al. (2015b). Enlarged perivascular spaces and cerebral small vessel disease. Int. J. Stroke 10, 376–381. doi: 10.1111/ijs.12054
Pullicino, P. M., Miller, L. L., Alexandrov, A. V., and Ostrow, P. T. (1995). Infraputaminal “lacunes”. Clinical and pathological correlations. Stroke 26, 1598–1602. doi: 10.1161/01.STR.26.9.1598
Ramirez, J., Berberian, S. A., Breen, D. P., Gao, F., Ozzoude, M., Adamo, S., et al. (2022). Small and large magnetic resonance imaging–visible perivascular spaces in the basal ganglia of parkinson’s disease patients. Mov. Disord. 37, 1304–1309. doi: 10.1002/mds.29010
Ramirez, J., Berezuk, C., McNeely, A. A., Gao, F., McLaurin, J. A., and Black, S. E. (2016). Imaging the perivascular space as a potential biomarker of neurovascular and neurodegenerative diseases. Cell. Mol. Neurobiol. 36, 289–299. doi: 10.1007/s10571-016-0343-6
Ramirez, J., Berezuk, C., McNeely, A. A., Scott, C. J. M., Gao, F., and Black, S. E. (2015). Visible Virchow-Robin spaces on magnetic resonance imaging of Alzheimer’s disease patients and normal elderly from the sunnybrook dementia study. J. Alzheimers Dis. 43, 415–424. doi: 10.3233/JAD-132528
Ramirez, J., Gibson, E., Quddus, A., Lobaugh, N. J., Feinstein, A., Levine, B., et al. (2011). Lesion explorer: A comprehensive segmentation and parcellation package to obtain regional volumetrics for subcortical hyperintensities and intracranial tissue. NeuroImage 54, 963–973. doi: 10.1016/j.neuroimage.2010.09.013
Ramirez, J., Holmes, M. F., Berezuk, C., Kwan, D., Tan, B., Beaton, D., et al. (2021). MRI-visible perivascular space volumes, sleep duration and daytime dysfunction in adults with cerebrovascular disease. Sleep Med. 83, 83–88. doi: 10.1016/j.sleep.2021.03.043
Ranti, D. L., Warburton, A. J., Rutland, J. W., Dullea, J. T., Markowitz, M., Smith, D. A., et al. (2022). Perivascular spaces as a marker of psychological trauma in depression: A 7-Tesla MRI study. Brain Behav. 12:32598. doi: 10.1002/brb3.2598
Rashid, T., Liu, H., Ware, J. B., Li, K., Rafael Romero, J., Fadaee, E., et al. (2022). Deep learning based detection of enlarged perivascular spaces on brain MRI. arXiv [Preprint]. doi: 10.48550/ARXIV.2209.13727
Rasmussen, M. K., Mestre, H., and Nedergaard, M. (2018). The glymphatic pathway in neurological disorders. Lancet Neurol. 17, 1016–1024. doi: 10.1016/S1474-4422(18)30318-1
Roher, A. E., Kuo, Y. M., Esh, C., Knebel, C., Weiss, N., Kalback, W., et al. (2003). Cortical and leptomeningeal cerebrovascular amyloid and white matter pathology in alzheimer’s disease. Mol. Med. 9, 112–122.
Salzman, K. L., Osborn, A. G., House, P., Jinkins, J. R., Ditchfield, A., Cooper, J. A., et al. (2005). Giant tumefactive perivascular spaces. AJNR Am. J. Neuroradiol. 26, 298–305.
Schwartz, D. L., Boespflug, E. L., Lahna, D. L., Pollock, J., Roese, N. E., and Silbert, L. C. (2019). Autoidentification of perivascular spaces in white matter using clinical field strength T1 and FLAIR MR imaging. Neuroimage 202:116126. doi: 10.1016/j.neuroimage.2019.116126
Sepehrband, F., Barisano, G., Sheikh-Bahaei, N., Cabeen, R. P., Choupan, J., Law, M., et al. (2019). Image processing approaches to enhance perivascular space visibility and quantification using MRI. Sci. Rep. 9:12351. doi: 10.1038/s41598-019-48910-x
Sepehrband, F., Barisano, G., Sheikh-Bahaei, N., Choupan, J., Cabeen, R. P., Lynch, K. M., et al. (2021). Volumetric distribution of perivascular space in relation to mild cognitive impairment. Neurobiol. Aging 99, 28–43. doi: 10.1016/j.neurobiolaging.2020.12.010
Shen, T., Yue, Y., Zhao, S., Xie, J., Chen, Y., Tian, J., et al. (2021). The role of brain perivascular space burden in early-stage Parkinson’s disease. NPJ Parkinsons Dis. 7:12. doi: 10.1038/s41531-021-00155-0
Siddique, N., Paheding, S., Elkin, C. P., and Devabhaktuni, V. (2021). U-net and its variants for medical image segmentation: A review of theory and applications. IEEE Access 9, 82031–82057. doi: 10.1109/ACCESS.2021.3086020
Smith, D. A., Verma, G., Ranti, D., Markowitz, M., Balchandani, P., and Morris, L. (2020). Perivascular space semi-automatic segmentation (PVSSAS): A tool for segmenting, viewing and editing perivascular spaces. Biorxiv [Preprint]. doi: 10.1101/2020.11.16.385336
Spijkerman, J., Zwanenburg, J., Bouvy, W., Geerlings, M., Biessels, G., Hendrikse, J., et al. (2022). Automatic quantification of perivascular spaces in T2-weighted images at 7 T MRI. Cereb. Circ. Cogn. Behav. 3:100142. doi: 10.1016/j.cccb.2022.100142
Sudre, C. H., van Wijnen, K., Dubost, F., Adams, H., Atkinson, D., Barkhof, F., et al. (2022). Where is VALDO? VAscular Lesions Detection and segmentatiOn challenge at MICCAI 2021. Arxiv [Preprint]. doi: 10.48550/arXiv.2208.07167
Troili, F., Cipollini, V., Moci, M., Morena, E., Palotai, M., Rinaldi, V., et al. (2020). Perivascular unit: This must be the place. the anatomical crossroad between the immune, vascular and nervous system. Front. Neuroanat. 14:17. doi: 10.3389/fnana.2020.00017
Uchiyama, Y., Kunieda, T., Asano, T., Kato, H., Hara, T., Kanematsu, M., et al. (2008). Computer-Aided diagnosis scheme for classification of lacunar infarcts and enlarged virchow-robin spaces in brain mr images. Annu. Int. Conf. IEEE Eng. Med. Biol. Soc. 2008, 3908–3911. doi: 10.1109/IEMBS.2008.4650064
Valdés Hernández, M., del, C., Ballerini, L., Glatz, A., Muñoz Maniega, S., Gow, A. J., et al. (2020). Perivascular spaces in the centrum semiovale at the beginning of the 8th decade of life: Effect on cognition and associations with mineral deposition. Brain Imaging Behav. 14, 1865–1875. doi: 10.1007/s11682-019-00128-1
Valdes Hernandez, M., Piper, R. J., Wang, X., Deary, I. J., and Wardlaw, J. M. (2013). Towards the automatic computational assessment of enlarged perivascular spaces on brain magnetic resonance images: A systematic review. J. Magn. Reson. Imaging 38, 774–785. doi: 10.1002/jmri.24047
van Wijnen, K. M. H., Dubost, F., Yilmaz, P., Ikram, M. A., Niessen, W. J., Adams, H., et al. (2019). Automated lesion detection by regressing intensity-based distance with a neural network. Med. Image Comput. Comput. Assist. Intervent. 11767, 234–242. doi: 10.1007/978-3-030-32251-9_26
Wang, S., Huang, P., Zhang, R., Hong, H., Jiaerken, Y., Lian, C., et al. (2021). Quantity and morphology of perivascular spaces: Associations with vascular risk factors and cerebral small vessel disease. J. Magn. Reson. Imaging 54, 1326–1336. doi: 10.1002/jmri.27702
Wang, X., Valdés Hernández, M., del, C., Doubal, F., Chappell, F. M., Piper, R. J., et al. (2016). Development and initial evaluation of a semi-automatic approach to assess perivascular spaces on conventional magnetic resonance images. J. Neurosci. Methods 257, 34–44. doi: 10.1016/j.jneumeth.2015.09.010
Wardlaw, J. M., Benveniste, H., Nedergaard, M., Zlokovic, B. V., Mestre, H., Lee, H., et al. (2020). Perivascular spaces in the brain: Anatomy, physiology and pathology. Nat. Rev. Neurol. 16, 137–153. doi: 10.1038/s41582-020-0312-z
Wardlaw, J. M., Smith, E. E., Biessels, G. J., Cordonnier, C., Fazekas, F., Frayne, R., et al. (2013). Neuroimaging standards for research into small vessel disease and its contribution to ageing and neurodegeneration. Lancet Neurol. 12, 822–838. doi: 10.1016/S1474-4422(13)70124-8
Williamson, B. J., Khandwala, V., Wang, D., Maloney, T., Sucharew, H., Horn, P., et al. (2022). Automated grading of enlarged perivascular spaces in clinical imaging data of an acute stroke cohort using an interpretable, 3D deep learning framework. Sci. Rep. 12:788. doi: 10.1038/s41598-021-04287-4
Woollam, D. H. M., and Millen, J. W. (1955). The perivascular spaces of the mammalian central nervous system and their relation to the perineuronal and subarachnoid spaces. J. Anat. 89, 193–200.
Xie, L., Kang, H., Xu, Q., Chen, M. J., Liao, Y., Thiyagarajan, M., et al. (2013). Sleep drives metabolite clearance from the adult brain. Science 342, 373–377. doi: 10.1126/science.1241224
Yu, N., Sinclair, B., Posada, L. M. G., Chen, Z., Di, Q., Lin, X., et al. (2022). Asymmetric distribution of enlarged perivascular spaces in centrum semiovale may be associated with epilepsy after acute ischemic stroke. CNS Neurosci. Ther. 28, 343–353. doi: 10.1111/cns.13786
Yushkevich, P. A., Piven, J., Hazlett, H. C., Smith, R. G., Ho, S., Gee, J. C., et al. (2006). User-Guided 3D Active Contour Segmentation of Anatomical Structures: Significantly Improved Efficiency and Reliability. Neuroimage 31, 116–128. doi: 10.1016/j.neuroimage.2006.01.015
Zhang, J., Gao, Y., Park, S. H., Zong, X., Lin, W., and Shen, D. (2017). Structured Learning for 3-D perivascular space segmentation using vascular features. IEEE Trans. Biomed. Eng. 64, 2803–2812. doi: 10.1109/TBME.2016.2638918
Zhang, L., Chopp, M., Jiang, Q., and Zhang, Z. (2019). Role of the glymphatic system in ageing and diabetes mellitus impaired cognitive function. Stroke Vasc. Neurol. 4, 90–92. doi: 10.1136/svn-2018-000203
Zhang, Y., Brady, M., and Smith, S. (2001). Segmentation of brain MR images through a hidden Markov random field model and the expectation-maximization algorithm. IEEE Trans. Med. Imaging 20, 45–57. doi: 10.1109/42.906424
Zong, X., Lian, C., Jimenez, J., Yamashita, K., Shen, D., and Lin, W. (2020). Morphology of perivascular spaces and enclosed blood vessels in young to middle-aged healthy adults at 7T: Dependences on age, brain region, and breathing gas. Neuroimage 218:116978. doi: 10.1016/j.neuroimage.2020.116978
Keywords: perivascular space (PVS), MRI, glymphatic system, computer vision, segmentation
Citation: Pham W, Lynch M, Spitz G, O’Brien T, Vivash L, Sinclair B and Law M (2022) A critical guide to the automated quantification of perivascular spaces in magnetic resonance imaging. Front. Neurosci. 16:1021311. doi: 10.3389/fnins.2022.1021311
Received: 17 August 2022; Accepted: 16 November 2022;
Published: 14 December 2022.
Edited by:
Giuseppe Barisano, Stanford University, United StatesReviewed by:
Ceylan Cankurtaran, University of Southern California, United StatesClinton B. Wright, National Institute of Neurological Disorders and Stroke (NIH), United States
Kang Min Park, Inje University Haeundae Paik Hospital, South Korea
Copyright © 2022 Pham, Lynch, Spitz, O’Brien, Vivash, Sinclair and Law. This is an open-access article distributed under the terms of the Creative Commons Attribution License (CC BY). The use, distribution or reproduction in other forums is permitted, provided the original author(s) and the copyright owner(s) are credited and that the original publication in this journal is cited, in accordance with accepted academic practice. No use, distribution or reproduction is permitted which does not comply with these terms.
*Correspondence: William Pham, V2lsbGlhbS5QaGFtQG1vbmFzaC5lZHU=; Benjamin Sinclair, QmVuLlNpbmNsYWlyQG1vbmFzaC5lZHU=