 Cherie L. Marvel1*
 Lin Chen2,3
 Michelle R. Joyce1Owen P. Morgan1Katherine G. Iannuzzelli1
 Stephen M. LaConte4,5
 Jonathan M. Lisinski4Liana S. Rosenthal1
 Xu Li2,3
- 1Department of Neurology, Johns Hopkins University School of Medicine, Baltimore, MD, United States
- 2F.M. Kirby Research Center for Functional Brain Imaging, Kennedy Krieger Institute, Baltimore, MD, United States
- 3Department of Radiology and Radiological Science, Johns Hopkins University School of Medicine, Baltimore, MD, United States
- 4Fralin Biomedical Research Institute at VTC, Virginia Tech, Roanoke, VA, United States
- 5Biomedical Engineering and Mechanics, Virginia Tech, Blacksburg, VA, United States
Background: In spinocerebellar ataxia type 3 (SCA3), volume loss has been reported in the basal ganglia, an iron-rich brain region, but iron content has not been examined. Recent studies have reported that patients with SCA6 have markedly decreased iron content in the cerebellar dentate, coupled with severe volume loss. Changing brain iron levels can disrupt cognitive and motor functions, yet this has not been examined in the SCAs, a disease in which iron-rich regions are affected.
Methods: In the present study, we used quantitative susceptibility mapping (QSM) to measure tissue magnetic susceptibility (indicating iron concentration), structural volume, and normalized susceptibility mass (indicating iron content) in the cerebellar dentate and basal ganglia in people with SCA3 (n = 10) and SCA6 (n = 6) and healthy controls (n = 9). Data were acquired using a 7T Philips MRI scanner. Supplemental measures assessed motor, cognitive, and mood domains.
Results: Putamen volume was lower in both SCA groups relative to controls, replicating prior findings. Dentate susceptibility mass and volume in SCA6 was lower than in SCA3 or controls, also replicating prior findings. The novel finding was that higher basal ganglia susceptibility mass in SCA6 correlated with lower cognitive performance and greater motor impairment, an association that was not observed in SCA3. Cerebellar dentate susceptibility mass, however, had the opposite relationship with cognition and motor function in SCA6, suggesting that, as dentate iron is depleted, it relocated to the basal ganglia, which contributed to cognitive and motor decline. By contrast, basal ganglia volume loss, rather than iron content, appeared to drive changes in motor function in SCA3.
Conclusion: The associations of higher basal ganglia iron with lower motor and cognitive function in SCA6 but not in SCA3 suggest the potential for using brain iron deposition profiles beyond the cerebellar dentate to assess disease states within the cerebellar ataxias. Moreover, the role of the basal ganglia deserves greater attention as a contributor to pathologic and phenotypic changes associated with SCA.
Introduction
Iron is involved in a number of important functions of the central nervous system, such as myelin production and neurotransmitter synthesis (Zecca et al., 2004; Ward et al., 2014). However, disruption to local brain iron concentrations and changes in iron deposition can lead to impairments of motor function and cognition (Ward et al., 2014; Du et al., 2016; Ayton et al., 2017; Chen L. et al., 2021). Moreover, in neurodegenerative diseases, changes in iron homeostasis often correlate with disease severity, suggesting that iron deposition is a marker for (and possibly contributor to) neuropathological states (Dominguez et al., 2015; He et al., 2015; Wisnieff et al., 2015; Harrison et al., 2016; Van Bergen et al., 2016, 2018; Ayton et al., 2019). If iron deposition in neurodegenerative diseases could be measured and tracked over time, disease expression and progression could be characterized, which could assist in disease prognosis.
Measuring brain iron levels in vivo using MRI has been facilitated by the recent developments of quantitative susceptibility mapping (QSM) techniques, which allow direct mapping of tissue magnetic susceptibility by solving the field-to-susceptibility dipole deconvolution using MR phase measurements (Liu et al., 2009, 2013, 2015; Shmueli et al., 2009; Wharton and Bowtell, 2010; Li et al., 2011, 2015; Schweser et al., 2012; Deistung et al., 2013, 2017; Bilgic et al., 2014; Haacke et al., 2015; Langkammer et al., 2015; Wang and Liu, 2015; Wei et al., 2015; Bao et al., 2016) aging (SWI) and phase imaging (Haacke et al., 2004, 2005; Duyn et al., 2007), QSM overcomes several limitations including blooming artifacts and non-local contributions from neighboring voxels (Liu et al., 2015). Recent studies have shown that QSM-based tissue susceptibility measures correlate well with histochemically-measured tissue iron concentration (Liu et al., 2009; Schweser et al., 2011; Langkammer et al., 2012; Lim et al., 2013; Zheng et al., 2013), with high sensitivity and specificity to tissue iron changes in most gray matter regions (Langkammer et al., 2012; Lim et al., 2013; Zheng et al., 2013). In addition, because QSM provides excellent contrast to delineate iron-rich deep nuclei, QSM can also be used to acquire enhanced tissue volume measurements in these structures (Lim et al., 2013; Cobzas et al., 2015; Hanspach et al., 2017; He et al., 2017; Zhang et al., 2018; Li et al., 2019).
Spinocerebellar ataxia (SCA) is a genetic and progressive neurodegenerative disease in which cell death occurs in the cerebellum, leading to degradative changes in movement, cognition, and mood (Kansal et al., 2017; Hoche et al., 2018; Slapik et al., 2019; Kronemer et al., 2021; Morgan et al., 2021; NINDS, 2021; Joyce et al., 2022). Research has only begun to examine iron deposition related to SCA and other forms of ataxia. A 2-year longitudinal investigation in Friedrich’s ataxia (FA), which is a non-SCA form of ataxia, measured iron concentration in the cerebellar dentate twice using QSM, with measures 2 years apart (Ward et al., 2019). Results indicated that cerebellar dentate iron concentration was greater, and volume was smaller, than that of controls at baseline. Two years later, however, iron concentration in the dentate rose more in FA while dentate structural volume loss had similar rate in FA as compared to controls, suggesting that structural volume loss in the dentate preceded iron accumulation. More recently, Deistung et al. (2022) reported QSM measure of dentate iron concentration and volume in SCA types 1, 2, 3, and 6 and healthy controls in a cross-sectional design (Deistung et al., 2022). They reported higher dentate iron concentrations in SCA1 and SCA2 compared to that of controls, with no change in SCA3. By contrast, SCA6 showed lower dentate iron concentration than in controls. All groups showed smaller dentate volumes compared to controls, and this difference was greatest in SCA6 and smallest in SCA3. In the SCA6 patients only, the ataxia severity scores negatively correlated with dentate iron concentration and volume. Taken together, these studies suggest that cerebellar ataxia types differ in their presentation of cerebellar atrophy and dentate iron deposition.
While limited research has been conducted regarding iron deposition in SCA, more is known regarding the brain volume changes in this disease. Atrophy typically involves the cerebellum in SCA, but may also include extra-cerebellar regions, depending upon the subtype (Seidel et al., 2012). For example, in SCA3, pathology can extend into the nearby pons (Rüb et al., 2002, 2003a,2004, 2005, 2006), midbrain (Rüb et al., 2006), and basal ganglia (BG) (Bürk et al., 1996; Dürr et al., 1996, Rüb et al., 2003b; Lukas et al., 2008). By comparison, in SCA6, pathology is thought to be largely circumscribed to the cerebellum (Ishikawa et al., 1999), with some evidence for less severe neurodegeneration (relative to SCA3) in the pons (Gierga et al., 2009; Reetz et al., 2013), midbrain (Gomez et al., 1997; Gierga et al., 2009), and BG (Gomez et al., 1997).
Pathology of the BG may be particularly relevant to SCA and other cerebellar disorders. The cerebellum and BG are two subcortical brain regions that are anatomically interconnected via thalamic projections (Hoshi et al., 2005; Bostan and Strick, 2018). Pathway mapping in non-human primates has demonstrated connections from the cerebellar dentate to the thalamus (TH) to the putamen (PT). Conversely, a separate pathway travels from the subthalamic nucleus (STN) to the pontine nucleus to the cerebellar cortex. Besides their anatomical connections, the two sub-cortical brain regions are also functionally similar and have a special working relationship. The cerebellum is primarily involved in fine timing and coordination of movements (Holmes, 1939). The BG is important for initiating motor sequences (Jin et al., 2014) and for grouping sequential actions into larger “chunks” (Wymbs et al., 2012). Given their similarities and interconnectedness, it is not surprising that the BG and cerebellum work together during motor and cognitive processes (Doya, 2000; Bostan and Strick, 2018). It is possible that the cerebellum modulates BG activity based on internal models or error signals, as it does with the motor system for voluntary movements (Hoshi et al., 2005).
Like the cerebellar dentate, the BG nuclei are also rich in iron, with the brain’s highest (densest, μg/g) iron levels found in the BG sub-regions (highest to lowest): PT, globus pallidus (GP), and caudate nuclei (CN) as in one post-mortem study (Ramos et al., 2014). By comparison, iron levels were lower in the cerebellar dentate. In SCA, there is evidence to suggest that BG subregions lose volume following cerebellar volume loss. A 2-year longitudinal study that included SCA1, SCA3, and SCA6 participants examined cerebellar and BG structure (Reetz et al., 2013). They observed a significant decline in BG volume (caudate and putamen) in each group across 2 years, compared to controls. Importantly, cerebellar volume, while smaller than that of controls, remained unchanged during this same time period. Thus, BG progressively lost volume after cerebellar structural volume loss had plateaued.
In the present study, 7T QSM MRI was used to measure tissue magnetic susceptibility (indicating iron concentration), structural volume and normalized susceptibility mass (indicating iron content) of the cerebellar dentate, BG, and other iron-rich subcortical nuclei in participants with SCA3 or SCA6 and healthy controls. The aim of this study was to assess abnormal brain iron distribution and structural volume loss associated with SCA3 and SCA6 and examine how these measures associated with changes of motor function, cognition, and mood.
Materials and methods
Subjects
Individuals with SCA3 (n = 10; age in years M = 51.1, SD = 16.4), SCA6 (n = 6; age in years M = 64.4, SD = 7.53), and healthy controls (n = 9; age in years M = 47.6, SD = 14.6) were recruited for this study. Duration of illness was available via chart review for all ataxia participants. The number of CAG repeats were available for nine SCA3 and five SCA6 participants (see Table 1). Medications for the SCA3 and SCA6 groups consisted of psychotropics (30 and 50%, respectively) and muscle relaxants (30 and 16.7%, respectively) (see Supplementary Table 1 for a full list of medications by group).
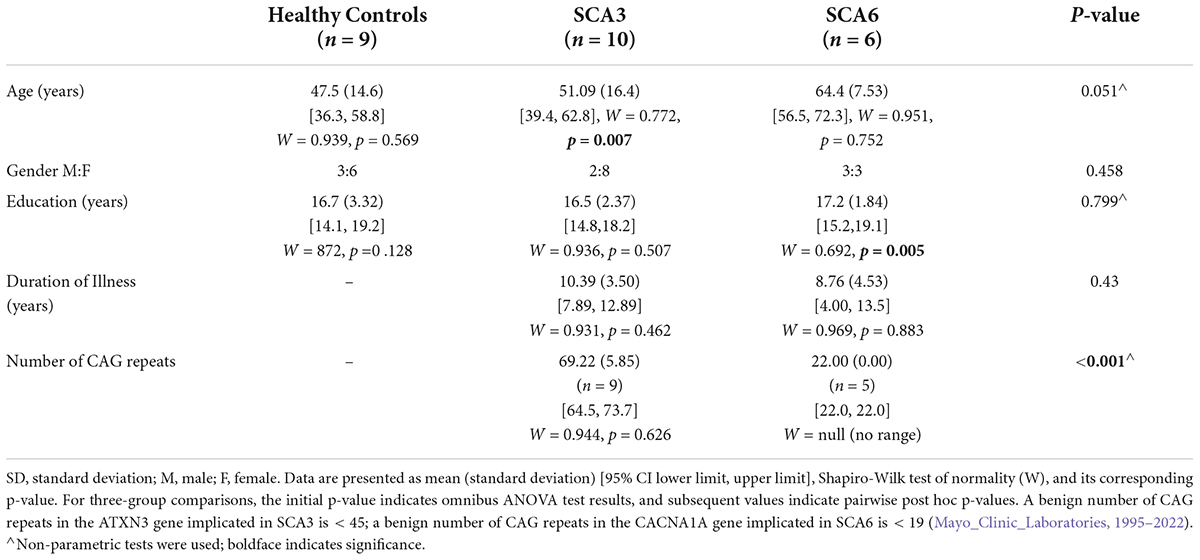
Table 1. Participant demographics.
Inclusion criteria consisted of participants’ being: (1) between the ages of 18–80 years of age, (2) at least 10 years of education, (3) right-handed, (4) native English speaker, and (5) for the SCA participants, genetically confirmed with SCA3 or SCA6. Participants were excluded for the following criteria: (1) illicit substance use within 60 days of the MRI scans, (2) history of Axis I psychiatric disorders (including alcohol or drug dependence), (3) neurological disorders (aside from SCA3 or SCA6), (4) severe or unstable medical disorder, (5) history of head injury with loss of consciousness for greater than 5 min, or (6) any condition that would rule out an MRI (e.g., metal within the body, pregnancy, claustrophobia).
This study was approved by Johns Hopkins Medicine Institutional Review Board. All participants provided written informed consent to participate in this study.
MRI image acquisition
All scans were performed on an ultra-high field 7T MRI scanner (Achieva; Philips Healthcare, Best, the Netherlands) with a 32-channel head coil (Nova Medical). Structural images were collected using a sagittal T1-weighted magnetization prepared gradient-echo (MPRAGE) sequence with 1.0 mm isotropic resolution: repetition time (TR) = 5.0 ms; echo time (TE) = 1.88 ms; flip angle = 7 degrees; TFE factor = 352; shot interval = 4,500 ms; inversion delay = 563 ms; SENSE factor = 2 × 2; field of view (FOV) = 220 × 220 × 180 mm3; with reconstruction matrix size = 224 × 224 × 180; total scan time = 2′15″. High-resolution QSM data were acquired using a 3D multi-echo gradient echo (GRE) sequence with 0.7 mm isotropic resolution: TE1/ΔTE/TR = 5/5/28 ms with 5 monopolar echoes; band width = 403.7 Hz/pix; flip angle = 12 degrees; axial slab; FOV = 252 × 210 × 126 mm3 with reconstruction matrix size = 384 × 384 × 180; SENSE factor = 2 × 2; total scan time = 8′49″.
MRI processing
Quantitative susceptibility maps were generated using a pipeline as in a previous study (Chen L. et al., 2021) using the Johns Hopkins University/Kennedy Krieger Institute QSM Toolbox (version 3.0).1 MR phase images acquired with the 3D GRE sequence were first unwrapped using a best-path based method (Abdul-Rahman et al., 2005). A brain mask was then obtained using FSL BET (Smith, 2002) on the GRE magnitude image at the first echo with 1 voxel erosion. Background fields were eliminated using the VSHARP method with a maximum kernel size of 8 mm and a regularization parameter of 0.05 (Schweser et al., 2011; Wu et al., 2012b). The resulting local frequency shift maps were then averaged over echoes to obtain a higher signal-to-noise (SNR) reconstruction (Wu et al., 2012a). QSM dipole inversion was conducted with the structural feature-based collaborative reconstruction with automatic referencing to central cerebrospinal fluid (CSF) regions (SFCR+0) method (Bao et al., 2016; Chen L. et al., 2021).
The procedures for segmenting the regions of interest (ROIs) were as follows. First, the T1-weighted MPRAGE (T1W) image was co-registered to the GRE magnitude image at the first echo with affine transformation using Advanced Normalization Tools (ANTs) (Avants et al., 2011). The co-registered T1W image was then skull-stripped by applying the same brain mask obtained from the QSM processing described above. The co-registered T1W and QSM images were then segmented using a QSM/T1 multi-atlas matching approach, which was developed as part of the Johns Hopkins University brain atlases (Li et al., 2019) and freely available on MRIcloud (mricloud.org). From the obtained brain parcellation map, nine bilateral deep gray matter regions were extracted, including the dentate nuclei (DN), basal ganglia [BG: CN, globus pallidus internal (Gpi), globus pallidus external (Gpe), PT, STN, substantia nigra (SN)], pulvinar (Pulv), and red nucleus (RN) (Figure 1). The thalamus (TH), excluding pulvinar, was also extracted for comparison. The ROI masks were further eroded with 1 voxel to avoid possible partial volume effects and used to calculate the mean magnetic susceptibility value in each ROI as a measures of tissue iron concentration. The volume of each structure was determined by multiplying the number of voxels in each ROI by the voxel size. The whole brain volume was calculated similarly based on the brain mask used (i.e., multiplying the number of voxels within the mask by the voxel size). To compensate for the effect of different brain sizes across participants, individual structural volumes were normalized as follows: Corrected ROI Volume = Original Structure Volume × (Group Mean whole brain Volume/Subject whole brain Volume).
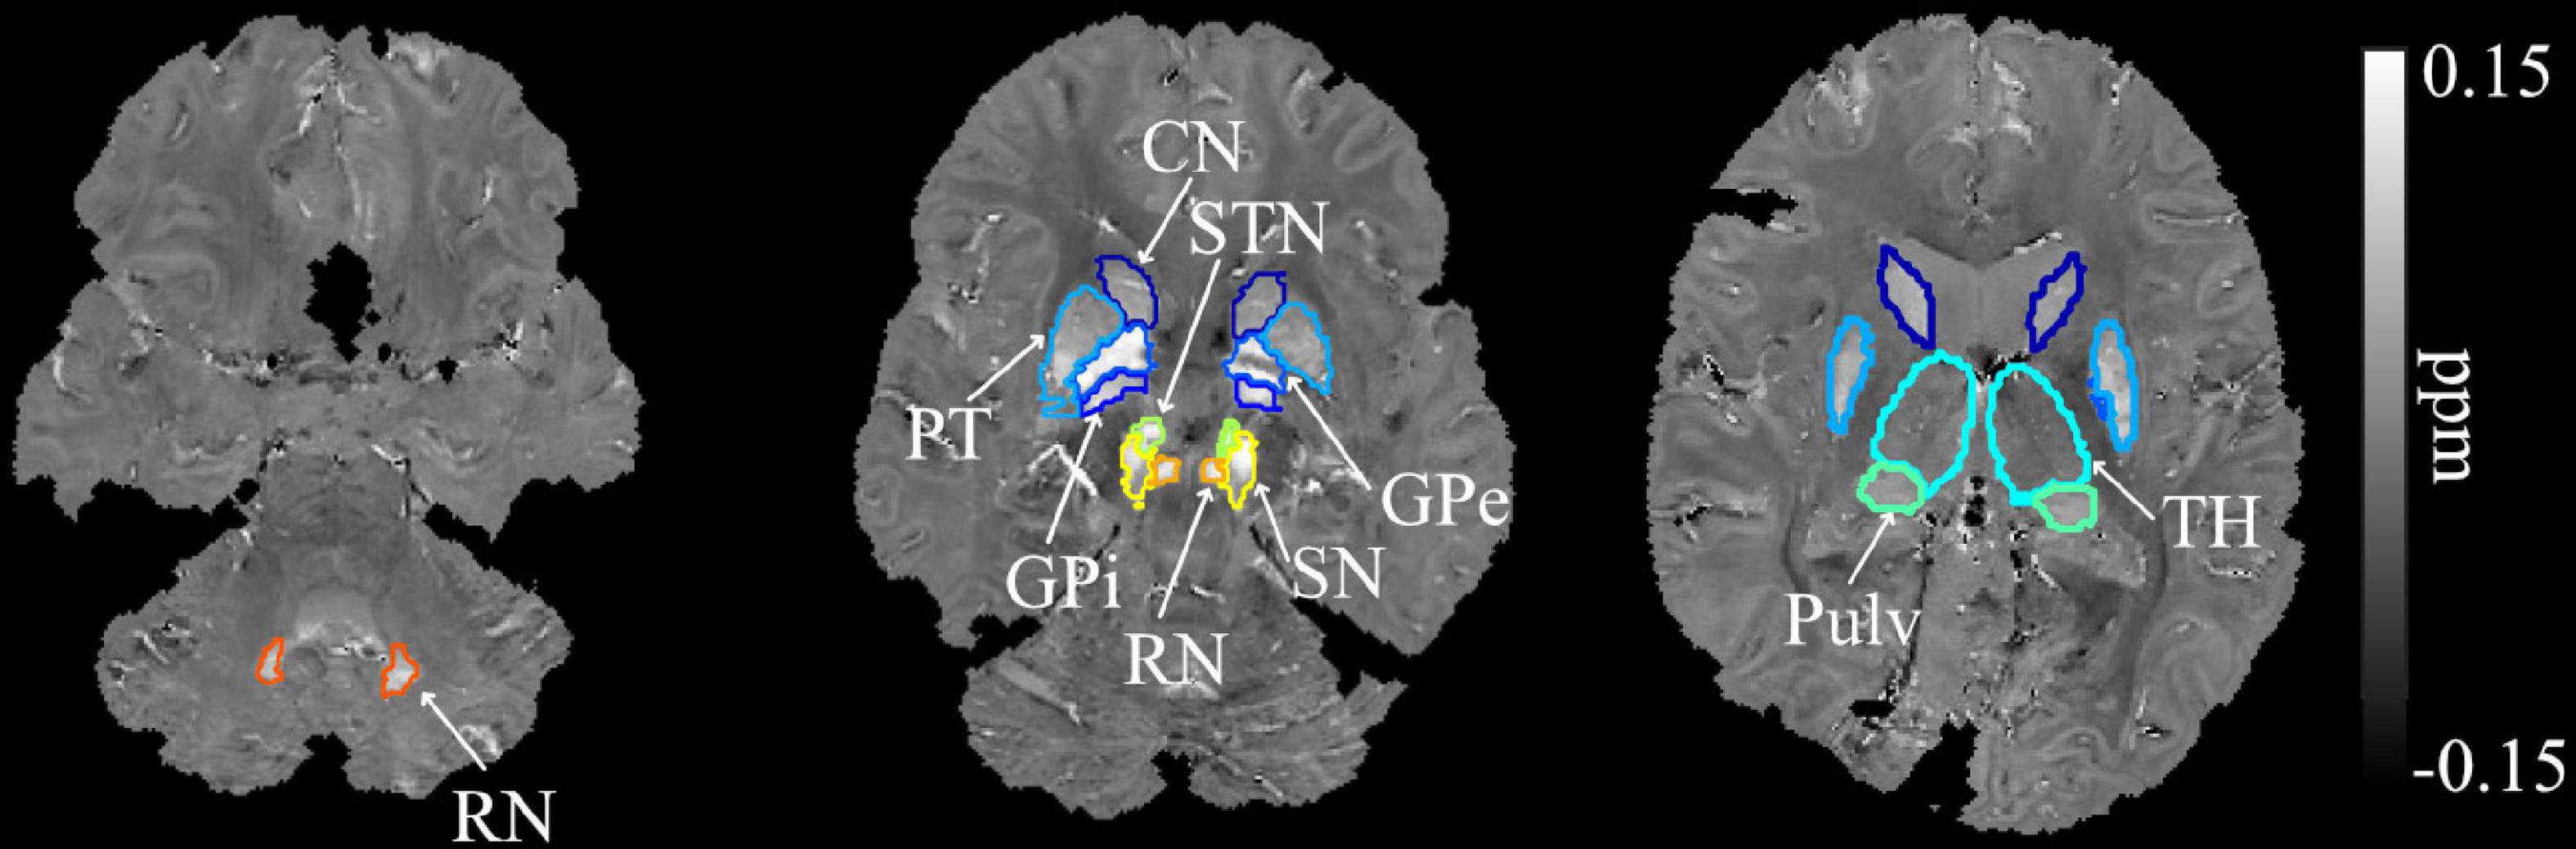
Figure 1. Example segmentation of the dentate nuclei, basal ganglia, and related iron-rich structures overlaid on the QSM image of a SCA6 participant. DN, dentate nucleus; CN, caudate nucleus; PT, putamen; GPi, globus pallidus internal; GPe, globus pallidus external; RN, red nucleus; SN, substantia nigra; STN, subthalamic nucleus; Pulv, pulvinar; TH, thalamus.
Since cerebellar atrophy is a known pathological feature in SCA3 and SCA6 that may lead to increased tissue iron concentration and increased magnetic susceptibility values, a measure reflecting normalized total iron content in each brain region was derived as normalized susceptibility mass = mean magnetic susceptibility x Corrected ROI Volume. Such susceptibility mass measure was used as the major measure of regional iron deposition or iron loss. Note that the susceptibility mass measure was not calculated for the thalamus ROI due to its myelin-induced negative QSM values when referenced to CSF.
Supplemental assessments
The following tests were given to both ataxic patients and healthy controls, excluding the International Cooperative Ataxia Rating Scale, which was only administered to ataxia participants.
Montreal cognitive assessment
The Montreal Cognitive Assessment (MOCA) version 7.1 is a cognitive screening tool that assesses deficits within the following domains: visuospatial/executive, naming, memory, attention, language, abstraction, delayed recall, and orientation (Nasreddine et al., 2005).
Reading subtest of the wide range achievement test
The Wide Range Achievement Test (WRAT-3) reading subtest is used to estimate premorbid verbal intelligence (Wilkinson, 1993). One healthy control was not administered the WRAT-3 assessment because they were highly familiar with the test.
International cooperative ataxia rating scale
The International Cooperative Ataxia Rating Scale (ICARS) is an ataxia rating scale that assesses the level of impairments as a result of ataxia within the following areas: postural and gait disturbances, limb ataxia, dysarthria, and oculomotor dysfunction (Trouillas et al., 1997).
Finger tapping task
Participants were administered a locally developed finger tapping task (Eierud et al., 2011; Morgan et al., 2021). Participants were asked to tap in synchrony with a cross that flashed at 1, 2, 3, or 4 Hz and to rest otherwise. Visual feedback was provided as a vertical slider bar that indicated whether tapping was slower than the target speed (to the left of the cross) or faster than target speed (to the right of the cross). Participants received a practice session consisting of two 20 s blocks at 1 and 2 Hz. The full task was then administered, which consisted of 32 tapping blocks at 1, 2, 3, or 4 Hz, lasting 16, 18, or 20 s in duration. Rest blocks, lasting 26, 28, or 30 s, alternated with the tapping blocks. Only one target frequency was presented per block. The order of block-frequency was generated pseudo-randomly with the constraints that each frequency was presented eight times, and that the task began with 20 s of rest, followed by a tapping block at 1 Hz. The total task lasted 25 min. Variables of interest were tapping speed, measured as inter-tap intervals or seconds/tap, and tapping accuracy, measured as root-mean-squared error (RMSE) relative to target. For simplicity, results reporting focused on 1 and 4 Hz only.
Hamilton anxiety rating scale
The Hamilton Anxiety Rating Scale (HAM-A) is a rating scale that quantifies the severity of current anxiety symptoms (Hamilton, 1959).
Hamilton depression rating scale
The Hamilton Depression Rating Scale (HAM-D) is a rating scale that quantifies the severity of current depression symptoms (Hamilton, 1960).
Statistical analysis
Statistics were performed using IBM SPSS Statistics, Macintosh, version 27.0 (IBM Corp., Armonk, NY, United States), with the exception of non-parametric correlations. For these, the “corr” function in MATLAB 2021b (MathWorks, Natick, Mass) was used for Spearman’s rank correlations with the exact permutation distributions with an adjust for ties for small sample size. All statistics were performed using two-tailed statistical analyses with an alpha level of p < 0.05.
Demographic variables
To assess differences in demographic variables across all three groups (healthy controls, SCA3, and SCA6), one-way analysis of variance (ANOVA) tests were used for the following continuous variables: age, education, MOCA, WRAT-3, ICARS (only in SCAs), HAM-A, HAM-D, and finger tapping at 1 and 4 Hz RMSE. The following assessments were comprised of multiple ordinal datasets, which were added together, and the sum total scores were treated as continuous data: MOCA, ICARS, HAM-A, and HAM-D. To compare gender, a Pearson Chi-Square test was used. To assess the duration of illness and number of CAG repeats between SCA3 and SCA6, independent samples t-tests were used. The Levene’s Test for Equality of Variances was used to identify unequal variances within an ANOVA test, and Shapiro-Wilk tests were used to determine if continuous variables followed a non-normal distribution. If unequal variances or non-normal distributions were observed, then Kruskal-Wallis H tests were used instead of one-way ANOVAs, and Mann-Whitney tests were used instead of independent samples t-tests for between-group comparisons.
Regions of interest volume, susceptibility mass, and magnetic susceptibility across groups
One-way ANOVAs were used to assess the difference across all three groups for volume, susceptibility mass, and magnetic susceptibility values within ROIs. As described above, data were tested for unequal variances and non-normal distributions using a Levene’s Test and Shapiro-Wilk test, respectively. If unequal variances or non-normal distributions were observed, then a Kruskal-Wallis H-test was used instead of an ANOVA. Following the group comparison, if a main effect was observed, independent samples t-tests or Mann-Whitney tests (for non-normal distributions) were used for between-group post hoc comparisons.
Regions of interest volume, susceptibility mass, and magnetic susceptibility associations among the regions of interests
To examine associations among the ROIs, groups were examined separately. ROI volumes were correlated to each other using Pearson’s correlations, or Spearman’s rank correlations for data sets that contained a non-normal distribution. Susceptibility mass and magnetic susceptibility values were similarly correlated across ROIs.
Regions of interest volume, susceptibility mass, and magnetic susceptibility associations with supplemental variables
ROI volumes were correlated with supplemental test scores per group using Pearson correlations for the MOCA and ICARS (total sum scores), WRAT, RMSE of finger tapping at 1 and 4 Hz, HAM-A, and HAM-D. Exploratory analyses were also conducted using scores from the sub-scales within the MOCA and ICARS to examine whether particular cognitive domains or motor functions were associated with ROI volumes. When sub-scales were used in the MOCA and ICARS, e.g., MOCA Language, or when distribution was non-normal, Spearman’s rank correlations were used instead. Susceptibility mass and magnetic susceptibility values were similarly correlated with the supplemental test scores.
Susceptibility mass values and aging
The effect of aging on susceptibility mass associations between cerebellar dentate and BG was examined by correlating susceptibility mass values between the dentate and BG regions, per group, controlling for age. Spearman’s rank correlations were used for all comparisons due the lack of homogeneity of variance within the cerebellar dentate values.
Results
Groups did not significantly differ on the demographic variables of age, gender, and education. Duration of illness did not differ between the SCA3 and SCA6 groups. The number of CAG repeats was higher in SCA3 than in SCA6, which was expected (Table 1). When neurological and cognitive assessments were compared across groups (Table 2), the healthy control group scored higher than did both patient groups on the MOCA. Groups did not differ on the WRAT-3, finger tapping at 1 and 4 Hz, or the mood scales (HAM-A, HAM-D); patient groups did not differ on the ICARS.
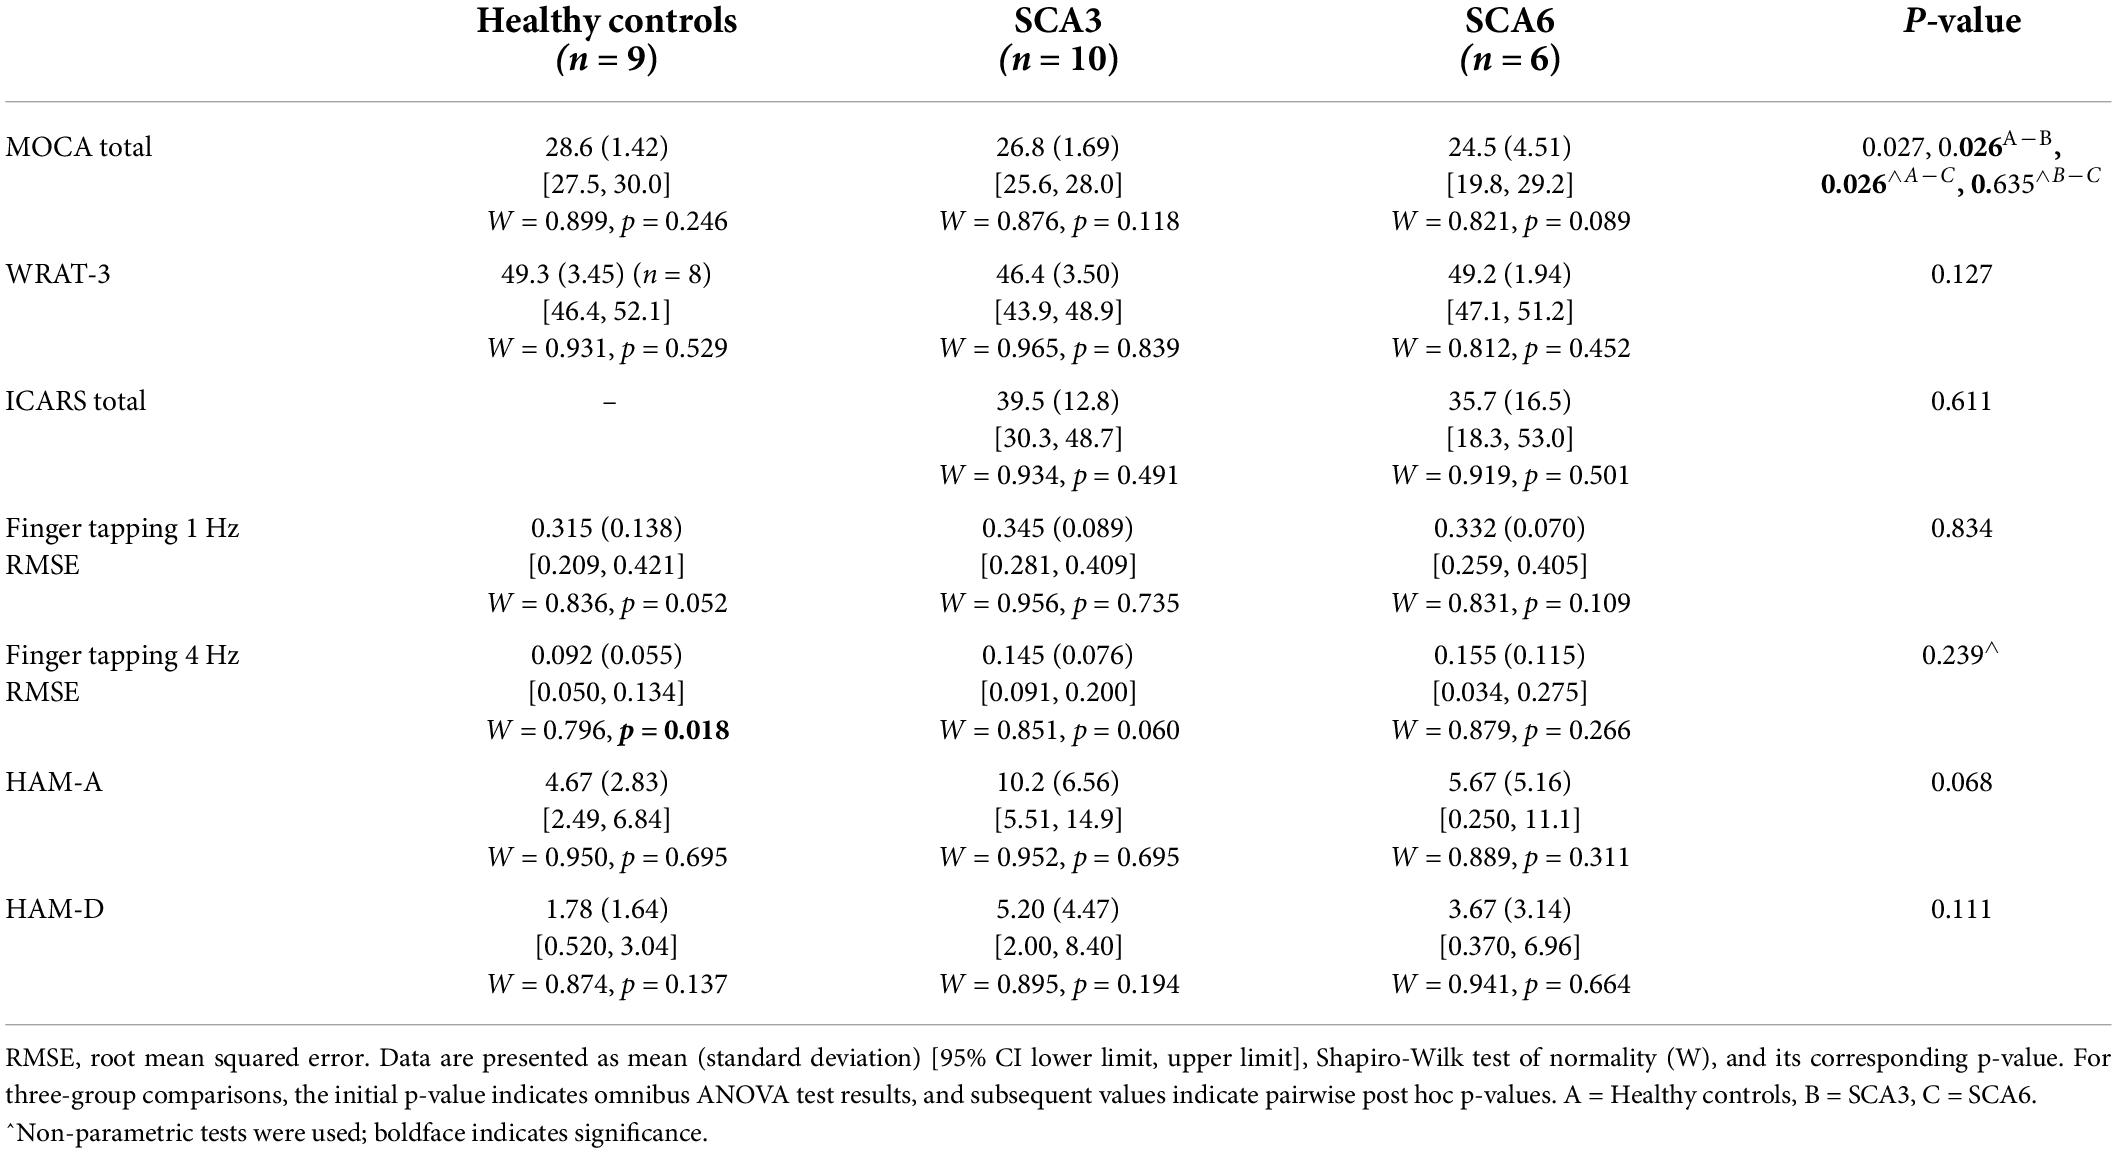
Table 2. Cognitive, neurological, and mood assessment scores.
Example anatomical T1W images of the cerebellum in both axial and sagittal views are shown for a healthy control (58 y/o, M) participant in Figure 2, in comparison to one SCA3 (50 y/o, F) and one SCA6 (62 y/o, M) participant. In addition, QSM images of the iron-rich cerebellar dentate and BG regions of the same participants are also shown. Cerebellar atrophy including the cortex and dentate are clearly visible in the SCA6 participant.
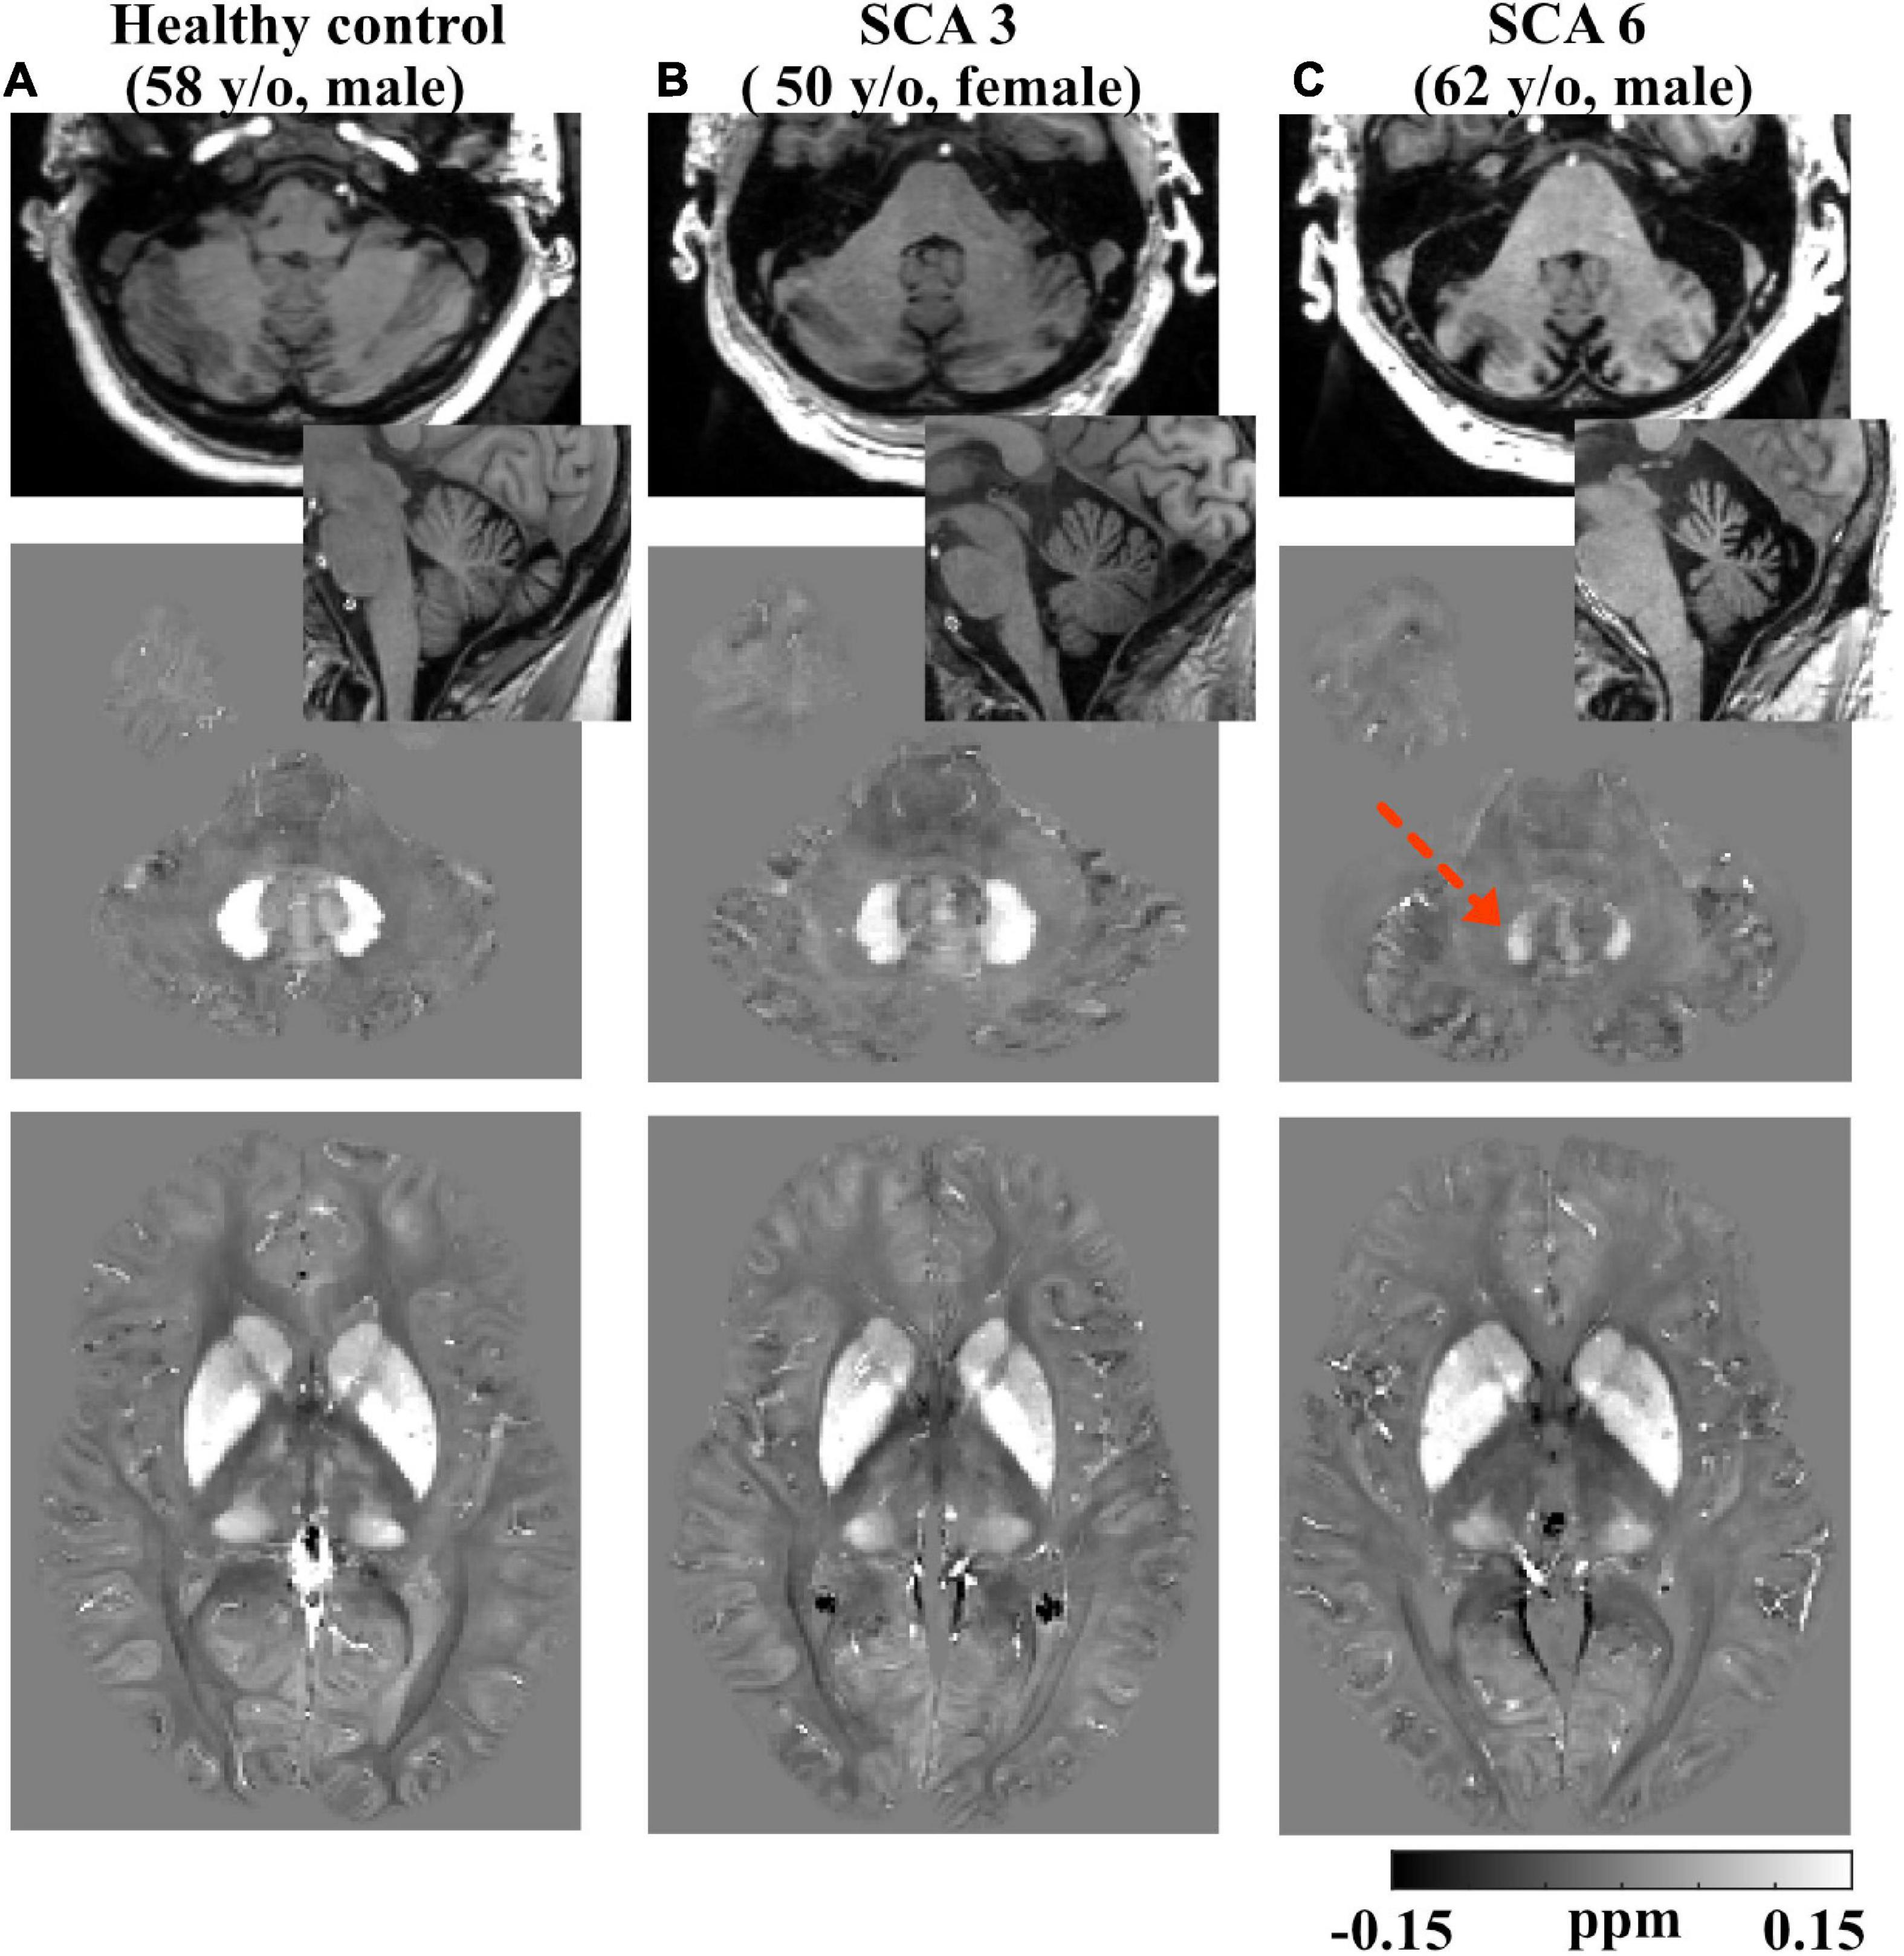
Figure 2. Example T1-weighted and QSM images. Row 1: axial and sagittal T1-weighted images showing smaller total cerebellar volume in a (62 y/o, M) SCA6 subject (C) vs. a (50 y/o, F) SCA3 subject (B) and a (58 y/o, M) healthy control subject (A); slight atrophy in cerebellum was also observed in SCA3. Row 2: axial QSM images showing the dentate. Dotted arrow denotes lower QSM and atrophied dentate in the SCA6 subject. Row 3: axial QSM showing the basal ganglia. Gray scales in QSM images are in the range of (–0.15, 0.15) ppm. All the images are rigidly transformed to MNI space for better comparison of the same anatomical structures.
Groups were statistically compared on measures of volume, susceptibility mass, and magnetic susceptibility. However, because no corrections were applied for multiple comparisons, these analyses were considered exploratory. Cerebellar dentate volume was reduced in the SCA6 group relative to the SCA3 and control groups (Table 3 and Figure 3). Both SCA groups showed reduced volume in the PT relative to that of controls. The SCA6 group showed markedly lower susceptibility mass values in the cerebellar dentate relative to the SCA3 and control groups (Table 4 and Figure 3). In terms of tissue iron concentration, indicated by magnetic susceptibility, dentate iron concentration was lower in the SCA6 group than in the SCA3 group. The SCA3 group showed higher values in the SN relative to that of the SCA6 and healthy control groups (Supplementary Table 2).
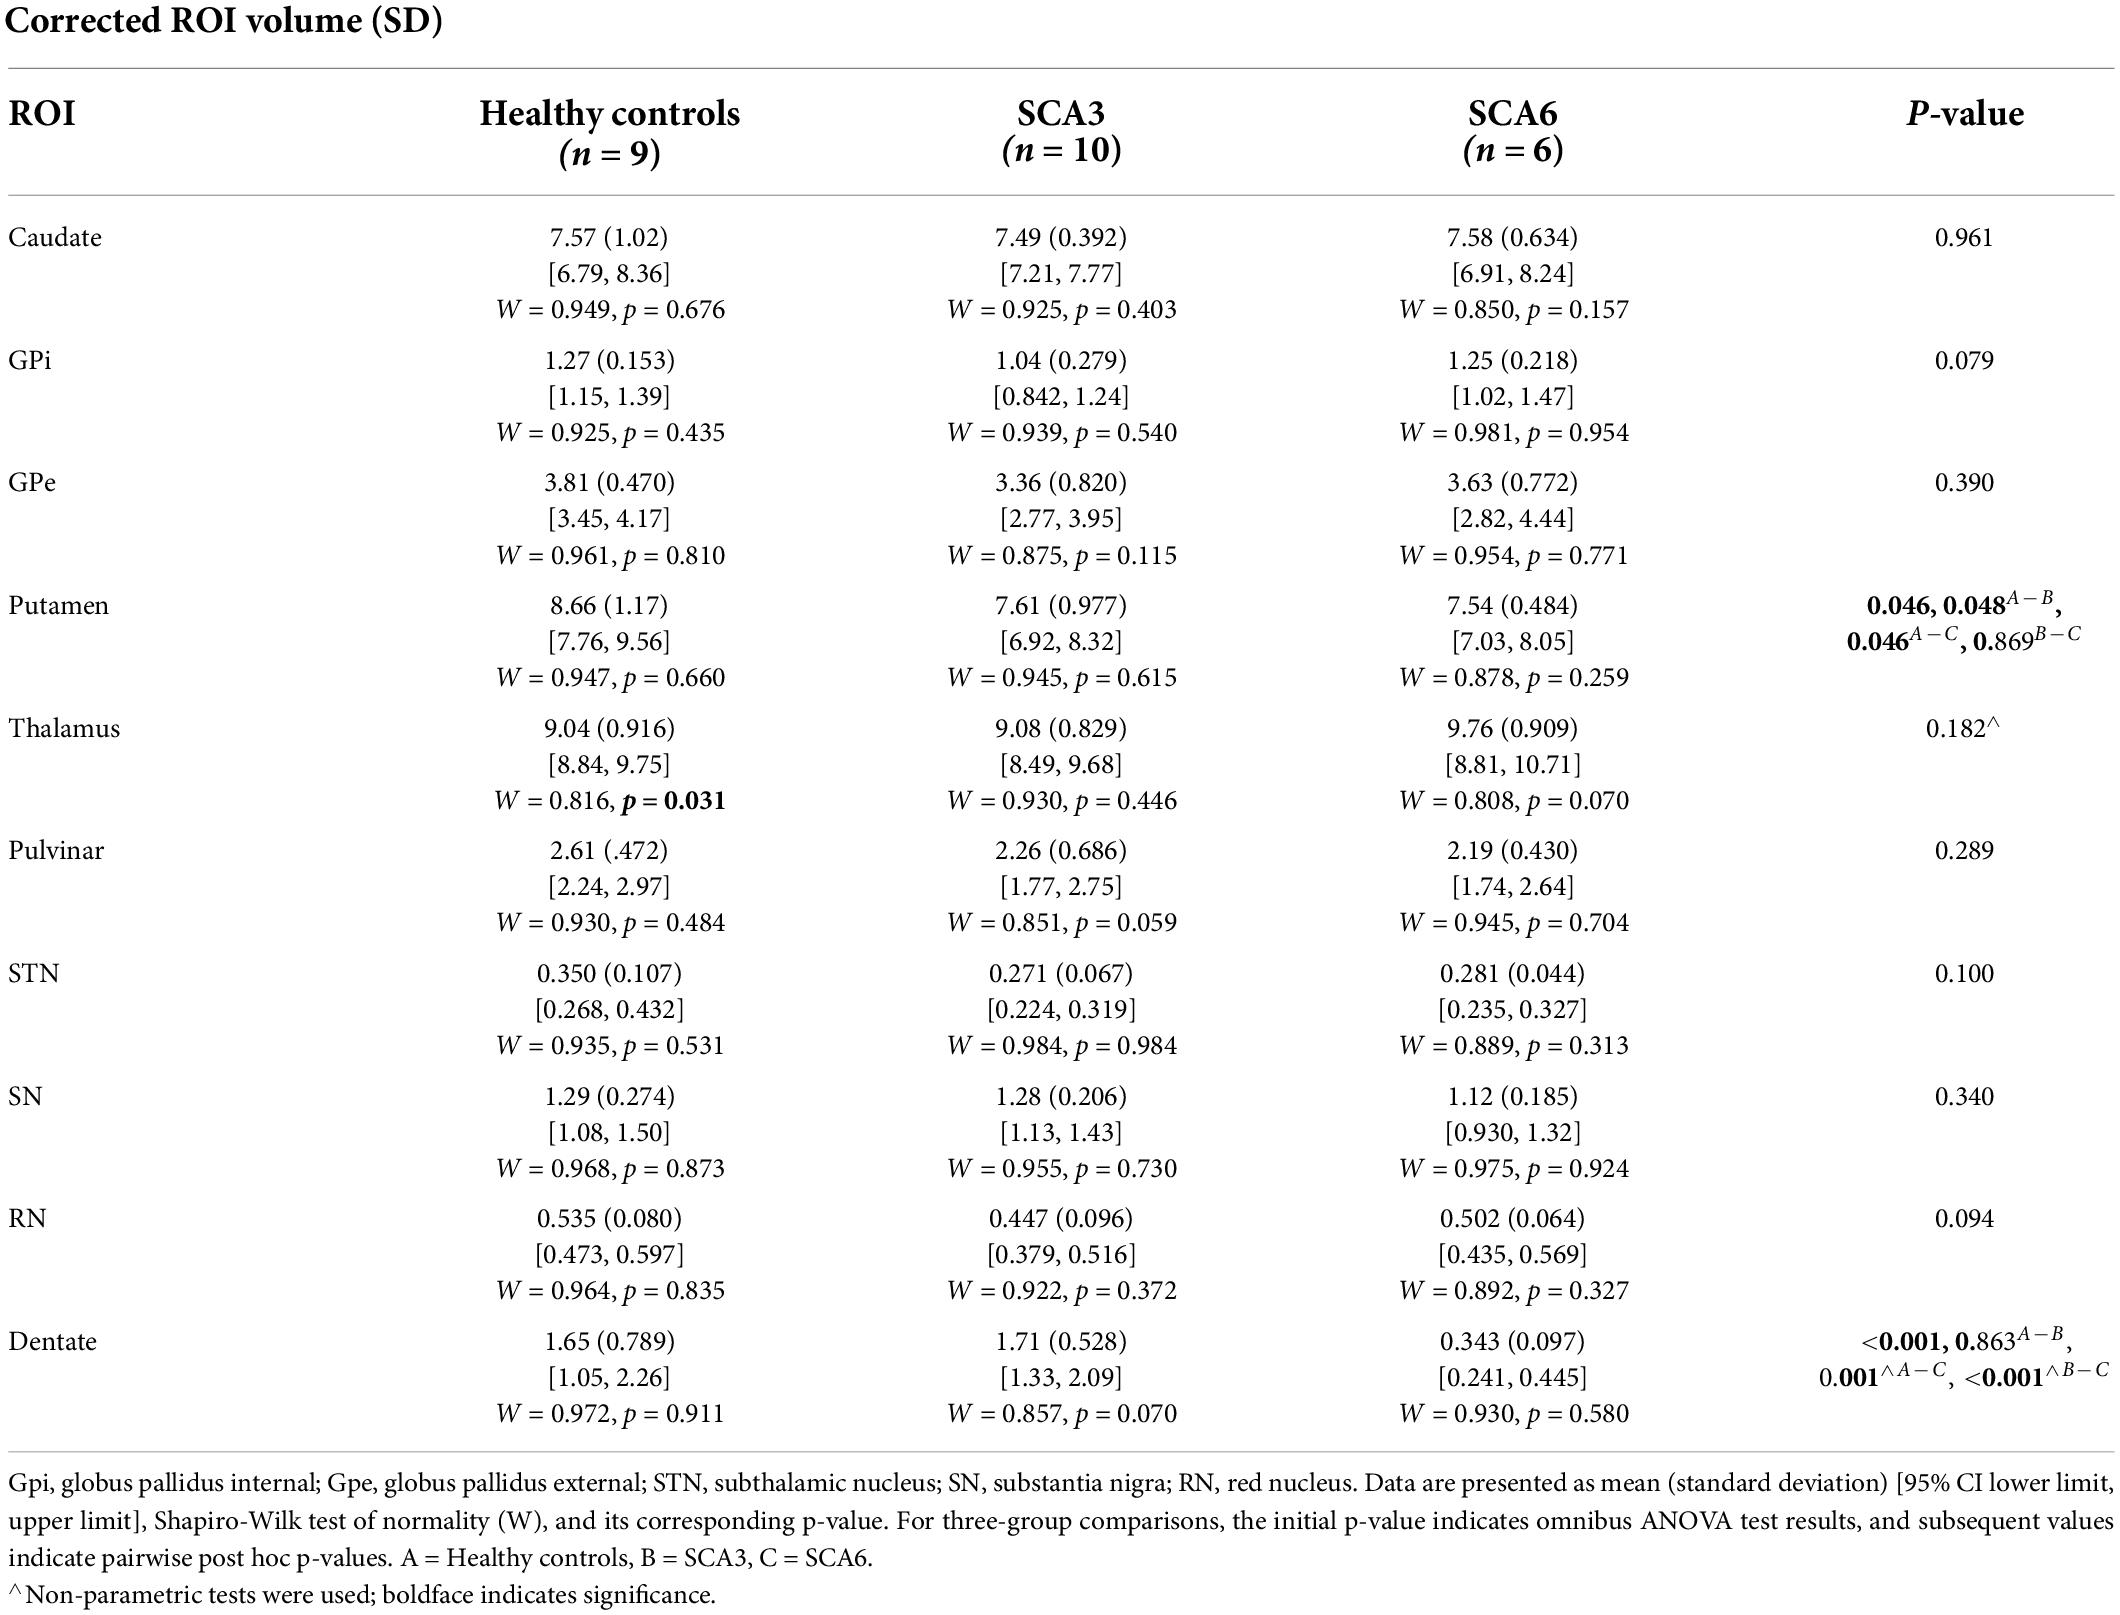
Table 3. Corrected ROI volumes (in the unit of 103 mm3) compared across groups.
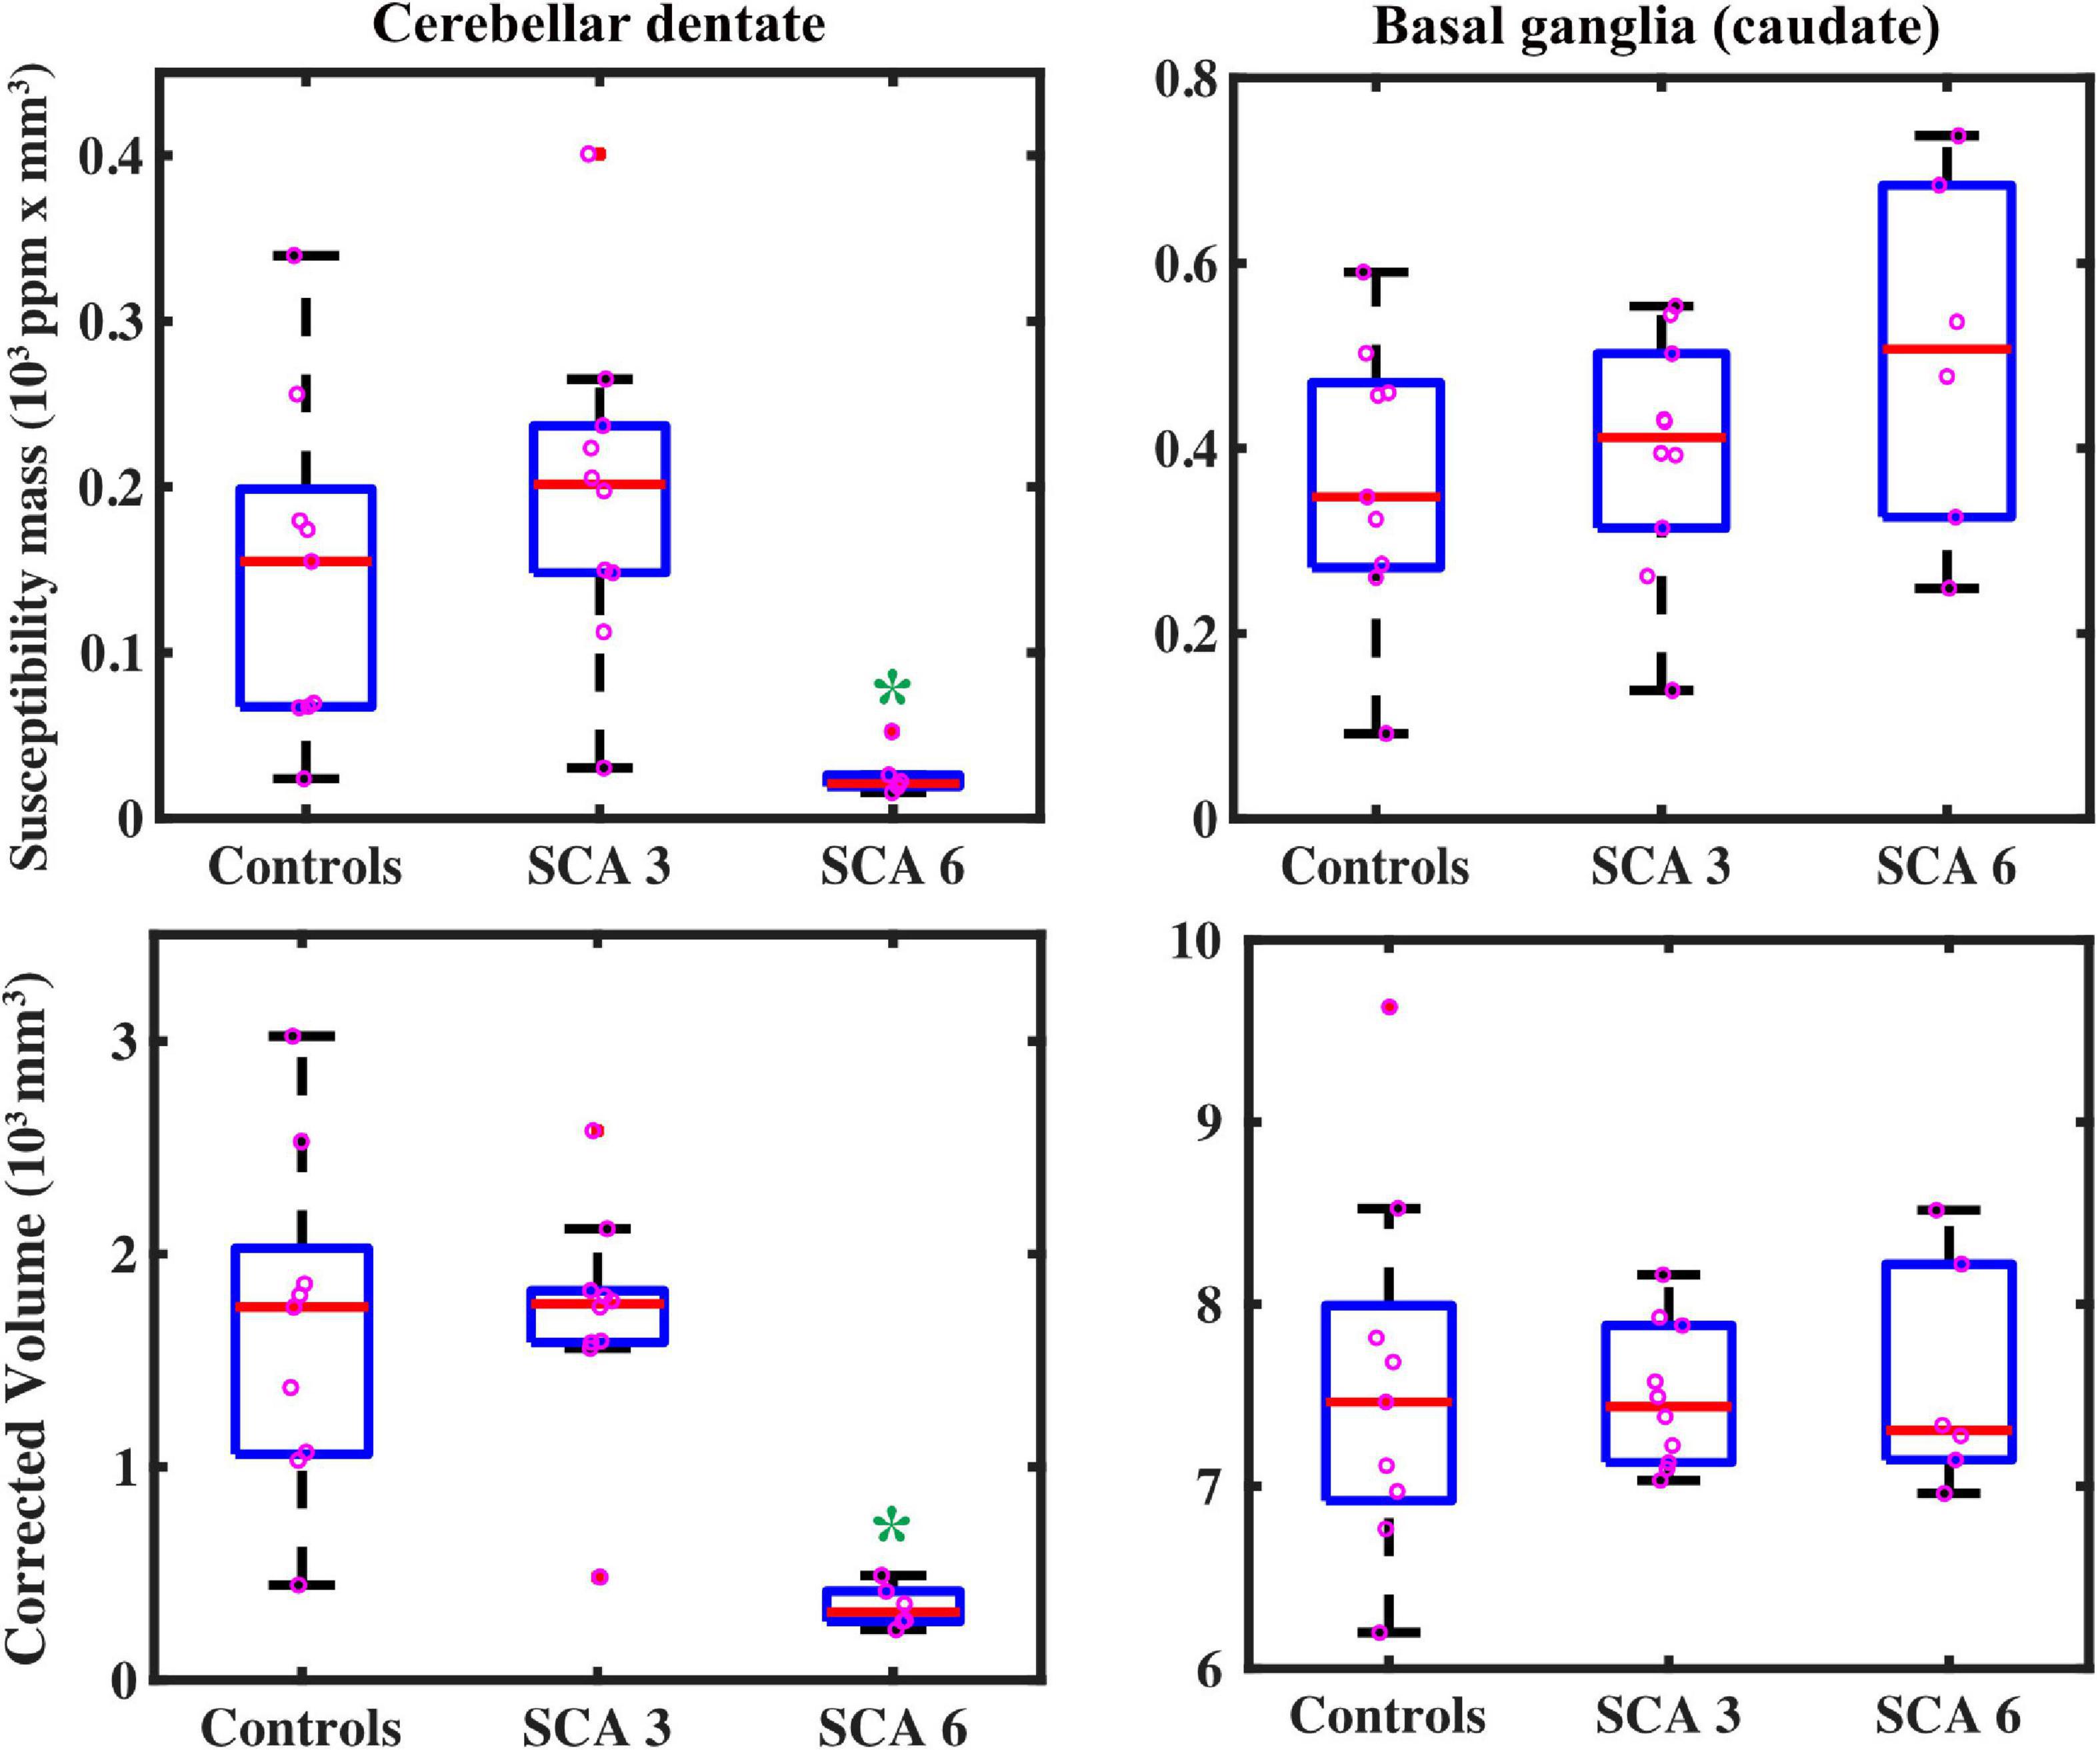
Figure 3. QSM-derived normalized susceptibility mass (mean magnetic susceptibility × Corrected ROI Volume in the unit of 103 ppm × mm3) in the dentate nuclei (top left) showed significant group differences. * = SCA6 < SCA3 (p < 0.001) and SCA6 < healthy controls (p = 0.002). Group differences were not significant in the basal ganglia (using caudate as a proxy, top right) SCA6 = SCA3 = healthy controls (p = 0.26). Volume measures showed similar results: in the dentate (bottom left), * = SCA6 < SCA3 (p < 0.001) and SCA6 < healthy controls (p = 0.001); groups did not differ for caudate volume (bottom right), SCA6 = SCA3 = healthy controls (p = 0.96), but SCA6 = SCA3 < healthy controls in the putamen (p = 0.046, see Table 3). Boxplots represent first (Q1) and third (Q3) quartiles; bars indicate minimum (Q0) and maximum (Q4) values, excluding outliers; red lines represent the median.
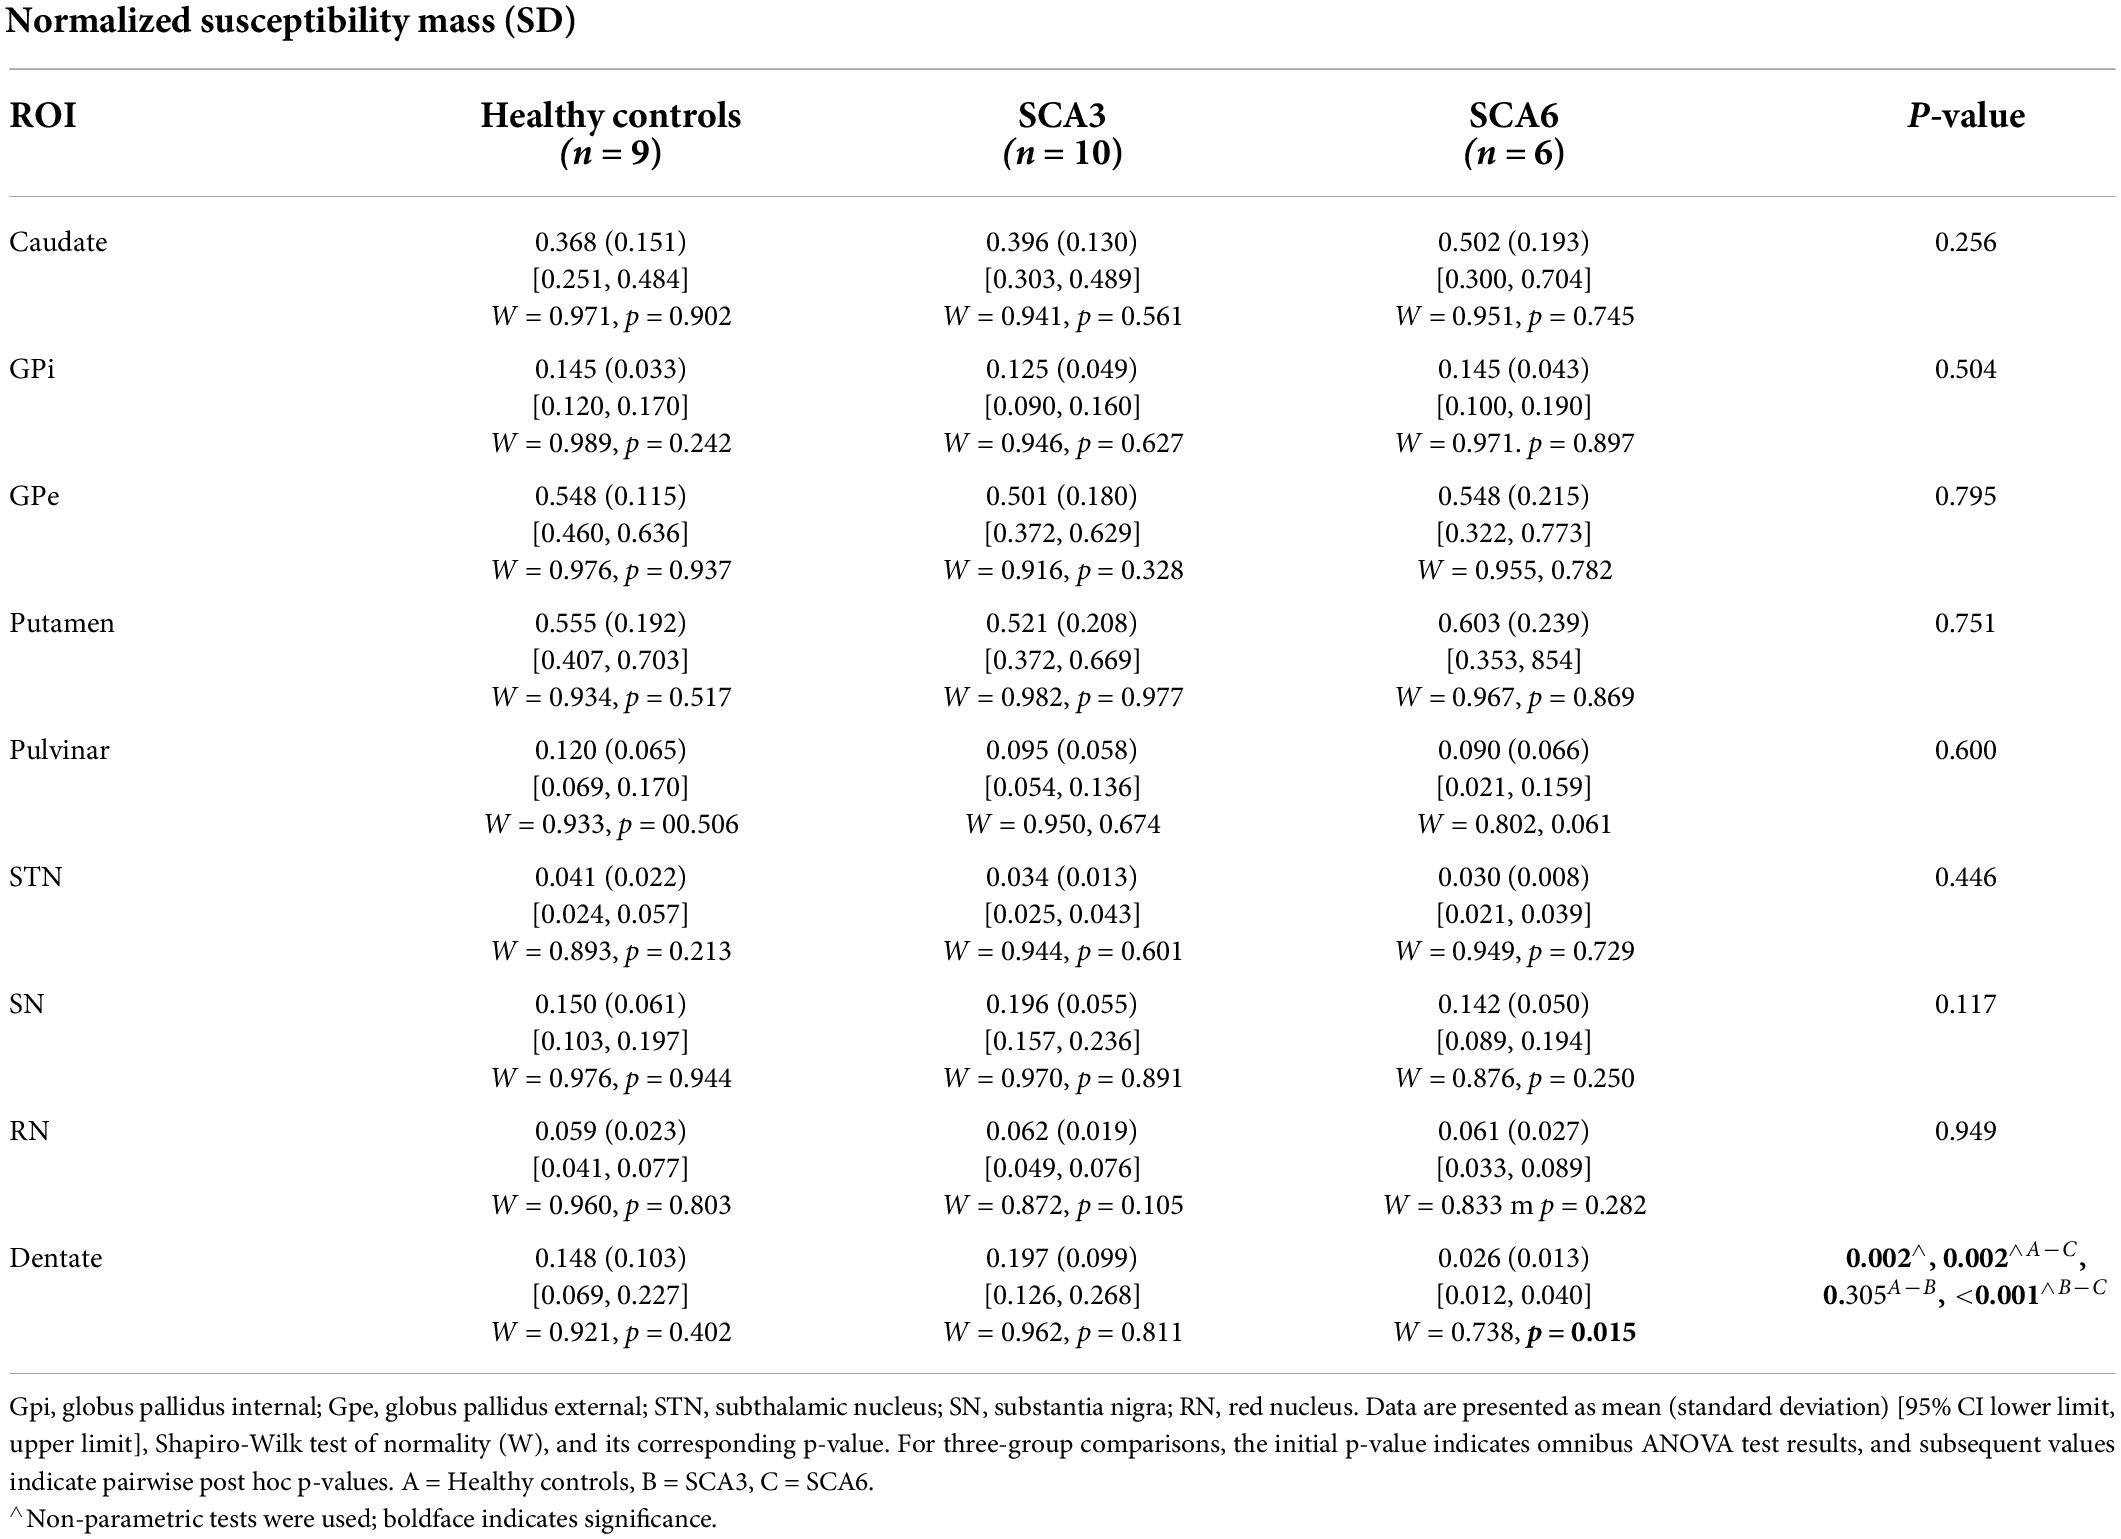
Table 4. Normalized susceptibility mass (in the unit of 103 ppm × mm3) for ROIs compared across groups.
Susceptibility mass associations among the regions of interests
Within each studied group, susceptibility mass values within ROIs were correlated to each other showing regional patterns of iron deposition (Figure 4). In controls, much of the ROIs positively correlated with each other, indicating cohesive iron accumulation. In particular, susceptibility mass in the dentate positively correlated with values in the CN, PT, and STN. The SCA3 group followed this general pattern but with less consistency (i.e., less often met statistical threshold) among the ROIs. Unlike in controls, the SCA3 group’s correlations of susceptibility mass involving the dentate were significantly positive with the GPe only. The SCA6 group also followed this general pattern of positive associations among the ROIs, with the marked exception of the cerebellar dentate, in which associations with other ROIs were not significant and actually skewed toward the negative direction. This contrasted with the dentate-related associations observed in the SCA3 and control groups.
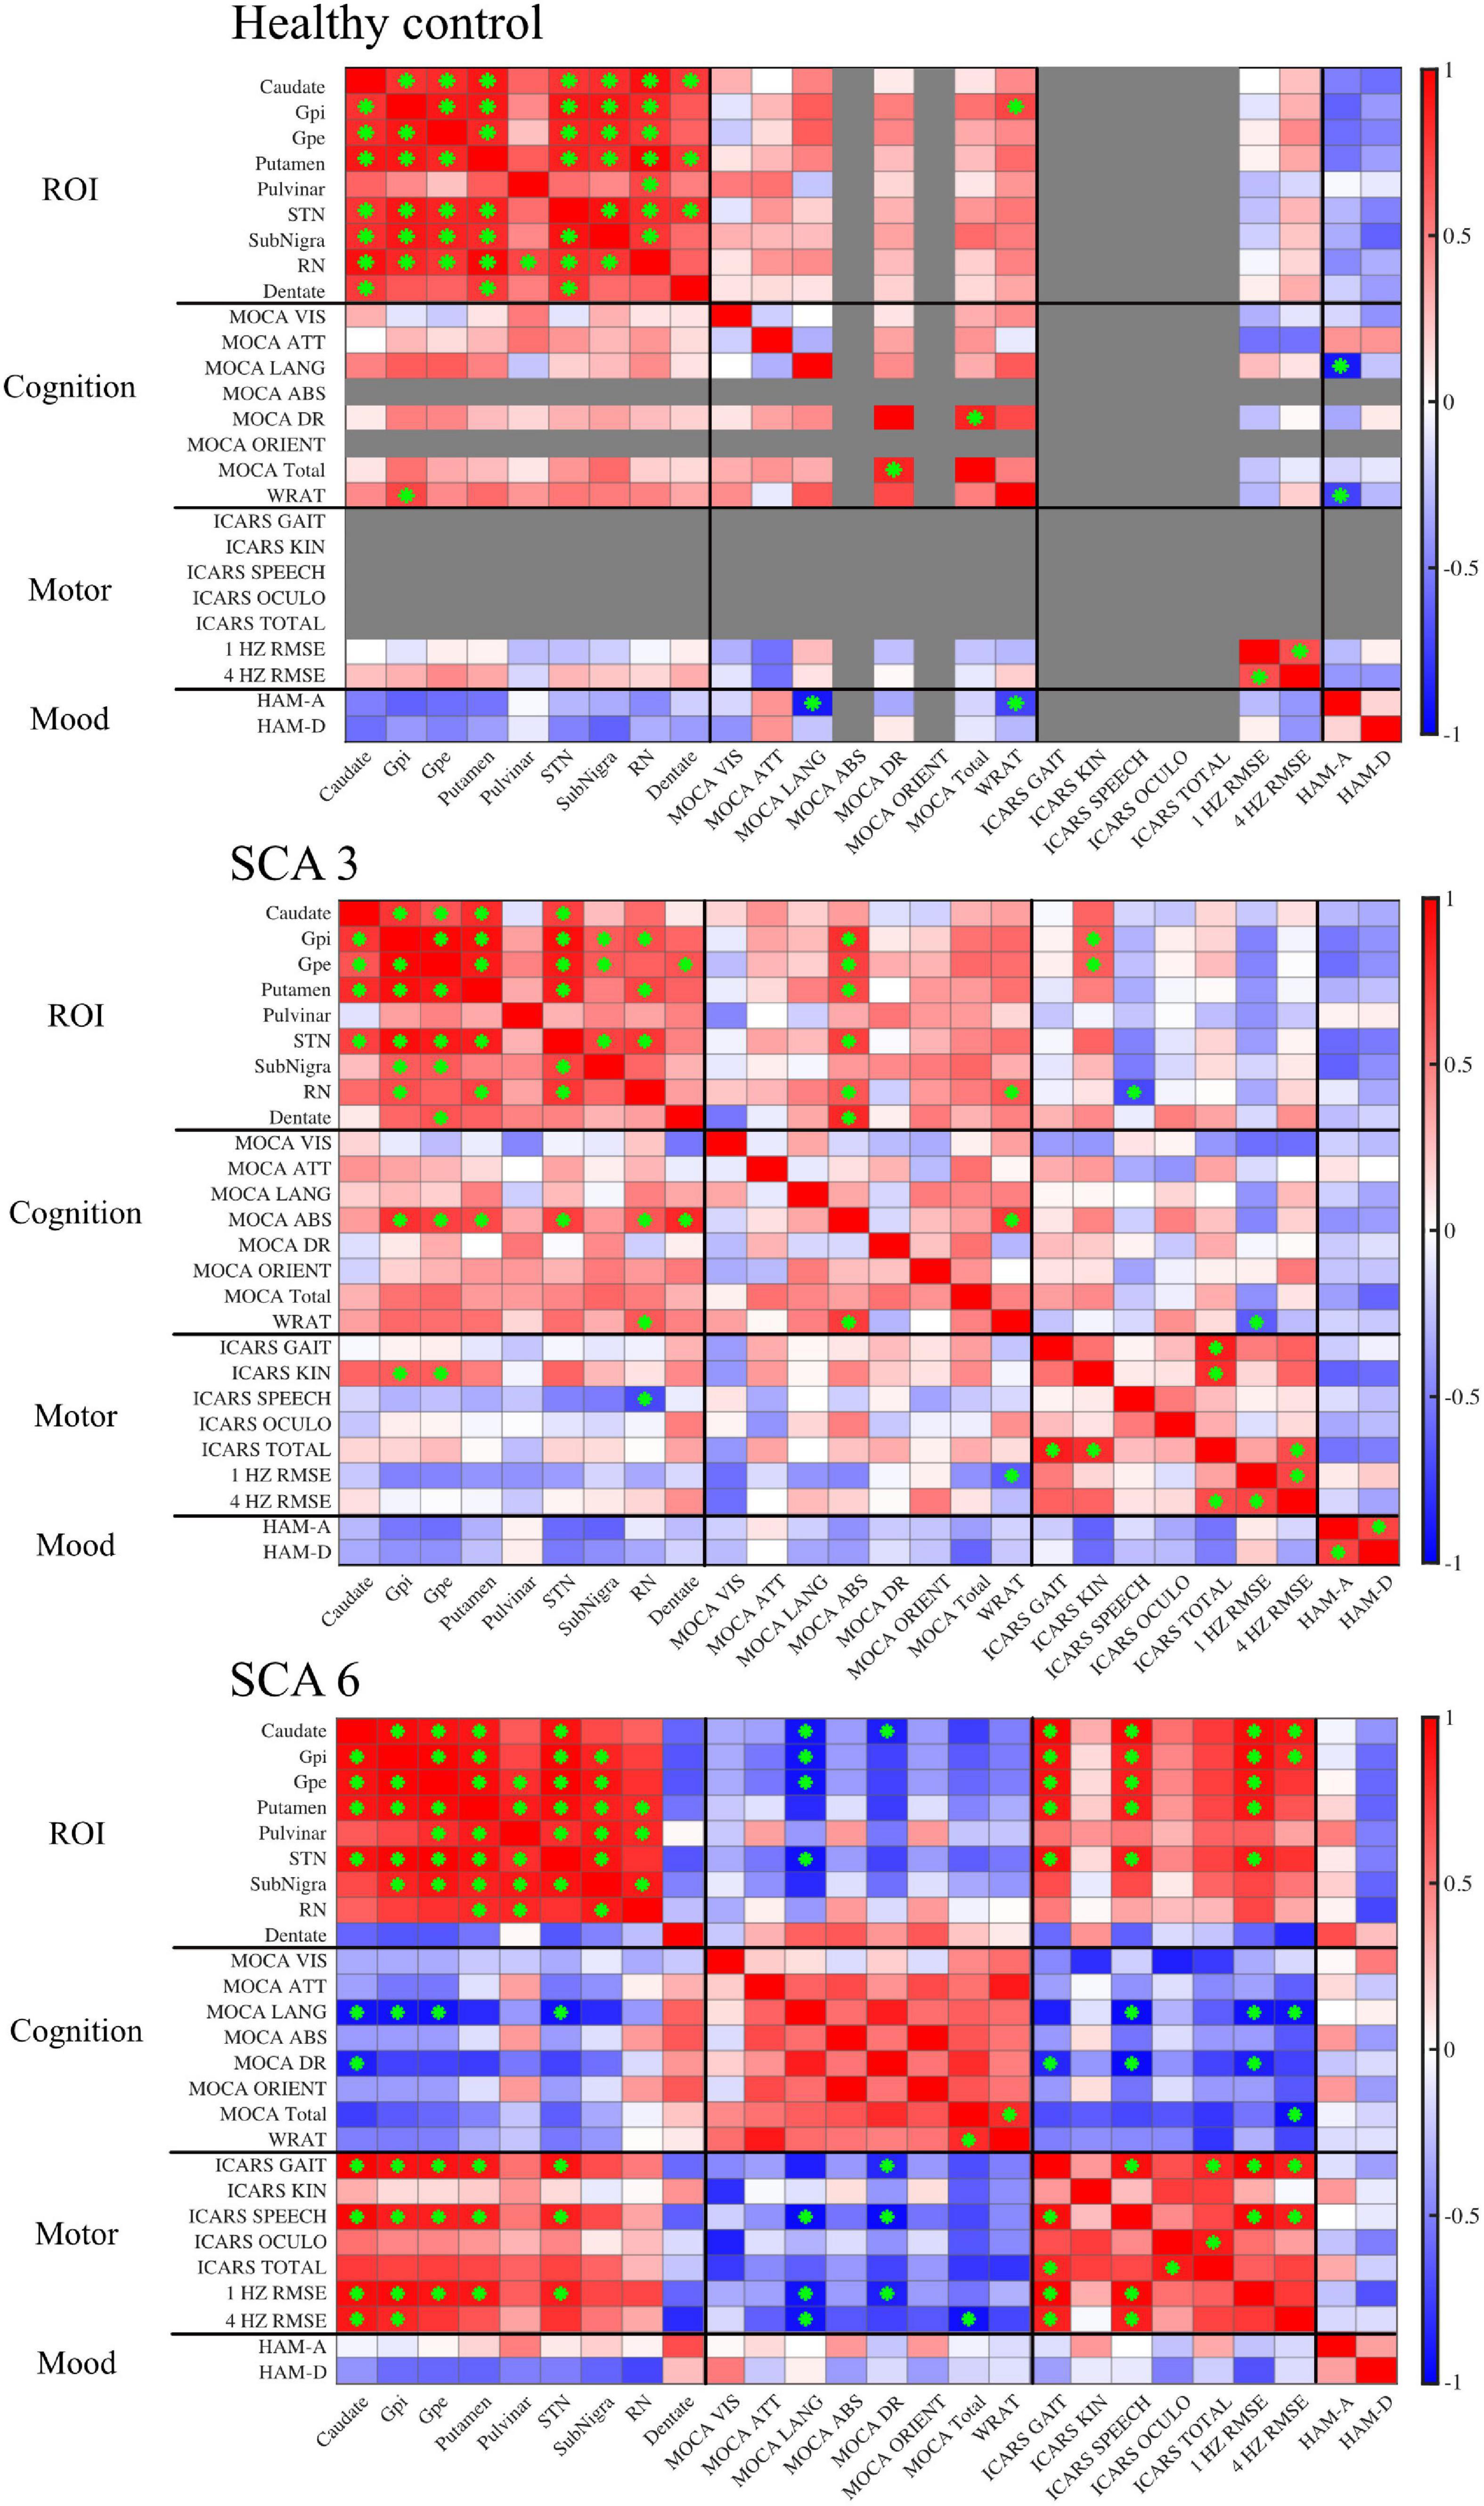
Figure 4. Correlation matrices show associations between QSM-derived normalized susceptibility mass (mean magnetic susceptibility × Corrected ROI Volume in the unit of 103ppm × mm3) in the ROIs and cognitive, motor, and mood assessments. Red, positive correlation; blue, negative correlation. Green asterisk indicates p-value < 0.05. In controls, scores were grayed out when there was no measurement (ICARS) or no variability across participants (MOCA abstract thinking and orientation). MOCA naming was excluded altogether because there was no score variability for all three groups. Gpi, globus pallidus internal; Gpe, globus pallidus external; STN, subthalamic nucleus; SN, substantia nigra; RN, red nucleus.
Susceptibility mass associations with supplemental variables
Supplemental test scores were correlated to susceptibility mass in the selected ROIs within each group (Figure 4). A pattern of negative correlations (higher cognitive function at lower susceptibility mass) was revealed in the SCA6 group between the MOCA language sub-scale and susceptibility mass in the CN, GPi, GPe, and STN. It was notable that associations between language scores and susceptibility mass skewed in a positive direction for the dentate, underscoring the inverse relationship between the dentate and other ROIs in SCA6. Delayed recall sub-scale scores negatively correlated with susceptibility mass in the CN. In the SCA3 group, abstract thinking sub-scale scores positively correlated with susceptibility mass in the GPi, GPe, PT, STN, RN, and dentate. Controls did not show correlations between MOCA scores and ROI susceptibility mass values.
For ICARS scores, in the SCA6 group, positive correlations were observed between the gait and speech sub-scales and susceptibility mass in the CN, GPi, GPe, PT, and STN. The SCA3 group revealed a different pattern of results. Kinetic sub-scale scores positively correlated with susceptibility mass in the GPi and GPe; speech sub-scale scores negatively correlated with susceptibility mass in the RN.
The WRAT, RMSE of finger tapping at 1 and 4 Hz, HAM-A, and HAM-D scores were also correlated to susceptibility mass. In the SCA6 group, RMSE of finger tapping positively correlated to susceptibility mass in the CN, GPi, GPe, PT, and STN. In the SCA3 group, WRAT scores positively correlated with susceptibility mass in the RN. Controls showed positive associations between the WRAT and GPi susceptibility mass. Significant associations of susceptibility mass and mood scales and number of CAG repeats (not shown) were not observed.
Given the low sample size, scatterplots were visually inspected to ensure that results were not skewed by one or two participants, as shown in Figure 5.
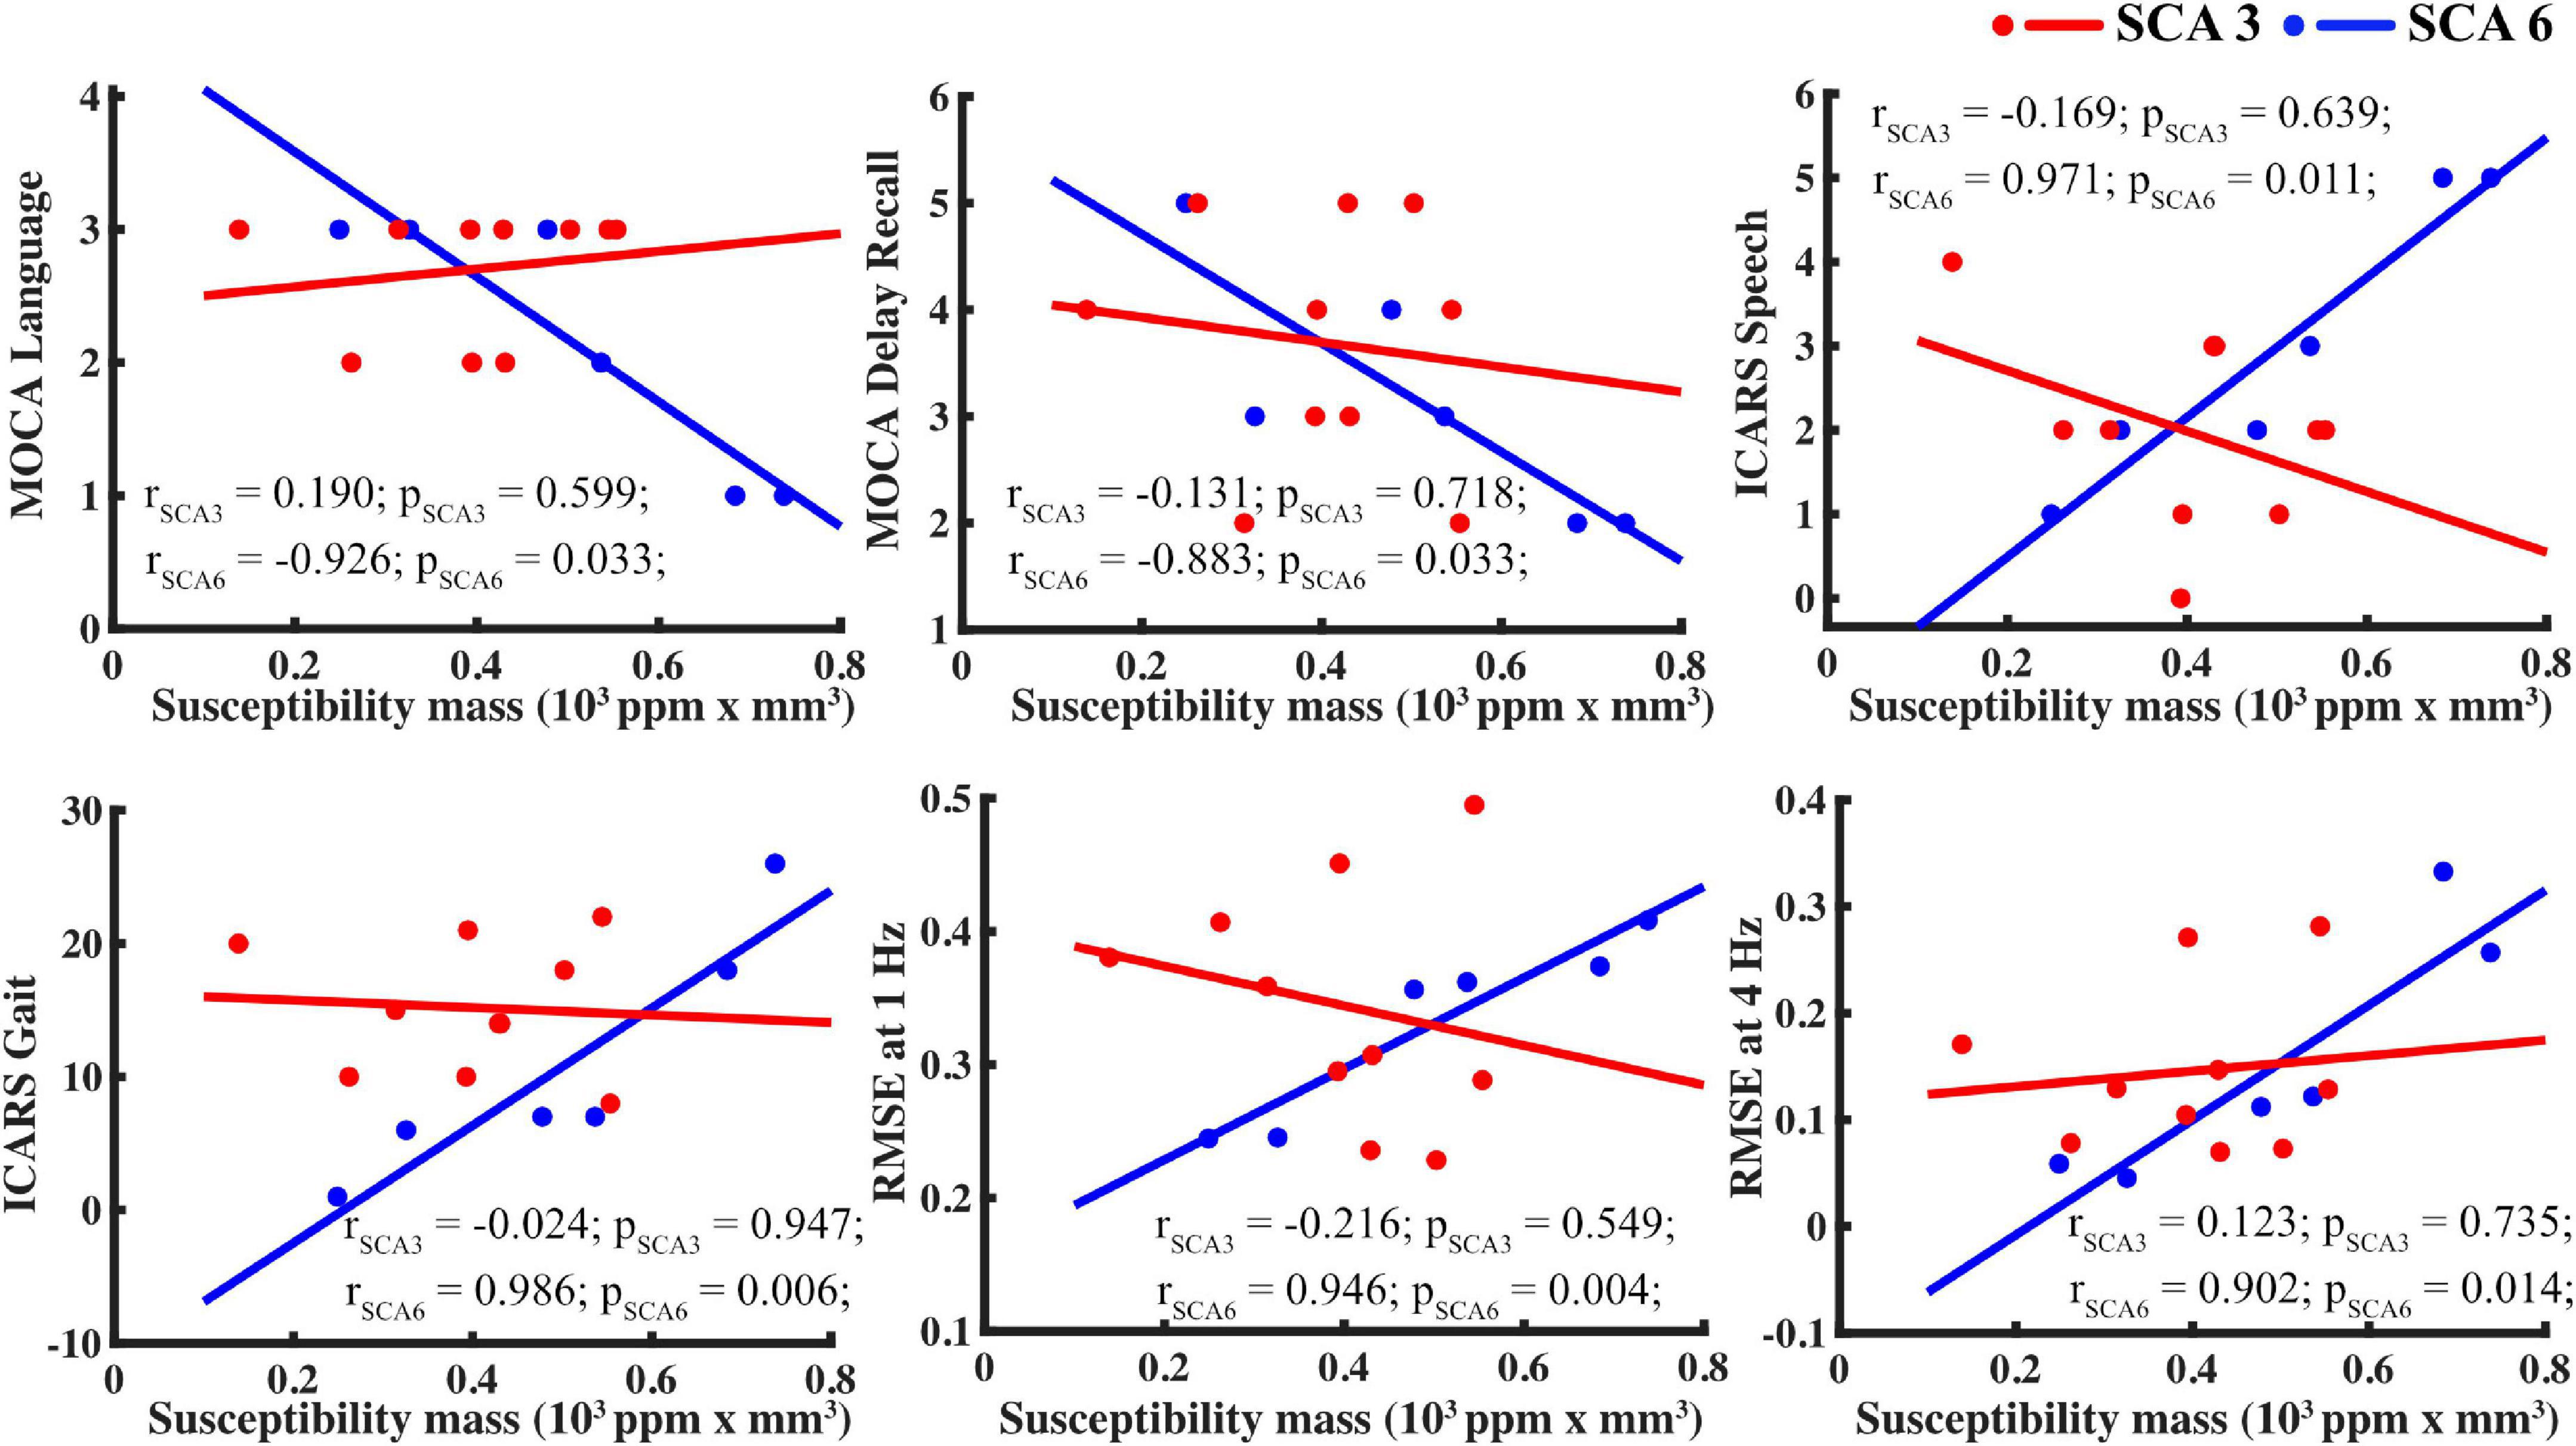
Figure 5. For SCA6 but not SCA3, susceptibility mass in the basal ganglia (using the caudate as proxy) correlated with supplemental measures. Tasks, clockwise from upper left: MOCA language, MOCA delayed recall, ICARS speech, finger tapping RMSE at 4 and 1 Hz, and ICARS gait.
Impact of magnetic susceptibility and structural volume on associations with susceptibility mass
Because regional iron content (indicated by susceptibility mass) is dependent upon tissue iron levels/concentrations (indicated by magnetic susceptibility) and structural volume, correlations were conducted within each group that examined magnetic susceptibility separately from volume (see Supplementary Figure 1). As expected, correlations between ROIs with respect to magnetic susceptibility and structure volume often tracked together, yet some differences were evident. In the control group, there were notably fewer ROI correlations for volume than for susceptibility. In the SCA3 group, associations among the ROIs differed such that those among the CN, GPi, GPe, and PT were more influenced by susceptibility, whereas those among the STN, SN, and RN were more influenced by volume. Moreover, associations between the ROIs susceptibility mass and motor scores (e.g., ICARS and tapping) were generally volume-driven (comparing Figure 4 and Supplementary Figure 1). In the SCA6 group, associations among the ROIs, as well as between the ROIs susceptibility mass and motor scores and cognitive scores (e.g., MOCA and WRAT), appeared to be driven by susceptibility over volume. Similar to the susceptibility mass analysis (Figure 4), dentate magnetic susceptibility associations presented in the opposite direction from the other ROIs (Supplementary Figure 1A). When dentate susceptibility values were high, cognitive and motor scores skewed toward more favorable outcomes (i.e., higher MOCA scores, lower ICARS scores). The opposite pattern was observed for the BG ROIs, in which higher susceptibility values skewed toward less favorable outcomes (i.e., lower MOCA scores and higher ICARS scores). This relationship supports the iron relocation hypothesis: as iron levels deplete in the dentate and increase in the BG, motor function and cognition becomes impaired in SCA6.
After controlling for age, we found that susceptibility mass in the dentate and BG regions (CN, PT, and STN) positively correlated in controls, skewed toward negative correlations for SCA6, and had no identifiable relationship for SCA3 (Supplementary Table 3).
Discussion
This study examined iron content levels (as indicated by susceptibility mass) within the iron-rich regions of the cerebellar dentate and BG in people with SCA3 and SCA6. Data revealed several findings that distinguished these two patient groups and underscored the relevance of the basal ganglia in SCA. First, dentate susceptibility mass in SCA6 was markedly reduced relative to those found in the SCA3 and control groups. This finding replicates those from a previous study (Deistung et al., 2022), with significant iron loss in the dentate observed in SCA6, but not in SCA3. Second, susceptibility mass levels in BG regions did not differ across groups, but associations with supplemental measures did. In SCA6, higher BG susceptibility mass was associated with lower performance scores on the MOCA language test, higher ICARS scores for gait and speech, and higher error rates during finger tapping at 1 and 4 Hz. In SCA3, these associations were not found; instead, volume appeared to drive associations with the supplemental measures (i.e., larger volumes with higher MOCA scores and lower ICARS scores). Third, in SCA6, the susceptibility mass levels in the dentate were inversely related to susceptibility mass levels in the BG, as were the associations with supplemental measures. Thus, as iron content levels in the dentate depleted, iron content levels rose in the BG, and this shift was associated with decrements in cognitive and motor function. This relationship was not observed in SCA3.
A positive correlation between the BG and dentate susceptibility mass was observed in healthy controls, which likely reflects a common trend of iron deposition during aging in both regions. It is known that non-heme iron accumulates across brain structures over the life span and may play an important role during brain development, aging, and neurodegeneration (Hallgren and Sourander, 1958; Zecca et al., 2004; Li et al., 2014; Persson et al., 2015; Acosta-Cabronero et al., 2016; Zhang et al., 2018). In the current study, when age was taken into account, susceptibility mass of the cerebellar dentate in healthy controls increased alongside that of the BG. By contrast, susceptibility mass in SCA6 decreased in the dentate while it increased in the BG. In SCA3, the susceptibility mass of these regions was not tied to an identifiable pattern of change. These data suggest that iron depositions take different trajectories in the SCAs than in healthy controls, and there may be heterogeneity of iron deposition patterns between these two SCA subtypes.
The mechanisms underlying changes in brain iron levels are only partially understood. Because iron levels are high within oligodendrocytes, iron levels may increase as oligodendrocytes attempt to repair myelin damage, drawing iron to the region (Bartzokis et al., 2007). Inflammation or neuron damage-induced microgliosis could also increase local tissue iron (Mehta et al., 2013; Thomsen et al., 2015). Alternatively, iron levels may decrease as a simple function of iron-rich cell death. Iron concentration can increase if iron content remains steady, but structural volume is reduced due to loss of other cell types with less or no iron. Thus, measures of both iron content and volume are useful for discerning iron deposition and atrophy-induced increase of tissue iron concentration.
In a recent QSM study of SCA iron levels by Deistung et al. (2022), dentate iron content and volume declined in SCA6, without an increase in iron concentration. This suggested a net loss of iron-rich cells in the dentate. Regions like the BG may have the ability to absorb additional iron that is released into the milieu, which has been considered conceptually as “iron relocation,” observed as inversely associated iron levels between two brain regions (Koeppen et al., 2007; Deistung et al., 2022). Moreover, excess iron can lead to cell death through free radicals (Imam et al., 2017). Thus, an interesting potential consequence in SCA6 may be that iron relocates from the dentate to the BG.
Structural volume measures in this study also revealed group differences. The cerebellar dentate was smaller in the SCA6 group than in the SCA3 or healthy control groups, consistent with a recent study that examined the dentate specifically (Deistung et al., 2022). The PT was smaller in both SCA groups relative to the healthy control group. These findings overlapped with several studies reporting atrophy in the PT in SCA3 and/or SCA6 (Schulz et al., 2010; D’Abreu et al., 2012, Reetz et al., 2013; De Rezende et al., 2015); however, those studies also found atrophy in the CN, which was not observed here. Atrophy in the GP for SCA3 has also been reported (D’Abreu et al., 2012; De Rezende et al., 2015), which was at trend level (p = 00.079) in the current study. The sample sizes of SCA3 participants for those studies were larger than in the current study (range: 19–47), which may explain, in part, different results. Our analyses revealed that structural volumes had more influence in SCA3 than iron did, with increased atrophy of the CN, GPi, GPe, PT, and RN correlating with greater severity of motor impairments.
Basal ganglia susceptibility mass in SCA6 correlated with several aspects of speech and language in the ICARS and MOCA assessments. The sample size was small, and these results should be considered tentatively. Yet, current evidence indicates that the cerebellum and BG each play an important role in speech motor control (Cannito and Marquardt, 1997; Ackermann and Hertrich, 2000; Riecker et al., 2005). This aspect of motor function was assessed directly by the ICARS by asking participants to repeat a phonetically challenging phrase and considering other informal verbal communications throughout the exam. The cerebellum and BG also play an important role in language functions that extend beyond frank motor skills, such as working memory and fluency (Chen and Desmond, 2005; Booth et al., 2007; Marvel and Desmond, 2010, 2012; Silveri, 2021). The MOCA language assessment was based on one’s ability to repeat syntactically complex sentences, therefore relying more on comprehension, memory, and fluency than on motor speech. In SCA6, MOCA language scores correlated with ICARS speech scores and finger tapping errors, suggesting that these tasks drew upon similar underlying processes, and elevated iron content influenced this process, namely, in the CN, GPi, GPe, PT, and STN. Interestingly, MOCA and ICARS scores did not correlate in SCA3, which may be indirectly related to a decreased role for iron content in SCA3. Overall, data from this study indicate that the integrity of the BG contributes to speech and language ability in SCA6. This finding is compelling and warrants further investigation.
An obvious limitation of the present study is the relatively small sample size for each SCA group, which may have hampered our ability to discover small effects in terms of brain iron changes, e.g., in the SCA3 group, but our findings were generally consistent with previous studies of larger sample sizes in the same patient populations. Also, the SCA group was on medications that may have impacted performance. However, there are no known effects of these medications on iron deposition. With these limitations in mind, the associations observed between BG iron with motor and cognitive function in SCA6 suggest the potential for using brain iron deposition profiles outside of the cerebellum dentate, with particular attention to the BG, to assess disease states in cerebellar ataxia.
Another potential study limitation was that the selected region of interest for the DN in the present study included the bulk iron-rich region (Figure 1; as also defined in Deistung et al., 2022) instead of the dentate silhouette commonly marked in histology, which could lead to overestimations of the volume and iron content in the DN. However, this should affect all the groups in the same way, so the major conclusions are not expected to change. It should also be noted that QSM measures are not specific to iron and could include contributions from other paramagnetic materials, such as copper or manganese, even though large changes of these are not known to occur in the SCAs. In addition, potential changes in diamagnetic myelin content, e.g., in the thalamus, could also affect QSM measures in those myelin rich regions (Liu et al., 2011; Li et al., 2016); therefore, the potential for thalamic demyelination and atrophy in SCA6 to lead to higher susceptibility and greater motor impairments (as in Supplementary Figure 1) cannot be excluded. Separation of subvoxel paramagnetic and diamagnetic sources, e.g., iron vs. myelin, using more advanced multi-contrast modeling in the future could further help shed light on the underlying pathophysiology (Chen J. J. et al., 2021; Shin et al., 2021).
The results of this study could support or help guide future treatments in SCA. Given the emergence of iron chelating treatments in neurodegenerative diseases (Boddaert et al., 2007; Suzuki et al., 2013), in vivo measures of brain iron levels are a logical pre-clinical step toward establishing the feasibility of such treatments in humans. Future studies with larger sample sizes and longitudinal follow-up are warranted.
Data availability statement
The raw data supporting the conclusions of this article will be made available by the authors, without undue reservation.
Ethics statement
The studies involving human participants were reviewed and approved by the Johns Hopkins Institutional Review Board. The patients/participants provided their written informed consent to participate in this study.
Author contributions
CM, KI, OM, SL, and JL performed the material preparation and data collection. LC and XL performed the QSM data processing. CM, LC, MJ, and OM performed the statistical analyses. CM, LC, MJ, and XL wrote the first draft of the manuscript. All authors commented on previous versions of the manuscript, read and approved the final manuscript, and contributed to the study conceptualization and design.
Funding
This work was supported by the National Institutes of Health (NIH/NIBIB, P41EB031771), the National Ataxia Foundation, and the Gordon and Marilyn Macklin Foundation. The MRI equipment in this study was funded by the NIH grant: 1S10ODO21648.
Acknowledgments
We would like to thank Adrian Paez and Jun Hua for their help with MRI data acquisition.
Conflict of interest
The authors declare that the research was conducted in the absence of any commercial or financial relationships that could be construed as a potential conflict of interest.
Publisher’s note
All claims expressed in this article are solely those of the authors and do not necessarily represent those of their affiliated organizations, or those of the publisher, the editors and the reviewers. Any product that may be evaluated in this article, or claim that may be made by its manufacturer, is not guaranteed or endorsed by the publisher.
Supplementary material
The Supplementary Material for this article can be found online at: https://www.frontiersin.org/articles/10.3389/fnins.2022.919765/full#supplementary-material
Footnotes
References
Abdul-Rahman, H., Gdeisat, M., Burton, D., and Lalor, M. (2005). Fast three-dimensional phase-unwrapping algorithm based on sorting by reliability following a non-continuous path. Optical Metrol. 5856, 32–40. doi: 10.1364/ao.41.007437
Ackermann, H., and Hertrich, I. (2000). The contribution of the cerebellum to speech processing. J Neurolinguist. 13, 95–116. doi: 10.1016/S0911-6044(00)00006-3
Acosta-Cabronero, J., Betts, M. J., Cardenas-Blanco, A., Yang, S., and Nestor, P. J. (2016). In vivo MRI mapping of brain iron deposition across the adult lifespan. J. Neurosci. 36, 364–374. doi: 10.1523/JNEUROSCI.1907-15.2016
Avants, B. B., Tustison, N. J., Wu, J., Cook, P. A., and Gee, J. C. (2011). An open source multivariate framework for n-tissue segmentation with evaluation on public data. Neuroinformatics 9, 381–400. doi: 10.1007/s12021-011-9109-y
Ayton, S., Fazlollahi, A., Bourgeat, P., Raniga, P., Ng, A., Lim, Y. Y., et al. (2017). Cerebral quantitative susceptibility mapping predicts amyloid-beta-related cognitive decline. Brain 140, 2112–2119. doi: 10.1093/brain/awx137
Ayton, S., Wang, Y., Diouf, I., Schneider, J. A., Brockman, J., Morris, M. C., et al. (2019). Brain iron is associated with accelerated cognitive decline in people with Alzheimer pathology. Mol. Psychiatry. 25, 2932–2941. doi: 10.1038/s41380-019-0375-7
Bao, L., Li, X., Cai, C., Chen, Z., and Van Zijl, P. C. (2016). Quantitative susceptibility mapping using structural feature based collaborative reconstruction (SFCR) in the human brain. IEEE Trans. Med. Imaging 35, 2040–2050. doi: 10.1109/TMI.2016.2544958
Bartzokis, G., Lu, P. H., Tishler, T. A., Fong, S. M., Oluwadara, B., Finn, J. P., et al. (2007). Myelin breakdown and iron changes in Huntington’s disease: pathogenesis and treatment implications. Neurochem. Res. 32, 1655–1664. doi: 10.1007/s11064-007-9352-7
Bilgic, B., Fan, A. P., Polimeni, J. R., Cauley, S. F., Bianciardi, M., Adalsteinsson, E., et al. (2014). Fast quantitative susceptibility mapping with L1-regularization and automatic parameter selection. Magn. Reson. Med. 72, 1444–1459. doi: 10.1002/mrm.25029
Boddaert, N., Le Quan Sang, K. H., Rötig, A., Leroy-Willig, A., Gallet, S., Brunelle, F., et al. (2007). Selective iron chelation in Friedreich ataxia: biologic and clinical implications. Blood 110, 401–408. doi: 10.1182/blood-2006-12-065433
Booth, J. R., Wood, L., Lu, D., Houk, J. C., and Bitan, T. (2007). The role of the basal ganglia and cerebellum in language processing. Brain Res. 1133, 136–144. doi: 10.1016/j.brainres.2006.11.074
Bostan, A. C., and Strick, P. L. (2018). The basal ganglia and the cerebellum: nodes in an integrated network. Nat. Rev. Neurosci. 19, 338–350. doi: 10.1038/s41583-018-0002-7
Bürk, K., Abele, M., Fetter, M., Dichgans, J., Skalej, M., Laccone, F., et al. (1996). Autosomal dominant cerebellar ataxia type I clinical features and MRI in families with SCA1, SCA2 and SCA3. Brain 119(Pt. 5), 1497–1505. doi: 10.1093/brain/119.5.1497
Cannito, M. P., and Marquardt, T. P. (1997). Clinical Management of Sensorimotor Speech Disorders. New York, NY: Thieme.
Chen, J. J., Gong, N. J., Chaim, K. T., Otaduy, M. C. G., and Liu, C. L. (2021). Decompose quantitative susceptibility mapping (QSM) to sub-voxel diamagnetic and paramagnetic components based on gradient-echo MRI data. Neuroimage 242:118477. doi: 10.1016/j.neuroimage.2021.118477
Chen, L., Soldan, A., Oishi, K., Faria, A., Zhu, Y., Albert, M., et al. (2021). Quantitative susceptibility mapping of brain iron and beta-amyloid in MRI and PET relating to cognitive performance in cognitively normal older adults. Radiology 298, 353–362. doi: 10.1148/radiol.2020201603
Chen, S. H., and Desmond, J. E. (2005). Temporal dynamics of cerebro-cerebellar network recruitment during a cognitive task. Neuropsychologia 43, 1227–1237. doi: 10.1016/j.neuropsychologia.2004.12.015
Cobzas, D., Sun, H., Walsh, A. J., Lebel, R. M., Blevins, G., and Wilman, A. H. (2015). Subcortical gray matter segmentation and voxel-based analysis using transverse relaxation and quantitative susceptibility mapping with application to multiple sclerosis. J. Magn. Reson. Imaging 42, 1601–1610. doi: 10.1002/jmri.24951
D’Abreu, A., França, M. C. JR., Yasuda, C. L., Campos, B. A., Lopes-Cendes, I., and Cendes, F. (2012). Neocortical atrophy in Machado-Joseph disease: a longitudinal neuroimaging study. J Neuroimaging 22, 285–291. doi: 10.1111/j.1552-6569.2011.00614.x
De Rezende, T. J., D’abreu, A., Guimarães, R. P., Lopes, T. M., Lopes-Cendes, I., Cendes, F., et al. (2015). Cerebral cortex involvement in Machado-Joseph disease. Eur. J. Neurol. 22, e23–e24. doi: 10.1111/ene.12559
Deistung, A., Jäschke, D., Draganova, R., Pfaffenrot, V., Hulst, T., Steiner, K. M., et al. (2022). Quantitative susceptibility mapping reveals alterations of dentate nuclei in common types of degenerative cerebellar ataxias. Brain Commun. 4:fcab306 doi: 10.1093/braincomms/fcab306
Deistung, A., Schafer, A., Schweser, F., Biedermann, U., Turner, R., and Reichenbach, J. R. (2013). Toward in vivo histology: a comparison of quantitative susceptibility mapping (QSM) with magnitude-, phase-, and R2*-imaging at ultra-high magnetic field strength. Neuroimage 65, 299–314. doi: 10.1016/j.neuroimage.2012.09.055
Deistung, A., Schweser, F., and Reichenbach, J. R. (2017). Overview of quantitative susceptibility mapping. NMR Biomed. 30:e3569. doi: 10.1002/nbm.3569
Dominguez, D. J., Ng, A. C., Poudel, G., Stout, J. C., Churchyard, A., Chua, P., et al. (2015). Iron accumulation in the basal ganglia in Huntington’s disease: cross-sectional data from the IMAGE-HD study. J. Neurol. Neurosurg. Psychiatry 87, 545–549. doi: 10.1136/jnnp-2014-310183
Doya, K. (2000). Complementary roles of basal ganglia and cerebellum in learning and motor control. Curr. Opin. Neurobiol. 10, 732–739. doi: 10.1016/S0959-4388(00)00153-7
Du, G., Liu, T., Lewis, M. M., Kong, L., Wang, Y., Connor, J., et al. (2016). Quantitative susceptibility mapping of the midbrain in Parkinson’s disease. Mov. Disord. 31, 317–324. doi: 10.1002/mds.26417
Dürr, A., Stevanin, G., Cancel, G., Duyckaerts, C., Abbas, N., Didierjean, O., et al. (1996). Spinocerebellar ataxia 3 and Machado-Joseph disease: clinical, molecular, and neuropathological features. Ann. Neurol. 39, 490–499. doi: 10.1002/ana.410390411
Duyn, J. H., Van Gelderen, P., Li, T. Q., De Zwart, J. A., Koretsky, A. P., and Fukunaga, M. (2007). High-field MRI of brain cortical substructure based on signal phase. Proc. Natl. Acad. Sci. U.S.A. 104, 11796–11801. doi: 10.1073/pnas.0610821104
Eierud, C. E., Lisinski, J., Craddock, C., and Laconte, S. (2011). “Predicting finger tapping rate using functional magnetic resonance imaging,” in Proceedings of the 41th Annual Meeting of Society for Neuroscience, Washington, D.C.
Gierga, K., Schelhaas, H. J., Brunt, E. R., Seidel, K., Scherzed, W., Egensperger, R., et al. (2009). Spinocerebellar ataxia type 6 (SCA6): neurodegeneration goes beyond the known brain predilection sites. Neuropathol. Appl. Neurobiol. 35, 515–527. doi: 10.1111/j.1365-2990.2009.01015.x
Gomez, C. M., Thompson, R. M., Gammack, J. T., Perlman, S. L., Dobyns, W. B., Truwit, C. L., et al. (1997). Spinocerebellar ataxia type 6: gaze-evoked and vertical nystagmus. Purkinje cell degeneration, and variable age of onset. Ann. Neurol. 42, 933–950. doi: 10.1002/ana.410420616
Haacke, E. M., Cheng, N. Y., House, M. J., Liu, Q., Neelavalli, J., Ogg, R. J., et al. (2005). Imaging iron stores in the brain using magnetic resonance imaging. Magn. Reson. Imaging 23, 1–25. doi: 10.1016/j.mri.2004.10.001
Haacke, E. M., Liu, S., Buch, S., Zheng, W., Wu, D., and Ye, Y. (2015). Quantitative susceptibility mapping: current status and future directions. Magn. Reson. Imaging 33, 1–25. doi: 10.1016/j.mri.2014.09.004
Haacke, E. M., Xu, Y., Cheng, Y. C., and Reichenbach, J. R. (2004). Susceptibility weighted imaging (SWI). Magn. Reson. Med. 52, 612–618. doi: 10.1002/mrm.20198
Hallgren, B., and Sourander, P. (1958). The effect of age on the non-haemin iron in the human brain. J. Neurochem. 3, 41–51. doi: 10.1111/j.1471-4159.1958.tb12607.x
Hamilton, M. (1960). A rating scale for depression. J. Neurol. Neurosurg. Psychiatry 23, 56–62. doi: 10.1111/j.2044-8341.1959.tb00467.x
Hanspach, J., Dwyer, M. G., Bergsland, N. P., Feng, X., Hagemeier, J., Bertolino, N., et al. (2017). Methods for the computation of templates from quantitative magnetic susceptibility maps (QSM): toward improved atlas- and voxel-based analyses (VBA). J. Magn. Reson. Imaging 46, 1474–1484. doi: 10.1002/jmri.25671
Harrison, D. M., Li, X., Liu, H., Jones, C. K., Caffo, B., Calabresi, P. A., et al. (2016). Lesion heterogeneity on high-field susceptibility MRI is associated with multiple sclerosis severity. Am. J. Neuroradiol. 37, 1447–1453. doi: 10.3174/ajnr.A4726
He, N., Langley, J., Huddleston, D. E., Ling, H., Xu, H., Liu, C., et al. (2017). Improved neuroimaging atlas of the dentate nucleus. Cerebellum 16, 951–956. doi: 10.1007/s12311-017-0872-7
He, N., Ling, H., Ding, B., Huang, J., Zhang, Y., Zhang, Z., et al. (2015). Region-specific disturbed iron distribution in early idiopathic Parkinson’s disease measured by quantitative susceptibility mapping. Hum. Brain Mapp. 36, 4407–4420. doi: 10.1002/hbm.22928
Hoche, F., Guell, X., Vangel, M. G., Sherman, J. C., and Schmahmann, J. D. (2018). The cerebellar cognitive affective/Schmahmann syndrome scale. Brain 141, 248–270. doi: 10.1093/brain/awx317
Hoshi, E., Tremblay, L., Féger, J., Carras, P. L., and Strick, P. L. (2005). The cerebellum communicates with the basal ganglia. Nat. Neurosci. 8, 1491–1493. doi: 10.1038/nn1544
Imam, M. U., Zhang, S., Ma, J., Wang, H., and Wang, F. (2017). Antioxidants mediate both iron homeostasis and oxidative stress. Nutrients 9:671. doi: 10.3390/nu9070671
Ishikawa, K., Watanabe, M., Yoshizawa, K., Fujita, T., Iwamoto, H., Yoshizawa, T., et al. (1999). Clinical, neuropathological, and molecular study in two families with spinocerebellar ataxia type 6 (SCA6). J. Neurol. Neurosurg. Psychiatry 67, 86–89. doi: 10.1136/jnnp.67.1.86
Jin, X., Tecuapetla, F., and Costa, R. M. (2014). Basal ganglia subcircuits distinctively encode the parsing and concatenation of action sequences. Nat. Neurosci. 17, 423–430. doi: 10.1038/nn.3632
Joyce, M. R., Nadkarni, P. A., Kronemer, S. I., Margron, M. J., Slapik, M. B., Morgan, O. P., et al. (2022). Quality of life changes following the onset of cerebellar ataxia: symptoms and concerns self-reported by ataxia patients and informants. Cerebellum 21, 592–605. doi: 10.1007/s12311-022-01393-5
Kansal, K., Yang, Z., Fishman, A. M., Sair, H. I., Ying, S. H., Jedynak, B. M., et al. (2017). Structural cerebellar correlates of cognitive and motor dysfunctions in cerebellar degeneration. Brain 140, 707–720. doi: 10.1093/brain/aww327
Koeppen, A. H., Michael, S. C., Knutson, M. D., Haile, D. J., Qian, J., Levi, S., et al. (2007). The dentate nucleus in Friedreich’s ataxia: the role of iron-responsive proteins. Acta Neuropathol. 114, 163–173. doi: 10.1007/s00401-007-0220-y
Kronemer, S. I., Slapik, M. B., PietrowskI, J. R., Margron, M. J., Morgan, O. P., Bakker, C. C., et al. (2021). Neuropsychiatric symptoms as a reliable phenomenology of cerebellar ataxia. Cerebellum 20, 141–150. doi: 10.1007/s12311-020-01195-7
Langkammer, C., Bredies, K., Poser, B. A., Barth, M., Reishofer, G., Fan, A. P., et al. (2015). Fast quantitative susceptibility mapping using 3D EPI and total generalized variation. Neuroimage 111, 622–630. doi: 10.1016/j.neuroimage.2015.02.041
Langkammer, C., Schweser, F., Krebs, N., Deistung, A., Goessler, W., Scheurer, E., et al. (2012). Quantitative susceptibility mapping (QSM) as a means to measure brain iron? A post mortem validation study. Neuroimage 62, 1593–1599. doi: 10.1016/j.neuroimage.2012.05.049
Li, W., Wang, N., Yu, F., Han, H., Cao, W., Romero, R., et al. (2015). A method for estimating and removing streaking artifacts in quantitative susceptibility mapping. Neuroimage 108, 111–122. doi: 10.1016/j.neuroimage.2014.12.043
Li, W., Wu, B., and Liu, C. (2011). Quantitative susceptibility mapping of human brain reflects spatial variation in tissue composition. Neuroimage 55, 1645–1656. doi: 10.1016/j.neuroimage.2010.11.088
Li, W., Wu, B., Batrachenko, A., Bancroft-Wu, V., Morey, R. A., Shashi, V., et al. (2014). Differential developmental trajectories of magnetic susceptibility in human brain gray and white matter over the lifespan. Hum. Brain Mapp. 35, 2698–2713. doi: 10.1002/hbm.22360
Li, X., Chen, L., Kutten, K., Ceritoglu, C., Li, Y., Kang, N., et al. (2019). Multi-atlas tool for automated segmentation of brain gray matter nuclei and quantification of their magnetic susceptibility. Neuroimage 191, 337–349. doi: 10.1016/j.neuroimage.2019.02.016
Li, X., Harrison, D. M., Liu, H., Jones, C. K., Oh, J., Calabresi, P. A., et al. (2016). Magnetic susceptibility contrast variations in multiple sclerosis lesions. J. Magn. Reson. Imaging 43, 463–473. doi: 10.1002/jmri.24976
Lim, I. A., Faria, A. V., Li, X., Hsu, J. T., Airan, R. D., Mori, S., et al. (2013). Human brain atlas for automated region of interest selection in quantitative susceptibility mapping: application to determine iron content in deep gray matter structures. Neuroimage 82, 449–469. doi: 10.1016/j.neuroimage.2013.05.127
Liu, C., Li, W., Johnson, G. A., and Wu, B. (2011). High-field (9.4 T) MRI of brain dysmyelination by quantitative mapping of magnetic susceptibility. Neuroimage 56, 930–938. doi: 10.1016/j.neuroimage.2011.02.024
Liu, C., Li, W., Tong, K. A., Yeom, K. W., and Kuzminski, S. (2015). Susceptibility-weighted imaging and quantitative susceptibility mapping in the brain. J. Magn. Reson. Imaging 42, 23–41.
Liu, T., Spincemaille, P., De Rochefort, L., Kressler, B., and Wang, Y. (2009). Calculation of susceptibility through multiple orientation sampling (COSMOS): a method for conditioning the inverse problem from measured magnetic field map to susceptibility source image in MRI. Magn. Reson. Med. 61, 196–204. doi: 10.1002/mrm.21828
Liu, T., Wisnieff, C., Lou, M., Chen, W., Spincemaille, P., and Wang, Y. (2013). Nonlinear formulation of the magnetic field to source relationship for robust quantitative susceptibility mapping. Magn. Reson. Med. 69, 467–476. doi: 10.1002/mrm.24272
Lukas, C., Hahn, H. K., Bellenberg, B., Hellwig, K., Globas, C., Schimrigk, S. K., et al. (2008). Spinal cord atrophy in spinocerebellar ataxia type 3 and 6 : impact on clinical disability. J. Neurol. 255, 1244–1249. doi: 10.1007/s00415-008-0907-6
Marvel, C. L., and Desmond, J. E. (2010). The contributions of cerebro-cerebellar circuitry to executive verbal working memory. Cortex 46, 880–895. doi: 10.1016/j.cortex.2009.08.017
Marvel, C. L., and Desmond, J. E. (2012). From storage to manipulation: how the neural correlates of verbal working memory reflect varying demands on inner speech. Brain Lang. 120, 42–51. doi: 10.1016/j.bandl.2011.08.005
Mayo_Clinic_Laboratories (1995–2022). SCARA: SCA 1,2,3,6, or 7 Repeat Analysis [Online]. Available online at: https://www.mayocliniclabs.com/test-catalog/overview/609698#Clinical-and-Interpretive (accessed April 7, 2022).
Mehta, V., Pei, W., Yang, G., Li, S., Swamy, E., Boster, A., et al. (2013). Iron is a sensitive biomarker for inflammation in multiple sclerosis lesions. PLoS One 8:e57573. doi: 10.1371/journal.pone.0057573
Morgan, O. P., Slapik, M. B., Iannuzzelli, K. G., Laconte, S. M., LisinskI, J. M., Nopoulos, P. C., et al. (2021). The cerebellum and implicit sequencing: evidence from cerebellar ataxia. Cerebellum 20, 222–245. doi: 10.1007/s12311-020-01206-7
Nasreddine, Z. S., Phillips, N. A., Bédirian, V., Charbonneau, S., Whitehead, V., Collin, I., et al. (2005). The montreal cognitive assessment, MoCA: a brief screening tool for mild cognitive impairment. J. Am. Geriatr. Soc. 53, 695–699. doi: 10.1111/j.1532-5415.2005.53221.x
NINDS (2021). Machado-Joseph Disease and Spinocerebellar Ataxia Information Page [Online]. NIH. Available online at: https://www.ninds.nih.gov/Disorders/All-Disorders/Machado-Joseph-Disease-Information-Page
Persson, N., Wu, J., Zhang, Q., Liu, T., Shen, J., Bao, R., et al. (2015). Age and sex related differences in subcortical brain iron concentrations among healthy adults. Neuroimage 122, 385–398.
Ramos, P., Santos, A., Pinto, N. R., Mendes, R., Magalhaes, T., and Almeida, A. (2014). Iron levels in the human brain: a post-mortem study of anatomical region differences and age-related changes. J. Trace Elem. Med. Biol. 28, 13–17. doi: 10.1016/j.jtemb.2013.08.001
Reetz, K., Costa, A. S., Mirzazade, S., Lehmann, A., Juzek, A., Rakowicz, M., et al. (2013). Genotype-specific patterns of atrophy progression are more sensitive than clinical decline in SCA1, SCA3 and SCA6. Brain 136, 905–917. doi: 10.1093/brain/aws369
Riecker, A., Mathiak, K., Wildgruber, D., Erb, M., Hertrich, I., Grodd, W., et al. (2005). FMRI reveals two distinct cerebral networks subserving speech motor control. Neurology 64, 700–706. doi: 10.1212/01.WNL.0000152156.90779.89
Rüb, U., Brunt, E. R., Gierga, K., Schultz, C., Paulson, H., De Vos, R. A., et al. (2003a). The nucleus raphe interpositus in spinocerebellar ataxia type 3 (Machado-Joseph disease). J. Chem. Neuroanat. 25, 115–127. doi: 10.1016/s0891-0618(02)00099-6
Rüb, U., Del Turco, D., Del Tredici, K., De Vos, R. A., Brunt, E. R., Reifenberger, G., et al. (2003b). Thalamic involvement in a spinocerebellar ataxia type 2 (SCA2) and a spinocerebellar ataxia type 3 (SCA3) patient, and its clinical relevance. Brain 126, 2257–2272. doi: 10.1093/brain/awg234
Rüb, U., Bürk, K., Schöls, L., Brunt, E. R., De Vos, R. A., Diaz, G. O., et al. (2004). Damage to the reticulotegmental nucleus of the pons in spinocerebellar ataxia type 1, 2, and 3. Neurology 63, 1258–1263. doi: 10.1212/01.wnl.0000140498.24112.8c
Rüb, U., De Vos, R. A., Brunt, E. R., Sebestény, T., Schöls, L., Auburger, G., et al. (2006). Spinocerebellar ataxia type 3 (SCA3): thalamic neurodegeneration occurs independently from thalamic ataxin-3 immunopositive neuronal intranuclear inclusions. Brain Pathol. 16, 218–227. doi: 10.1111/j.1750-3639.2006.00022.x
Rüb, U., De Vos, R. A., Schultz, C., Brunt, E. R., Paulson, H., and Braak, H. (2002). Spinocerebellar ataxia type 3 (Machado-Joseph disease): severe destruction of the lateral reticular nucleus. Brain 125, 2115–2124. doi: 10.1093/brain/awf208
Rüb, U., Gierga, K., Brunt, E. R., De Vos, R. A., Bauer, M., Schöls, L., et al. (2005). Spinocerebellar ataxias types 2 and 3: degeneration of the pre-cerebellar nuclei isolates the three phylogenetically defined regions of the cerebellum. J. Neural. Transm. 112, 1523–1545. doi: 10.1007/s00702-005-0287-3
Schulz, J. B., Borkert, J., Wolf, S., Schmitz-Hubsch, T., Rakowicz, M., Mariotti, C., et al. (2010). Visualization, quantification and correlation of brain atrophy with clinical symptoms in spinocerebellar ataxia types 1, 3 and 6. Neuroimage 49, 158–168. doi: 10.1016/j.neuroimage.2009.07.027
Schweser, F., Deistung, A., Lehr, B. W., and Reichenbach, J. R. (2011). Quantitative imaging of intrinsic magnetic tissue properties using MRI signal phase: an approach to in vivo brain iron metabolism? Neuroimage 54, 2789–2807. doi: 10.1016/j.neuroimage.2010.10.070
Schweser, F., Sommer, K., Deistung, A., and Reichenbach, J. R. (2012). Quantitative susceptibility mapping for investigating subtle susceptibility variations in the human brain. Neuroimage 62, 2083–2100. doi: 10.1016/j.neuroimage.2012.05.067
Seidel, K., Siswanto, S., Brunt, E. R., Den Dunnen, W., Korf, H. W., and Rub, U. (2012). Brain pathology of spinocerebellar ataxias. Acta Neuropathol. 124, 1–21.
Shin, H. G., Lee, J., Yun, Y. H., Yoo, S. H., Jang, J., Oh, S. H., et al. (2021). Chi-separation: magnetic susceptibility source separation toward iron and myelin mapping in the brain. Neuroimage 240:118371. doi: 10.1016/j.neuroimage.2021.118371
Shmueli, K., De Zwart, J. A., Van Gelderen, P., Li, T. Q., Dodd, S. J., and Duyn, J. H. (2009). Magnetic susceptibility mapping of brain tissue in vivo using MRI phase data. Magn. Reson. Med. 62, 1510–1522.
Silveri, M. C. (2021). Contribution of the cerebellum and the basal ganglia to language production: speech, word fluency, and sentence construction-evidence from pathology. Cerebellum 20, 282–294. doi: 10.1007/s12311-020-01207-6
Slapik, M., Kronemer, S. I., Morgan, O., Bloes, R., Lieberman, S., Mandel, J., et al. (2019). Visuospatial organization and recall in cerebellar ataxia. Cerebellum 18, 33–46. doi: 10.1007/s12311-018-0948-z
Suzuki, Y., Yoshida, K., Aburakawa, Y., KurodA, K., Kimura, T., Terada, T., et al. (2013). Effectiveness of oral iron chelator treatment with deferasirox in an aceruloplasminemia patient with a novel ceruloplasmin gene mutation. Intern. Med. 52, 1527–1530. doi: 10.2169/internalmedicine.52.0102
Thomsen, M. S., Andersen, M. V., Christoffersen, P. R., Jensen, M. D., Lichota, J., and Moos, T. (2015). Neurodegeneration with inflammation is accompanied by accumulation of iron and ferritin in microglia and neurons. Neurobiol. Dis. 81, 108–118.
Trouillas, P., Takayanagi, T., Hallett, M., Currier, R. D., Subramony, S. H., Wessel, K., et al. (1997). International cooperative ataxia rating scale for pharmacological assessment of the cerebellar syndrome. The ataxia neuropharmacology committee of the world federation of neurology. J. Neurol. Sci. 145, 205–211. doi: 10.1016/s0022-510x(96)00231-6
Van Bergen, J. M. G., Li, X., Quevenco, F. C., Gietl, A. F., Treyer, V., Meyer, R., et al. (2018). Simultaneous quantitative susceptibility mapping and Flutemetamol-PET suggests local correlation of iron and beta-amyloid as an indicator of cognitive performance at high age. Neuroimage 174, 308–316. doi: 10.1016/j.neuroimage.2018.03.021
Van Bergen, J. M., Hua, J., Unschuld, P. G., Lim, I. A., Jones, C. K., Margolis, R. L., et al. (2016). Quantitative susceptibility mapping suggests altered brain iron in premanifest huntington disease. Am. J. Neuroradiol. 37, 789–796.
Wang, Y., and Liu, T. (2015). Quantitative susceptibility mapping (QSM): decoding MRI data for a tissue magnetic biomarker. Magn. Reson. Med. 73, 82–101. doi: 10.1002/mrm.25358
Ward, P. G. D., Harding, I. H., Close, T. G., Corben, L. A., Delatycki, M. B., Storey, E., et al. (2019). Longitudinal evaluation of iron concentration and atrophy in the dentate nuclei in friedreich ataxia. Mov. Disord. 34, 335–343. doi: 10.1002/mds.27606
Ward, R. J., Zucca, F. A., Duyn, J. H., Crichton, R. R., and Zecca, L. (2014). The role of iron in brain ageing and neurodegenerative disorders. Lancet Neurol. 13, 1045–1060.
Wei, H., Dibb, R., Zhou, Y., Sun, Y., Xu, J., Wang, N., et al. (2015). Streaking artifact reduction for quantitative susceptibility mapping of sources with large dynamic range. NMR Biomed. 28, 1294–1303. doi: 10.1002/nbm.3383
Wharton, S., and Bowtell, R. (2010). Whole-brain susceptibility mapping at high field: a comparison of multiple- and single-orientation methods. Neuroimage 53, 515–525. doi: 10.1016/j.neuroimage.2010.06.070
Wilkinson, G. S. (1993). WRAT-3 : Wide Range Achievement Test Administration Manual. Wilmington, CA: Wide Range, Inc.
Wisnieff, C., Ramanan, S., Olesik, J., Gauthier, S., Wang, Y., and Pitt, D. (2015). Quantitative susceptibility mapping (QSM) of white matter multiple sclerosis lesions: interpreting positive susceptibility and the presence of iron. Magn. Reson. Med. 74, 564–570. doi: 10.1002/mrm.25420
Wu, B., Li, W., Guidon, A., and Liu, C. (2012b). Whole brain susceptibility mapping using compressed sensing. Magn. Reson. Med. 67, 137–147. doi: 10.1002/mrm.23000
Wu, B., Li, W., Avram, A. V., Gho, S. M., and Liu, C. (2012a). Fast and tissue-optimized mapping of magnetic susceptibility and T2* with multi-echo and multi-shot spirals. Neuroimage 59, 297–305. doi: 10.1016/j.neuroimage.2011.07.019
Wymbs, N. F., Bassett, D. S., Mucha, P. J., Porter, M. A., and Grafton, S. T. (2012). Differential recruitment of the sensorimotor putamen and frontoparietal cortex during motor chunking in humans. Neuron 74, 936–946. doi: 10.1016/j.neuron.2012.03.038
Zecca, L., Youdim, M. B., Riederer, P., Connor, J. R., and Crichton, R. R. (2004). Iron, brain ageing and neurodegenerative disorders. Nat. Rev. Neurosci. 5, 863–873.
Zhang, Y., Wei, H., Cronin, M. J., He, N., Yan, F., and Liu, C. (2018). Longitudinal atlas for normative human brain development and aging over the lifespan using quantitative susceptibility mapping. Neuroimage 171, 176–189.
Keywords: SCA3, SCA6, QSM = quantitative susceptibility mapping, cerebellum, cerebellar dentate, cognition, motor, MRI
Citation: Marvel CL, Chen L, Joyce MR, Morgan OP, Iannuzzelli KG, LaConte SM, Lisinski JM, Rosenthal LS and Li X (2022) Quantitative susceptibility mapping of basal ganglia iron is associated with cognitive and motor functions that distinguish spinocerebellar ataxia type 6 and type 3. Front. Neurosci. 16:919765. doi: 10.3389/fnins.2022.919765
Received: 13 April 2022; Accepted: 26 July 2022;
Published: 18 August 2022.
Edited by:
Sofia Toniolo, University of Oxford, United KingdomReviewed by:
Warda Syeda, University of Melbourne, AustraliaAnna Nigri, IRCCS Carlo Besta Neurological Institute Foundation, Italy
Copyright © 2022 Marvel, Chen, Joyce, Morgan, Iannuzzelli, LaConte, Lisinski, Rosenthal and Li. This is an open-access article distributed under the terms of the Creative Commons Attribution License (CC BY). The use, distribution or reproduction in other forums is permitted, provided the original author(s) and the copyright owner(s) are credited and that the original publication in this journal is cited, in accordance with accepted academic practice. No use, distribution or reproduction is permitted which does not comply with these terms.
*Correspondence: Cherie L. Marvel, Y21hcnZlbDFAamhtaS5lZHU=