 Qiuting Deng1,2†
 Shengpeng Wang1,2†
 Zijie Huang1,3
 Qing Lan3Guangyao Lai3
 Jiangshan Xu2
 Yue Yuan2Chang Liu2Xiumei Lin1,2Weimin Feng1,2Wen Ma3
 Mengnan Cheng2
 Shijie Hao1,2Shanshan Duan1,2
 Huiwen Zheng2Xiaoyan Chen2
 Yong Hou1,3Yingjie Luo3*
 Longqi Liu1,2,3,4*
 Chuanyu Liu3,4*
- 1College of Life Sciences, University of Chinese Academy of Sciences, Beijing, China
- 2BGI-Hangzhou, Hangzhou, China
- 3BGI-Shenzhen, Shenzhen, China
- 4Shenzhen Bay Laboratory, Shenzhen, China
In mammals, early organogenesis begins soon after gastrulation, accompanied by specification of various type of progenitor/precusor cells. In order to reveal dynamic chromatin landscape of precursor cells and decipher the underlying molecular mechanism driving early mouse organogenesis, we performed single-cell ATAC-seq of E8.5-E10.5 mouse embryos. We profiled a total of 101,599 single cells and identified 41 specific cell types at these stages. Besides, by performing integrated analysis of scATAC-seq and public scRNA-seq data, we identified the critical cis-regulatory elements and key transcription factors which drving development of spinal cord and somitogenesis. Furthermore, we intersected accessible peaks with human diseases/traits-related loci and found potential clinical associated single nucleotide variants (SNPs). Overall, our work provides a fundamental source for understanding cell fate determination and revealing the underlying mechanism during postimplantation embryonic development, and expand our knowledge of pathology for human developmental malformations.
Introduction
In mammals, early organogenesis is completed within a short time frame, and cells from the three germ layers can form precursor cells of various organs, which is a fundamental biological question (Downs and Davies, 1993; Waddington, 2012; Kojima et al., 2014). As the precursor cells for all major organ systems, the underlying mechanism of cell proliferation and cell type diversification is still largely unclear. Cell fate decision and cell state transition events during organogenesis, especially neurogenesis and somitogenesis, which are closely related to ubiquitous profiles of epigenetic and transcriptional alteration (Shahbazi and Zernicka-Goetz, 2018; Sagar and Grün, 2020; Shahbazi, 2020).
High-resolution charting of mammalian embryonic development is gradually deepening with the emergence of single-cell sequencing technologies (Dong et al., 2018; Argelaguet et al., 2019; Cao et al., 2019; Nowotschin et al., 2019; Peng et al., 2019; Pijuan-Sala et al., 2019, 2020; Argelaguet et al., 2022; Magaletta et al., 2022; Qiu et al., 2022). These technologies have already been adopted on different development research field, such as the construction of the mammalian embryonic cell interaction atlas (Cao et al., 2019; Pijuan-Sala et al., 2019, 2020) and the studies of germ layer and organ development (Nowotschin et al., 2019; Han et al., 2020; Kelly et al., 2020; Magaletta et al., 2022; Jiang et al., 2023). Nonetheless, most of these studies mentioned above focused on transcriptome analysis and neglected the characterization of chromatin accessibility during organogenesis. Recently, single-cell chromatin accessibility maps have been captured, referring one embryonic stage (Pijuan-Sala et al., 2020). Concerning the early organogenesis period from E8.5 to E10.5, when cell types diversify, the regulatory programs that define organ cell repertoire remain to be elucidated, especially neurogenesis and somitogenesis. Although single-cell transcriptome sequencing has revealed potential mechanisms of neurogenesis and somitogenesis (Farrell et al., 2018; Ibarra-Soria et al., 2018; Christoph et al., 2022), the epigenetic regulatory mechanism of the development from spinal cord and paraxial mesoderm to the dorsal-ventral axis and skeleton remains unclear.
Here, we applied a high-throughput single-cell sequencing assay for transposase-accessible chromatin (scATAC-seq) to generate a chromatin accessibility dataset and performed an integrated multiomics analysis of chromatin accessibility and gene expression during early organogenesis. As a result, we identified 101,599 single cells and 41 cell types, which could be a valuable resource for revealing embryonic developmental mechanisms, preventing miscarriage, and improving pregnancy.
Methods
Animal study
All mice experiments were approved by the Institutional Review Board on the Ethics Committee of BGI (Permit No. BGI-IRB A23010). Wild-type C57BL/6 mice (Guangdong medical laboratory animal center) were interbred, noon at the day of a vaginal plug was considered as E0.5. Pregnant females were sacrificed, and 8 E8.5 embryos, 15 E9.5 embryos and 8 E10.5 embryos were collected for scATAC-seq experiments. Mouse embryos were dissected and pre-chilled in cold PBS, followed by cell dissociation and nuclei extraction steps. Total 31 mouse embryos were processed and analyzed in following experiments.
Cell dissociation and nuclei isolation
To generate a single cell suspension, embryo samples were first digested by 0.2 mg/mL Liberase™ (Roche, 5401119001) and 0.025% Trypin (Thermo, 25200056), which were incubated at 37°C for 60 min on a thermo shaker. Dissociated cells were filtered through a 70 μm cell strainer (Falcon, 352350) and a 40 μm cell strainer (Falcon, 352340). Cell suspension was centrifuged for 5 min at 500 g and cells were washed with 0.04% BSA/PBS for 1 or 2 times. Single-nucleus preparations were derived from the Omni-ATAC protocols as previously described (Corces et al., 2017), with some adjustments. In brief, cells were resuspended in 100 μL of chilled cell lysis buffer (CLB; 10 mM Tris–HCl pH7.5, 10 mM NaCl, 3 mM MgCl2, 0.1% Tween-20 (Sigma, P9416), 0.1% NP40 (Roche, 11332473001), 0.01% digitonin (Sigma, D141), 1% BSA/PBS), and incubated on ice for 5 min. Subsequently, 1 mL of chilled ATAC resuspension buffer (RSB; 10 mM Tris-HCl pH7.5, 10 mM NaCl, 3 mM MgCl2, 0.1% Tween-20, 1% BSA/PBS) was added into the lysed cell suspension, and nuclei were spun down at 500 g, 4°C for 5 min. Nuclei was resuspended in 50 μL of BSA/PBS and counted by DAPI staining.
scATAC-seq library construction and sequencing
scATAC-seq libraries were prepared using DNBelab C Series Single-Cell ATAC Library Prep Set (MGI, 1000021878; Yu et al., 2021). In brief, 100,000 nuclei were resuspended in tagmentation mix which were incubated at 37°C for 30 min with shaking (500 rpm). Then, 10,000 nuclei were input for droplet generation and labeling, followed by droplet pre-amplification and droplet breaking. The magnetic beads carrying the ATAC fragments were subjected to amplification and purification. The indexed sequencing libraries were constructed according to the manufacturer’s guide, and quantified with the Qubit ssDNA HS Assay Kit 3.0 (Invitrogen, Q32854). In total, we constructed 9 libraries from E8.5 embryonic cells, and 10 libraries from E9.5/E10.5 embryonic cells, respectively. All libraries were sequenced using the DIPSEQ T1/T7 platform at China National GeneBank (CNGB) (Huang et al., 2017), scATAC-seq libraries comprise DNA insert with standard paired-end constructs.
Data pre-processing and quality control
The raw data were processed by PISA1. Briefly, the raw reads were aligned to the mouse reference genome (version: mm10) by BWA-MEM (v0.7.15) with default parameters. Reads with mapping quality less than 10 were removed and the PCR duplicates were also removed for each cell of library by Picard (v1.84).2 Next, the fragments file for each library was used for the downstream analysis by ArchR (v1.0.1) (Granja et al., 2021). Cells with the TSS enrichment score less than 4 or the number of captured fragments less than 2,000 were removed, and the doublet score was calculated and filtered using the “addDoubletScores” and “filterDoublets” function with parament “filterRatio = 2” by ArchR.
Clustering of scATAC-seq data
We used the peak matrixes and fragment files to create chromatin assay by “CreateChromatinAssay” function with default parameters in Signac (v1.8.0) (Stuart et al., 2021). Seurat object was created by “CreateSeuratObject” function for each library. Subsequently, all library datasets were merged together by “merge” function. Then, the data were normalized with the Term Frequency-Inverse Document Frequency methods by “RunTFIDF” function. Top variable features were calculated by the “FindTopFeatures” function with “min.cutoff = ‘q70’” and then the singular value decomposition was computed by “RunSVD” function. Next, Uniform Manifold Approximation and Projection analysis was performed by “RunUMAP” function with parameter “dims = 2:30, reduction = ‘lsi’, n.neighbors = 50, min.dist = 0.4.” “FindNeighbors” and “FindClusters” functions with parameters “algorithm = 3, resolution = 3” were performed to produce cell-type clusters. Finally, the gene activity scores for each gene in cells were calculated by “addGeneScoreMatrix” function, and the cluster-specific genes based on gene scores were calculated by “getMarkerFeatures” function with “useMatrix = ‘GeneScoreMatrix’” (FDR ≤ 0.01 and log2FC ≥ 1) in ArchR. Peak calling for each cell type was performed using “addReproduciblePeakSet” function in MACS2. The cell-type specific peaks were calculated by “getMarkerFeatures” function with “useMatrix = ‘PeakMatrix’” (FDR ≤ 0.01 and log2FC ≥ 1). Motif enrichment analysis was performed by “peakAnnoEnrichment” function with “cutOff = ‘FDR ≤ 0.01 & Log2FC ≥ 0.5.’”
Integration of scATAC-seq and scRNA-seq data at corresponding stages
We performed integrative analysis of our scATAC-seq dataset with previously published scRNA-seq data of entire mouse embryos from three developmental stages accordingly. First, the expression matrix of scRNA-seq data (GEO accession number: GSE186068 and GSE186069) (Qiu et al., 2022) was downloaded and the cell number of the dataset was downsampled to 1,500 for each cell type of three developmental stages. Then, for each developmental stage, we performed label transferred from the well annotated cell types in scRNA-seq data to our gene activity score matrix by “FindTransferAnchors” and “TransferData” function in Seurat (v4.2.0) (Hao et al., 2021). Besides, the scRNA-seq data was also integrated with the scATAC-seq data by “addGeneIntegrationMatrix” function in ArchR (Granja et al., 2021). Last, peak-to-gene linkage was identified by the “addPeak2GeneLinks” function with “reducedDims = ‘IterativeLSI.’”
Integration of scATAC-seq and stereo-seq data at corresponding stages
We performed integrative analysis by Tangram package (Biancalani et al., 2021) to integrate our scATAC-seq dataset with previously published spatial transcriptome data generated by Stereo-seq in E9.5 and E10.5 mouse embryos (Chen et al., 2022). Briefly, processed datasets of two sections (E1S2 and E2S1) were downloaded from https://db.cngb.org/stomics/mosta/. Then the maker genes list for each cell type of the mouse embryo from a previous study (Qiu et al., 2022) were collected and used as training genes for Tangram. Next, we mapped the scATAC-seq gene scores data onto spatial gene expression data by the “map_cells_to_space” function in Tangram. Additionally, the corresponding stages of scRNA-seq data were also mapped onto Stereo-seq data with the same strategy.
Trajectory analysis
We performed the trajectory analysis using “addTrajectory” function with the given cell-types order in ArchR. In addition, “getTrajectory” and “plotTrajectoryHeatmap” functions were used to perform pseudo-time heatmaps for gene scores, gene expression, and motifs.
Gene ontology analysis
Gene ontology (GO) analysis was performed by “enrichGO” function in clusterProfiler (v3.12.0) (Wu et al., 2021), and p-value < 0.05 was used to identify significantly enriched GO terms. In addition, GREAT (v.4.0.4) (Mclean et al., 2010) gene ontology was used to enrich the gene ontology terms for cell types specific peaks.
LDSC
To calculate heritability and genetic correlations across human diseases/traits in differentially accessible peaks for each cell type from mouse embryonic stages, we used the LDSC package (Bulik-Sullivan et al., 2015) which calculates the enrichment of heritability in a set of annotated SNPs, while considering a baseline model that accounts for the non-random distribution of heritability across the genome. Firstly, we used liftOver tool (v1.2.0) to convert mouse marker peaks of each cell type to the human orthologous genome coordinates (hg19). The detailed commands are as follows: “liftOver input.mouse.celltype.markerPeaks.bed mm10ToHg19.over.chain.gz output.mm10tohg19.orthologous.bed output.unlifted.bed-minMatch = 0.1.” Secondly, we performed LDSC analysis to link human SNPs from GWAS data to orthologous coordinates in the mouse. The the LD scores were calculated by the “make_annot.py” and “ldsc.py” functions according to the tutorial.3 Then, the coefficient p values (coefficient p < 0.01) were used to evaluate the association of the traits/diseases with each cell type. Next, we converted the human SNPs associated with each cell type’s traits/diseases to mouse genome coordinates by liftOver. Then we intersected the SNP loci with the mouse marker peaks regions. This enabled us to identify the orthologous GWAS loci within the marker peaks of each cell type.
Results
Characterizing cell types of early mouse organogenesis
To address how chromatin states shape the developing spinal cord and somitogenesis, we performed scATAC-seq of mouse embryonic cells from E8.5 to E10.5 by DNBelab C4 ATAC-seq platform (Figure 1A; Yu et al., 2021). After passing through a stringent quality control pipeline, we obtained a dataset which contained a total of 101,599 cells with a median of 14,291 unique fragments per cell for further analysis (see Methods and Supplementary Table S1). To further evaluate data quality of our dataset, we calculated fraction of reads in peak regions (FRiP) and Transcription Start Site (TSS) enrichment score of each single-cells. A median FRiP of 62.75% in total 244,314 peaks and a median TSS enrichment score of 14.66% were obtained in assayed cells (Supplementary Figure S1), indicating good data quality.
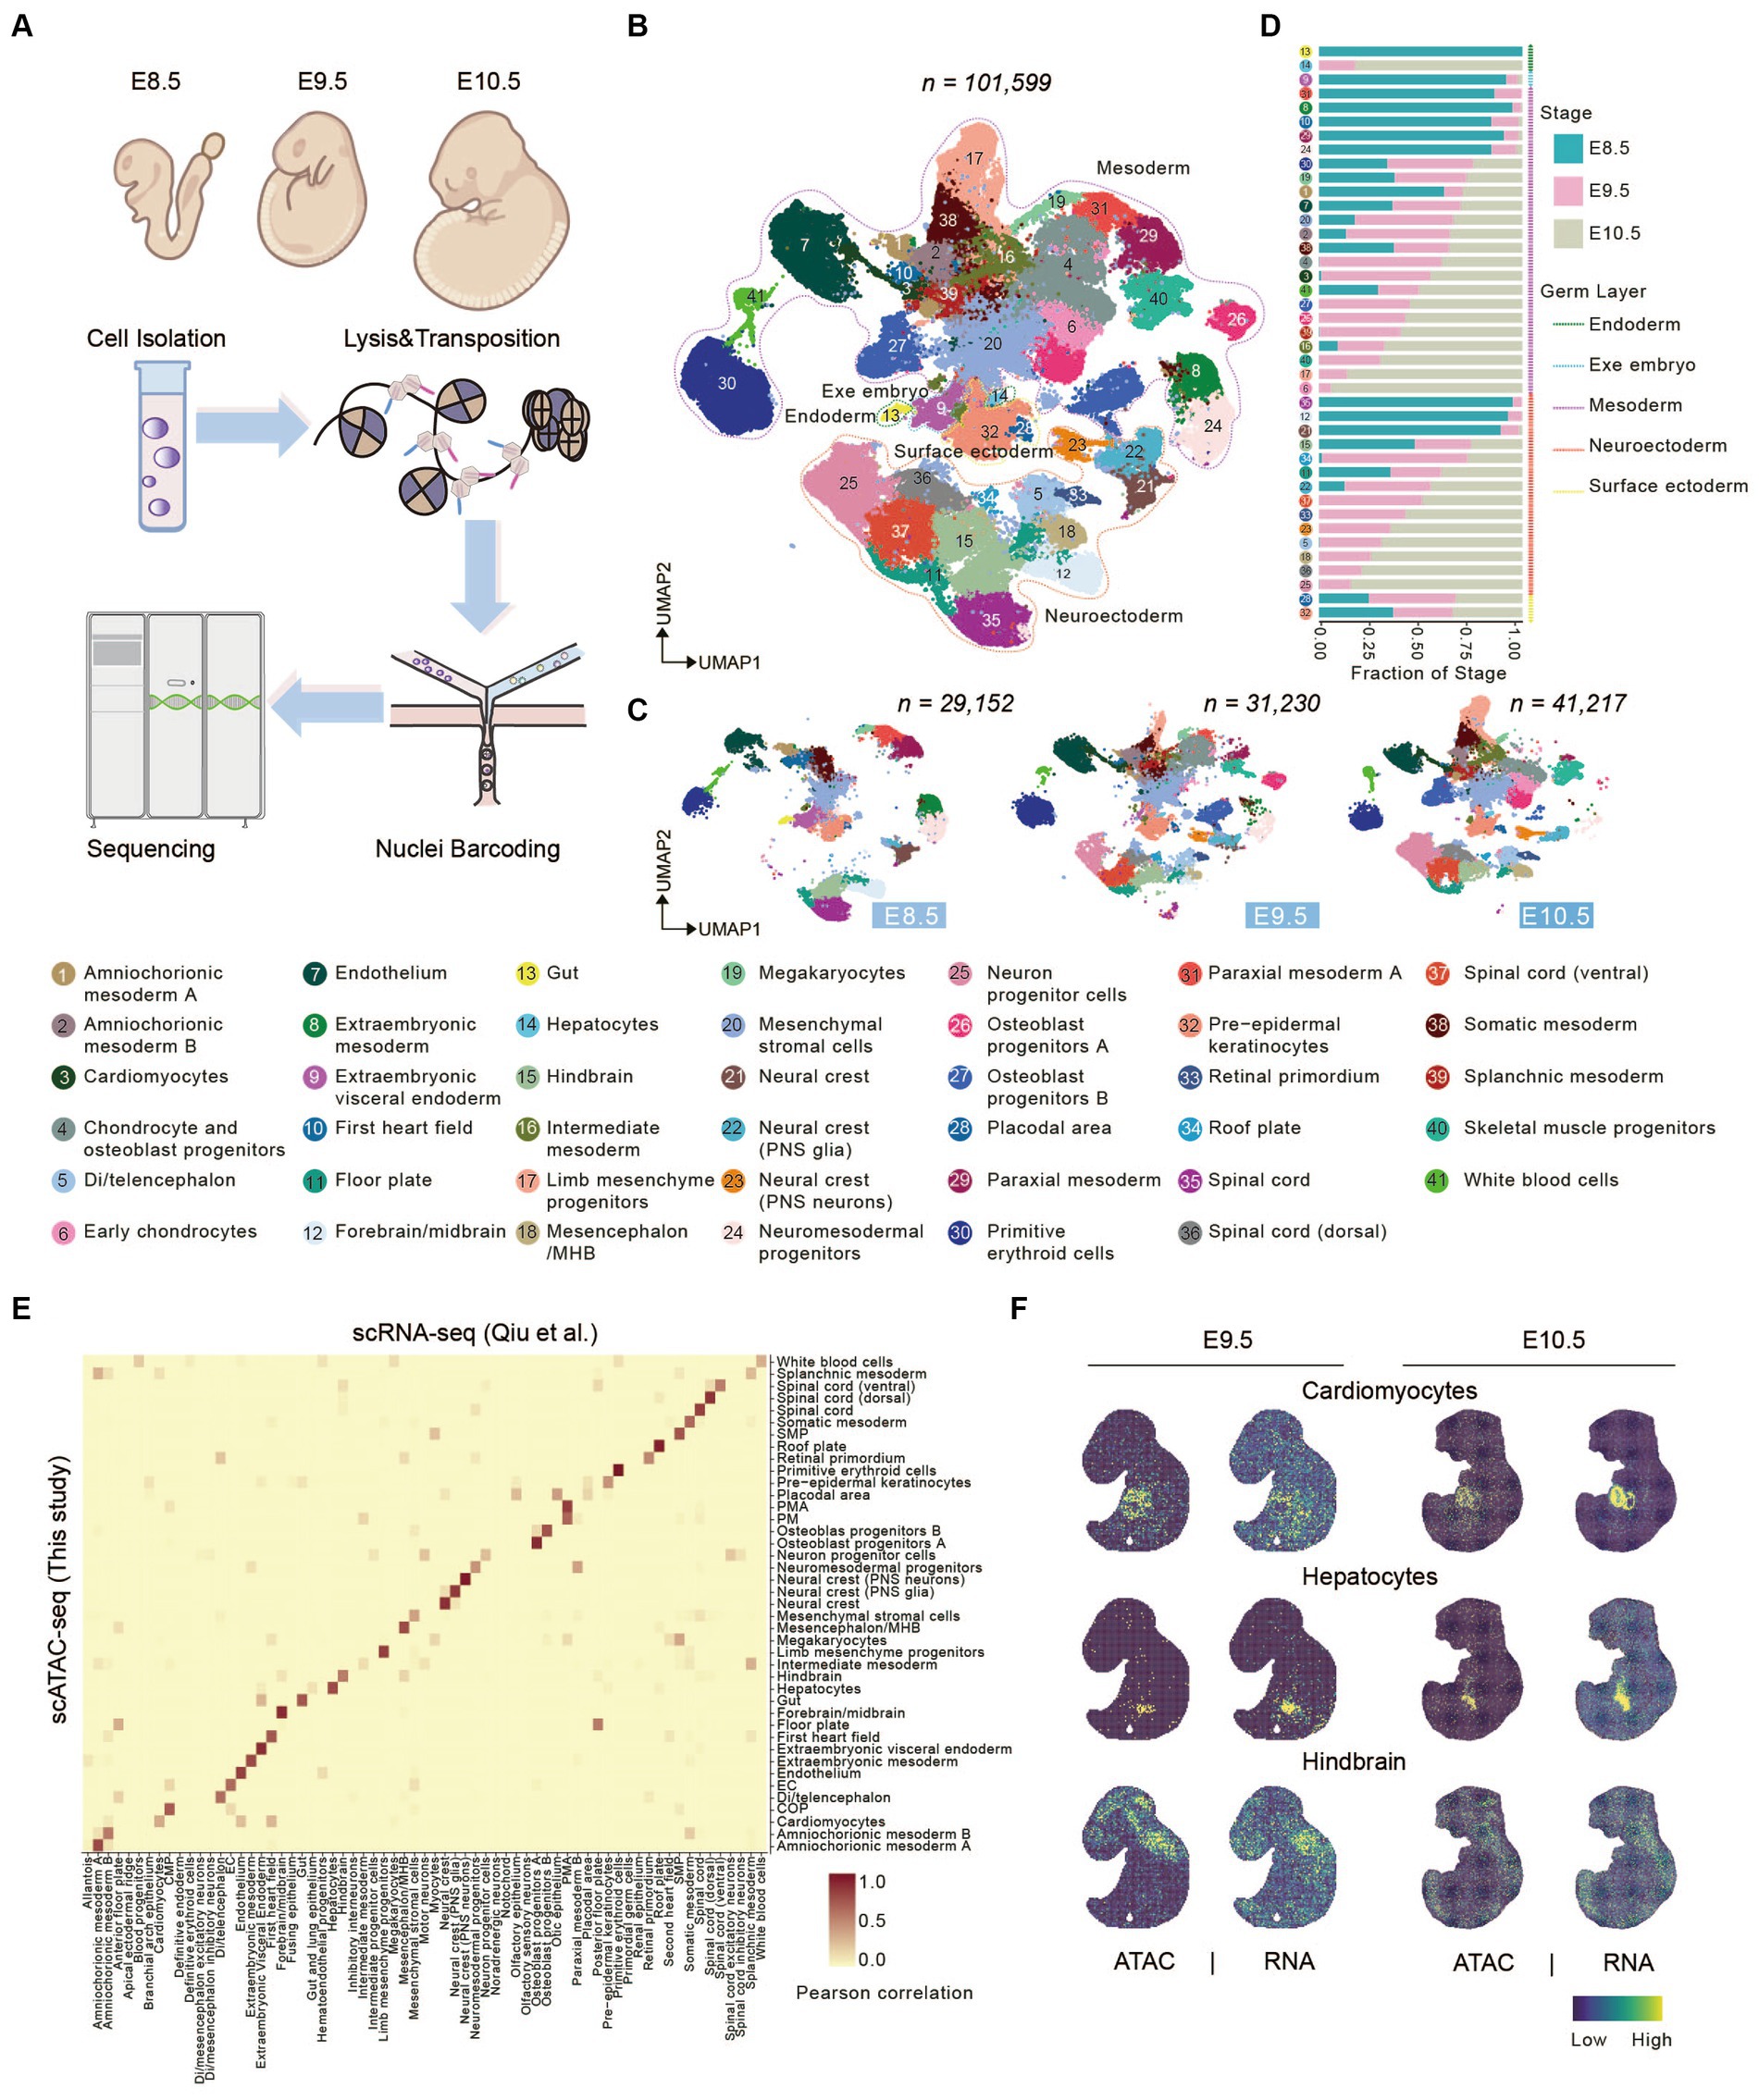
Figure 1. Characterizing canonical cell types in early mouse organogenesis. (A) Schematic overview of the approach for generating scATAC-seq data. Mouse embryo from E8.5-E10.5 was dissociated for scATAC-seq. (B,C) UMAP visualization of merged (B) and embryonic stage (C) mouse embryo cells from E8.5-E10.5 (cell number from left to right: n = 29,152 for E8.5; 31,230 for E9.5; 41,217 for E10.5). Dots indicate individual cells; cells are colored by cell types. Dashed lines show the distribution of the germ layers. (D) Bar plots show the fraction of stages across each cell type. (E) Heatmap showing the correspondence between cells annotated by snATAC-seq and cells predicted by scRNA-seq cell-type. (F) Tangram inferred spatial distributions of specific cell types from scATAC-seq and scRNA-seq data (Qiu et al., 2022).
Next, we used Signac R (Stuart et al., 2021) to perform unsupervised clustering of scATAC-seq dataset and identified a total of 69 clusters (Supplementary Table S1). To interpret gene expression level through chromatin accessibility profile, gene activity scores were calculated by summing the number of fragments in each gene’s promoter and gene body regions (Granja et al., 2021). Based on the gene activity score of some marker genes, we clustered 41 cell types, which included cells from all three germ layers (endoderm, mesoderm and ectoderm) and extraembryonic region (Figure 1B and Supplementary Figure S2). Cells from three developmental stages were well integrated without obvious batch effect, and its’ portion in each cluster change coordinately (Figures 1C,D). For example, gut, visceral endoderm, first heart field, spinal cord, and so on accounted for a relatively large proportion in E8.5 and gradually reduced or disappeared at E9.5. On the other hand, neuron progenitor cells, hepatocytes, chondrocyte and osteoblast progenitors (COP), cardiomyocytes, limb mesenchyme progenitors, and so on initially appear at E9.5 and greatly expand at E10.5 (Figures 1C,D).
Besides, to benchmark our scATAC-seq technology, we performed integrated analysis comparing our data with previously published datasets. Using scRNA-seq data (Qiu et al., 2022) from corresponding embryonic stages as a reference dataset, we performed label transfer in Seurat. The result shows that cell types defined by scATAC-seq are consistent with those defined by scRNA-seq (Figure 1E), indicating gene activity score positively correlates with gene expression level. We next sough to explore spatial distribution of defined cell types in mouse embryos. Several advanced technologies have been developed recently which enables profiling transcriptomic information in spatial resolution (Dries et al., 2021; Chen et al., 2022). Above all other techniques, Stereo-seq can generate topographic transcriptomic atlas of a whole mid-or late-gestation embryo with high resolution and sensitivity (Chen et al., 2022). We performed integrated analysis using our scATAC data with public MOSTA dataset (mouse organogenesis spatiotemporal transcriptomic atlas) (https://db.cngb.org/stomics/mosta/) generated by Stereo-seq, and mapped our scATAC-seq data onto MOSTA spatial maps (see Section Methods). Data integration showed that the spatial distribution of cell population defined by our ATAC data was consistent with position of corresponding organ, such as cardiomyocytes, hepatocytes, and hindbrain (Figure 1F and Supplementary Figure S3).
Taken together, these results support that we portrayed an informative chromatin landscape for early stage of mouse organogenesis, which enabled interpretation of regulatory roles between chromatin accessibility and gene expression during mouse embryonic development.
Characterization of cell type-specific regulatory profiles in spinal cord lineages
Multiple signaling pathways, such as sonic hedgehog (SHH), bone morphogenetic proteins (BMP), and WNT signalings, play a vital role in establishing dorsal-ventral axis of a developing embryo (Rogers and Schier, 2011; Sagner and Briscoe, 2017). The vertebrate neural tube has become a major model for understanding the principles of cell fate determination. Various morphogenic activities emanating from the dorsal and ventral poles of the spinal cord form the dorsal-ventral axis (Le Dréau and Martí, 2012; Lai et al., 2016). To decipher the underlying molecular mechanism of neural tube development, we extracted and further investigated the cells defined as spinal cord, spinal cord (dorsal), and spinal cord (ventral) in our scATAC-seq dataset (Figure 2A), with the spinal cord distributed only at E8.5 and the other two mainly between E9.5 and E10.5 (Figure 2B). After E8.5, spinal cord shift toward spinal cord (dorsal/ventral), displaying a transition from neural progenitor cells to neurons (Figures 2A,B) (Alaynick et al., 2011; Qiu et al., 2022). A total of 850 cell types-specific genes were identified based on gene activity scores across these cell types. The spinal cord was annotated by accessibility near Kcnt2, Car10, Lsamp, Robo2, Nrxn1, Plcb1, and Pax3; the spinal cord (dorsal) was annotated by accessibility near Nav2, Draxin, Cdon, Ptn, and Zic1; and the spinal cord (ventral) was annotated by accessibility near Tns1, Rhbdl3, Tox2, and Miat (Figure 2C). Applying the peak calling algorithm MACS2 (Zhang et al., 2008), 8,038 differential peaks in only one or two cell types were identified (Figure 2D).
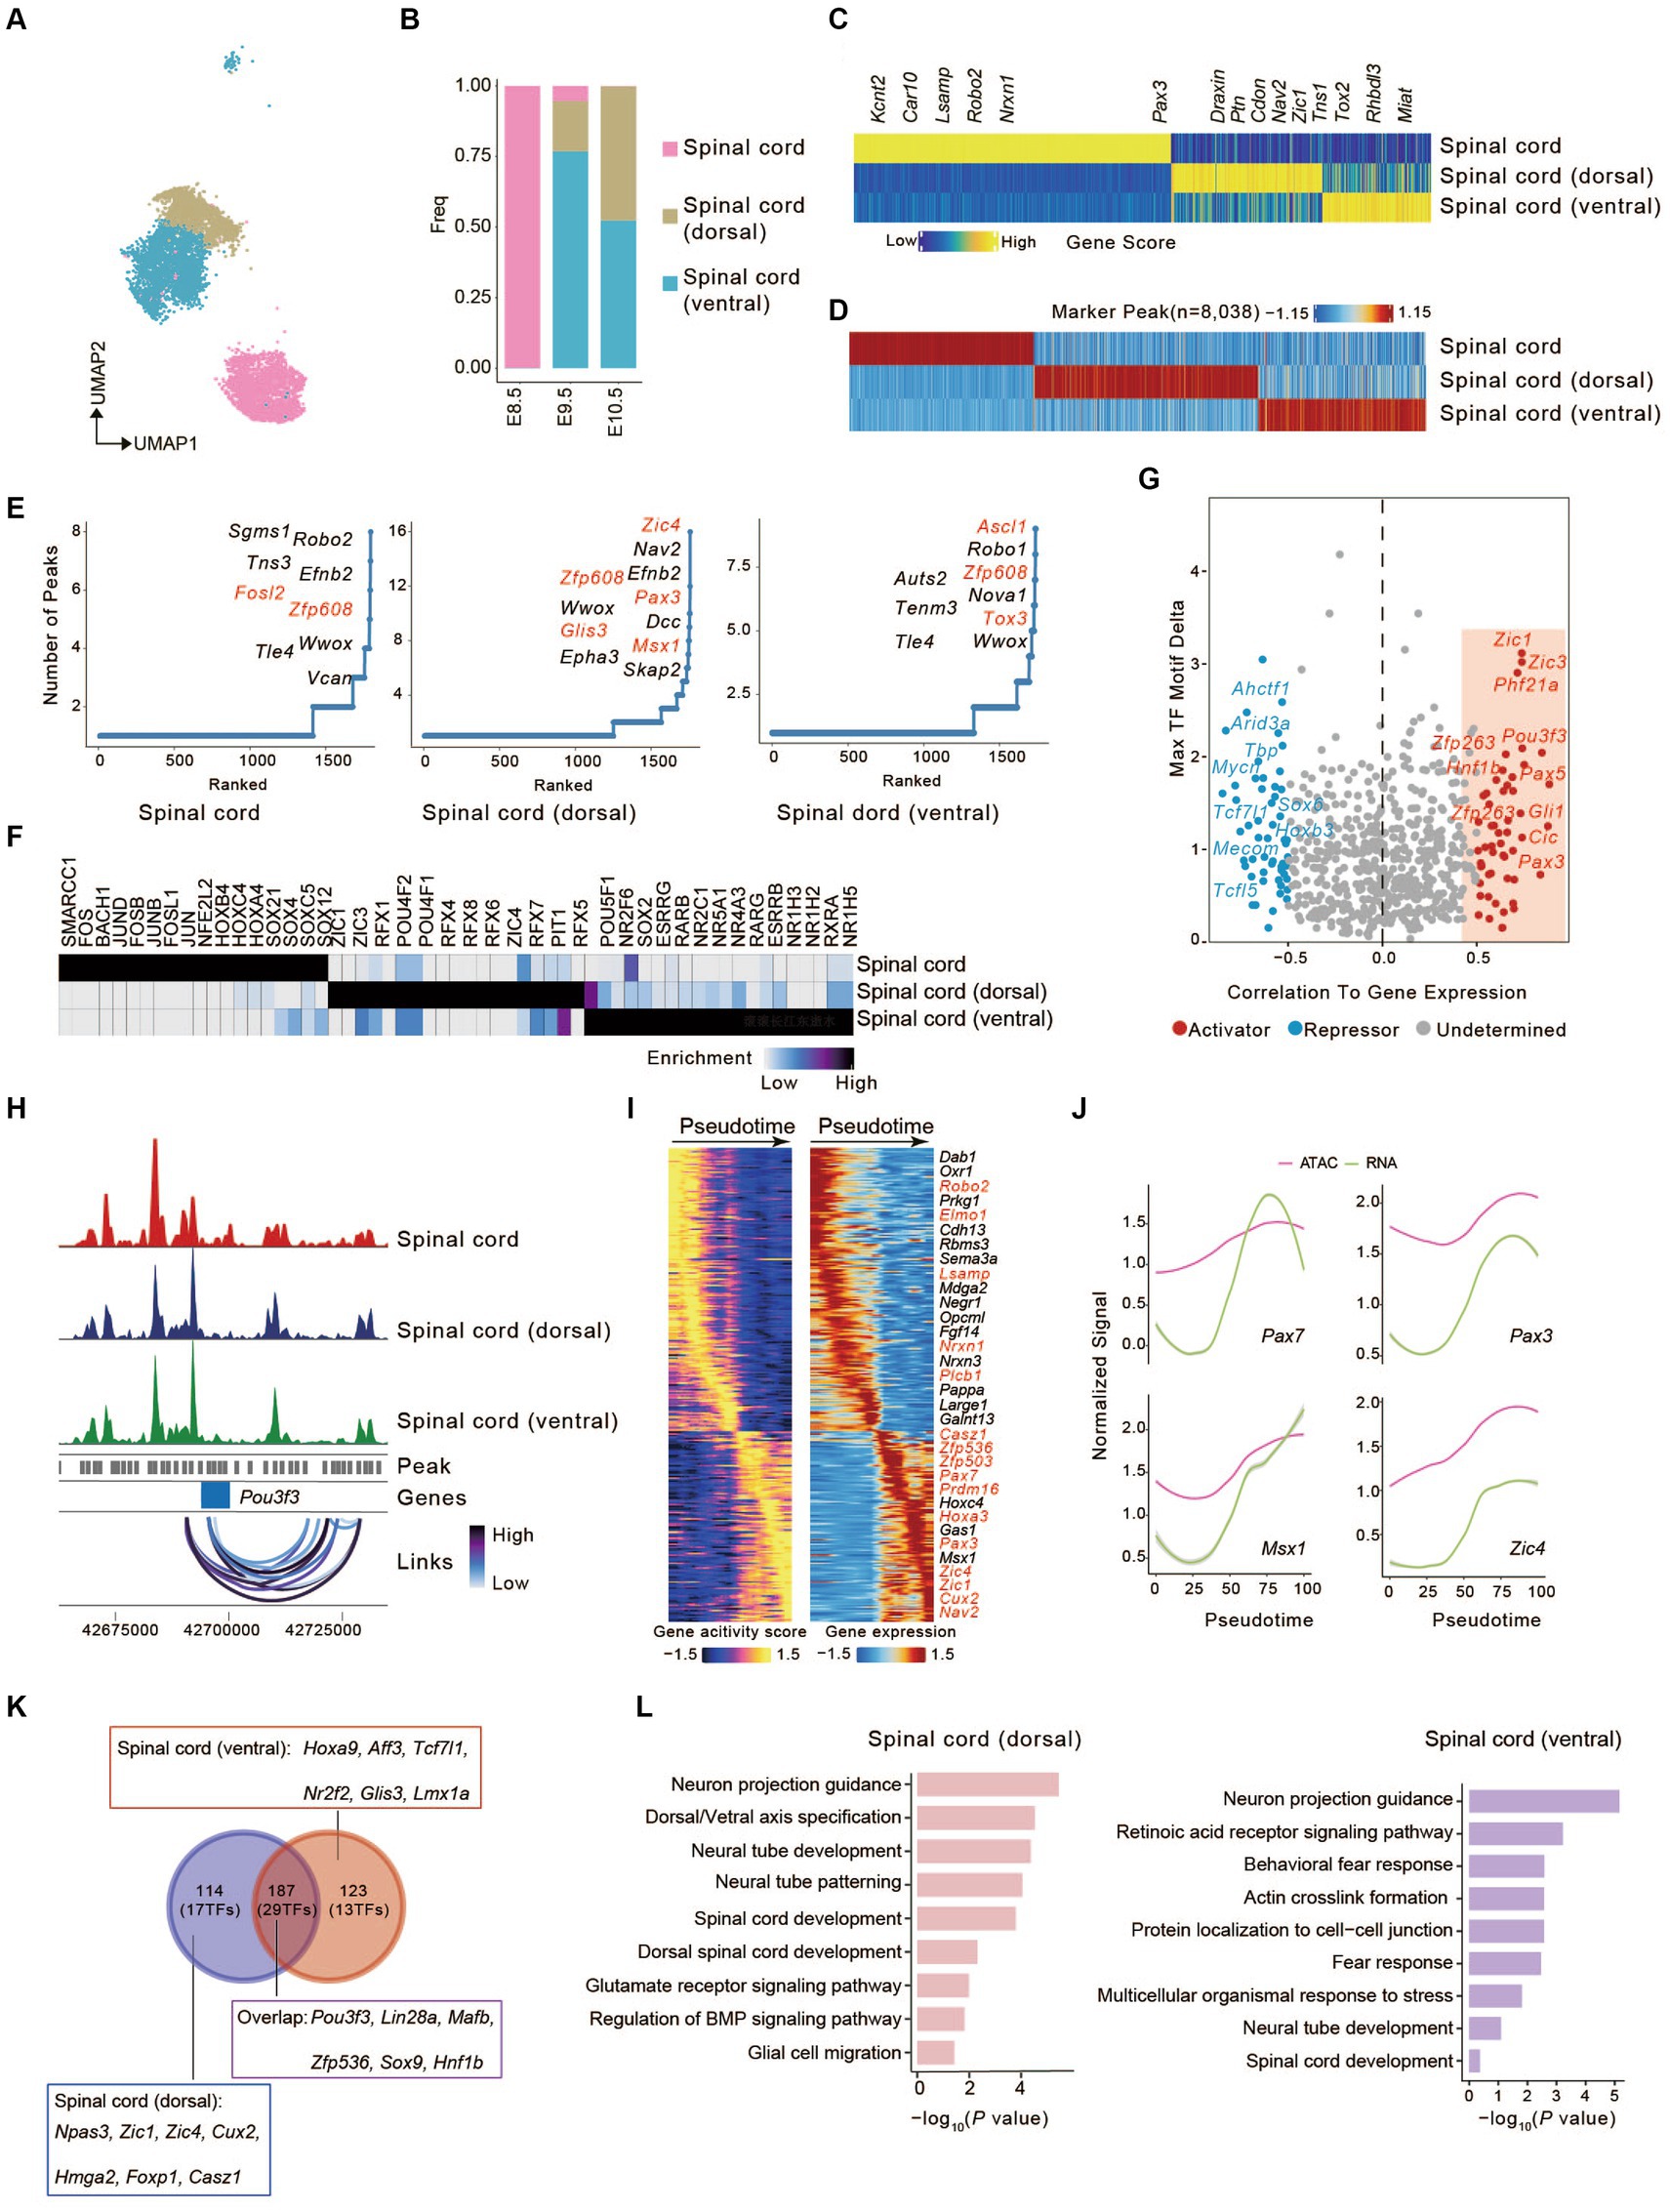
Figure 2. Identification of candidate correlated transcription factors governing spinal cord cell fate. (A) UMAP visualization of cells from spinal cord lineages. (B) The bar graph shows the proportion of three cell types. Colors match the cell types in (A). (C) Heatmap of marker genes across spinal cord lineages calculated from scATAC-seq gene scores. Each column represents a unique marker gene. The color represents the normalized gene score of the marker genes in cell types. (D) Heatmap represents the specific marker peak across the spinal cord lineages. Each column represents an individual marker peak. The color represents the normalized marker peak accessibility across three cell types. (E) The number of significantly correlated peaks for each gene across three cell types. TFs were colored in red. (F) Heatmap of TF motifs enriched in cell-type marker peak. (G) Scatterplot showing the correlation between the expression of TFs and their binding motifs in the accessible chromatin region. Putative transcriptional activators and repressors are shown in red and blue, respectively. (H) Aggregated scATAC-seq tracks at the genomic regions near Pou3f3 with peak co-accessibility (Co-access) across three cell types. (I) Heatmaps depicting consistent genes of gene score (left) and gene expression (right) for the spinal cord (dorsal) lineages. (J) Pseudotime-dependent chromatin accessibility (purple) and gene expression (green) change along the spinal cord (dorsal) lineages. (K) Venn plot shows the overlap of genes between (I) and (Supplementary Figure S4A). (L) Barplots showing the Gene Ontology (GO) of identified pseudotime-dependent genes along the spinal cord (dorsal) and spinal cord (ventral).
Mapping differential peaks to the genome enabled us to predict the impact of cis-regulatory element (CREs) associated with genes on identifying critical developmental regulators. We tabulated the number of peaks near each gene and ranked them accordingly. Genes having frequent open chromatin domains were deemed higher accessibility and may be more important in cell fate-determining. We found that Fosl2 (Yin et al., 2023) in the spinal cord, Zic4 in the spinal cord (dorsal) (Aruga et al., 1996; Ding et al., 2004) and Ascl1 in spinal cord (ventral) (Kicheva et al., 2014; Misra et al., 2014) have frequent open chromatin domains, which determines the transition of spinal cord progenitor cells to neurons of the dorsal or ventral spinal cord (Figure 2E).
To investigate the transcription factor (TFs) potentially driving the regulatory programs in developing spinal cord, we assayed for TF motif enrichment in differential peaks (Figure 2F). A number of TFs in the same family were deemed enriched due to the similarities in DNA binding motifs. Top enrichment motifs in spinal cord [HOX family (HOXC4, HOXB4, HOXA4)], the members of which establish the distinct neuronal cell fates strongly agree with established spinal cord TFs in the literature (Prince et al., 1998; Sagner and Briscoe, 2019). Similarly, we observed enrichment of ZIC family motifs (ZIC1, ZIC3) and RFX family motifs (RFX4, RFX2, RFX6, RFX3) in spinal cord (dorsal) (Blackshear et al., 2003; Ashique et al., 2009), ZIC1 have also been shown to be important for the early specification of the spinal cord (dorsal) (Aruga et al., 2002). The nuclear receptor subfamily (NR5A1, NR4A3, NR1H4) motifs in spinal cord (ventral) (Figure 2F) (Kon et al., 2015; Ghazale et al., 2019). To investigate the motif activity in spinal cord lineages, we employed chromVAR to measure the deviation z scores of TF motif and then calculated the correlation between deviation z scores of motifs and the TF expression in spinal cord lineages (Schep et al., 2017). We identified 53 putative activators and 50 repressors (Figure 2G), such as Zic1, Pou3f3, Zfp263, and Pax3. Additionally, Pou3f3 gene locus coaccessible peaks were found in all three spinal cord lineages, suggesting potential coaccessible CREs (Figure 2H) (Misra et al., 2014). These chromatin behaviors are significant for cell fate specification in spinal cord lineages.
Reconstruction of developmental trajectories during spinal cord lineages
To understand the dynamic change in the development and differentiation of the spinal cord in the dorsal or ventral direction, we established trajectories based on sequential differentiation states. We identified several genes with similar dynamic patterns for cis-elements and gene expression (Figure 2I and Supplementary Figure S4A). Besides some genes shared between dorsal and ventral development, others showed differential characteristics (Plcb1, Elmo1, Lsamp, Nrxn1 in dorsal direction; Aldh1a2, Crabp2, Prkg1, Nrg3 in ventral direction) (Figure 2I and Supplementary Figure S4A). This also reflects the characteristics of different neuron subgroups of the spinal cord (dorsal) lineage (Casz1, Nav2, and Prdm16) and spinal cord (ventral) lineage (Nes, Zfp536, Nr2f1, and Hoxc5). In the spinal cord (dorsal) lineage, we observed that Pax7, Pax3, Msx1, and Zic4 maintained chromatin accessibility at this locus, and gene expression increased along the pseudotimes as accessibility increased (Figure 2J). The same was seen in the spinal cord (ventral) lineage for Pax7, Nr2f1, Hoxb9, and Hoxc4 (Supplementary Figure S4B).
We compared pseudotime dynamics genes from the dorsal and ventral directions. We found that, apart from some shared genes (187 genes (29 TFs): Pou3f3, Lin28a, Sox9, etc.), there were distinct characteristics for the development towards the dorsal [114 genes (17 TFs): Npas3, Zic1, Zic4, etc.] or ventral direction [123 genes (13 TFs): Hoxa9, Aff3, Tcf7l1, etc.] (Figure 2K). Zic1, which regulates key marker genes (Nr2f1, Foxp1, Cux2, and Hmga2) with high motif activity, is essential for the early specification of dorsal neurons. Npas3, which is mainly expressed in the late stage of spinal cord (dorsal) differentiation (Kamm et al., 2013), was also supported by our data (Figure 2K and Supplementary Figure S4C). We also identified additional TFs that regulate spinal cord (ventral) fate, such as Hoxc5, Glis3, Hoxa9, Tcf7l1, and Nr2f2 (Supplementary Figure S4D). Finally, gene enrichment analysis revealed that pseudotime dynamics genes associated with the dorsal direction were linked to “Neuron projection guidance,” “Neural tube development,” “Glutamate receptor signaling pathway,” and “Regulation of BMP signaling pathway”; those related to the ventral direction were related to “Behavioral fear response,” “Actin crosslink formation” and “Multicellular organismal response to stress” (Figure 2L).
Dynamic epigenomic landscapes across developmental trajectories in mouse somitogenesis
To investigate the heterogeneity involved in somitogenesis, we performed UMAP analysis of cells in somitogenesis and identified five subclusters, two of which maintained chromatin accessibility near paraxial mesoderm precursor markers were annotated as paraxial mesoderm (PM) and paraxial mesoderm A (PMA) (Figure 3A and Supplementary Figure S2). Differential chromatin accessibility analysis revealed 3,602 and 5,755 peaks specifically open in PM and PMA, respectively. In particular, Hoxb1, Map4k5, and so on had higher accessibility in the promoter region for PM, while Ctsb and Asb6 and so on had higher accessibility for PMA (Figure 3B). Gene Ontology (GO) analysis using Genomic Regions Enrichment of Annotations Tool (GREAT) (Mclean et al., 2010) showed that upregulated peaks in PM were associated with regionalization, somite development and skeletal muscle system development, while those in PMA were mostly associated with ossification (Figure 3C). These results implied that the PM was involved in skeletal muscle differentiation and PMA potentially develop into the skeleton.
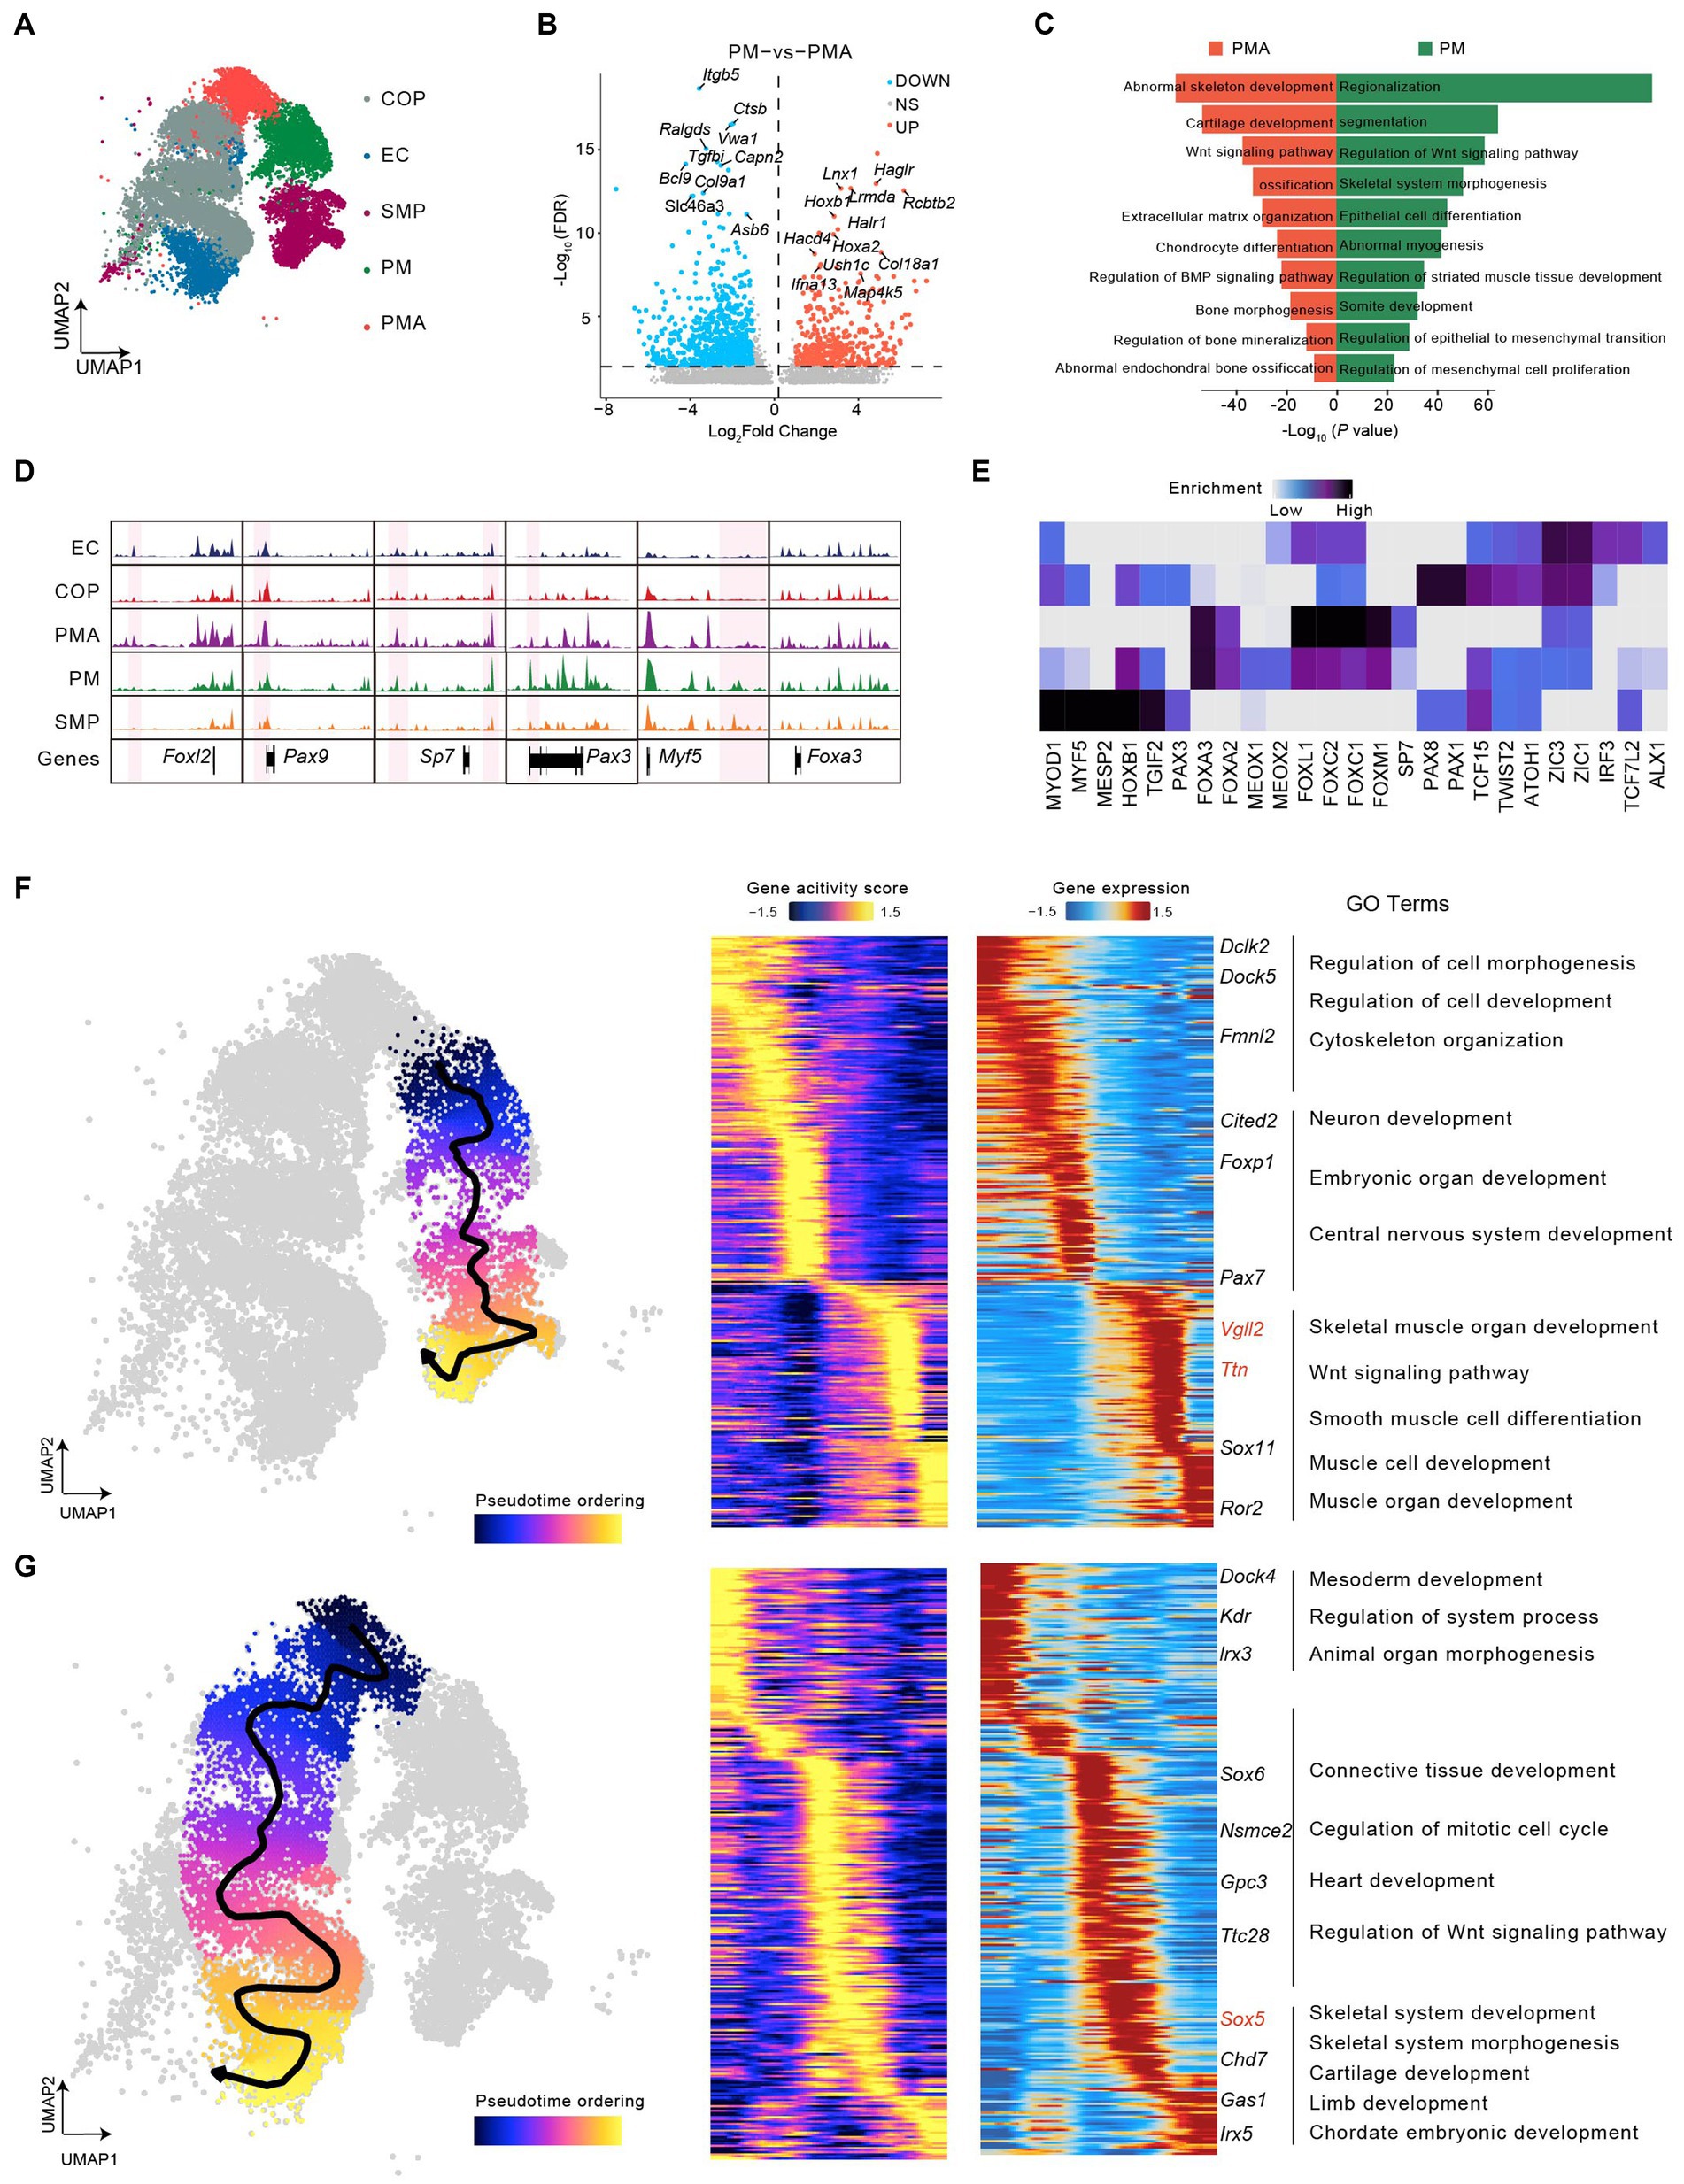
Figure 3. Dynamic epigenomic landscapes across developmental trajectories in mouse somitogenesis. (A) UMAP visualization of cells in mouse somitogenesis. (B) Volcano plot of differential peaks compared between PM and PMA. (C) GREAT Gene ontology (GO) annotation of differential peaks upregulated in PM (green) and in PMA (red). (D) Genome-wide coverage tracks from each cluster around the Foxl2, Pax9, Sp7, Pax1, Myf5, and Foxa3 gene loci in somitogenesis. Specific peaks activated in different clusters have been marked in pink region. (E) The heatmap of enriched motifs from each cluster in somitogenesis. (F) The scatter plot covering UMAP demonstrated the differentiation trajectory from PM to skeletal muscle progenitors (left). Heatmaps depicting consistent genes of gene score (middle) and gene expression (right) for PM lineage. (G) as (F) but with respect to PMA lineage. Key genes for lineages have been marked, and GO annotations were indicated.
We then highlighted subcluster-specific peaks using coverage track analysis, indicating that Sp7 and Pax3 showed chromatin accessibility specifically in PMA and PM. According to previous studies, Sp7 (Osterix) knockout induces an abnormal bone morphogenesis phenotype and immature osteocytes in mice (Nakashima et al., 2002; Zhou et al., 2010) and is also associated with human skeletal diseases (Sinha and Zhou, 2013). Pax3, a member of the PAX family, is a major regulator of myogenesis and skeletal muscle development (Buckingham and Relaix, 2007; Buckingham and Relaix, 2015; Boudjadi et al., 2018). In addition, Foxl2, Pax9, and Myf5 showed specific chromatin accessibility in early chondrocytes (EC), COP, as well as skeletal muscle progenitors (SMP), respectively. Previous studies have found that Foxl2 can modulate cartilage development (Marongiu et al., 2015), Pax9 may be vital for chondrocyte growth (Peters et al., 1999), and Myf5 is an important regulator of skeletal muscle system development (Zammit, 2017). In contrast, Foxa3 maintained relatively high accessibility in each subcluster (Figure 3D), which suggested a crucial role for both skeletal and skeletal muscle development. Consistent with our data, a previous study revealed the essential role of Foxa3 in chondrocyte differentiation in mice (Ionescu et al., 2012). Motif enrichment analysis across all subclusters showed a series of subcluster-specific motifs, such as Myf5, mainly enriched in skeletal muscle progenitors. However, some motifs are enriched in several subclusters. For instance, Zic1 and Zic3 were enriched in all subclusters except skeletal muscle progenitors (Figure 3E). Finally, we constructed the trajectory from PM into skeletal muscle progenitors and found a series of genes with pseudotime dynamic patterns (Figure 3F). By integrating scATAC-seq and scRNA-seq, we observed a group of genes like Vgll2 and Ttn gradually increased expression with increased chromatin accessibility along the pseudotime. GO term enrichment analysis shown those genes were mainly enriched in muscle-related processes, including muscle cell development, skeletal muscle organ development, Wnt signaling pathway, and so on (Figure 3F). The pseudotime analysis for PMA to chondrocyte and osteoblast progenitors and then to early chondrocytes showing the pseudotime dynamic genes such as lrx3, Sox6, Sox5 (Tani et al., 2020), Chd7 and Irx5 were mainly enriched in the skeletal developmental process, including skeletal system development, cartilage development and chordate embryonic development (Figure 3G). Overall, our findings showed the heterogeneity and epigenetic dynamics during somitogenesis.
Predicting cell types associated traits and diseases in embryo development
The vast majority of SNPs localized to noncoding regions of the genome and operate in a cell-type-specific manner (Prescott et al., 2015; Nott et al., 2019; Krausgruber et al., 2020). Given the degree of conservation of chromatin accessibility between mice and humans, the genomic location in human was matched to the mouse orthologue (Vierstra et al., 2014; Moore et al., 2020). Mouse scATAC-seq data help to understand the cell-type-specific effects of genetic variation underlying complex human traits (Cusanovich et al., 2018; Li et al., 2021; Miao et al., 2021).
We applied LDSC analysis (see Methods) to the mouse embryonic scATAC-seq datasets. We linked human SNPs from the UK Biobank4 to orthologous coordinates of the mouse chromatin accessibility regions to calculate the enrichment of traits across the chromatin accessibility in each annotated cluster. As a general trend, 49 traits were enriched (coefficient p < 0.01) in at least one cell type (Figure 4A and Supplementary Table S1). In addition, we observed enriched heritability for neurological traits (e.g., “sleeplessness” and “neuroticism”) shown in neural clusters (Figure 4B). In line with expectations, somitogenesis-related traits (e.g., “body height” and “body balding”) in clusters correspond to somitogenesis cells (Figure 4C). After lifting over human SNPs to orthologous coordinates in the mouse genome (see Section Methods), several orthologous GWAS locus observed a strong open chromatin region in the spinal cord and somitogenesis (Figures 4D,E). As an example, we identified rs4361970 region at Lmx1a locus. This locus has been implicated in sleep apnea and robustly associated with the expression of critical genes involved in mitochondrial functions (Chizhikov and Millen, 2004; Radulovacki et al., 2004; Doucet-Beaupré et al., 2016; Kostin et al., 2021). We observed that rs4361970 was most accessible in E8.5 spinal cord cells (Figure 4D). We also found rs2733330 region at Tcf12 locus (Cao et al., 2010; Ke et al., 2021; Wang et al., 2022). Tcf12 bind to the E-box regions of Myod and Myog, contributing to SMP (Parker et al., 2006). We observed that rs2733330 was most accessible in SMP (Figure 4E).
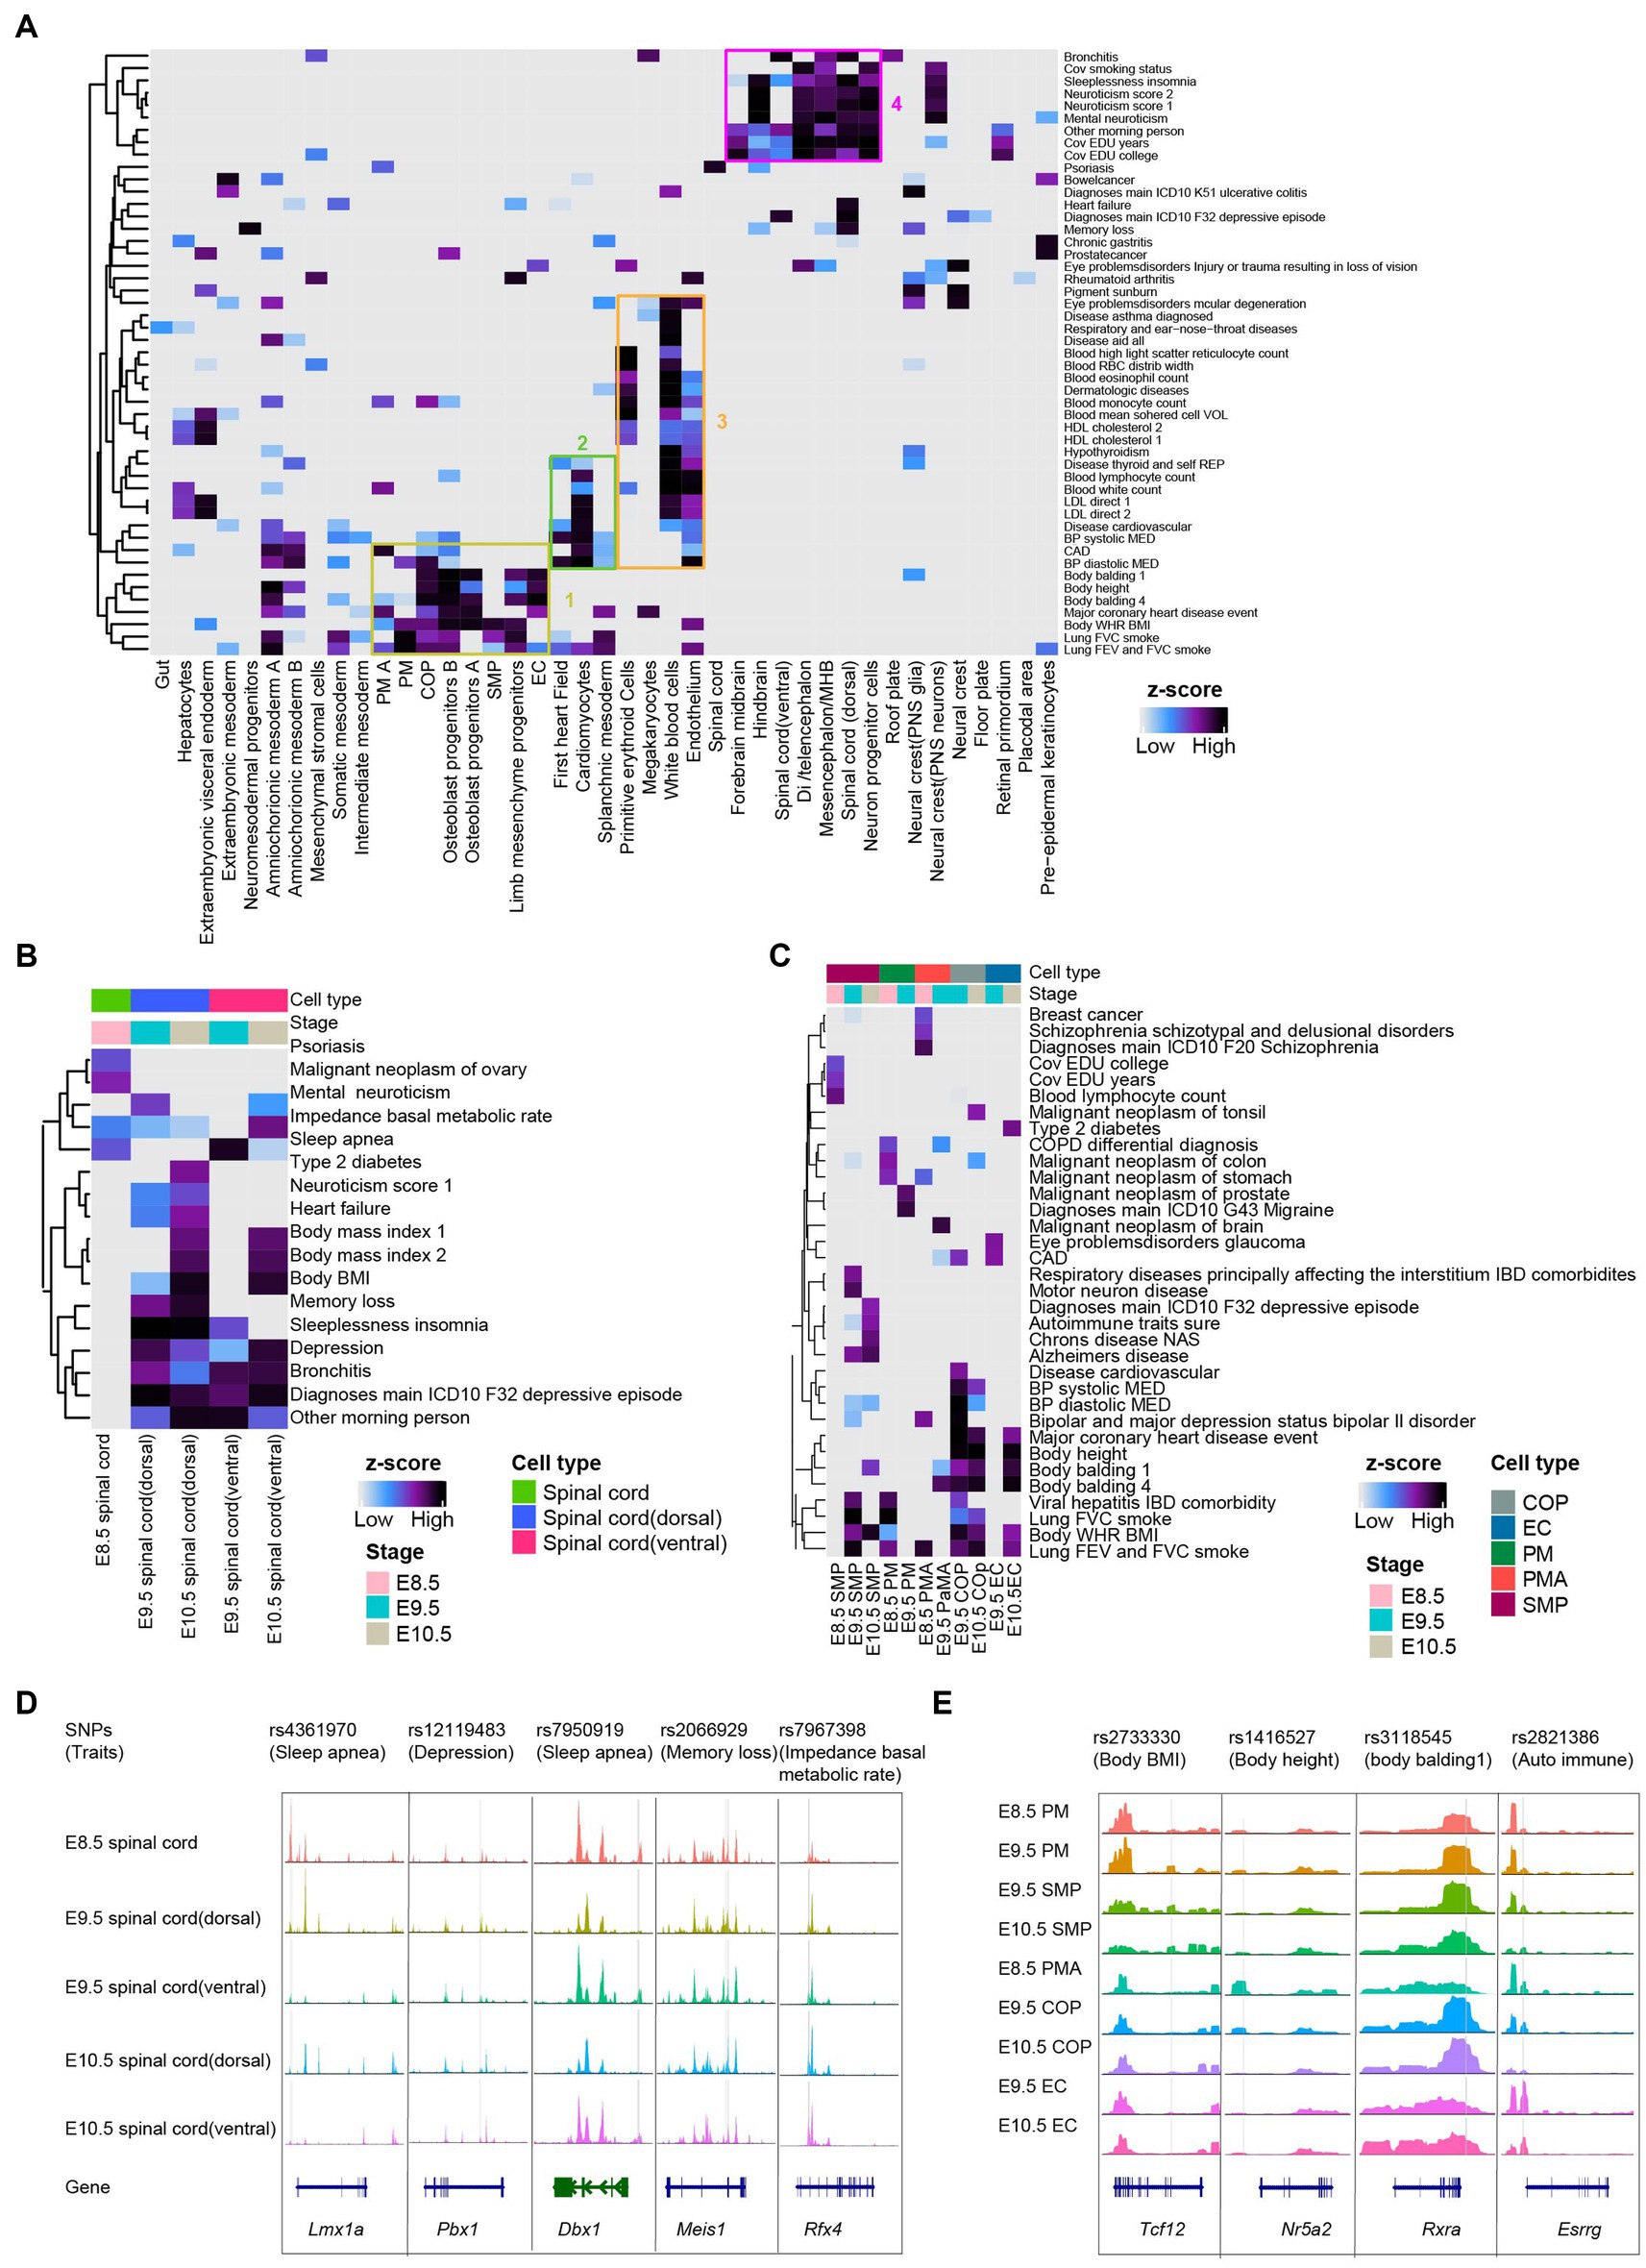
Figure 4. Mouse embryo chromatin accessibility profiles associated with human traits and genetic diseases. (A) Heatmaps depicting enrichment for traits across all cell types with scATAC-seq dataset. The horizontal axis is the cell types from global clustering, and the vertical axis is the traits/diseases in the GWAS database. The boxes represented selected significant feature enrichment. (B) Heatmaps depicting enrichment for the phenotype in spinal cord lineages from E8.5-E10.5. (C) Heatmaps showing enrichment for the phenotype in somitogenesis from E8.5-E10.5. (D,E) Examples of the benefits of snATAC-seq for pinpointing cell types whereby candidate spinal cord lineage (D) and somitogenesis (E) regulatory variants are acting. Genes in the sense and antisense directions are shown in blue and green. The location of each human SNPs is depicted by a vertical gray line.
Discussion
In this study we have generated a cellular resolution chromatin accessibility map of the developing mouse embryo and identified vital cell type-specific regulatory networks in organogenesis. The difference between E8.5 and the other two time points are significant, whereas the difference between E9.5 and E10.5 are small, suggesting that E8.5 cell type is closer to gastrulation stage cells. By integrating previously published scRNA-seq datasets (Qiu et al., 2022) and spatial RNA-seq (Chen et al., 2022) with our scATAC result, we constructed spatial maps of the epigenetic landscape in mouse organgenesis.
The spinal cord connects and allows communication between the brain and surrounding organs, and its dorsal-ventral axis and neuronal subtypes have been reported (Delile et al., 2019; Shu et al., 2022). However, the epigenetic basis of cell fate decisions related to spinal cord development along the dorsal-ventral axis remains unclear. Here, we defined the cellular differentiation trajectories, characterize regulatory dynamics, and identify key driving TFs for spinal cord development.
Previous studies have mainly focused on somitogenesis, however, the dynamics of epigenetic regulation of PM development in somitogenesis remain largely unknown. We present the first report of the epigenomic regulatory mechanism driving paraxial mesoderm to develop into sclerotome and dermomyotome, which form the axial skeleton, and skeletal muscle progenitors. We identified the differential peaks between PM and PMA to support this hypothesis. Complementing these studies, our results suggested that motifs (such as Sp7, Pax3, Foxl2, Pax9, Myf5) are involved in the differentiation and development of the skeleton and skeletal muscle. Furthermore, the differentiation trajectories indicated a pseudotime from PM to skeletal muscle progenitors, involving the Wnt signaling pathway, which is vital for the skeletal muscle development (Girardi and Le Grand, 2018). Additionally, our results showed that potential differentiation from PMA to early chondrocytes, and skeleton development-related signaling contribute to this process. In conclusion, our findings depicted the dynamics of epigenetic regulation for the differentiation of mouse paraxial mesoderm to the skeleton and skeletal muscle at single-cell resolution.
GWAS signals have been successful in identifying nucleotide variations with specific traits/diseases (Maurano et al., 2012). SNPs associated with human traits/diseases are located in regions with murine cell type-specific and developmental stage-specific regulatory activity, providing potential targets for subsequent pathogenesis studies and treatments.
Data availability statement
The datasets presented in this study can be found in online repositories. The names of the repository/repositories and accession number(s) can be found at: https://db.cngb.org/search/project/CNP0003941/.
Ethics statement
The animal study was reviewed and approved by the institutional review board of BGI ethical clearance.
Author contributions
QD, SW, ChuanL, and LL conceived the idea. GL collected the samples and generated the data. JX, YY, XL, MC, SD, and XC assisted with the experiments. SW analyzed the data with the assistance of QL, WF, SH, HZ, and WM. QD wrote the manuscript with the input of SW, YL, ChangL, and LL supervised the study. ChuanL and YL provided helpful comments on this study and revised the manuscript. All authors contributed to the article and approved the submitted version.
Funding
This study were supported by the Guangdong Basic and Applied Basic Research Foundation (2021B1515120075) and Shenzhen Bay Laboratory (SZBL2019062801012).
Acknowledgments
The authors thank all members of the Center for Digitizing Cells from the Institute of SuperCells (BGI) for their support. The authors also thank China National GeneBank for providing technical support.
Conflict of interest
The authors declare that the research was conducted in the absence of any commercial or financial relationships that could be construed as a potential conflict of interest.
Publisher’s note
All claims expressed in this article are solely those of the authors and do not necessarily represent those of their affiliated organizations, or those of the publisher, the editors and the reviewers. Any product that may be evaluated in this article, or claim that may be made by its manufacturer, is not guaranteed or endorsed by the publisher.
Supplementary material
The Supplementary material for this article can be found online at: https://www.frontiersin.org/articles/10.3389/fnins.2023.1170355/full#supplementary-material
Footnotes
1. ^http://github.com/shiquan/PISA
2. ^https://broadinstitute.github.io/picard
3. ^https://github.com/bulik/ldsc/wiki/Cell-type-specific-analyses
References
Alaynick, W. A., Jessell, T. M., and Pfaff, S. L. (2011). SnapShot: spinal cord development. Cells 146, 178–178.e1. doi: 10.1016/j.cell.2011.06.038
Argelaguet, R., Clark, S. J., Mohammed, H., Stapel, L. C., Krueger, C., Kapourani, C. A., et al. (2019). Multi-omics profiling of mouse gastrulation at single-cell resolution. Nature 576, 487–491. doi: 10.1038/s41586-019-1825-8
Argelaguet, R., Lohoff, T., Li, J. G., Nakhuda, A., Drage, D., Krueger, F., et al. (2022). Decoding gene regulation in the mouse embryo using single-cell multi-omics. bioRxiv. doi: 10.1101/2022.06.15.496239
Aruga, J., Tohmonda, T., Homma, S., and Mikoshiba, K. (2002). Zic1 promotes the expansion of dorsal neural progenitors in spinal cord by inhibiting neuronal differentiation. Dev. Biol. 244, 329–341. doi: 10.1006/dbio.2002.0598
Aruga, J., Yozu, A., Hayashizaki, Y., Okazaki, Y., Chapman, V. M., and Mikoshiba, K. (1996). Identification and characterization of Zic4, a new member of the mouse Zic gene family. Gene 172, 291–294. doi: 10.1016/0378-1119(96)00111-4
Ashique, A. M., Choe, Y., Karlen, M., May, S. R., Phamluong, K., Solloway, M. J., et al. (2009). The Rfx4 transcription factor modulates Shh signaling by regional control of ciliogenesis. Sci. Signal. 2:ra70. doi: 10.1126/scisignal.2000602
Biancalani, T., Scalia, G., Buffoni, L., Avasthi, R., Lu, Z., Sanger, A., et al. (2021). Deep learning and alignment of spatially resolved single-cell transcriptomes with tangram. Nat. Methods 18, 1352–1362. doi: 10.1038/s41592-021-01264-7
Blackshear, P. J., Graves, J. P., Stumpo, D. J., Cobos, I., Rubenstein, J. L., and Zeldin, D. C. (2003). Graded phenotypic response to partial and complete deficiency of a brain-specific transcript variant of the winged helix transcription factor RFX4. Development 130, 4539–4552. doi: 10.1242/dev.00661
Boudjadi, S., Chatterjee, B., Sun, W., Vemu, P., and Barr, F. G. (2018). The expression and function of PAX3 in development and disease. Gene 666, 145–157. doi: 10.1016/j.gene.2018.04.087
Buckingham, M., and Relaix, F. (2007). The role of Pax genes in the development of tissues and organs: Pax3 and Pax7 regulate muscle progenitor cell functions. Annu. Rev. Cell Dev. Biol. 23, 645–673. doi: 10.1146/annurev.cellbio.23.090506.123438
Buckingham, M., and Relaix, F. (2015). PAX3 and PAX7 as upstream regulators of myogenesis. Semin. Cell Dev. Biol. 44, 115–125. doi: 10.1016/j.semcdb.2015.09.017
Bulik-Sullivan, B., Finucane, H. K., Anttila, V., Gusev, A., Day, F. R., Loh, P.-R., et al. (2015). An atlas of genetic correlations across human diseases and traits. Nat. Genet. 47, 1236–1241. doi: 10.1038/ng.3406
Cao, J., Spielmann, M., Qiu, X., Huang, X., Ibrahim, D. M., Hill, A. J., et al. (2019). The single-cell transcriptional landscape of mammalian organogenesis. Nature 566, 496–502. doi: 10.1038/s41586-019-0969-x
Cao, Y., Yao, Z., Sarkar, D., Lawrence, M., Sanchez, G. J., Parker, M. H., et al. (2010). Genome-wide MyoD binding in skeletal muscle cells: a potential for broad cellular reprogramming. Dev. Cell 18, 662–674. doi: 10.1016/j.devcel.2010.02.014
Chen, A., Liao, S., Cheng, M., Ma, K., Wu, L., Lai, Y., et al. (2022). Spatiotemporal transcriptomic atlas of mouse organogenesis using DNA nanoball-patterned arrays. Cells 185:e1721, 1777–1792.e21. doi: 10.1016/j.cell.2022.04.003
Chizhikov, V. V., and Millen, K. J. (2004). Control of roof plate formation by Lmx1a in the developing spinal cord. Development 131, 2693–2705. doi: 10.1242/dev.01139
Christoph, B., Liu, S., Ranga, A., Senjuti, G., Olivier, P., and Sahand, H. (2022). Paraxial mesoderm organoids model development of human somites. elife 11:e68925. doi: 10.7554/eLife.68925
Corces, M. R., Trevino, A. E., Hamilton, E. G., Greenside, P. G., Sinnott-Armstrong, N. A., Vesuna, S., et al. (2017). An improved ATAC-seq protocol reduces background and enables interrogation of frozen tissues. Nat. Methods 14, 959–962. doi: 10.1038/nmeth.4396
Cusanovich, D. A., Hill, A. J., Aghamirzaie, D., Daza, R. M., Pliner, H. A., Berletch, J. B., et al. (2018). A single-cell atlas of in vivo mammalian chromatin accessibility. Cells 174:e1318, 1309–1324.e18. doi: 10.1016/j.cell.2018.06.052
Delile, J., Rayon, T., Melchionda, M., Edwards, A., Briscoe, J., and Sagner, A. (2019). Single cell transcriptomics reveals spatial and temporal dynamics of gene expression in the developing mouse spinal cord. Development 146:dev173807. doi: 10.1242/dev.173807
Ding, Y.-Q., Yin, J., Kania, A., Zhao, Z.-Q., Johnson, R. L., and Chen, Z.-F. (2004). Lmx1b controls the differentiation and migration of the superficial dorsal horn neurons of the spinal cord. Development 131, 3693–3703. doi: 10.1242/dev.01250
Dong, J., Hu, Y., Fan, X., Wu, X., Mao, Y., Hu, B., et al. (2018). Single-cell RNA-seq analysis unveils a prevalent epithelial/mesenchymal hybrid state during mouse organogenesis. Genome Biol. 19:31. doi: 10.1186/s13059-018-1416-2
Doucet-Beaupré, H., Gilbert, C., Profes, M. S., Chabrat, A., Pacelli, C., Giguère, N., et al. (2016). Lmx1a and Lmx1b regulate mitochondrial functions and survival of adult midbrain dopaminergic neurons. Proc. Natl. Acad. Sci. 113, E4387–E4396. doi: 10.1073/pnas.1520387113
Downs, K. M., and Davies, T. (1993). Staging of gastrulating mouse embryos by morphological landmarks in the dissecting microscope. Development 118, 1255–1266. doi: 10.1242/dev.118.4.1255
Dries, R., Zhu, Q., Dong, R., Eng, C.-H. L., Li, H., Liu, K., et al. (2021). Giotto: a toolbox for integrative analysis and visualization of spatial expression data. Genome Biol. 22, 1–31. doi: 10.1186/s13059-021-02286-2
Farrell, J. A., Wang, Y., Riesenfeld, S. J., Shekhar, K., Regev, A., and Schier, A. F. (2018). Single-cell reconstruction of developmental trajectories during zebrafish embryogenesis. Science 360:eaar3131. doi: 10.1126/science.aar3131
Ghazale, H., Ripoll, C., Leventoux, N., Jacob, L., Azar, S., Mamaeva, D., et al. (2019). RNA profiling of the human and mouse spinal cord stem cell niches reveals an embryonic-like regionalization with MSX1(+) roof-plate-derived cells. Stem Cell Rep. 12, 1159–1177. doi: 10.1016/j.stemcr.2019.04.001
Girardi, F., and Le Grand, F. (2018). Wnt signaling in skeletal muscle development and regeneration. Prog. Mol. Biol. Transl. Sci. 153, 157–179. doi: 10.1016/bs.pmbts.2017.11.026
Granja, J. M., Corces, M. R., Pierce, S. E., Bagdatli, S. T., Choudhry, H., Chang, H. Y., et al. (2021). ArchR is a scalable software package for integrative single-cell chromatin accessibility analysis. Nat. Genet. 53, 403–411. doi: 10.1038/s41588-021-00790-6
Han, L., Chaturvedi, P., Kishimoto, K., Koike, H., Nasr, T., Iwasawa, K., et al. (2020). Single cell transcriptomics identifies a signaling network coordinating endoderm and mesoderm diversification during foregut organogenesis. Nat. Commun. 11:4158. doi: 10.1038/s41467-020-17968-x
Hao, Y., Hao, S., Andersen-Nissen, E., Mauck, W. M., Zheng, S., Butler, A., et al. (2021). Integrated analysis of multimodal single-cell data. Cells 184:e3529, 3573–3587.e29. doi: 10.1016/j.cell.2021.04.048
Huang, J., Liang, X., Xuan, Y., Geng, C., Li, Y., Lu, H., et al. (2017). A reference human genome dataset of the BGISEQ-500 sequencer. Gigascience 6, 1–9. doi: 10.1093/gigascience/gix024
Ibarra-Soria, X., Jawaid, W., Pijuan-Sala, B., Ladopoulos, V., Scialdone, A., Jörg, D. J., et al. (2018). Defining murine organogenesis at single-cell resolution reveals a role for the leukotriene pathway in regulating blood progenitor formation. Nat. Cell Biol. 20, 127–134. doi: 10.1038/s41556-017-0013-z
Ionescu, A., Kozhemyakina, E., Nicolae, C., Kaestner, K. H., Olsen, B. R., and Lassar, A. B. (2012). FoxA family members are crucial regulators of the hypertrophic chondrocyte differentiation program. Dev. Cell 22, 927–939. doi: 10.1016/j.devcel.2012.03.011
Jiang, S., Huang, Z., Li, Y., Yu, C., Yu, H., Ke, Y., et al. (2023). Single-cell chromatin accessibility and transcriptome atlas of mouse embryos. Cell Rep. 42:112210. doi: 10.1016/j.celrep.2023.112210
Kamm, G.B., Pisciottano, F., Kliger, R., and Franchini, L. F. (2013). The developmental brain gene NPAS3 contains the largest number of accelerated regulatory sequences in the human genome. Mol. Biol. Evol. 30, 1088–1102.
Ke, W., Reed, J. N., Yang, C., Higgason, N., Rayyan, L., Wählby, C., et al. (2021). Genes in human obesity loci are causal obesity genes in C. elegans. PLoS Genet. 17:e1009736. doi: 10.1371/journal.pgen.1009736
Kelly, N. H., Huynh, N. P. T., and Guilak, F. (2020). Single cell RNA-sequencing reveals cellular heterogeneity and trajectories of lineage specification during murine embryonic limb development. Matrix Biol. 89, 1–10. doi: 10.1016/j.matbio.2019.12.004
Kicheva, A., Bollenbach, T., Ribeiro, A., Valle, H. P., Lovell-Badge, R., Episkopou, V., et al. (2014). Coordination of progenitor specification and growth in mouse and chick spinal cord. Science 345:1254927. doi: 10.1126/science.1254927
Kojima, Y., Tam, O. H., and Tam, P. P. (2014). Timing of developmental events in the early mouse embryo. Semin. Cell Dev. Biol. 34, 65–75. doi: 10.1016/j.semcdb.2014.06.010
Kon, T., Miki, Y., Tanji, K., Mori, F., Tomiyama, M., Toyoshima, Y., et al. (2015). Localization of nuclear receptor subfamily 4, group a, member 3 (NR4A3) in Lewy body disease and multiple system atrophy. Neuropathology 35, 503–509. doi: 10.1111/neup.12210
Kostin, A., Alam, M. A., Mcginty, D., and Alam, M. N. (2021). Adult hypothalamic neurogenesis and sleep–wake dysfunction in aging. Sleep 44:zsaa173. doi: 10.1093/sleep/zsaa173
Krausgruber, T., Fortelny, N., Fife-Gernedl, V., Senekowitsch, M., Schuster, L. C., Lercher, A., et al. (2020). Structural cells are key regulators of organ-specific immune responses. Nature 583, 296–302. doi: 10.1038/s41586-020-2424-4
Lai, H. C., Seal, R. P., and Johnson, J. E. (2016). Making sense out of spinal cord somatosensory development. Development 143, 3434–3448. doi: 10.1242/dev.139592
Le Dréau, G., and Martí, E. (2012). Dorsal–ventral patterning of the neural tube: a tale of three signals. Dev. Neurobiol. 72, 1471–1481. doi: 10.1002/dneu.22015
Li, Y. E., Preissl, S., Hou, X., Zhang, Z., Zhang, K., Qiu, Y., et al. (2021). An atlas of gene regulatory elements in adult mouse cerebrum. Nature 598, 129–136. doi: 10.1038/s41586-021-03604-1
Magaletta, M. E., Lobo, M., Kernfeld, E. M., Aliee, H., Huey, J. D., Parsons, T. J., et al. (2022). Integration of single-cell transcriptomes and chromatin landscapes reveals regulatory programs driving pharyngeal organ development. Nat. Commun. 13, 1–16. doi: 10.1038/s41467-022-28067-4
Marongiu, M., Marcia, L., Pelosi, E., Lovicu, M., Deiana, M., Zhang, Y., et al. (2015). FOXL2 modulates cartilage, skeletal development and IGF1-dependent growth in mice. BMC Dev. Biol. 15:27. doi: 10.1186/s12861-015-0072-y
Maurano, M. T., Humbert, R., Rynes, E., Thurman, R. E., Haugen, E., Wang, H., et al. (2012). Systematic localization of common disease-associated variation in regulatory DNA. Science 337, 1190–1195. doi: 10.1126/science.1222794
Mclean, C. Y., Bristor, D., Hiller, M., Clarke, S. L., Schaar, B. T., Lowe, C. B., et al. (2010). GREAT improves functional interpretation of cis-regulatory regions. Nat. Biotechnol. 28, 495–501. doi: 10.1038/nbt.1630
Miao, Z., Balzer, M. S., Ma, Z., Liu, H., Wu, J., Shrestha, R., et al. (2021). Single cell regulatory landscape of the mouse kidney highlights cellular differentiation programs and disease targets. Nat. Commun. 12:2277. doi: 10.1038/s41467-021-22266-1
Misra, K., Luo, H., Li, S., Matise, M., and Xiang, M. (2014). Asymmetric activation of Dll4-notch signaling by Foxn4 and proneural factors activates BMP/TGFβ signaling to specify V2b interneurons in the spinal cord. Development 141, 187–198. doi: 10.1242/dev.092536
Moore, J. E., Purcaro, M. J., Pratt, H. E., Epstein, C. B., Shoresh, N., Adrian, J., et al. (2020). Expanded encyclopaedias of DNA elements in the human and mouse genomes. Nature 583, 699–710. doi: 10.1038/s41586-020-2493-4
Nakashima, K., Zhou, X., Kunkel, G., Zhang, Z., Deng, J. M., Behringer, R. R., et al. (2002). The novel zinc finger-containing transcription factor osterix is required for osteoblast differentiation and bone formation. Cells 108, 17–29. doi: 10.1016/s0092-8674(01)00622-5
Nott, A., Holtman, I. R., Coufal, N. G., Schlachetzki, J. C., Yu, M., Hu, R., et al. (2019). Brain cell type–specific enhancer–promoter interactome maps and disease-risk association. Science 366, 1134–1139. doi: 10.1126/science.aay0793
Nowotschin, S., Setty, M., Kuo, Y. Y., Liu, V., Garg, V., Sharma, R., et al. (2019). The emergent landscape of the mouse gut endoderm at single-cell resolution. Nature 569, 361–367. doi: 10.1038/s41586-019-1127-1
Parker, M. H., Perry, R. L., Fauteux, M. C., Berkes, C. A., and Rudnicki, M. A. (2006). MyoD synergizes with the E-protein HEBβ to induce myogenic differentiation. Mol. Cell. Biol. 26, 5771–5783. doi: 10.1128/MCB.02404-05
Peng, G., Suo, S., Cui, G., Yu, F., Wang, R., Chen, J., et al. (2019). Molecular architecture of lineage allocation and tissue organization in early mouse embryo. Nature 572, 528–532. doi: 10.1038/s41586-019-1469-8
Peters, H., Wilm, B., Sakai, N., Imai, K., Maas, R., and Balling, R. (1999). Pax1 and Pax9 synergistically regulate vertebral column development. Development 126, 5399–5408. doi: 10.1242/dev.126.23.5399
Pijuan-Sala, B., Griffiths, J. A., Guibentif, C., Hiscock, T. W., Jawaid, W., Calero-Nieto, F. J., et al. (2019). A single-cell molecular map of mouse gastrulation and early organogenesis. Nature 566, 490–495. doi: 10.1038/s41586-019-0933-9
Pijuan-Sala, B., Wilson, N. K., Xia, J., Hou, X., Hannah, R. L., Kinston, S., et al. (2020). Single-cell chromatin accessibility maps reveal regulatory programs driving early mouse organogenesis. Nat. Cell Biol. 22, 487–497. doi: 10.1038/s41556-020-0489-9
Prescott, S. L., Srinivasan, R., Marchetto, M. C., Grishina, I., Narvaiza, I., Selleri, L., et al. (2015). Enhancer divergence and cis-regulatory evolution in the human and chimp neural crest. Cells 163, 68–83. doi: 10.1016/j.cell.2015.08.036
Prince, V. E., Price, A. L., and Ho, R. K. (1998). Hox gene expression reveals regionalization along the anteroposterior axis of the zebrafish notochord. Dev. Genes Evol. 208, 517–522. doi: 10.1007/s004270050210
Qiu, C., Cao, J., Martin, B. K., Li, T., Welsh, I. C., Srivatsan, S., et al. (2022). Systematic reconstruction of cellular trajectories across mouse embryogenesis. Nat. Genet. 54, 328–341. doi: 10.1038/s41588-022-01018-x
Radulovacki, M., Pavlovic, S., Saponjic, J., and Carley, D. W. (2004). Modulation of reflex and sleep related apnea by pedunculopontine tegmental and intertrigeminal neurons. Respir. Physiol. Neurobiol. 143, 293–306. doi: 10.1016/j.resp.2004.02.012
Rogers, K. W., and Schier, A. F. (2011). Morphogen gradients: from generation to interpretation. Annu. Rev. Cell Dev. Biol. 27, 377–407. doi: 10.1146/annurev-cellbio-092910-154148
Sagar,, and Grün, D. (2020). Deciphering cell fate decision by integrated single-cell sequencing analysis. Annu. Rev. Biomed. Data Sci. 3, 1–22. doi: 10.1146/annurev-biodatasci-111419-091750
Sagner, A., and Briscoe, J. (2017). Morphogen interpretation: concentration, time, competence, and signaling dynamics. Wiley Interdiscip. Rev. Dev. Biol. 6:e271. doi: 10.1002/wdev.271
Sagner, A., and Briscoe, J. (2019). Establishing neuronal diversity in the spinal cord: a time and a place. Development 146:dev182154. doi: 10.1242/dev.182154
Schep, A. N., Wu, B., Buenrostro, J. D., and Greenleaf, W. J. (2017). chromVAR: inferring transcription-factor-associated accessibility from single-cell epigenomic data. Nat. Methods 14, 975–978. doi: 10.1038/nmeth.4401
Shahbazi, M. N. (2020). Mechanisms of human embryo development: from cell fate to tissue shape and back. Development 147:dev190629. doi: 10.1242/dev.190629
Shahbazi, M. N., and Zernicka-Goetz, M. (2018). Deconstructing and reconstructing the mouse and human early embryo. Nat. Cell Biol. 20, 878–887. doi: 10.1038/s41556-018-0144-x
Shu, M., Hong, D., Lin, H., Zhang, J., Luo, Z., Du, Y., et al. (2022). Single-cell chromatin accessibility identifies enhancer networks driving gene expression during spinal cord development in mouse. Dev. Cell 57, 2761–2775.e6. doi: 10.1016/j.devcel.2022.11.011
Sinha, K. M., and Zhou, X. (2013). Genetic and molecular control of osterix in skeletal formation. J. Cell. Biochem. 114, 975–984. doi: 10.1002/jcb.24439
Stuart, T., Srivastava, A., Madad, S., Lareau, C. A., and Satija, R. (2021). Single-cell chromatin state analysis with Signac. Nat. Methods 18, 1333–1341. doi: 10.1038/s41592-021-01282-5
Tani, S., Chung, U.-I., Ohba, S., and Hojo, H. (2020). Understanding paraxial mesoderm development and sclerotome specification for skeletal repair. Exp. Mol. Med. 52, 1166–1177. doi: 10.1038/s12276-020-0482-1
Vierstra, J., Rynes, E., Sandstrom, R., Zhang, M., Canfield, T., Hansen, R. S., et al. (2014). Mouse regulatory DNA landscapes reveal global principles of cis-regulatory evolution. Science 346, 1007–1012. doi: 10.1126/science.1246426
Wang, S., Liao, Y., Zhang, H., Jiang, Y., Peng, Z., Ren, R., et al. (2022). Tcf12 is required to sustain myogenic genes synergism with MyoD by remodelling the chromatin landscape. Commun. Biol. 5:1201. doi: 10.1038/s42003-022-04176-0
Wu, T., Hu, E., Xu, S., Chen, M., Guo, P., Dai, Z., et al. (2021). ClusterProfiler 4.0: A universal enrichment tool for interpreting omics data. The Innovation 2:100141.
Yin, F., Liu, Z., Zhang, D., Shen, Z., Niu, Z., and Guo, L. (2023). Identification of key genes involved in neural regeneration and the repairing effect of BDNF-overexpressed BMSCs on spinal cord ischemia-reperfusion injury in rats. Biomed. Pharmacother. 160:114293. doi: 10.1016/j.biopha.2023.114293
Yu, Y., Wei, X., Deng, Q., Lan, Q., Guo, Y., Han, L., et al. (2021). Single-nucleus chromatin accessibility landscape reveals diversity in regulatory regions across distinct adult rat cortex. Front. Mol. Neurosci. 14:651355. doi: 10.3389/fnmol.2021.651355
Zammit, P. S. (2017). Function of the myogenic regulatory factors Myf5, MyoD, Myogenin and MRF4 in skeletal muscle, satellite cells and regenerative myogenesis. Semin. Cell Dev. Biol. 72, 19–32. doi: 10.1016/j.semcdb.2017.11.011
Zhang, Y., Liu, T., Meyer, C. A., Eeckhoute, J., Johnson, D. S., Bernstein, B. E., et al. (2008). Model-based analysis of ChIP-Seq (MACS). Genome Biol. 9, R137–R139. doi: 10.1186/gb-2008-9-9-r137
Keywords: mouse organogenesis, single-cell ATAC-seq, spinal cord, paraxial mesoderm, cis-regulatory elements
Citation: Deng Q, Wang S, Huang Z, Lan Q, Lai G, Xu J, Yuan Y, Liu C, Lin X, Feng W, Ma W, Cheng M, Hao S, Duan S, Zheng H, Chen X, Hou Y, Luo Y, Liu L and Liu C (2023) Single-cell chromatin accessibility profiling of cell-state-specific gene regulatory programs during mouse organogenesis. Front. Neurosci. 17:1170355. doi: 10.3389/fnins.2023.1170355
Edited by:
Anthony LaMantia, Virginia Tech, United StatesReviewed by:
Daniel Meechan, Virginia Tech, United StatesRuan Degong, The University of Hong Kong, Hong Kong SAR, China
Copyright © 2023 Deng, Wang, Huang, Lan, Lai, Xu, Yuan, Liu, Lin, Feng, Ma, Cheng, Hao, Duan, Zheng, Chen, Hou, Luo, Liu and Liu. This is an open-access article distributed under the terms of the Creative Commons Attribution License (CC BY). The use, distribution or reproduction in other forums is permitted, provided the original author(s) and the copyright owner(s) are credited and that the original publication in this journal is cited, in accordance with accepted academic practice. No use, distribution or reproduction is permitted which does not comply with these terms.
*Correspondence: Yingjie Luo, bHVveWluZ2ppZUBnZW5vbWljcy5jbg==; Longqi Liu, bGl1bG9uZ3FpQGdlbm9taWNzLmNu; Chuanyu Liu, bGl1Y2h1YW55dUBnZW5vbWljcy5jbg==
†These authors have contributed equally to this work