 Fang Yu
 Yanzhe Gao2
 Fenglian Li
 Xiaohui Li
- 1College of Electronic Information and Optical Engineering, Taiyuan University of Technology, Taiyuan, China
- 2College of Life Sciences, Nankai University, Tianjin, China
- 3The Fifth Clinical Medical College of Shanxi Medical University, Department of Neurology, Shanxi Provincial People’s Hospital, Taiyuan, China
Introduction: Ischemic stroke patients commonly experience disorder of consciousness (DOC), leading to poorer discharge outcomes and higher mortality risks. Therefore, the identification of applicable electrophysiological biomarkers is crucial for the rapid diagnosis and evaluation of post-stroke disorder of consciousness (PS-DOC), while providing supportive evidence for cerebral neurology.
Methods: In our study, we conduct microstate analysis on resting-state electroencephalography (EEG) of 28 post-stroke patients with awake consciousness and 28 patients with PS-DOC, calculating the temporal features of microstates. Furthermore, we extract the Lempel-Ziv complexity of microstate sequences and the delta/alpha power ratio of EEG on spectral. Statistical analysis is performed to examine the distinctions in features between the two groups, followed by inputting the distinctive features into a support vector machine for the classification of PS-DOC.
Results: Both groups obtain four optimal topographies of EEG microstates, but notable distinctions are observed in microstate C. Within the PS-DOC group, there is a significant increase in the mean duration and coverage of microstates B and C, whereas microstate D displays a contrasting trend. Additionally, noteworthy variations are found in the delta/alpha ratio and Lempel-Ziv complexity between the two groups. The integration of the delta/alpha ratio with microstates’ temporal and Lempel-Ziv complexity features demonstrates the highest performance in the classifier (Accuracy = 91.07%).
Discussion: Our results suggest that EEG microstates can provide insights into the abnormal brain network dynamics in DOC patients post-stroke. Integrating the temporal and Lempel-Ziv complexity microstate features with spectral features offers a deeper understanding of the neuro mechanisms underlying brain damage in patients with DOC, holding promise as effective electrophysiological biomarkers for diagnosing PS-DOC.
1. Introduction
Stroke is widely acknowledged as the second leading cause of death and a prominent contributor to disability globally (Feigin et al., 2017, 2021), which results in severe behavioral impairments and widespread structural and functional network disruptions (Alkhachroum et al., 2022). Post-stroke, patients commonly experience symptoms such as disorder of consciousness (DOC) or coma, which contribute to increasing in-hospital mortality and unfavorable outcomes upon discharge for stroke patients (Li et al., 2016). Therefore, it is crucial to diagnose post-stroke disorder of consciousness (PS-DOC) promptly and accurately, while gaining a comprehensive understanding of the neural mechanisms underlying brain injury. Traditionally, clinical rating scales like the Glasgow Coma Scale (GCS) and Coma Recovery Scale Revision (CRS-R) have been used to assess patients with DOC. Although clinical behavioral assessment remains the gold standard (Hermann et al., 2020), these scoring systems exhibit high inter-rater and inter-examiner variability and lack objective evidence of central nervous system damage following brain injury (Claassen et al., 2016; Giacino et al., 2018; Song et al., 2018).
Currently, the utilization of electrophysiological methods, specifically electroencephalography (EEG), to measure neurological function in patients has been demonstrated as an effective method for rapidly assisting in the diagnosis of DOC (Bai et al., 2021b; Ballanti et al., 2022; Duszyk-Bogorodzka et al., 2022). Extensive research utilizing EEG-based spectral analysis, source imaging analysis, and graph theory analysis has improved neurophysiological assessments in the fields of stroke and DOC rehabilitation and diagnosis (Finnigan et al., 2016; Bai et al., 2021a; Zhuang et al., 2022; Bouchereau et al., 2023; Colombo et al., 2023). Regarding spectral patterns, previous studies have documented a notable reduction in alpha power after brain injury, including stroke (Edlow et al., 2021). Consequently, stroke leads to a marked elevation in the delta/alpha ratio (DAR), which quantifies the ratio of delta band power to alpha band power (Finnigan and van Putten, 2013). Likewise, distinguishing between patients with DOC and healthy controls often relies on the analysis of delta and alpha frequency bands, where increased delta rhythms and diminished alpha rhythms serve as prominent indicators of reduced consciousness levels (Rossi Sebastiano et al., 2015). Specifically, DOC patients demonstrate higher delta power than healthy controls (Sitt et al., 2014), while an augmentation in alpha power is observed during the recovery of consciousness in these individuals (Stefan et al., 2018). These studies seem to suggest that we can observe the relationship between the spectral feature DAR and reduced consciousness in patients with PS-DOC.
Although traditional spectral analysis of resting-state EEG integrates brain activity over several seconds in different frequency bands, this method fails to capture the spatial and temporal characteristics of resting-state brain networks occurring at shorter time scales (e.g., tens of milliseconds; Li et al., 2022). In contrast, multi-channel fusion of EEG microstate analysis can capture the spatiotemporal dynamics of activity in different brain regions at a sub-second time scale (Bréchet et al., 2019). Microstates represent specific topological patterns of electrical potentials and are typically classified into four distinct classes (Michel and Koenig, 2018), and the microstates persist for a transient period of approximately 60–120 ms in a quasi-stable state before rapidly transitioning to another microstate category (Lehmann et al., 1987). The swift transitions between microstates reflect rapid changes in brain dynamics, revealing the interconnectedness between cognitive function, information processing, and neural regulation in the brain (Khanna et al., 2014; Von Wegner et al., 2018; Liu et al., 2020). Furthermore, different microstate classes exhibit strong associations with specific resting-state networks (RSNs) in the brain, including the auditory network, visual network, salience network, and attention network, among others (Britz et al., 2010; Michel and Koenig, 2018). Increasing evidence suggests that abnormal alterations in temporal characteristics (such as mean duration, coverage, and occurrence) of microstates are observed in various neuropsychiatric disorders, including post-traumatic stress disorder (Terpou et al., 2022), schizophrenia (Rieger et al., 2016; Lin et al., 2022), Alzheimer’s disease (Tait et al., 2020), Parkinson’s disease (Pal et al., 2021), and depression (Zhao et al., 2022). However, microstate analysis research related to DOC primarily focuses on patients with diverse etiologies, including brain trauma, intracranial bleeding, hypoxic–ischemic, and other conditions (Guo et al., 2022; Toplutaş et al., 2023; Zhang et al., 2023). In contrast, there is limited research on microstate analysis in DOC patients with a single etiology, such as ischemic stroke, and our understanding of the temporal dynamics and spatiotemporal interaction effects in their brains remains insufficient.
Moreover, substantial evidence suggests that microstate time sequences display dynamic and nonlinear characteristics, including non-Markovian transition behaviors, where the transition to the next microstate class is independent of the current microstate class (Gschwind et al., 2015; Von Wegner et al., 2017). Increasing studies have introduced nonlinear measures applied to microstate sequences. In particular, Tait et al. pioneered the utilization of the Lempel-Ziv complexity (LZC) algorithm to investigate microstate transition patterns (Tait et al., 2020), revealing a reduction in microstate LZC among individuals with Alzheimer’s disease in comparison to their healthy counterparts. Subsequently, Zhang et al. explored the alterations in the LZC of microstate sequences in patients with brain diseases (Zhang et al., 2021), and Zhao et al. discovered an increase in the LZC of microstates in adolescents with depression (Zhao et al., 2022). Nonlinear analysis of EEG microstate sequences quantifies the persistent characteristics of brain electrical activity, revealing complex dynamic changes at very small time scales (Von Wegner et al., 2023). We suggest that the microstate LZC in PS-DOC patients may also exhibit some degree of abnormality, providing new insights into the neuro anomalies associated with DOC.
The aforementioned analysis indicates that the current understanding of EEG microstates in PS-DOC remains limited. To this end, the innovations and contributions of our study are summarized as follows.
Firstly, to the best of our knowledge, this paper is the first work to investigate the differences in EEG microstates between PS-DOC patients and post-stroke awake (PS-AW) conscious state patients. Comparison results show that there exist differences in microstate topographies between the two groups and especially exhibit significant alterations in temporal features among them.
Secondly, we analyze the Lempel-Ziv complexity of the microstate time sequences and find that, there exhibits higher repetitiveness and slower transition trends in the microstates of PS-DOC patients than that of PS-AW patients. Additionally, to supplement the spectral information in resting-state EEG, we calculate the DAR of spectral features in both groups. We find that DAR is significantly higher in PS-DOC patients.
Finally, we explore the potential of the aforementioned extracted features that are sensitive to intergroup variability in the classification of DOC. In particular, we fuse these features and feed the combined sets into an SVM classifier to identify the DOC among stroke patients. The outcome demonstrates that our work could accurately identify 92.86% of DOC patients.
In summary, our study contributes to a better understanding of resting-state EEG microstate features in patients with DOC post-stroke, helps us to identify potentially valid electrophysiological biomarkers, and provides important insights and neurological evidence into the causative mechanisms of decreased levels of consciousness post-stroke.
2. Materials and methods
2.1. Patients
We retrospectively investigate 60 patients diagnosed with ischemic stroke who received treatment between June 2020 and January 2022 at the stroke center of Shanxi Provincial People’s Hospital. The inclusion criteria include (1) First-time diagnosis of ischemic stroke; (2) Subacute stroke (2 weeks to 3 months post-stroke); (3) Complete assessment of consciousness and scalp EEG measurement; (4) No other neurological disorders. Exclusion criteria encompass (1) Patients aged below 18; (2) Pregnant or lactating women; (3) Patients with traumatic brain injury or intracerebral hemorrhage; (4) Patients who underwent thrombolysis surgery. Two patients are excluded due to other neurological comorbidities, and two patients are excluded as a result of receiving thrombolytic surgery. Finally, we obtain a sample of 56 patients with ischemic stroke (mean age = 67.09 years, 31 males, 25 females, and 56 right-handed individuals).
The consciousness state of the patients is assessed using the GCS by clinical experts in neurology, who are blinded to the patient’s EEG measurements. Based on the GCS scores, we divide the patients into two groups: 28 patients with post-stroke awake consciousness (PS-AW; GCS > 13; mean age = 68.96 years, 17 males, 11 females), representing stroke patients without DOC; and 28 patients with post-stroke DOC (PS-DOC; GCS < 13; mean age = 65.21 years, 14 males, 14 females), including 13 patients with moderate DOC (12 > GCS > 9) and 15 patients with severe DOC/coma (3 < GCS < 8). Furthermore, the t-tests are performed for age and post-stroke onset time between the two groups and reveal no noticeable distinctions (t = −1.08, p = 0.285; t = 1.49, p = 0.14). The chi-square test for gender distribution also yields similar results (χ2 = 0.48, p = 0.49). All EEG data collection followed a retrospective observational cohort study which was approved by the local institutional review board (Ethics Committee of Shanxi Provincial People’s Hospital). The demographic and clinical information of all patients is summarized in Table 1.
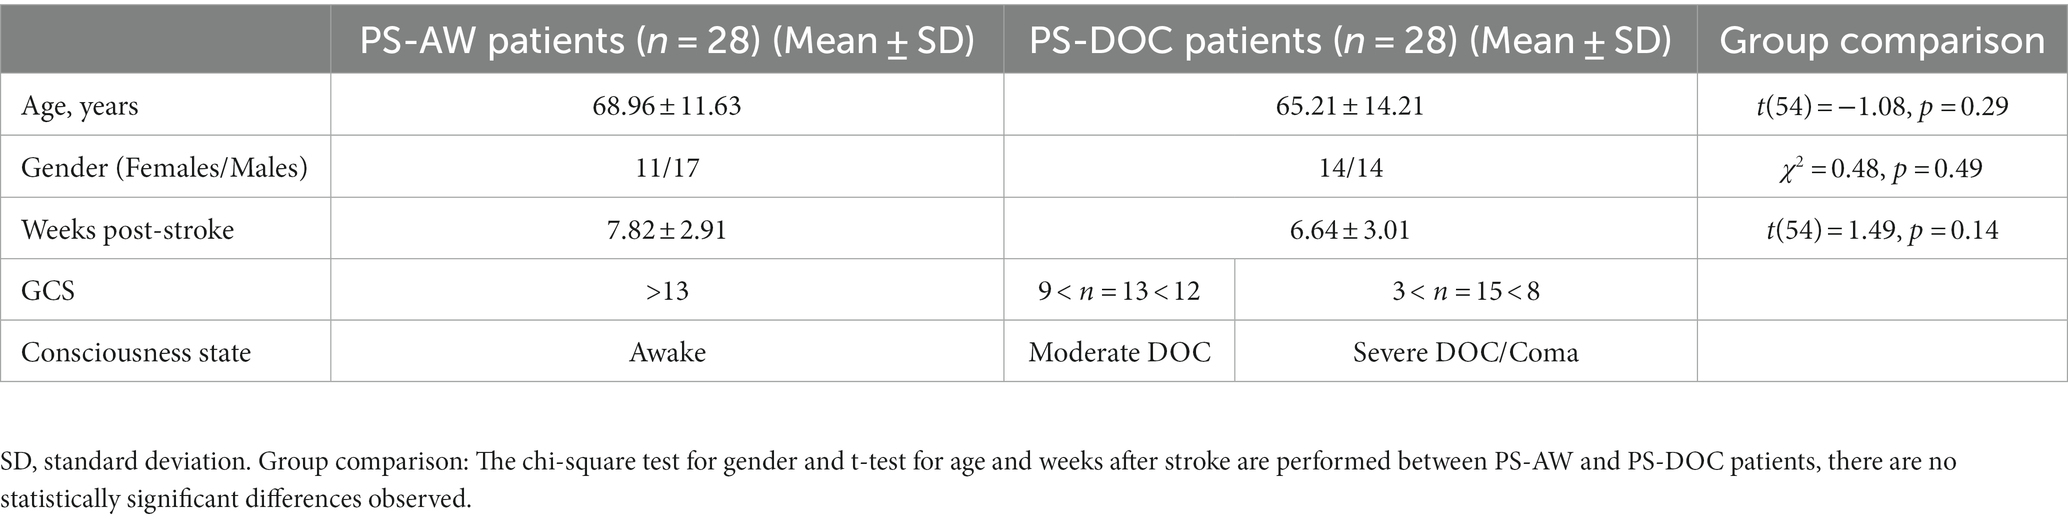
Table 1. Patients’ demographic and clinical information.
2.2. Electroencephalography data acquisition and preprocessing
Each patient is instructed to lie supine on the bed with their eyes closed within 30 min after the clinical consciousness assessment. Resting-state EEG data are collected using a bedside monitoring system (Solar 2000 N, Solar Electronic Technology Co., Ltd., Beijing, China) with a sampling rate of 100 Hz, for a minimum duration of 10 min. 19 Ag/AgCl ring electrodes (FP1, FP2, F3, F4, C3, C4, P3, P4, O1, O2, F7, F8, T3, T4, T5, T6, FZ, CZ, and PZ) are positioned on the scalp according to the international 10–20 system (Jurcak et al., 2007), ensuring the impedance of all electrodes remained below 10 kΩ. The right mastoid serves as the reference electrode, while the forehead is designated as the location for the ground electrode. Additionally, a pair of electrooculography electrodes are also employed to capture eye movements and blinking patterns.
The offline preprocessing of raw EEG data is conducted using MATLAB (R2019a, MathWorks Inc., United States) in conjunction with the EEGLAB 2021.0 toolbox (Delorme and Makeig, 2004). The general preprocessing steps can be seen in Figure 1. Specifically, we utilize a finite impulse response filter for bandpass filtering in the frequency range of 1 Hz to 30 Hz, along with a notch filter designed to eliminate power line interference at 50 Hz. We conduct visual inspection to remove artifacts related to eye movements or blinking that are highly correlated with electrooculography signals, followed by re-referencing the EEG data using the common average reference. Subsequently, applying the runica algorithm from the EEGLAB, we perform independent component analysis on the EEG data, and the ICLabel and ADJUST algorithms from the plugin extension are employed to remove noise related to muscle activity, and eye movements. The count of removed artifact-independent components in the PS-AW group and the PS-DOC group are 2.3 ± 0.7 (mean ± standard deviation) and 1.8 ± 0.3 (mean ± standard deviation), respectively, with no significant difference. After EEG preprocessing, each patient’s artifact-free epochs of 60 s are retained for data analysis.
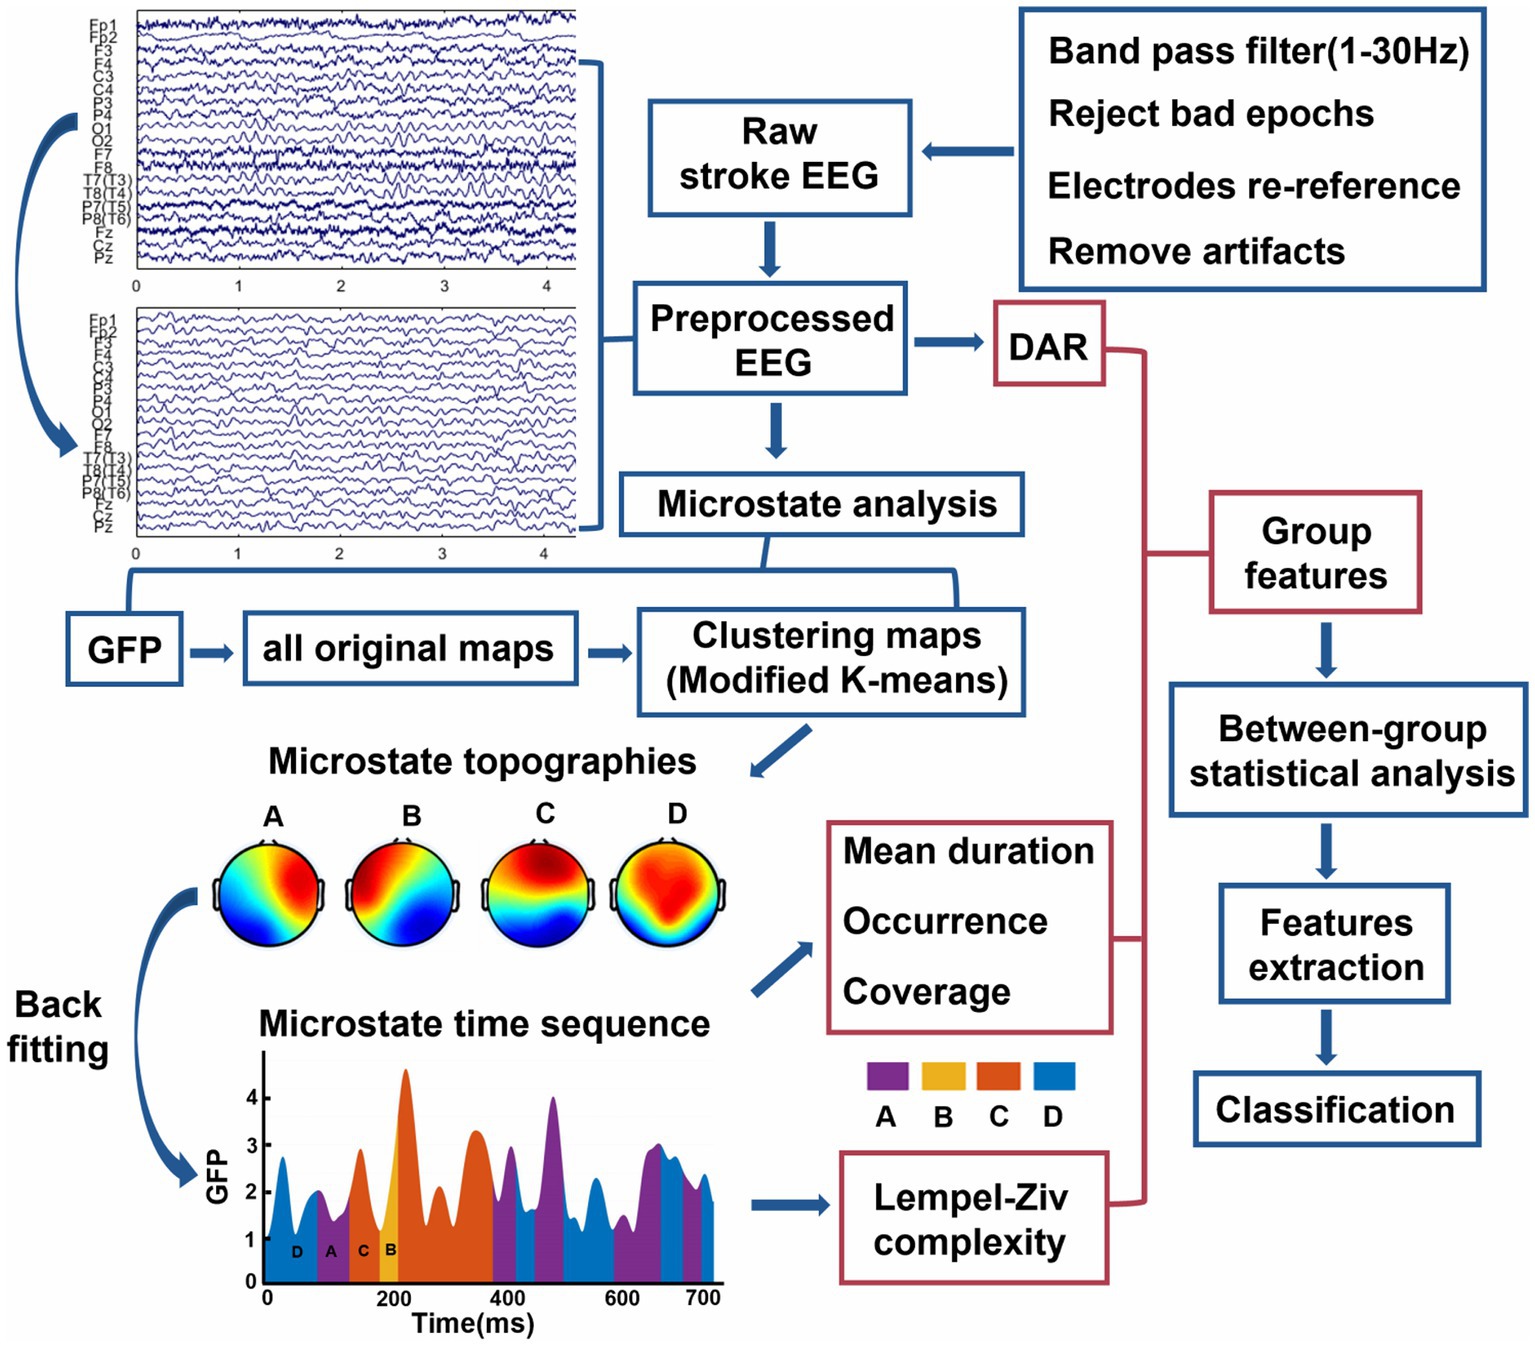
Figure 1. Overview of analytical methods for this study. The contents of red boxes are the three types of group features in the study, see more details in “Materials and methods” section. DAR, delta/alpha ratio; GFP, global field power.
2.3. Delta/alpha ratio calculation
In the spectral analysis of the preprocessed EEG, we utilize the Welch method to compute the average power within the 1–30 Hz frequency range for each electrode. To segment the signal, a Hanning window with a duration of 2.048 s is applied, using a 50% window overlap and a frequency resolution of 0.488 Hz approximately. The power spectral density within each time window is then calculated using the Fast Fourier Transform, resulting in power values within the frequency range of 1–30 Hz. These power values are summed for each window to obtain the total power within that window. Subsequently, the average total power across all windows is computed to determine the average power. For each electrode, the average power spectrum is derived by averaging the results from all 19 electrodes, resulting in the “average scalp power spectrum” (Finnigan et al., 2007). Finally, the ratio of the average power spectrum is calculated over the specific frequency range of interest, including the delta band (1–4 Hz) and the alpha band (8–13 Hz), yielding the EEG spectral characteristic known as the DAR. It is worth noting that although we focus on extracting the power spectra for the delta and alpha bands here, we retain the broader frequency range of 1–30 Hz for subsequent microstate analysis.
2.4. Microstates analysis
We perform microstate analysis on preprocessed EEG data using the Microstate EEGLAB Toolbox (Poulsen et al., 2018). The analysis flow is illustrated in Figure 1. Initially, the global field power (GFP) is extracted from the EEG signal in both stroke groups. GFP is defined as follows:
Where is the instantaneous potential of the ith electrode at time t, is the average instantaneous potential across all electrodes at time t, and denotes the number of electrodes ( is 19 in our study). GFP is calculated as the standard deviation of the EEG signals from all electrodes (Murray et al., 2008). Considering that the local maximum (peak) of GFP exhibits a favorable signal-to-noise ratio and stable changes in EEG topography, we set a minimum interval of 10 ms between consecutive GFP peaks. We extract the brain topographic maps (also known as original maps) at 2000 randomly selected GFP peak locations. GFP peaks that exceed twice the standard deviation are also removed, as they often contain artifacts of non-neuronal origin. Subsequently, all obtained original maps are input into a modified k-means clustering algorithm (ignoring polarity). We employ an optimized segmentation scheme with 1,000 iterations to obtain the best clustering. In line with previous studies (Zappasodi et al., 2017), we identify the optimal number of prototype microstates as 4 for both groups of resting-state EEG, considering the criteria of minimizing the cross-validation and maximizing the Krzanowski-Lai. We assign labels to the optimal prototype microstates, categorizing them into four classes: Class A, Class B, Class C, and Class D. Next, four prototype microstates undergo back fitting to all EEG recordings in the two groups. Each EEG time point is mapped to a specific prototype microstate based on its maximum spatial resemblance, thereby transforming the EEG into a microstate sequence. Finally, to enhance the fitting quality, the microstate sequence undergoes temporal smoothing and excludes microstates with durations shorter than 30 ms (Poulsen et al., 2018).
Following the completion of the microstate analysis, temporal features are computed for each of the four microstate classes in every patient. The global explained variance (GEV) is quantified as the percentage of similarity between the EEG and the assigned microstates, expressed as a percentage (%). The mean duration corresponds to the uninterrupted average duration of each microstate, measured in milliseconds (ms). The occurrence denotes the frequency at which each microstate occurs within a one-second interval, measured in hertz (Hz). The coverage represents the proportion of time that each microstate occupies throughout the recording, expressed as a percentage (%).
2.5. Microstate Lempel-Ziv complexity calculation
It can be observed that the microstate sequence represents the combination of four prototype microstates in the time domain, with each microstate having a short duration (see Figure 1). The length of the microstate sequence is slightly shorter than the preprocessed EEG data of the patients (due to the smoothing process, some microstates are discarded). The algorithm employed to compute the Lempel-Ziv complexity of the microstate time series in this study is consistent with previous research (Tait et al., 2020). Firstly, the microstate time sequence is transformed into a discrete sequence, where each time point corresponds to a distinct class within the four microstate topographies [A, B, C, D], thereby generating a string with the same number of sampling points as the original sequence. Then, the sequence is processed into a transitioning sequence (e.g., the sequence BBBCCAADDB is simplified to BCADB). Finally, the LZC value of the microstate sequence is calculated, which indicates the number of different subsequence patterns observed in the sequential analysis of the transformed sequence. Therefore, the values of microstate LZC indicate the number of distinct subsequences, reflecting the degree of repeatability and self-similarity during transitions of the four classes of microstates. Additionally, The algorithm determines that longer sequences have higher LZC values. As a result, when calculating the LZC, only the initial N substrings of the transitioning sequence are utilized. Since the length of our microstate sequence is below 60 s, we choose N = 300 to ensure that the minimum sequence length is greater than this value. For a comprehensive explanation of microstate LZC computation, please refer to Wegner et al. for detailed information (Von Wegner et al., 2023).
2.6. Statistical analysis
Group differences in patient age and post-stroke duration in weeks are evaluated through independent sample t-tests. The distribution of gender among patients is examined using the non-parametric chi-square test. To assess significant disparities in microstate temporal parameters between the PS-AW and PS-DOC groups, Welch’s t-test is employed. Moreover, DAR and microstate LZC comparisons between the two groups are conducted using both Welch’s t-test and the non-parametric Mann–Whitney U test. All statistical analyzes are performed using SPSS software (Version 25.0, IBM Inc., United States). The level of statistical significance is defined as a value of p less than 0.05 (or p < 0.01, p < 0.001) in this study. Additionally, microstate topography differences among microstate classes between the groups are assessed using a topographic analysis of variance (TANOVA) in the Ragu software (Koenig et al., 2011), employing 1,000 randomizations to establish a significance threshold of p < 0.05.
2.7. Classification of patients with PS-DOC
Thus far, we have obtained three types of group features, including the spectral feature DAR, the three microstate temporal features (mean duration, occurrence, and coverage) of four microstate classes, and the microstate LZC feature based on nonlinear measurement. Based on subsequent inter-group feature statistical analysis results, all three types of features demonstrate the differentiation between the two groups. Therefore, these features and their combinations are used as input for a SVM model with a radial basis function kernel to classify PS-DOC patients. The choice of radial basis function kernel SVM over other classifiers is attributed to its better scalability concerning the size of samples and features, as well as its ability to handle binary classification problem with multiple feature sets. The SVM model is implemented using the scikit-learn library in Python, with the hyperparameter C set to 1 to control the regularization degree. To accurately assess the performance of the model, 10-fold cross-validation is employed, and the average results are used to determine the values of sensitivity, specificity, accuracy, and the area under the curve (AUC) of receiver operating characteristic, which are four evaluation metrics.
3. Results
3.1. Electroencephalography microstate topographies
For the PS-AW group and the PS-DOC group, four EEG microstate topographies in each group are shown in Figure 2. Class A and Class B predominantly occupy the unilateral frontal region in a diagonal pattern, while Class C exhibits a vertical distribution. Class D, on the other hand, dominates the frontal-central area. These topographies are consistent with previous research (Zappasodi et al., 2017; Michel and Koenig, 2018). After the TANOVA, only the microstate topography of class C demonstrates a notable distinction (p = 0.0081). In addition, the topographies of the four microstates explain 75.18 and 73.79% of the GEV in the PS-AW and PS-DOC groups, respectively, indicating that these four microstate topographies can largely account for resting-state EEG. Furthermore, the difference in GEV between the two groups is not statistically significant (t = −1.345, p = 0.184).
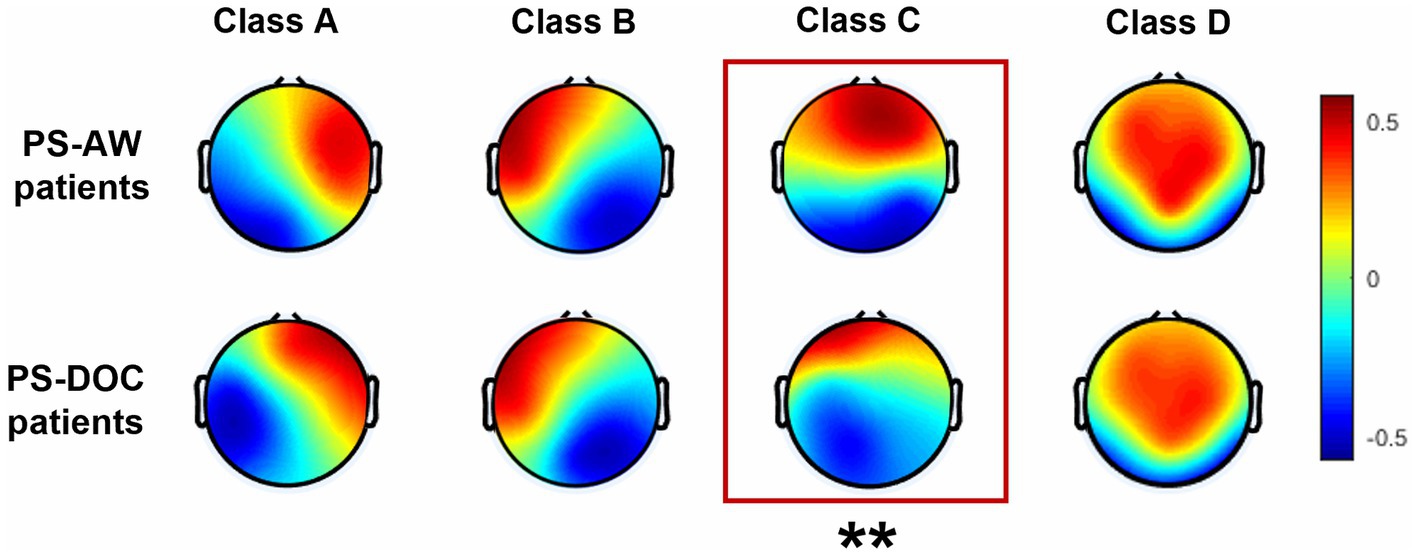
Figure 2. Four EEG microstate topographies for the PS-AW patient group (top) and PS-DOC patient group (bottom). The asterisks (**) indicate a significant difference in the microstate C between the two groups (p < 0.01) after TANOVA.
3.2. Electroencephalography microstate temporal features
Next, Levene’s test reveals a violation of the assumption of homogeneity of variances for the temporal features of microstates between the PS-AW group and the PS-DOC group. Consequently, Welch’s t-test is conducted to compare the differences between the two groups. The mean values of mean duration, occurrence, and coverage for the four microstate classes in both groups, along with the t-test results, are presented in Table 2. The t-value in this context represents a standardized measure of the difference between sample means relative to the variability of the difference. A negative t-value indicates that the mean of the PS-AW group is smaller than the mean of the PS-DOC group, while a positive value indicates the opposite. Bold highlights in the table indicate statistically significant differences (p < 0.05). We observe that the temporal features of the microstate classes exhibit significant intergroup differences, except for the occurrence of microstate A and microstate C, and the coverage of microstate A.
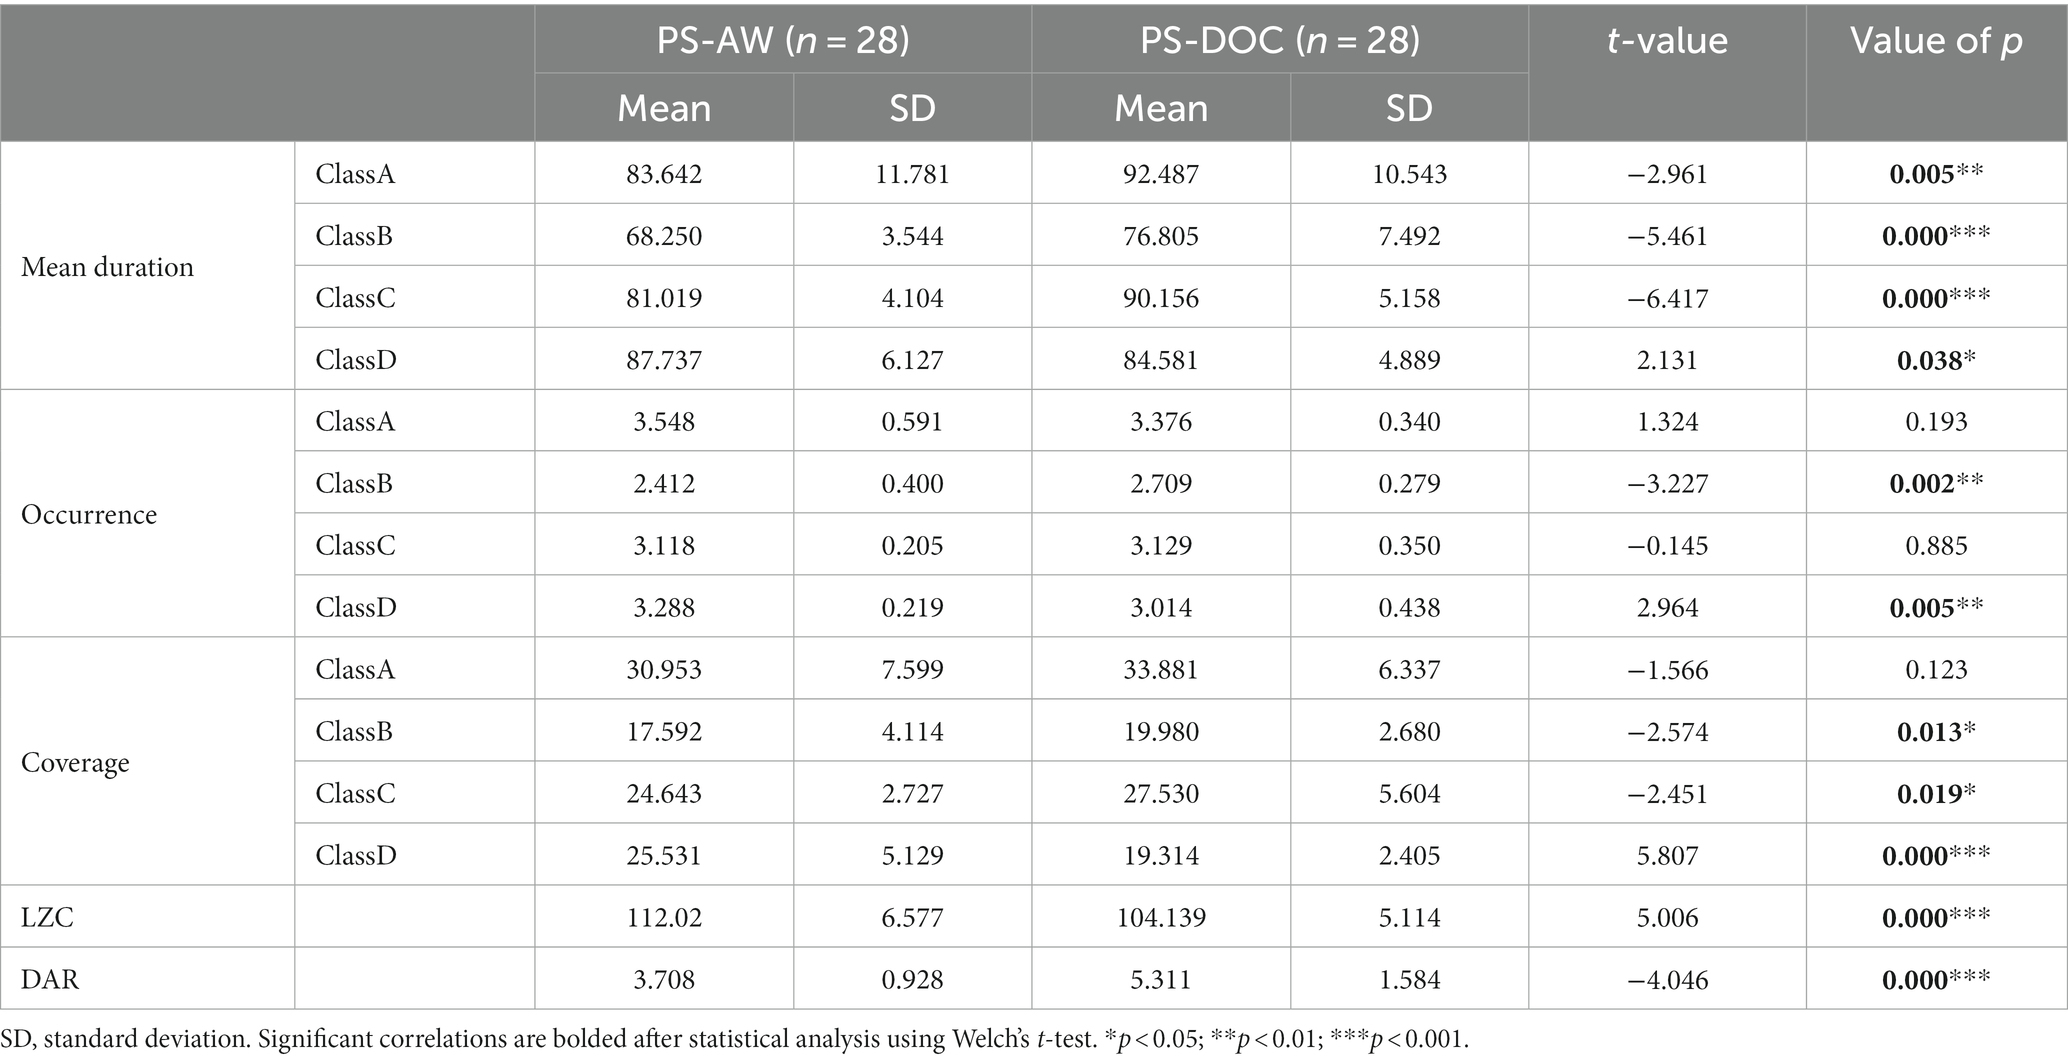
Table 2. Comparison of EEG microstate temporal features, microstate LZC and DAR between PS-AW and PS-DOC patient groups.
Figure 3 provides violin plots and box plots for a visual representation of temporal features of microstates between the PS-AW group and the PS-DOC group. Regarding the horizontal comparison of the temporal features, all microstate classes, except for microstate D, show significant prolongation in mean duration for the PS-DOC group (p < 0.01). In terms of occurrence, significant differences are observed only for microstates B and D (t = −3.227, p < 0.01; t = 2.964, p < 0.01). As for coverage, microstate D exhibits a substantial decrease in the PS-DOC group (p < 0.001), while microstates B and C demonstrate an increase (p < 0.05). Shifting to the vertical comparison, microstates B and C consistently demonstrate enhancements across mean duration and coverage in the PS-DOC group, while microstate D consistently displays reductions. In other words, microstate B and microstate D consistently exhibit opposite patterns of change in temporal features between the two groups.
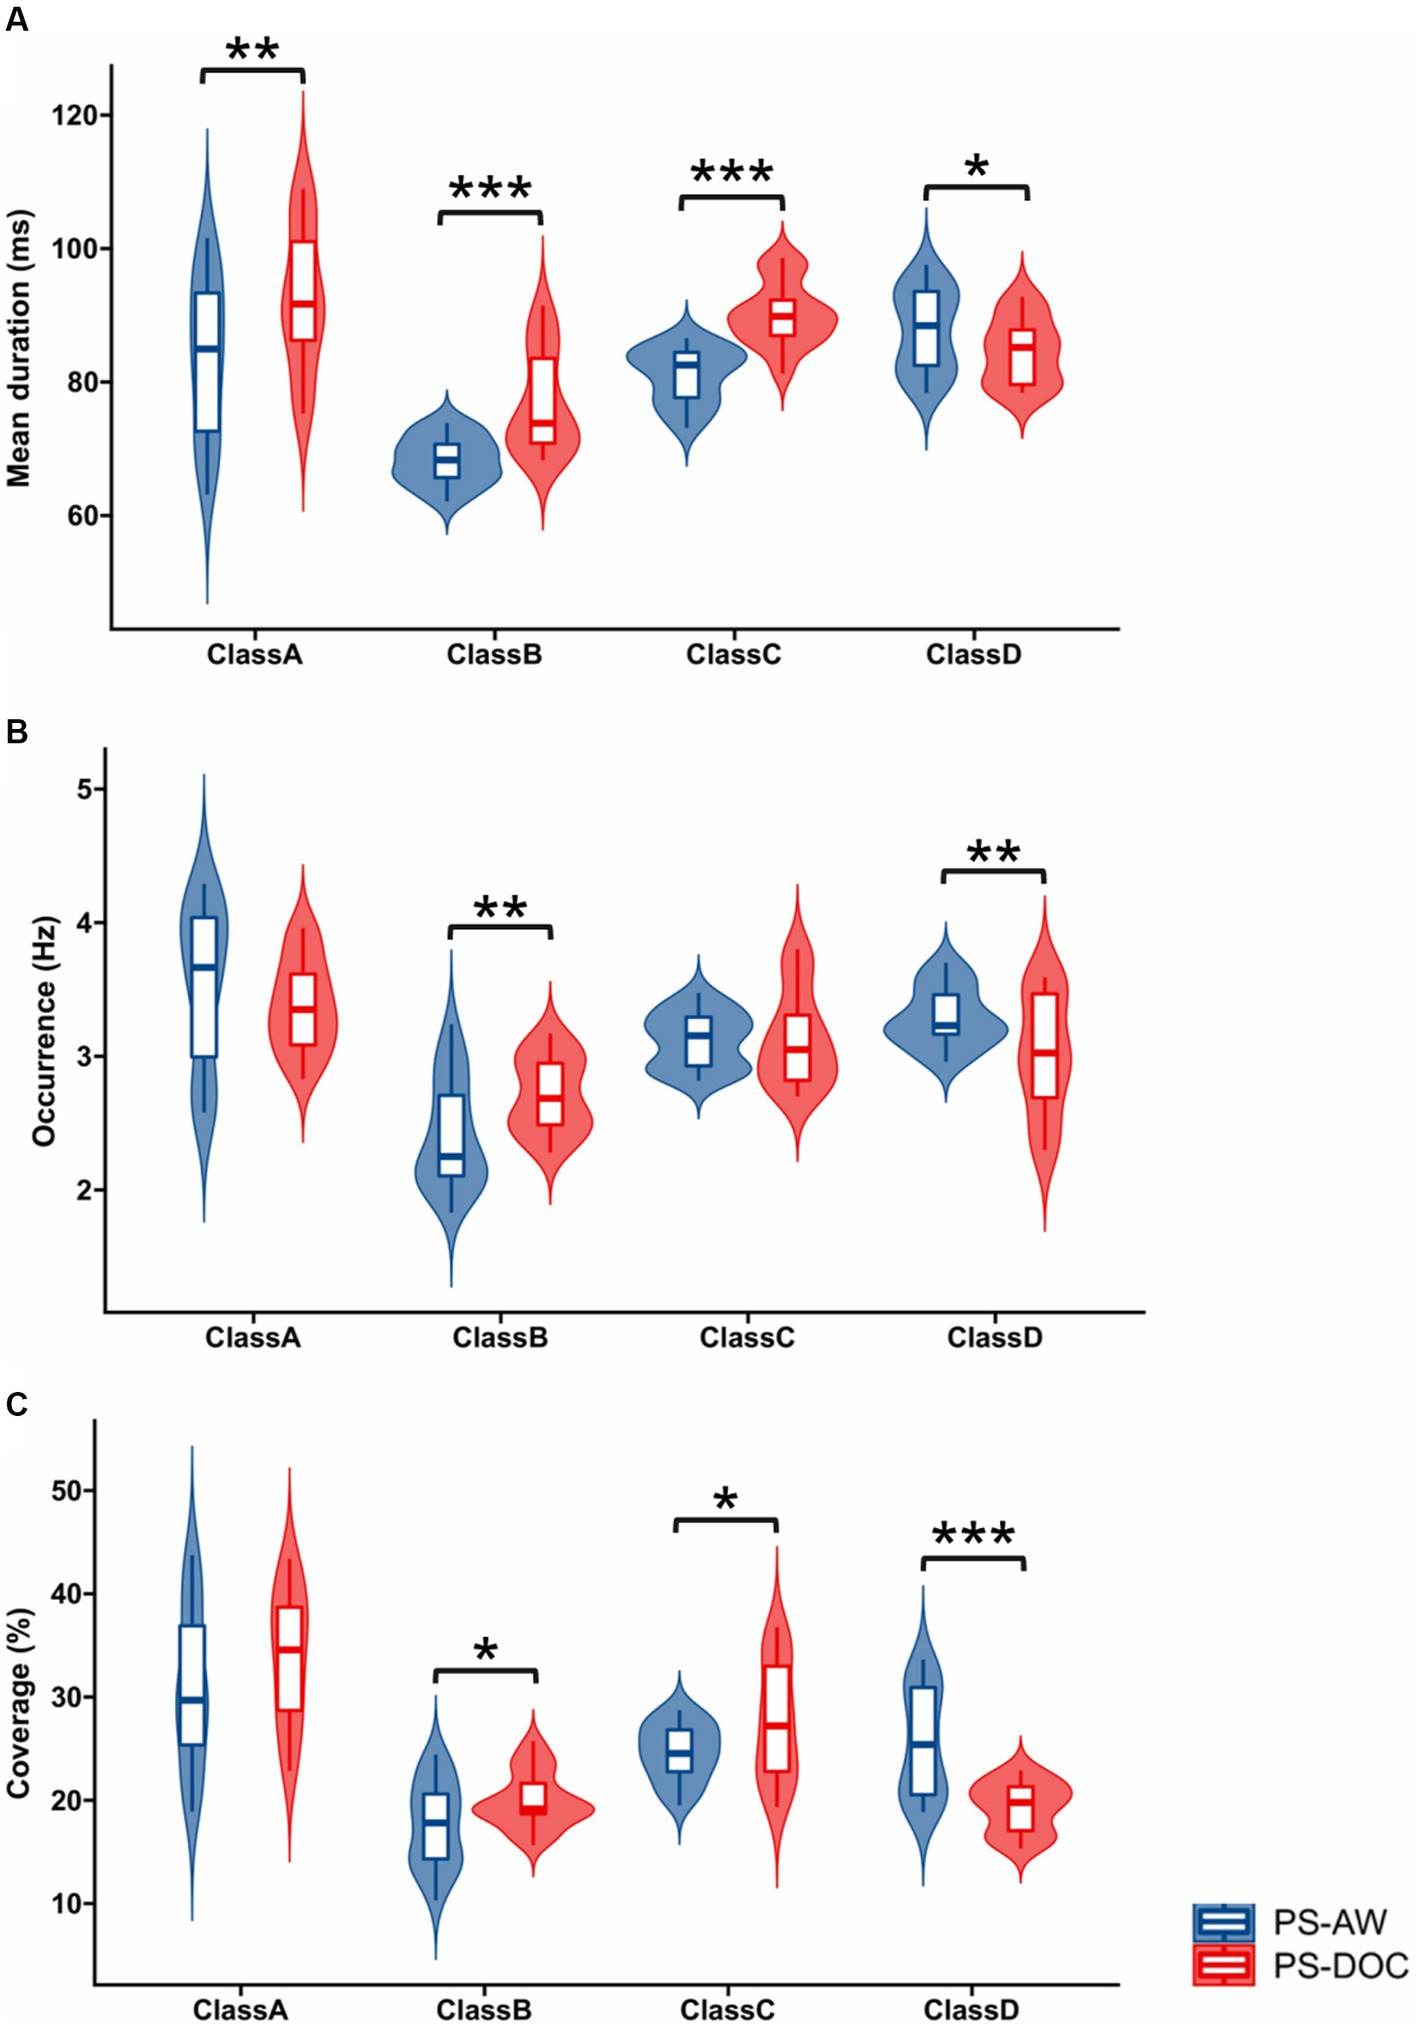
Figure 3. Inter-group statistics for temporal features of four microstate classes by Welch’s t-test. Violin plots and box plots depict the (A) Mean duration (B) Occurrence and (C) Coverage for each microstate class in the PS-AW and PS-DOC patient groups. *p < 0.05; **p < 0.01; ***p < 0.001.
3.3. Delta/alpha ratio
In the spectral analysis, we compute the DAR of resting-state EEG for each patient in two groups, which is used to quantify the power spectral changes. Table 2 displays the results of intergroup comparisons using Welch’s t-test. The mean DAR for the PS-AW patient group is 3.708 (range: 1.26 to 5.98), while the mean DAR for the PS-DOC patient group is 5.311 (range: 2.48 to 9.76), and the DAR exhibits significant variation between the two groups (t = −4.046, p < 0.001). The results indicate that the average power in the delta frequency band is higher than that in the alpha frequency band for both patient groups, as the DAR ranges are not lower than 1. Furthermore, to provide comprehensive and reliable statistical inferences, a non-parametric Mann–Whitney U test is employed. As depicted in Figure 4A, the results likewise demonstrate that PS-DOC patients show a significant elevation of DAR compared to PS-AW patients (U = 185, z = −3.392, p < 0.001).
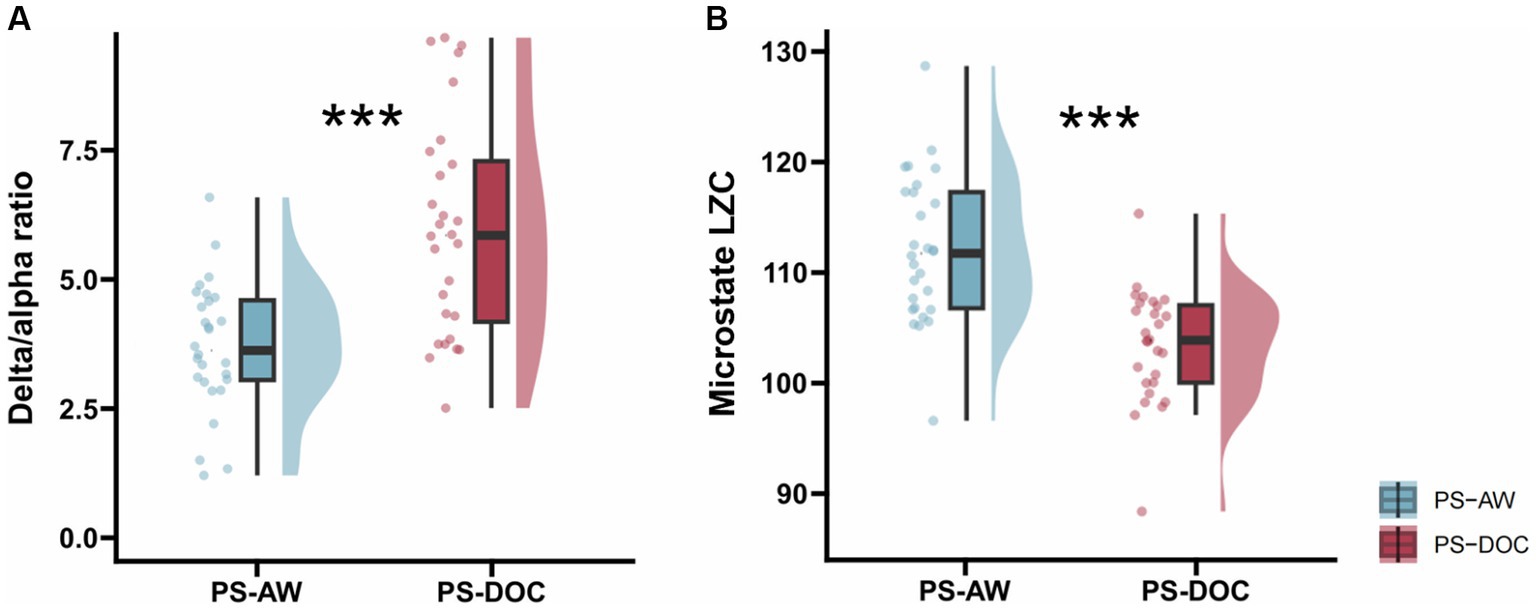
Figure 4. Inter-group statistics for DAR and microstate LZC by non-parametric Mann–Whitney U test. (A) DAR for the PS-AW and PS-DOC patient groups (B) Micostate LZC for the PS-AW and PS-DOC patient groups. ***p < 0.001.
3.4. Microstate Lempel-Ziv complexity
For each patient’s microstate sequence, we calculate the LZC of their microstate transition sequence within a range of N = 300. The PS-DOC group has a mean microstate LZC value of 104.139, which is lower than the mean value of 112.02 in the PS-AW group. As depicted in Table 2 and Figure 4B, using Welch’s t-test and the non-parametric Mann–Whitney U test, we find a significant decrease in microstate LZC for the PS-DOC group (t = 5.006, p < 0.001; U = 185, z = −3.392, p < 0.001). The reduction of microstate LZC indicates that the four microstates of PS-DOC patients demonstrate higher repeatability and limited patterns of microstate transitions.
3.5. Classification
The results of inter-group statistical comparisons reveal that the EEG spectral feature DAR, along with the temporal features of microstates and the complexity feature microstate LZC disclose abnormal alterations in brain activity among patients with PS-DOC. We construct SVM models using different feature sets to assess whether the different combinations of these features could serve as potential effective biomarkers for PS-DOC. In terms of feature selection, we consider the temporal features (mean duration, occurrence, and coverage) of four microstate classes as Feature Set 1 (12 features in total). Combining DAR and microstate LZC with the temporal features of microstates respectively, we obtain Feature Set 2 and Feature Set 3 (both sets have 13 features). Finally, Feature Set 4 includes all three types of features (14 features in total). The principal component analysis is employed to reduce the dimensionality of these feature sets. Then, the four different feature sets are input into the radial basis function kernel SVM to classify PS-DOC patients, respectively. As shown in Table 3, when the three types of features are combined, the accuracy, sensitivity, and specificity are all above 89%. Specifically, the sensitivity is 92.86% (26/28 PS-DOC patients classified as PS-DOC by the model), indicating better classification performance compared to using these features individually or in other combinations.
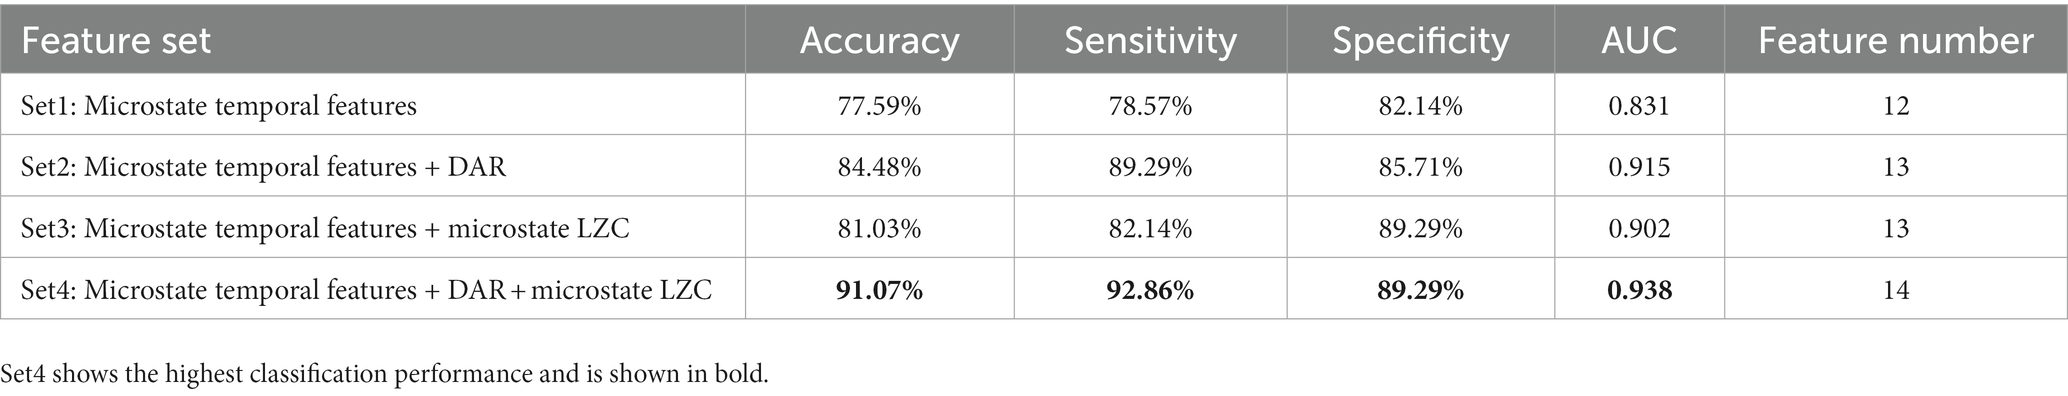
Table 3. Classification performance comparison with 4 different feature sets.
4. Discussion
Over the past decade, the integration of electrocorticography, functional magnetic resonance imaging, and EEG source imaging techniques in the analysis of EEG microstates has revealed a close relationship between microstates and RSNs along with their corresponding cortical regions (Yuan et al., 2012; Khanna et al., 2015; Gschwind et al., 2016; Bréchet et al., 2019; Zoubi et al., 2020; Rajkumar et al., 2021; Mikutta et al., 2023), demonstrating their capacity to evaluate the large-scale electrical activity in cortical networks (Tarailis et al., 2023). In this study, both the PS-AW group and the PS-DOC group exhibit four typical microstate topographies, with noticeable differences observed in the topological structure of microstate C. Regarding the source localization and specific association of microstate C with RSNs, a consensus has not yet been reached. Previous studies suggested an association between microstate C and the salience network (Britz et al., 2010), while recent research indicated its potential origins from the posterior cingulate cortex and precuneus (Custo et al., 2017; Zanesco et al., 2021), regions known for their critical role in the default mode network (DMN) (Fransson and Marrelec, 2008; Hagmann et al., 2008). An investigation on the consciousness level of brain-injured patients demonstrated a significant peak in DMN connectivity within the posterior cingulate cortex, highlighting the strong correlation between activity in this region and patients’ consciousness levels (Cavanna and Trimble, 2006; Vanhaudenhuyse et al., 2010). Croce et al. found that transcranial magnetic stimulation to the two pivotal regions of the DMN significantly altered the microstate C topography (Croce et al., 2018), suggesting the potential of microstates in elucidating local inhibition within brain regions. These findings imply that the decreased consciousness level in patients with stroke-induced brain damage may be associated with the inhibition of key areas within the DMN. This inhibition is likely to result in alterations in the microstate C topography, reflecting changes in neural activity and connectivity.
Furthermore, we observe a noticeable increase in the mean duration and coverage of microstate C in the PS-DOC patient group, which is in line with recent research (Toplutaş et al., 2023), although the DOC patients in their study cohort were of different aetiologies and their control group consisted of healthy subjects. These findings imply that the temporal features of microstate C may not be sufficiently sensitive to differentiate DOC patients caused by stroke and those with other etiologies, however, it still holds potential as a biomarker for DOC diagnosis. Another study reported a substantial reduction in the mean duration and coverage of microstate C in improving DOC patients during the consciousness recovery process following high-definition transcranial direct current stimulation (Guo et al., 2022), which further supports this viewpoint.
Regarding microstate D, we find a noticeable decrease in the mean duration, coverage, and occurrence in the PS-DOC group, which is opposite to the increased temporal parameters of microstates B and C. Microstate D is negatively correlated with the BOLD signals of the frontal and parietal lobes’ right posterior dorsal regions, which correspond to the dorsal attention network (DAN) activity (Britz et al., 2010; Michel and Koenig, 2018). Indeed, the opposite behavior of microstates C and D has been found in previous cognitive manipulation tasks, where the temporal measures of microstate D showed a significant augmentation in tasks involving the DAN, while the metrics of microstate C decreased (Seitzman et al., 2017). These research findings imply dysfunction of the DAN network in PS-DOC patients. Moreover, microstate D is suggested to represent certain aspects of attention and focus switching, and its temporal parameters show a decrease in response to reduced alpha power (Croce et al., 2020). The increase in DAR caused by the decreased alpha power observed in the PS-DOC group appears to explain the reduced time features of microstate D, indicating a dysregulation of attention in PS-DOC patients compared to PS-AW patients.
Moreover, The PS-DOC patient group shows an extended time parameter for microstate B, consistent with the results of Toplutaş et al. (2023) who found a remarkable increase in the mean duration and coverage of microstate B in DOC patients. Comparable results have been found in other neurological disorders, such as increased microstate B occurrence and coverage in migraine patients (Li et al., 2022), and higher mean duration, occurrence, and coverage of microstate B in adolescent depression patients (Zhao et al., 2022). Furthermore, microstate B has a negative correlation with bilateral occipital lobe BOLD activation (Michel and Koenig, 2018), and it has a 36% overlap with the DAN, followed by the visual network and the ventral attention network (36 and 31%, respectively; Zoubi et al., 2020). This suggests a relationship between the attenuated indicators of microstate D and the enhanced indicators of microstate B in PS-DOC patients, but further explanation is needed using more precise brain imaging techniques. Lastly, similar to microstates B and C, there is a significant increase in the mean duration of microstate A in the PS-DOC patient group. Guo et al. (2022) found a negative correlation between the CRS-R scores and the mean duration of microstate A in patients with DOC, which indicates that the mean duration of microstate A decreases gradually during the treatment process of consciousness recovery. Similarly, a longer mean duration of microstates in patients with DOC was associated with lower brain dynamical activity (Zhang et al., 2023). Moreover, the sleep or anesthesia state showed an increased mean duration of microstates in comparison to the awake state (Bréchet and Michel, 2022). In our study, the PS-AW group exhibits a shorter mean duration of microstates compared to the PS-DOC group, indicating that PS-DOC patients require more time for brain information transmission and processing under the same microstates and RSNs, which may affect the patient’s consciousness level.
The quantitative analysis of the frequency domain on resting-state EEG is indispensable. As mentioned earlier, several investigations have reported augmented delta-wave activity coupled with reduced alpha-wave activity in both stroke patients (Schleiger et al., 2014) and DOC patients following brain injury (Varotto et al., 2014). In this study, our results show an appreciable increase of DAR in the PS-DOC patient group, consistent with previous reports in brain injury and DOC patients. DAR correlated strongly negatively with functional recovery in acquired brain injury (Leon-Carrion et al., 2009), and Finnigan et al. found that a DAR ratio of 3.7 accurately distinguished ischemic stroke patients (Finnigan et al., 2016). Furthermore, Lechinger et al. (2013) found a high correlation between spectral peak frequency and CRS-R scores, and delta wave power exhibited a significant negative correlation with CRS-R scores (Bareham et al., 2018). These findings provide robust evidence for the increased DAR in PS-DOC patients and further emphasize the importance of using DAR as a quantitative EEG measure for DOC diagnosis and assessment.
Furthermore, there is a theoretical proposition that neural complexity is one of the important foundations of consciousness formation (Tononi, 2005, 2008), and the brain exhibits higher complexity in information integration and processing in states of higher consciousness levels (Dehaene and Changeux, 2011). These viewpoints have been validated in studies of EEG complexity in DOC patients, such as significantly lower complexity measured by LZC values in DOC patients (Wu et al., 2011), and a non-monotonic increase in LZC during the consciousness recovery process (Lei et al., 2022). In recent years, researchers have utilized the LZC feature of microstate time series to study the neurodynamics of patients with neurological disorders at a smaller time scale (Tait et al., 2020; Artoni et al., 2022). In our study, we apply the microstate LZC to DOC patients for the first time, and the results display lower microstate LZC values in the PS-DOC patient group, indicating a tendency for more repetitive and slower transitions of the microstates in the PS-DOC group, which may reflect a decrease in complexity during information integration and distributed processing. Additionally, a recent study found lower EEG LZC and permutation LZC to be associated with residual consciousness in DOC patients (Liu et al., 2023), which supports our results.
In recent years, significant progress has been made in the classification methods for DOC. This progress can largely be attributed to the application of electrophysiological methods in measuring brain neural function with the need to supplement the criteria for DOC classification with information from EEG (Bayne et al., 2017). Recent research proposed a multiple-scale convolutional few-shot learning network that can extract more information from EEG and applied it to evaluate DOC patients with residual consciousness in a P300-based brain-computer interface (BCIs) (Pan et al., 2023). Although there have been preliminary results in the assistance of diagnosing DOC patients using BCIs, BCI tasks often require active cooperation from patients, which remains a significant challenge for DOC patients (Galiotta et al., 2022). Another research attempted to maximally utilize functional connectivity information in brain networks to evaluate DOC, using convolutional neural networks and network reconfiguration techniques to classify patients with different consciousness states, achieving a classification accuracy of 87.2% (Cai et al., 2023). However, a recent study demonstrated that compared to convolutional neural networks or deep learning algorithms, SVM classifier showed stability in classifying various EEG signal preprocessing patterns for tasks such as DOC classification and had better interpretability, making them more suitable for doctors and patients to adopt (Rosenfelder et al., 2023). Our research explores the potential value of EEG microstates in DOC classification, which has not been explored in previous studies according to the available literature. We employ an SVM classifier to identify DOC patients among stroke patients using only the temporal features of the four microstate classes (accuracy = 77.59%), and obtain accuracies of 84.48 and 81.03% when incorporating the spectral feature DAR and the microstate complexity feature LZC, respectively. When combining DAR and microstates’ temporal and LZC features together, the highest accuracy and sensitivity are achieved (accuracy = 91.07%, sensitivity = 92.86%). The microstate temporal sequences and topographies have higher temporal and spatial resolution compared to EEG sequences. The features extracted from microstates can be complemented with frequency-domain information to improve the performance of classification, and higher sensitivity in classification is crucial for diagnosing patients with PS-DOC in a clinical setting.
Despite providing potential electrophysiological biomarkers for the post-stroke disorder of consciousness, this study has several limitations to consider. Firstly, the study only includes DOC patients caused by subacute ischemic stroke, which, although avoiding potential influences from other etiologies, still has high heterogeneity among ischemic stroke patients, such as lesion location and size, stroke severity, etc. These factors need to be considered in future studies for their impact on group analysis. Secondly, due to missing clinical scale scores in some DOC patients in the study cohort, the correlation analysis between different features and clinical scales is not conducted. Therefore, future studies need to supplement the correlation information between the features and scales. Finally, this study highlights the potential role of these features in the diagnosis and assessment of PS-DOC. However, to delve deeper into the observed uniqueness, future research should include longitudinal studies to investigate the effectiveness of these indicators in predicting stroke patient prognosis.
5. Conclusion
In this study, we conduct EEG microstate analysis on patients with DOC resulting from a single etiology, specifically ischemic stroke. Our findings reveal distinct differences in the topography of microstate C between PS-DOC patients and PS-AW patients, indicating localized suppression of DMN activity in PS-DOC. Microstates B and C exhibit significant increases in temporal features in the PS-DOC group compared to the PS-AW group, while microstate D shows the opposite pattern. These novel microstate findings provide valuable insights and additional information on abnormal RSN changes in DOC. Moreover, integrating EEG frequency domain analysis and nonlinear analysis of microstates, we observe notable increases in the DAR and reductions in the microstate LZC within the PS-DOC group. Lastly, utilizing these distinctive features as a comprehensive set, we achieve high accuracy in classifying PS-DOC patients (Accuracy = 91.07%). Our findings emphasize the potential of EEG microstates as promising electrophysiological biomarkers for the assessment of DOC among stroke patients, with further enhancements possible through the integration of spectral features.
Data availability statement
The datasets presented in this article are not readily available because individual patient data cannot be made available under Chinese law because we did not obtain patient approval for sharing individual patient data, even in the form of electroencephalogram (EEG) data. Requests to access the datasets should be directed to bGlmZW5nbGlhbkB0eXV0LmVkdS5jbg==.
Ethics statement
The studies involving humans were approved by the Ethics Committee of Shanxi Provincial People’s Hospital. The studies were conducted in accordance with the local legislation and institutional requirements. The ethics committee/institutional review board waived the requirement of written informed consent for participation from the participants or the participants’ legal guardians/next of kin because written informed consent for participation was not required for this retrospective study in accordance with the national legislation and the institutional requirements.
Author contributions
FY: Conceptualization, Methodology, Formal analysis, Investigation, Software, Writing—original draft, Writing—review and editing. YG: Methodology, Formal analysis, Writing—original draft, Writing—review and editing. FL: Conceptualization, Methodology, Formal analysis, Data collection, Writing–original draft, Writing–review and editing, Funding acquisition, Supervision. XZ: Data collection, Funding acquisition, Supervision. FH: Data collection, Investigation, Software. WJ: Data collection, Investigation, Funding acquisition. XL: Investigation, Writing–review and editing.
Funding
The author(s) declare financial support was received for the research, authorship, and/or publication of this article. The study leading to these results received funding from the National Natural Science Foundation of China, the Youth Fund of Shanxi Health Commission, Provincial Special Supporting Fund Project of Shanxi Provincial People’s Hospital, under Grant Agreement Nos. 62171307, 201301029, and sj20019007.
Acknowledgments
We thank Shanxi Provincial People’s Hospital for their help with patient enrollment and performing EEG recordings. We extend our heartfelt thanks to all our stroke survivor participants in this study.
Conflict of interest
The authors declare that the research was conducted in the absence of any commercial or financial relationships that could be construed as a potential conflict of interest.
Publisher’s note
All claims expressed in this article are solely those of the authors and do not necessarily represent those of their affiliated organizations, or those of the publisher, the editors and the reviewers. Any product that may be evaluated in this article, or claim that may be made by its manufacturer, is not guaranteed or endorsed by the publisher.
References
Alkhachroum, A., Bustillo, A. J., Asdaghi, N., Ying, H., Marulanda-Londono, E., Gutierrez, C. M., et al. (2022). Association of Acute Alteration of consciousness in patients with acute ischemic stroke with outcomes and early withdrawal of care. Neurology 98, e1470–e1478. doi: 10.1212/WNL.0000000000200018
Artoni, F., Maillard, J., Britz, J., Seeber, M., Lysakowski, C., Bréchet, L., et al. (2022). EEG microstate dynamics indicate a U-shaped path to propofol-induced loss of consciousness. NeuroImage 256:119156. doi: 10.1016/j.neuroimage.2022.119156
Bai, Y., He, J., Xia, X., Wang, Y., Yang, Y., Di, H., et al. (2021a). Spontaneous transient brain states in EEG source space in disorders of consciousness. NeuroImage 240:118407. doi: 10.1016/j.neuroimage.2021.118407
Bai, Y., Lin, Y., and Ziemann, U. (2021b). Managing disorders of consciousness: the role of electroencephalography. J. Neurol. 268, 4033–4065. doi: 10.1007/s00415-020-10095-z
Ballanti, S., Campagnini, S., Liuzzi, P., Hakiki, B., Scarpino, M., Macchi, C., et al. (2022). EEG-based methods for recovery prognosis of patients with disorders of consciousness: a systematic review. Clin. Neurophysiol. 144, 98–114. doi: 10.1016/j.clinph.2022.09.017
Bareham, C. A., Allanson, J., Roberts, N., Hutchinson, P. J. A., Pickard, J. D., Menon, D. K., et al. (2018). Longitudinal bedside assessments of brain networks in disorders of consciousness: case reports from the field. Front. Neurol. 9:676. doi: 10.3389/fneur.2018.00676
Bayne, T., Hohwy, J., and Owen, A. M. (2017). Reforming the taxonomy in disorders of consciousness. Ann. Neurol. 82, 866–872. doi: 10.1002/ana.25088
Bouchereau, E., Marchi, A., Hermann, B., Pruvost-Robieux, E., Guinard, E., Legouy, C., et al. (2023). Quantitative analysis of early-stage EEG reactivity predicts awakening and recovery of consciousness in patients with severe brain injury. Br. J. Anaesth. 130, e225–e232. doi: 10.1016/j.bja.2022.09.005
Bréchet, L., Brunet, D., Birot, G., Gruetter, R., Michel, C. M., and Jorge, J. (2019). Capturing the spatiotemporal dynamics of self-generated, task-initiated thoughts with EEG and fMRI. NeuroImage 194, 82–92. doi: 10.1016/j.neuroimage.2019.03.029
Bréchet, L., and Michel, C. M. (2022). EEG microstates in altered states of consciousness. Front. Psychol. 13:856697. doi: 10.3389/fpsyg.2022.856697
Britz, J., Van De Ville, D., and Michel, C. M. (2010). BOLD correlates of EEG topography reveal rapid resting-state network dynamics. NeuroImage 52, 1162–1170. doi: 10.1016/j.neuroimage.2010.02.052
Cai, L., Wei, X., Qing, Y., Lu, M., Yi, G., Wang, J., et al. (2023). Assessment of impaired consciousness using EEG-based connectivity features and convolutional neural networks. Cogn. Neurodyn. 2023:944. doi: 10.1007/s11571-023-09944-0
Cavanna, A. E., and Trimble, M. R. (2006). The precuneus: a review of its functional anatomy and behavioural correlates. Brain 129, 564–583. doi: 10.1093/brain/awl004
Claassen, J., Velazquez, A., Meyers, E., Witsch, J., Falo, M. C., Park, S., et al. (2016). Bedside quantitative electroencephalography improves assessment of consciousness in comatose subarachnoid hemorrhage patients. Ann. Neurol. 80, 541–553. doi: 10.1002/ana.24752
Colombo, M. A., Comanducci, A., Casarotto, S., Derchi, C.-C., Annen, J., Viganò, A., et al. (2023). Beyond alpha power: EEG spatial and spectral gradients robustly stratify disorders of consciousness. Cereb. Cortex 33, 7193–7210. doi: 10.1093/cercor/bhad031
Croce, P., Quercia, A., Costa, S., and Zappasodi, F. (2020). EEG microstates associated with intra- and inter-subject alpha variability. Sci. Rep. 10:2469. doi: 10.1038/s41598-020-58787-w
Croce, P., Zappasodi, F., and Capotosto, P. (2018). Offline stimulation of human parietal cortex differently affects resting EEG microstates. Sci. Rep. 8:1287. doi: 10.1038/s41598-018-19698-z
Custo, A., Van De Ville, D., Wells, W. M., Tomescu, M. I., Brunet, D., and Michel, C. M. (2017). Electroencephalographic resting-state networks: source localization of microstates. Brain Connect. 7, 671–682. doi: 10.1089/brain.2016.0476
Dehaene, S., and Changeux, J. P. (2011). Experimental and theoretical approaches to conscious processing. Neuron 70, 200–227. doi: 10.1016/j.neuron.2011.03.018
Delorme, A., and Makeig, S. (2004). EEGLAB: an open source toolbox for analysis of single-trial EEG dynamics including independent component analysis. J. Neurosci. Methods 134, 9–21. doi: 10.1016/j.jneumeth.2003.10.009
Duszyk-Bogorodzka, A., Zieleniewska, M., and Jankowiak-Siuda, K. (2022). Brain activity characteristics of patients with disorders of consciousness in the EEG resting state paradigm: a review. Front. Syst. Neurosci. 16:654541. doi: 10.3389/fnsys.2022.654541
Edlow, B. L., Claassen, J., Schiff, N. D., and Greer, D. M. (2021). Recovery from disorders of consciousness: mechanisms, prognosis and emerging therapies. Nat. Rev. Neurol. 17, 135–156. doi: 10.1038/s41582-020-00428-x
Feigin, V. L., Norrving, B., and Mensah, G. A. (2017). Global burden of stroke. Circ. Res. 120, 439–448. doi: 10.1161/CIRCRESAHA.116.308413
Feigin, V. L., Stark, B. A., Johnson, C. O., Roth, G. A., Bisignano, C., Abady, G. G., et al. (2021). Global, regional, and national burden of stroke and its risk factors, 1990-2019: a systematic analysis for the global burden of disease study 2019. Lancet Neurol. 20, 795–820. doi: 10.1016/S1474-4422(21)00252-0
Finnigan, S., and van Putten, M. J. A. M. (2013). EEG in ischaemic stroke: quantitative EEG can uniquely inform (sub-)acute prognoses and clinical management. Clin. Neurophysiol. 124, 10–19. doi: 10.1016/j.clinph.2012.07.003
Finnigan, S. P., Walsh, M., Rose, S. E., and Chalk, J. B. (2007). Quantitative EEG indices of sub-acute ischaemic stroke correlate with clinical outcomes. Clin. Neurophysiol. 118, 2525–2532. doi: 10.1016/j.clinph.2007.07.021
Finnigan, S., Wong, A., and Read, S. (2016). Defining abnormal slow EEG activity in acute ischaemic stroke: Delta/alpha ratio as an optimal QEEG index. Clin. Neurophysiol. 127, 1452–1459. doi: 10.1016/j.clinph.2015.07.014
Fransson, P., and Marrelec, G. (2008). The precuneus/posterior cingulate cortex plays a pivotal role in the default mode network: evidence from a partial correlation network analysis. NeuroImage 42, 1178–1184. doi: 10.1016/j.neuroimage.2008.05.059
Galiotta, V., Quattrociocchi, I., D'Ippolito, M., Schettini, F., Aricò, P., Sdoia, S., et al. (2022). EEG-based brain-computer interfaces for people with disorders of consciousness: features and applications. A systematic review. Front. Hum. Neurosci. 16:1040816. doi: 10.3389/fnhum.2022.1040816
Giacino, J. T., Katz, D. I., Schiff, N. D., Whyte, J., Ashman, E. J., Ashwal, S., et al. (2018). Practice guideline update recommendations summary: disorders of consciousness. Neurology 91, 450–460. doi: 10.1212/wnl.0000000000005926
Gschwind, M., Hardmeier, M., Van De Ville, D., Tomescu, M. I., Penner, I. K., Naegelin, Y., et al. (2016). Fluctuations of spontaneous EEG topographies predict disease state in relapsing-remitting multiple sclerosis. NeuroImage Clin. 12, 466–477. doi: 10.1016/j.nicl.2016.08.008
Gschwind, M., Michel, C. M., and Van De Ville, D. (2015). Long-range dependencies make the difference-comment on “a stochastic model for EEG microstate sequence analysis.”. NeuroImage 117, 449–455. doi: 10.1016/j.neuroimage.2015.05.062
Guo, Y., Li, R., Zhang, R., Liu, C., Zhang, L., Zhao, D., et al. (2022). Dynamic changes of brain activity in patients with disorders of consciousness during recovery of consciousness. Front. Neurosci. 16:878203. doi: 10.3389/fnins.2022.878203
Hagmann, P., Cammoun, L., Gigandet, X., Meuli, R., Honey, C. J., Van Wedeen, J., et al. (2008). Mapping the structural core of human cerebral cortex. PLoS Biol. 6:e159. doi: 10.1371/journal.pbio.0060159
Hermann, B., Raimondo, F., Hirsch, L., Huang, Y., Denis-Valente, M., Pérez, P., et al. (2020). Combined behavioral and electrophysiological evidence for a direct cortical effect of prefrontal tDCS on disorders of consciousness. Sci. Rep. 10:4323. doi: 10.1038/s41598-020-61180-2
Jurcak, V., Tsuzuki, D., and Dan, I. (2007). 10/20, 10/10, and 10/5 systems revisited: their validity as relative head-surface-based positioning systems. NeuroImage 34, 1600–1611. doi: 10.1016/j.neuroimage.2006.09.024
Khanna, A., Pascual-Leone, A., and Farzan, F. (2014). Reliability of resting-state MicrostateFeatures in electroencephalography. PLoS One 9:e114163. doi: 10.1371/journal.pone.0114163
Khanna, A., Pascual-Leone, A., Michel, C. M., and Farzan, F. (2015). Microstates in resting-state EEG: current status and future directions. Neurosci. Biobehav. Rev. 49, 105–113. doi: 10.1016/j.neubiorev.2014.12.010
Koenig, T., Kottlow, M., Stein, M., and Melie-García, L. (2011). Ragu: a free tool for the analysis of EEG and MEG event-related scalp field data using global randomization statistics. Comput. Intell. Neurosci. 2011:938925. doi: 10.1155/2011/938925
Lechinger, J., Bothe, K., Pichler, G., Michitsch, G., Donis, J., Klimesch, W., et al. (2013). CRS-R score in disorders of consciousness is strongly related to spectral EEG at rest. J. Neurol. 260, 2348–2356. doi: 10.1007/s00415-013-6982-3
Lehmann, D., Ozaki, H., and Pal, I. (1987). EEG alpha map series: brain micro-states by space-oriented adaptive segmentation. Electroencephalogr. Clin. Neurophysiol. 67, 271–288. doi: 10.1016/0013-4694(87)90025-3
Lei, L., Liu, K., Yang, Y., Doubliez, A., Hu, X., Xu, Y., et al. (2022). Spatio-temporal analysis of EEG features during consciousness recovery in patients with disorders of consciousness. Clin. Neurophysiol. 133, 135–144. doi: 10.1016/j.clinph.2021.08.027
Leon-Carrion, J., Martin-Rodriguez, J. F., Damas-Lopez, J., Barroso Martin, J. M., and Dominguez-Morales, M. R. (2009). Delta-alpha ratio correlates with level of recovery after neurorehabilitation in patients with acquired brain injury. Clin. Neurophysiol. 120, 1039–1045. doi: 10.1016/j.clinph.2009.01.021
Li, Y., Chen, G., Lv, J., Hou, L., Dong, Z., Wang, R., et al. (2022). Abnormalities in resting-state EEG microstates are a vulnerability marker of migraine. J. Headache Pain 23:45. doi: 10.1186/s10194-022-01414-y
Li, J., Wang, D., Tao, W., Dong, W., Zhang, J., Yang, J., et al. (2016). Early consciousness disorder in acute ischemic stroke: incidence, risk factors and outcome. BMC Neurol. 16:140. doi: 10.1186/s12883-016-0666-4
Lin, G., Wu, Z., Chen, B., Zhang, M., Wang, Q., Liu, M., et al. (2022). Altered microstate dynamics and spatial complexity in late-life schizophrenia. Front. Psych. 13:907802. doi: 10.3389/fpsyt.2022.907802
Liu, J., Xu, J., Zou, G., He, Y., Zou, Q., and Gao, J. H. (2020). Reliability and individual specificity of EEG microstate characteristics. Brain Topogr. 33, 438–449. doi: 10.1007/s10548-020-00777-2
Liu, Y., Zeng, W., Pan, N., Xia, X., Huang, Y., and He, J. (2023). EEG complexity correlates with residual consciousness level of disorders of consciousness. BMC Neurol. 23:140. doi: 10.1186/s12883-023-03167-w
Michel, C. M., and Koenig, T. (2018). EEG microstates as a tool for studying the temporal dynamics of whole-brain neuronal networks: a review. NeuroImage 180, 577–593. doi: 10.1016/j.neuroimage.2017.11.062
Mikutta, C. A., Knight, R. T., Sammler, D., Müller, T. J., and Koenig, T. (2023). Electrocorticographic activation patterns of electroencephalographic microstates. Brain Topogr. 2021:952. doi: 10.1007/s10548-023-00952-1
Murray, M. M., Brunet, D., and Michel, C. M. (2008). Topographic ERP analyses: a step-by-step tutorial review. Brain Topogr. 20, 249–264. doi: 10.1007/s10548-008-0054-5
Pal, A., Behari, M., Goyal, V., and Sharma, R. (2021). Study of EEG microstates in Parkinson’s disease: a potential biomarker? Cogn. Neurodyn. 15, 463–471. doi: 10.1007/s11571-020-09643-0
Pan, J., Cai, H., Huang, H., He, Y., and Li, Y. (2023). Multiple scale convolutional few-shot learning networks for online P300-based brain-computer Interface and its application to patients with disorder of consciousness. IEEE Trans. Instrum. Meas. 72, 1–16. doi: 10.1109/TIM.2023.3267367
Poulsen, A. T., Pedroni, A., Langer, N., and Hansen, L. K. (2018). Microstate EEGlab toolbox: an introductory guide. bioRxiv 2018:289850. doi: 10.1101/289850
Rajkumar, R., Farrher, E., Mauler, J., Sripad, P., Régio Brambilla, C., Rota Kops, E., et al. (2021). Comparison of EEG microstates with resting state fMRI and FDG-PET measures in the default mode network via simultaneously recorded trimodal (PET/MR/EEG) data. Hum. Brain Mapp. 42, 4122–4133. doi: 10.1002/hbm.24429
Rieger, K., Hernandez, L. D., Baenninger, A., and Koenig, T. (2016). 15 years of microstate research in schizophrenia - where are we? A meta-analysis. Front. Psych. 7:22. doi: 10.3389/fpsyt.2016.00022
Rosenfelder, M. J., Spiliopoulou, M., Hoppenstedt, B., Pryss, R., Fissler, P., Della Piedra Walter, M., et al. (2023). Stability of mental motor-imagery classification in EEG depends on the choice of classifier model and experiment design, but not on signal preprocessing. Front. Comput. Neurosci. 17:1142948. doi: 10.3389/fncom.2023.1142948
Rossi Sebastiano, D., Panzica, F., Visani, E., Rotondi, F., Scaioli, V., Leonardi, M., et al. (2015). Significance of multiple neurophysiological measures in patients with chronic disorders of consciousness. Clin. Neurophysiol. 126, 558–564. doi: 10.1016/j.clinph.2014.07.004
Schleiger, E., Sheikh, N., Rowland, T., Wong, A., Read, S., and Finnigan, S. (2014). Frontal EEG delta/alpha ratio and screening for post-stroke cognitive deficits: the power of four electrodes. Int. J. Psychophysiol. 94, 19–24. doi: 10.1016/j.ijpsycho.2014.06.012
Seitzman, B. A., Abell, M., Bartley, S. C., Erickson, M. A., Bolbecker, A. R., and Hetrick, W. P. (2017). Cognitive manipulation of brain electric microstates. NeuroImage 146, 533–543. doi: 10.1016/j.neuroimage.2016.10.002
Sitt, J. D., King, J. R., El Karoui, I., Rohaut, B., Faugeras, F., Gramfort, A., et al. (2014). Large scale screening of neural signatures of consciousness in patients in a vegetative or minimally conscious state. Brain 137, 2258–2270. doi: 10.1093/brain/awu141
Song, M., Zhang, Y., Cui, Y., Yang, Y., and Jiang, T. (2018). Brain network studies in chronic disorders of consciousness: advances and perspectives. Neurosci. Bull. 34, 592–604. doi: 10.1007/s12264-018-0243-5
Stefan, S., Schorr, B., Lopez-Rolon, A., Kolassa, I. T., Shock, J. P., Rosenfelder, M., et al. (2018). Consciousness indexing and outcome prediction with resting-state EEG in severe disorders of consciousness. Brain Topogr. 31, 848–862. doi: 10.1007/s10548-018-0643-x
Tait, L., Tamagnini, F., Stothart, G., Barvas, E., Monaldini, C., Frusciante, R., et al. (2020). EEG microstate complexity for aiding early diagnosis of Alzheimer’s disease. Sci. Rep. 10:17627. doi: 10.1038/s41598-020-74790-7
Tarailis, P., Koenig, T., Michel, C. M., and Griškova-Bulanova, I. (2023). The functional aspects of resting EEG microstates: a systematic review. Brain Topogr. 2023:958. doi: 10.1007/s10548-023-00958-9
Terpou, B. A., Shaw, S. B., Théberge, J., Férat, V., Michel, C. M., McKinnon, M. C., et al. (2022). Spectral decomposition of EEG microstates in post-traumatic stress disorder. NeuroImage Clin. 35:103135. doi: 10.1016/j.nicl.2022.103135
Tononi, G. (2005). Consciousness, information integration, and the brain. Prog. Brain Res. 150, 109–126. doi: 10.1016/S0079-6123(05)50009-8
Tononi, G. (2008). Consciousness as integrated information: a provisional manifesto. Biol. Bull. 215, 216–242. doi: 10.2307/25470707
Toplutaş, E., Aydın, F., and Hanoğlu, L. (2023). EEG microstate analysis in patients with disorders of consciousness and its clinical significance. Brain Topogr. 2023:939. doi: 10.1007/s10548-023-00939-y
Vanhaudenhuyse, A., Noirhomme, Q., Tshibanda, L. J. F., Bruno, M. A., Boveroux, P., Schnakers, C., et al. (2010). Default network connectivity reflects the level of consciousness in non-communicative brain-damaged patients. Brain 133, 161–171. doi: 10.1093/brain/awp313
Varotto, G., Fazio, P., Rossi Sebastiano, D., Duran, D., D’Incerti, L., Parati, E., et al. (2014). Altered resting state effective connectivity in long-standing vegetative state patients: an EEG study. Clin. Neurophysiol. 125, 63–68. doi: 10.1016/j.clinph.2013.06.016
Von Wegner, F., Knaut, P., and Laufs, H. (2018). EEG microstate sequences from different clustering algorithms are information-theoretically invariant. Front. Comput. Neurosci. 12:70. doi: 10.3389/fncom.2018.00070
Von Wegner, F., Tagliazucchi, E., and Laufs, H. (2017). Information-theoretical analysis of resting state EEG microstate sequences - non-Markovianity, non-stationarity and periodicities. NeuroImage 158, 99–111. doi: 10.1016/j.neuroimage.2017.06.062
Von Wegner, F., Wiemers, M., Lüneburg, K., Hermann, G., Tödt, I., and Tagliazucchi, E. (2023). Complexity measures for EEG microstate sequences-concepts and algorithms. Res. Sq. 2023:8411. doi: 10.21203/rs.3.rs-2878411/v1
Wu, D. Y., Cai, G., Yuan, Y., Liu, L., Li, G. Q., Song, W. Q., et al. (2011). Application of nonlinear dynamics analysis in assessing unconsciousness: a preliminary study. Clin. Neurophysiol. 122, 490–498. doi: 10.1016/j.clinph.2010.05.036
Yuan, H., Zotev, V., Phillips, R., Drevets, W. C., and Bodurka, J. (2012). Spatiotemporal dynamics of the brain at rest - exploring EEG microstates as electrophysiological signatures of BOLD resting state networks. NeuroImage 60, 2062–2072. doi: 10.1016/j.neuroimage.2012.02.031
Zanesco, A. P., Denkova, E., and Jha, A. P. (2021). Self-reported mind wandering and response time variability differentiate prestimulus electroencephalogram microstate dynamics during a sustained attention task. J. Cogn. Neurosci. 33, 28–45. doi: 10.1162/jocn_a_01636
Zappasodi, F., Croce, P., Giordani, A., Assenza, G., Giannantoni, N. M., Profice, P., et al. (2017). Prognostic value of EEG microstates in acute stroke. Brain Topogr. 30, 698–710. doi: 10.1007/s10548-017-0572-0
Zhang, C., Yang, Y., Han, S., Xu, L., Chen, X., Geng, X., et al. (2023). The temporal dynamics of large-scale brain network changes in disorders of consciousness: a microstate-based study. CNS Neurosci. Ther. 29, 296–305. doi: 10.1111/cns.14003
Zhang, Y., Zhang, Z., Luo, L., Tong, H., Chen, F., and Hou, S. T. (2021). 40 Hz light flicker alters human brain electroencephalography microstates and complexity implicated in brain diseases. Front. Neurosci. 15:777183. doi: 10.3389/fnins.2021.777183
Zhao, Z., Niu, Y., Zhao, X., Zhu, Y., Shao, Z., Wu, X., et al. (2022). EEG microstate in first-episode drug-naive adolescents with depression. J. Neural Eng. 19:056016. doi: 10.1088/1741-2552/ac88f6
Zhuang, W., Wang, J., Chu, C., Wei, X., Yi, G., Dong, Y., et al. (2022). Disrupted control architecture of brain network in disorder of consciousness. IEEE Trans. Neural Syst. Rehabil. Eng. 30, 400–409. doi: 10.1109/TNSRE.2022.3150834
Keywords: microstates, disorder of consciousness, EEG, post-stroke, biomarkers
Citation: Yu F, Gao Y, Li F, Zhang X, Hu F, Jia W and Li X (2023) Resting-state EEG microstates as electrophysiological biomarkers in post-stroke disorder of consciousness. Front. Neurosci. 17:1257511. doi: 10.3389/fnins.2023.1257511
Edited by:
Minoru Fujiki, Oita University, JapanReviewed by:
Qiuhong Yu, Capital Medical University, ChinaYaqi Chu, Chinese Academy of Sciences, China
Copyright © 2023 Yu, Gao, Li, Zhang, Hu, Jia and Li. This is an open-access article distributed under the terms of the Creative Commons Attribution License (CC BY). The use, distribution or reproduction in other forums is permitted, provided the original author(s) and the copyright owner(s) are credited and that the original publication in this journal is cited, in accordance with accepted academic practice. No use, distribution or reproduction is permitted which does not comply with these terms.
*Correspondence: Fenglian Li, bGlmZW5nbGlhbkB0eXV0LmVkdS5jbg==; Xueying Zhang, emhhbmd4eUB0eXV0LmVkdS5jbg==; Fengyun Hu, ZmVuZ3l1bjcxQDE2My5jb20=