 Jingfeng Bi
 Ming Chu
 Gang Wang1
- 1School of Automation, Beijing University of Posts and Telecommunications, Beijing, China
- 2School of Automation Science and Electrical Engineering, Beihang University, Beijing, China
The classification of electroencephalogram (EEG) motor imagery signals has emerged as a prominent research focus within the realm of brain-computer interfaces. Nevertheless, the conventional, limited categories (typically just two or four) offered by brain-computer interfaces fail to provide an extensive array of control modes. To address this challenge, we propose the Time-Spatial Parallel Network (TSPNet) for recognizing six distinct categories of upper limb motor imagery. Within TSPNet, temporal and spatial features are extracted separately, with the time dimension feature extractor and spatial dimension feature extractor performing their respective functions. Following this, the Time-Spatial Parallel Feature Extractor is employed to decouple the connection between temporal and spatial features, thus diminishing feature redundancy. The Time-Spatial Parallel Feature Extractor deploys a gating mechanism to optimize weight distribution and parallelize time-spatial features. Additionally, we introduce a feature visualization algorithm based on signal occlusion frequency to facilitate a qualitative analysis of TSPNet. In a six-category scenario, TSPNet achieved an accuracy of 49.1% ± 0.043 on our dataset and 49.7% ± 0.029 on a public dataset. Experimental results conclusively establish that TSPNet outperforms other deep learning methods in classifying data from these two datasets. Moreover, visualization results vividly illustrate that our proposed framework can generate distinctive classifier patterns for multiple categories of upper limb motor imagery, discerned through signals of varying frequencies. These findings underscore that, in comparison to other deep learning methods, TSPNet excels in intention recognition, which bears immense significance for non-invasive brain-computer interfaces.
1 Introduction
Brain-computer interface (BCI) plays a pivotal role in facilitating communication and control between the human brain and external devices (Ang and Guan, 2015; Chaudhary et al., 2016). Among various techniques, electroencephalography (EEG) offers a notable advantage in terms of its superior time resolution when compared to similar methods like functional magnetic resonance imaging and near-infrared spectroscopy. The enhanced temporal resolution of EEG enables swift communication between users and computers, which, in turn, contributes significantly to the development of rehabilitation systems for patients with tetraplegia and aids in supporting the daily activities of healthy individuals (Suk and Lee, 2013; Leeb et al., 2015; Ang and Guan, 2017). A multitude of algorithms have been developed for EEG pattern classification in diverse BCI applications (Iacoviello et al., 2016; Foong et al., 2020; Zhang et al., 2020; Wang et al., 2021, 2023; Chen et al., 2022; She et al., 2023). In their research, Wang et al. (2021) redefined the common spatial pattern (CSP) as a constrained minimization problem, establishing equivalence between the reformulated CSP and the original CSP. Additionally, Zhang et al. (2020) proposed a deep learning framework that incorporates convolutional and recurrent neural networks. EEG-based BCI applications commonly rely on four main types of neurophysiological patterns, namely, steady-state visual evoked potential (SSVEP) (Autthasan et al., 2020; Kwak and Lee, 2020; Rivera-Flor et al., 2022; Zhang et al., 2022; Chailloux Peguero et al., 2023; Yan et al., 2023), event-related potential (ERP) (Cecotti and Graeser, 2011; Zou et al., 2016; Li et al., 2020), movement-related cortical potentials (MRCPs) (Xu et al., 2014; Jeong et al., 2020), and motor imagery (MI) (Siuly and Li, 2012; Higashi and Tanaka, 2013; Edelman et al., 2016; He et al., 2016; Chaisaen et al., 2020; Wu et al., 2020; Gaur et al., 2021; Ma et al., 2022; Fan et al., 2023; Zhang et al., 2023). Among these EEG applications, MI has garnered increasing attention within BCI systems due to its ability to elicit oscillatory neural activity in specific frequency bands over the motor cortex region without external stimuli.
In previous research on MI, Duan et al. (2021) proposed a binary standard task-related component analysis method (bSTRCA). In bSTRCA, correlation coefficients were extracted as features, and a linear discriminant analysis classifier was then used to classify the features. Filter bank selection can further enhance the performance of bSTRCA, leading to the introduction of the binary filter bank task-related component analysis (bFBTRCA) method (Jia et al., 2022). Additionally, they adapted the structure of the bSTRCA method for multi-class standard task-related component analysis (mSTRCA). Moreover, the multi-class filter bank task-related component analysis (mFBTRCA) method (Jia et al., 2023) was developed by integrating filter bank selection into mSTRCA. This method is applied to classify multi-class limb movements by segmenting MRCP signals into low-frequency filter banks. It optimizes multi-channel signals within these banks using spatial filters to extract correlation features, which are then combined and classified using a support vector machine. Jin et al. (2020) introduced a sparse Bayesian ELM-based algorithm to enhance the classification performance of MI. Jin et al. (2019) proposed a correlation-based channel selection (CCS) method to identify channels that contain more correlated information. Zhang et al. (2019) introduced a novel algorithm called temporally constrained sparse group spatial pattern (TSGSP) for simultaneously optimizing filter bands and time windows within CSP to further improve the classification accuracy of MI EEG. Jiao et al. (2019) presented a novel sparse group representation model (SGRM) to enhance the efficiency of MI-based BCI by leveraging intrasubject information. Barachant et al. (2012) introduced a new classification framework that incorporates the concept of Riemannian geometry into the manifold of covariance matrices. Aghaei et al. (2016) proposed separable common spatial-spectral patterns (SCSSP). Most of the previous MI-based research has produced excellent results, but the current BCI system based on MI can only effectively distinguish between left and right motor execution/imagery.
Deep learning (DL), as a subcategory of machine learning, currently represents the state-of-the-art approach in computer vision and natural language processing applications (Sakhavi et al., 2018). Beyond its application in computer vision, DL has also found utility in various domains, including brain-computer interfaces (BCI). Recent findings by Schirrmeister et al. (2017) have demonstrated that advancements in machine learning, such as batch normalization and exponential linear units, when combined with a carefully curated training strategy, have significantly enhanced the performance of deep convolutional neural networks (DCNNs) in decoding, achieving results on par with the widely adopted filter bank common spatial patterns (FBCSP) algorithm. In a novel development, Vuckovic and Sepulveda (2012) introduced a two-modality, four-category BCI classifier based on motor imagery involving movements of the left and right wrists. Meanwhile, Hajinoroozi et al. (2016) put forward an innovative channel-wise convolutional neural network (CCNN) architecture. Additionally, they explored CCNN-R, a variant of CCNN employing restricted Boltzmann machines to replace conventional convolutional filters. Furthermore, Tabar and Halici (2017) conducted a study on the classification of EEG motor imagery signals using convolutional neural networks (CNNs) and stacked autoencoders (SAEs). They proposed a new deep network by amalgamating CNNs and SAEs. Despite notable advancements in recent years, limitations persist in motor imagery-based BCI research. The primary focus has been on binary classification tasks, such as distinguishing between left-hand and right-hand motor imagery tasks or right-hand and right-foot motor imagery tasks, among others. Related research has, at most, extended to four-category classification problems, such as distinguishing between left and right hand, foot, and tongue motor imagery tasks. In reality, human upper limb movements encompass six distinct and typical categories, including elbow flexion, elbow extension, forearm supination, forearm pronation, hand open, and hand close. These six classes encompass the natural and continuous spectrum of upper limb movements. However, existing EEG-based motor imagery classifications have been limited to just two or four categories. This limitation starkly contrasts with the way individuals naturally plan to execute movements, hindering the full replication and support of the richness and diversity of human upper limb actions.
In this paper, we introduce a Time-Spatial Parallel Network (TSPNet) based on deep learning for the classification of six categories of upper limb movements. The TSPNet comprises three critical components: the Time Dimension Feature Extractor (TDFE) and the Spatial Dimension Feature Extractor (SDFE) for extracting temporal and spatial features, and the Time-Spatial Parallel Feature Extractor (TSPFE) for parallelizing time-spatial features. Specifically, the TDFE module employs residual convolutional blocks to extract temporal features, while the SDFE module utilizes residual convolutional blocks to extract spatial features. The TSPFE module subsequently eliminates the correlation between temporal and spatial features to reduce feature redundancy. Furthermore, the TSPFE module utilizes a gating mechanism to optimize weight distribution and parallelize time-spatial features. Diverging from existing networks that employ binary classification, our deep learning model in this study adopts multi-class classification. Additionally, we propose a feature visualization algorithm based on signal occlusion frequency to qualitatively analyze the proposed TSPNet. In summary, the primary contributions of our work are as follows:
1. A time-spatial parallel network (TSPNet) is introduced for the recognition of six classes of upper limb motor imagery.
2. Within TSPNet, a critical module called TSPFE is introduced to parallelize time-spatial features.
3. We provide a publicly accessible dataset containing EEG data from ten individuals, comprising a total of 1,800 samples of upper limb motor imagery data (hand open, hand close, forearm supination, forearm pronation, elbow flexion, and elbow extension) categorized into six classes.
The remainder of this article is organized as follows. In Section 2, we offer a comprehensive exploration of the architecture of our proposed TSPNet model, along with a detailed description of the feature visualization algorithm based on signal occlusion frequency that we have put forth. Moving on to Section 3, we present the datasets and implementation details, accompanied by ablation studies and a thorough comparison of experimental results. Moreover, we conduct experiments related to feature visualization in this section. Finally, Section 4 provides the conclusion to this article.
2 Methods
In this section, we introduce the Time-Spatial Parallel Network (TSPNet). We provide a detailed description of its key components, namely the Time Dimension Feature Extractor (TDFE), Spatial Dimension Feature Extractor (SDFE), and Time-Spatial Parallel Feature Extractor (TSPFE). Furthermore, we present an algorithm for feature visualization based on occluded input signal frequency, which is used for qualitative analysis of TSPNet. Our code will be publicly available on “https://github.com/Special4519/TSPNet.”
2.1 Time-spatial parallel network framework
As depicted in Figure 1, the proposed TSPNet comprises three main components: the Time Dimension Feature Extractor (TDFE), the Spatial Dimension Feature Extractor (SDFE), and the Time-Spatial Parallel Feature Extractor (TSPFE). Specifically, the TDFE employs a convolutional layer with kernel sizes of 1 × 7 to detect time dimension features from the input EEG signals. The structure of the input EEG is represented as [16, 1, 500, 1], where 16 denotes the number of signal channels, and 1,500 represents the sampling time points (the product of sampling frequency and time). Next, the TDFE uses residual convolutional blocks with kernel sizes of 1 × 1 and 1 × 3 in a parallel structure to extract shallow and deep time features within the time dimension. The resulting output is then fed into the SDFE. Let IEEG represent the original input EEG signals; this stage can be formulated as:
where HTDFE(·) represents the time dimension feature extraction procedure, which is divided into the shallow time feature extraction step HLT(·), the middle time feature extraction step HMT(·), and the deep time feature extraction step HHT(·). FTD is the output time dimension feature vector from the TDFE module.
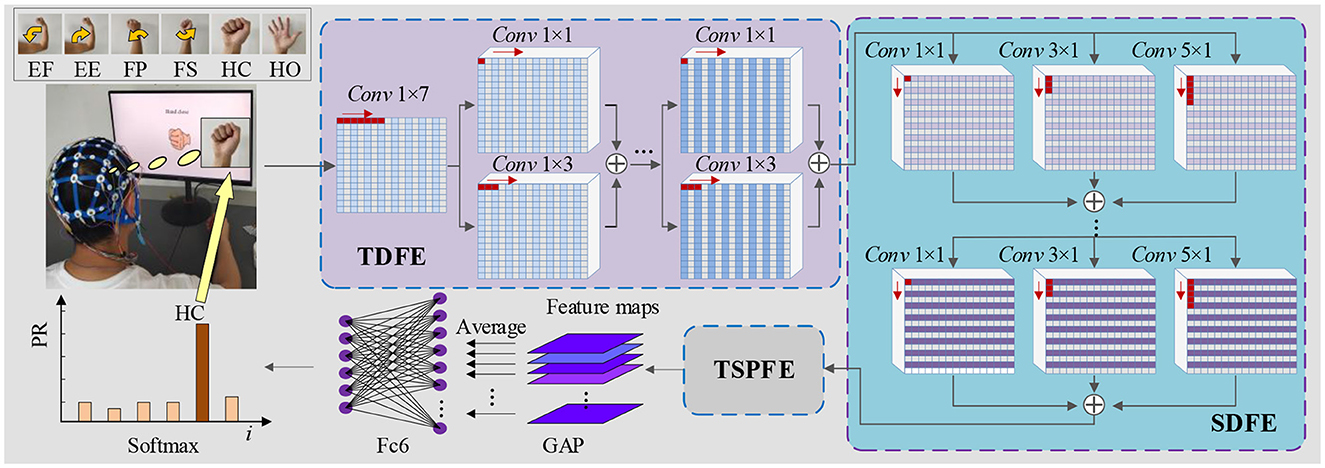
Figure 1. Architecture of TSPNet: mainly comprising three components—TDFE module, SDFE module, and TSPFE module.
The SDFE employs residual convolutional blocks with kernel sizes of 1 × 1, 3 × 1, and 5 × 1 in a parallel structure to extract spatial features. The input to this stage is FTD, and the output is then fed into the TSPFE. This stage can be formulated as:
where HSDFE(·) denotes the spatial dimension feature extraction procedure. FSD is the output spatial dimension feature vector from the SDFE module. The feature FSD extracted by the SDFE module is used as the input for the TSPFE module. First, the TSPFE removes the connection between time features and spatial features to eliminate redundancy. Then, the TSPFE employs a gating mechanism to achieve a more effective weight distribution and parallelize time-spatial features. Finally, the output FTSP is pooled by global average pooling (GAP) and connected to the fully connected layer and the softmax layer.
We adopt the generic cross-entropy loss function to train the proposed TSPNet model. defined as follows:
where N is the number of samples, K is the number of categories, wi represents the weight for category i, tni indicates whether the nth sample belongs to the ith category, and yni is the output for sample n and category i, which is determined by the softmax function. yni also represents the probability that the network associates the nth input with category i.
2.1.1 Time dimension feature extractor
The EEG signal is a type of non-stationary and nonlinear signal with strong randomness (Garcia-Martinez et al., 2021). Traditional signal processing methods are based on the theoretical analysis of linear systems, which inevitably results in the loss of a significant amount of information carried by the original signal. In order to extract complex features in the time dimension, we propose a Time Dimension Feature Extractor (TDFE) module that only convolves in the time dimension, as shown in Figure 2A. We also compare the TDFE with a non-residual block TDFE-NR, as shown in Figure 2B. The comparison results are presented in Section III. In the TDFE, we utilize a convolutional layer with kernel sizes of 1×7 to increase the receptive field of the network. This allows the TDFE to cover a larger area with the convolutional filters. Subsequently, the shallow time feature extraction step HLT(·) can be defined as
where, xLT represents the shallow time feature vector, xin is the input vector for the shallow time feature extraction step, σ denotes the ReLU activation function, Γ represents the residual mapping to be learned, and and are the weights of 1 × 1 and 1 × 3 convolutional kernels with 64 channels, respectively. The shallow time feature extraction step uses residual convolutional blocks with kernel sizes of 1×1 and 1×3 in parallel to fuse different-level features of the input xin into the shallow time feature vector. Similarly, the middle time feature extraction step HMT(·) and the deep time feature extraction step HHT(·) can be defined as
where xMT represents the middle time feature vector, xHT represents the deep time feature vector, and it is also the time dimension output feature vector of the TDFE module.
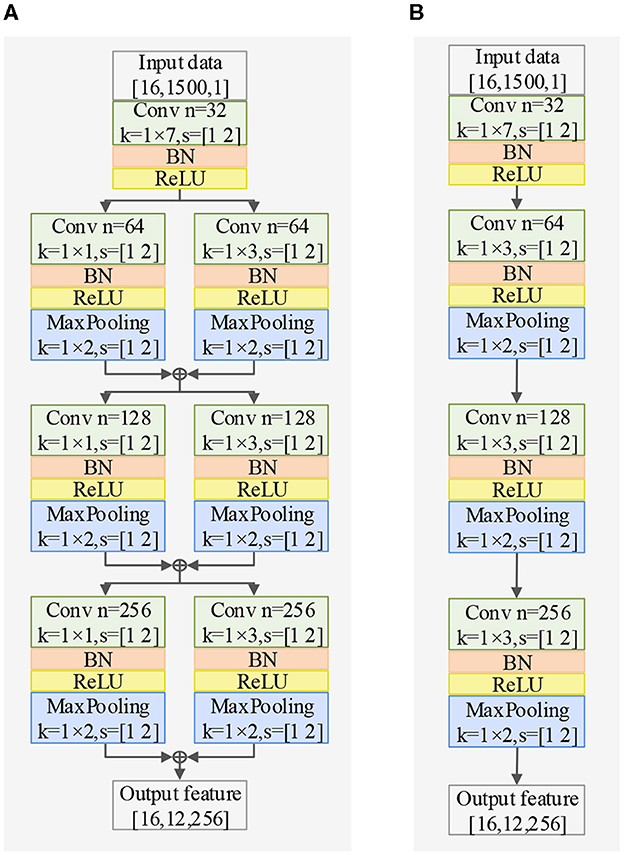
Figure 2. Exploring different TDFE forms: a comparative study of two structures in classification accuracy, demonstrating the superiority of the residual block TDFE, with BN representing batch normalization layer. (A) Structure of TDFE. (B) Structure of TDFE-NR.
2.1.2 Spatial dimension feature extractor
Regarding spatial dimension feature extraction, we introduce two spatial feature extractors. The Spatial Dimension Feature Extractor (SDFE) can be seen in Figure 3A and utilizes a max-pooling layer to reduce the size of the feature map. On the other hand, SDFE-NP, shown in Figure 3B, omits the max-pooling layer but sets the convolution stride in the spatial dimension to 2. In terms of convolutional structure, both SDFE and SDFE-NP employ three groups of parallel structures with convolutional kernels of different sizes to extract spatial dimension features at various levels. This stage can be expressed as follows:
where, FSD represents the spatial dimension output feature vector, β is the number of residual paths, σ denotes the ReLU activation function, Γ signifies the residual mapping to be learned, and , , and are the weights of 1 × 1, 3 × 1, and 5 × 1 convolutional kernels, each with 512 channels.
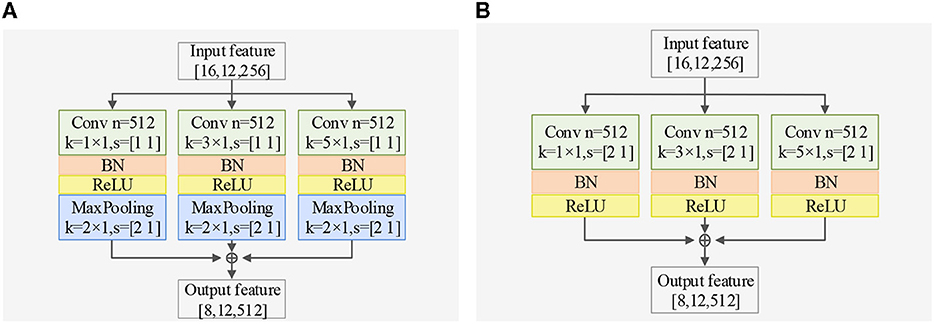
Figure 3. Exploring different SDFE forms: a comparative study of two structures in classification accuracy, demonstrating the superiority of SDFE, with BN representing batch normalization layer. (A) Structure of SDFE. (B) Structure of SDFE-NP.
2.1.3 Time-spatial parallel feature extractor
To extract parallel features from both the time and spatial dimensions, we propose a Time-Spatial Parallel Feature Extractor (TSPFE), as illustrated in Figure 4. In the TSPFE, each channel's input data is processed separately and represented as X. First, we calculate the affine transformation matrix Q ∈ RW×W through X ∈ RH×Wand transpose matrix X⊤:
where, M ∈ ℝH×H represents a weight matrix. The elements of Q reflect the similarity between the time dimension and spatial dimension features. As M is a square matrix, its diagonalization can be expressed as:
where P is an invertible matrix, and D is a diagonal matrix. Subsequently, Eq. (8) can be rewritten as:
Let M be a symmetric matrix; then M must be both orthogonal and diagonal. The orthogonal matrix P projects the feature into an orthogonal space, eliminating the connection between the time feature and the spatial feature to prevent redundancy. This stage can be formulated as:
next, we normalize the columns and rows of the Q matrix and multiply it with the original X matrix:
where ⊗ denotes matrix multiplication by channel. Fc and Fr represent time features and spatial features, respectively. Considering that different channels and time points have varying importance, we introduce a gating mechanism to achieve better weight distribution:
where * denotes element-wise multiplication, σ denotes the ReLU activation function, wf represents the convolution weights, and bf is the convolution bias. Finally, we combine Fc and Fr to obtain FTSP, which is the time-spatial parallel feature:
The final extracted time-spatial parallel feature is pooled using global average pooling (GAP) and connected to the fully connected layer and the softmax layer.
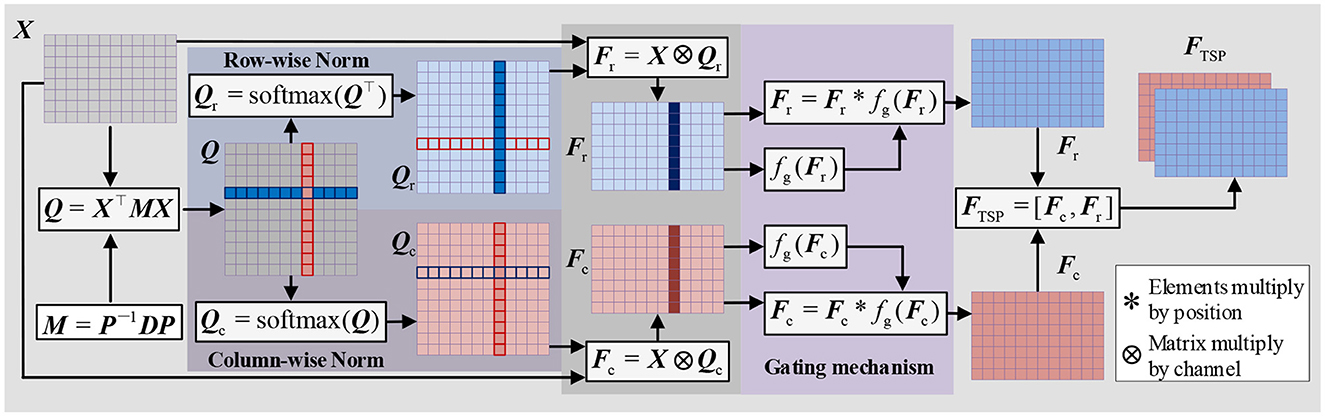
Figure 4. Structure of TSPFE.
2.2 Feature visualization algorithm
To qualitatively analyze TSPNet, we propose a feature visualization algorithm based on signal occlusion frequency, as illustrated in Algorithm 1. The test dataset is denoted as T = {X1, …, XM}. The real labels of the test dataset are denoted as Y = {y1, …, yM}, where M represents the total number of test trials. f(X, ω) is a well-trained TSPNet classifier, where ω represents the classifier's parameters. First, the test dataset T is input into the classifier to obtain the predicted labels Yp.

Algorithm 1. Feature visualization algorithm based on signal occlusion frequency.
We then compare the predicted labels Yp with the real labels Y to identify the correctly recognized test dataset, denoted as Tc. Next, Tc is filtered using filters with frequency ranges (δ:0.5 − 3Hz, θ:3 − 7Hz, α:7 − 13Hz, β:13 − 200Hz), expressed as
where, Tδ, Tθ, Tα, and Tβ represent the correctly recognized test datasets in different frequency ranges. These test datasets in different frequency ranges are then input into the feature extraction function of TSPNet to obtain the activated features in different frequency ranges, expressed as
The activated features in different frequency ranges are then averaged based on different categories. Finally, scalp topographic maps are generated for different categories and different frequencies.
3 Experiments and results
In this section, we begin by providing a brief overview of the datasets and our experimental setup. Following this, we conduct ablation studies. Subsequently, we compare TSPNet with various deep learning methods [MSATNet (Hu et al., 2023), EEGSym (Perez-Velasco et al., 2022), DeepConvNet (Schirrmeister et al., 2017), EEGNet-8,2 (Lawhern et al., 2018)] using two datasets. Finally, we perform experiments related to feature visualization.
3.1 Datasets
Dataset I was collected through our experiments. We recruited 10 healthy participants aged between 24 and 38 years, with a mean age of 30 years (standard deviation 5 years). Five of the participants are male, and all are right-handed. The study was conducted in accordance with the Declaration of Helsinki, and informed consent was obtained from all subjects. This study does not require ethical approval because of its non-invasive nature, utilization of anonymous data, and adherence to the Helsinki Declaration. Subjects had normal or corrected-to-normal vision and no history of neurological or psychiatric disorders. They performed six categories of motor imagery tasks involving elbow flexion, elbow extension, forearm supination, forearm pronation, hand open, and hand close, all related to the right upper limb. EEG signals were recorded using 16 active Ag/AgCl electrodes with the OpenBCI CytonDaisy 16-channel Biosensing Board. We applied an 8th order Chebyshev bandpass filter from 0.01 to 200 Hz and used a notch filter at 50 Hz to suppress power line interference. The sampling frequency was set to 500 Hz, with the reference electrode placed on the left earlobe and the ground on the right earlobe. EEG electrodes were positioned following the international standard 10–20 electrode system. Dataset I comprises 18,000 epochs (300 trials × six categories × 10 subjects). This dataset has been uploaded to IEEE DataPort and can be accessed at “https://dx.doi.org/10.21227/8qw6-f578.”
Dataset II is provided by Ofner et al. (2017) and is available in the BNCI Horizon 2020 database at “http://bnci-horizon-2020.eu/database/data-sets.” It includes electroencephalography (EEG) data from 15 healthy subjects aged between 22 and 40 years, with a mean age of 27 years (standard deviation 5 years). EEG signals were measured using 61 channels covering frontal, central, parietal, and temporal areas, employing active electrodes and four 16-channel amplifiers from g.tec medical engineering GmbH, Austria. In total, Dataset II contains 5,400 epochs (60 trials × six categories × 15 subjects).
3.2 Implementation details
In Dataset I and Dataset II, we train the data for each subject separately. In each training iteration, the data is divided into a training dataset and a testing dataset with a partition ratio of 70%–30%. The dataset is randomly shuffled, resulting in a total of 10 partitions. The average classification accuracy of these 10 experiments serves as the evaluation criterion. We employ the ADAM optimizer (Kingma and Ba, 2015) for model training, and the optimizer parameters are detailed in Table 1. The development of TSPNet is carried out using MATLAB R2020b (The MathWorks, Inc., Natick, MA, USA), and training is performed on a high-performance GPU (GeForce RTX 5000) integrated into an Intel (R) Core (TM) i7-7000K CPU processor with 64 GB RAM. For comparison, we evaluate TSPNet alongside other end-to-end deep learning methods, including MSATNet (Hu et al., 2023), EEGSym (Perez-Velasco et al., 2022), DeepConvNet (Schirrmeister et al., 2017), and EEGNet-8,2 (Lawhern et al., 2018). These methods are based on convolutional neural networks for EEG signal classification. To adapt these models to our datasets, we modify the classification number of the output layer to six, as required by the two datasets used in this study. Originally designed for EEG signals of 128 and 250 Hz, we down-sample the EEG signals in Dataset I and Dataset II to match their respective architectures. Training these models follows the same procedure as that of the TSPNet model.
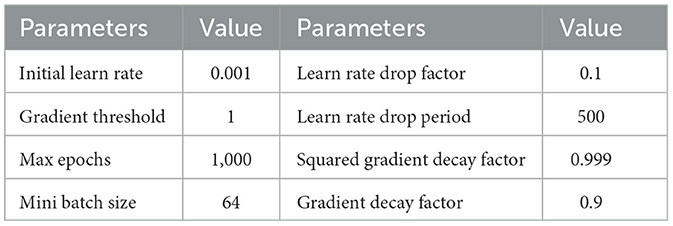
Table 1. ADAM optimizer parameters.
3.3 Ablation studies on the Dataset I
In this section, we evaluate the impact of the proposed TDFE, SDFE, and TSPFE modules on the performance of TSPNet. Additionally, we validate the influence of different structures within the TDFE (Figure 2B) and SDFE (Figure 3B) modules on TSPNet. The experiments were conducted on Dataset I. Consistent with the details outlined in the implementation, during each ablation experiment, the training set and test set maintained a 70%–30% ratio, ensuring equal and balanced numbers for all classes to guarantee an equal chance level for each class. The experimental results are presented in Table 2, and a detailed analysis is provided below.
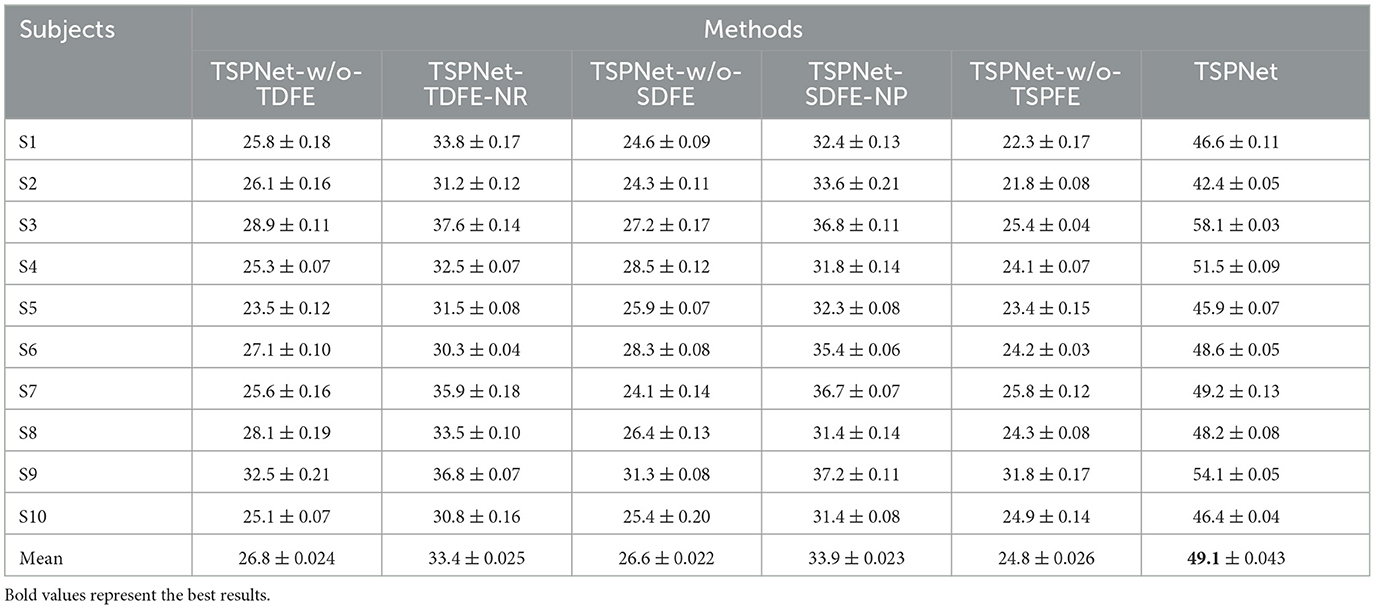
Table 2. Performance (mean ± SD) (in %) of ablation studies for TDFE, SDFE, and TSPFE on Dataset I.
1) Ablation studies for TDFE: To demonstrate the effectiveness of the TDFE module, we remove the TDFE module and refer to it as TSPNet-w/o-TDFE. As shown in Table 2, when compared to TSPNet-w/o-TDFE, TSPNet exhibits a 22.3% increase in mean classification accuracy, indicating that the TDFE module, convolved in the time dimension, is effective for TSPNet. Furthermore, we replace the TDFE module with the non-residual block TDFE (referred to as TSPNet-TDFE-NR) to demonstrate the effectiveness of the residual block structure in TDFE. TSPNet shows improvement in all subjects, with a notable 20.5% boost in subject-3 (58.1% vs. 37.6%).
2) Ablation studies for SDFE: First, we validate the effectiveness of the SDFE module. We remove the SDFE module and refer to it as TSPNet-w/o-SDFE. Our TSPNet shows an overall improvement of 22.5% (49.1% vs. 26.6%), clearly demonstrating that the SDFE module, convolved in the spatial dimension, significantly enhances TSPNet's performance. Next, we replace the SDFE module with the non-maxpooling block SDFE (referred to as TSPNet-SDFE-NP) to illustrate the impact of the maxpooling structure in SDFE. When comparing TSPNet with TSPNet-SDFE-NP, TSPNet achieves an overall increment of 15.2% (49.1% vs. 33.9%).
3) Ablation studies for TSPFE: To further demonstrate the effectiveness of the TSPFE module, we remove the TSPFE module and denote it as TSPNet-w/o-TSPFE. Compared to TSPNet-w/o-TSPFE, TSPNet's mean classification accuracy increases by 24.3% (49.1% vs. 24.8%), underscoring the critical role of the TSPFE module in enhancing TSPNet.
3.4 Comparisons with the deep learning reference methods
1) Quantitative analysis on the Dataset I: TSPNet is compared with deep learning methods [MSATNet (Hu et al., 2023), EEGSym (Perez-Velasco et al., 2022), DeepConvNet (Schirrmeister et al., 2017), EEGNet-8,2 (Lawhern et al., 2018)]. The experimental results shown in Table 3 and Figure 5 demonstrate that TSPNet achieves the best mean accuracy on Dataset I. Compared to EEGNet-8,2, our TSPNet achieves approximately a 14.7% improvement in mean classification accuracy (49.1% vs. 34.4%). Notably, for subject-9, TSPNet outperforms EEGNet-8,2 by ~22.2% (54.1% vs. 31.9%). Because of the equal and balanced distribution of each class in the training data during the training process, the chance level for all six classification experiments in this study is 16.67%. To assess whether there is a significant difference in accuracy between TSPNet and other comparison methods, two-sample t-test was conducted in this study. The null hypothesis assumes that the accuracy of TSPNet and other comparison methods follows a normal distribution with equal means and unknown but identical variances. The alternative hypothesis is that there's a notable difference in accuracy between TSPNet and the other comparative methods. If the p-value is less than the significance level of 0.05, then the null hypothesis is rejected. The results, as indicated by the p-value in Table 3, signify a significant difference in accuracy between TSPNet and the other comparison methods.
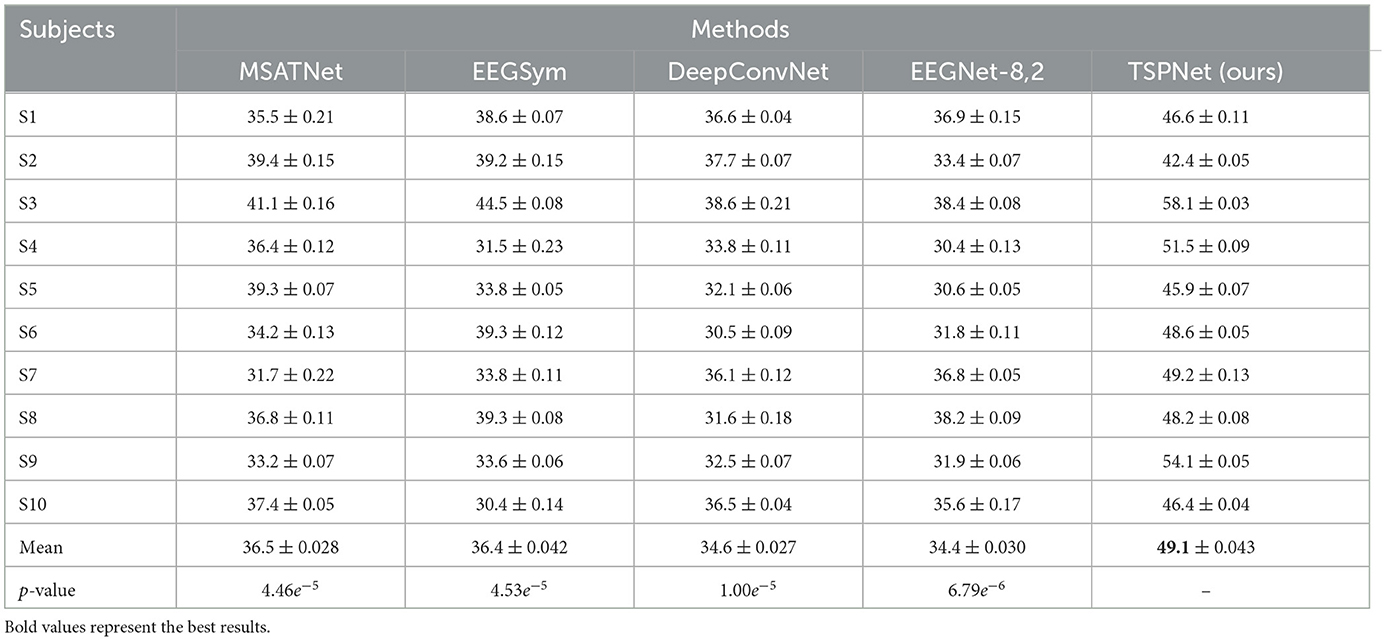
Table 3. Performance (mean ± SD (in %) comparison with deep learning methods on Dataset I.
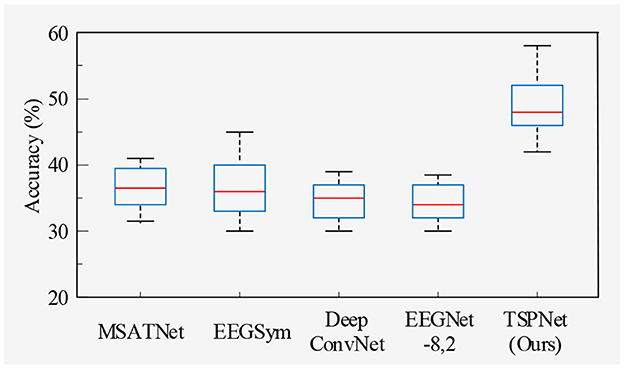
Figure 5. Box plot of classification accuracy for Dataset I.
2) Quantitative analysis on the Dataset II: We evaluate the proposed TSPNet on Dataset II to demonstrate its advantages. First, we use all 61-channel EEG signals in Dataset II for experiments. The classification accuracy experimental results of 15 subjects are listed in Table 4. It can be seen from Table 4 and Figure 6 that our TSPNet achieves an average classification accuracy of 49.7 ± 0.029, which is superior to all other comparison methods. Compared with Ofner et al. (2017), the performance of TSPNet has improved, with a relative improvement of 24.5% (49.7% vs. 25.2%). Compared with EEGNet-8,2, the performance of TSPNet has improved, with a relative improvement of 17.5% (49.7% vs. 32.2%). Furthermore, to compare the influence of EEG signals with different channel numbers on classification results, we select 16-channel EEG signals corresponding to Dataset I from Dataset II for classification experiments. As shown in Table 5 and Figure 7, TSPNet also achieves the best mean accuracy. As can be seen from Tables 4, 5, the mean classification accuracy of 61-channel data is 2.2% (49.7% vs. 47.5%) higher than that of 16-channel data. One possible reason is that more channels contain more spatial information. The p-values of two-sample t-test for TSPNet and other comparison methods, as shown in Tables 4, 5, indicate a significant difference in classification accuracy between TSPNet and the other comparison methods on Dataset II.
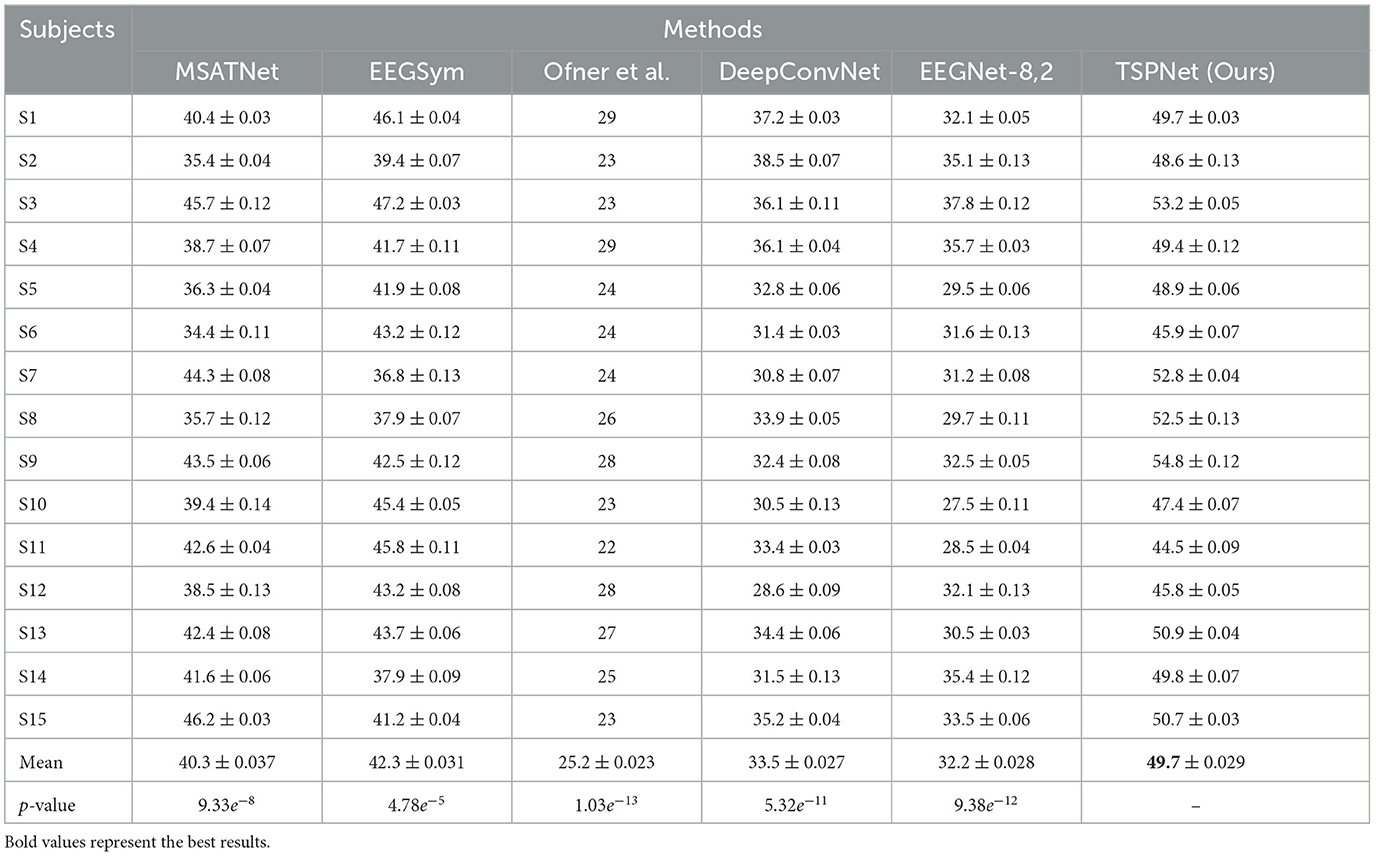
Table 4. Performance (mean ± SD) (in %) comparison with deep learning methods on Dataset II using 61 channels.
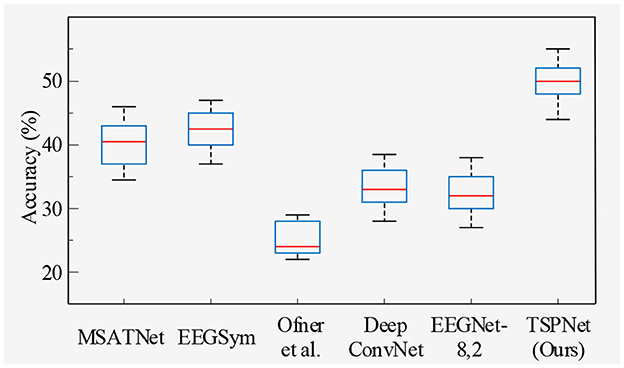
Figure 6. Box plot of classification accuracy for data from 61 channels in Dataset II.
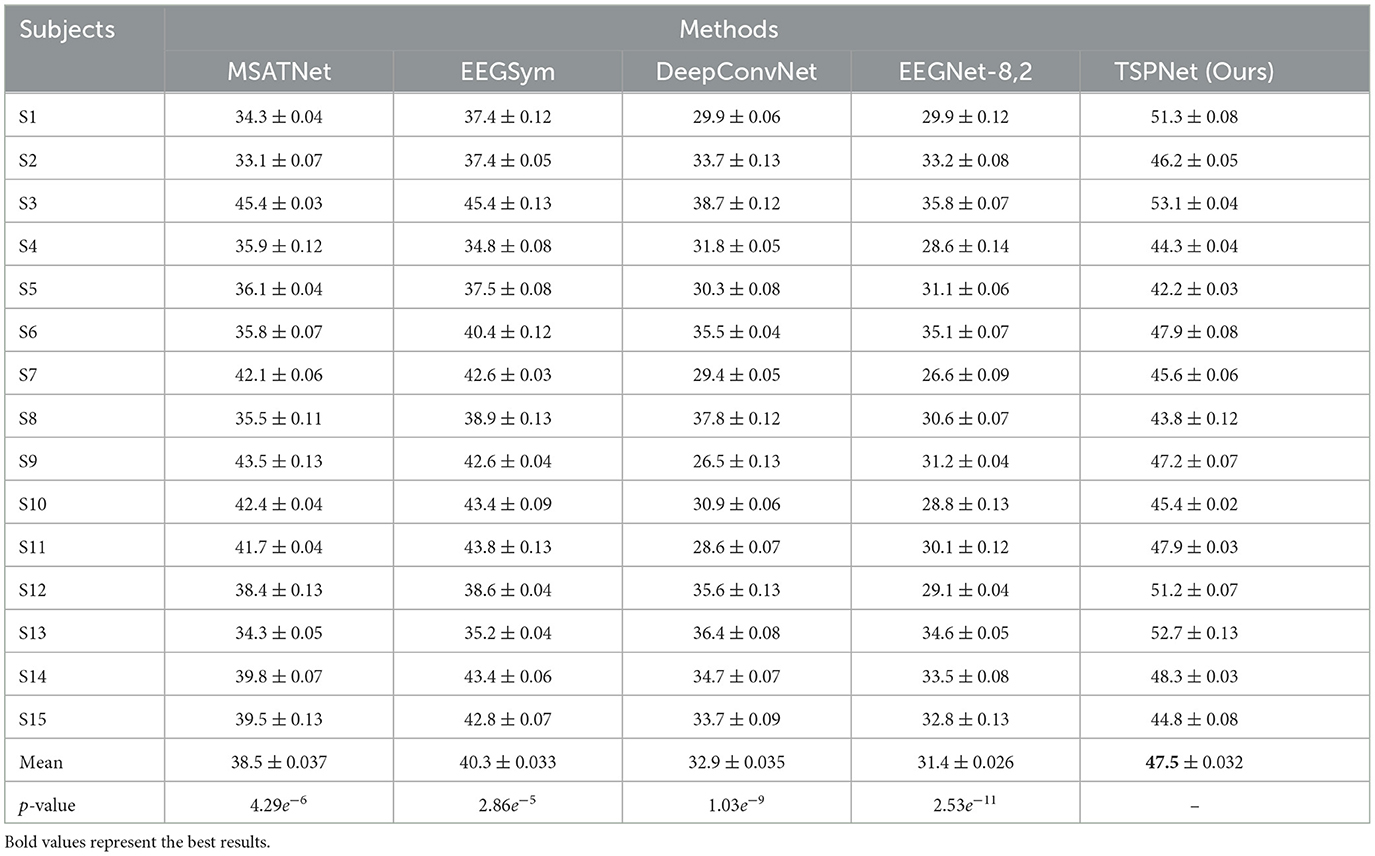
Table 5. Performance (mean ± SD) (in %) comparison with deep learning methods on Dataset II using 16 channels.
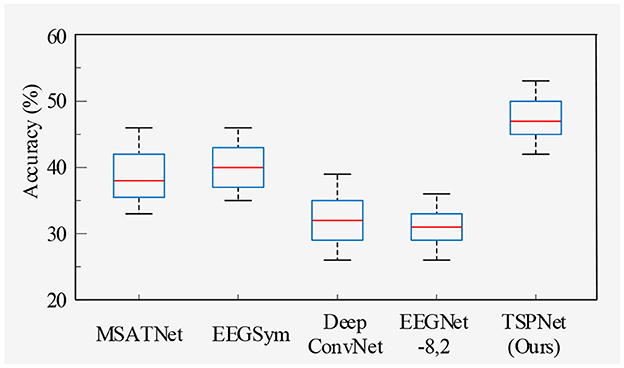
Figure 7. Box plot of classification accuracy for data from 16 channels in Dataset II.
3.5 Visualization experiments
3.5.1 Visualization of EEG source estimation
The TSPNet, as proposed in this article, is a brain-computer interface (BCI) model based on motor imagery (MI). The underlying principle of the MI-BCI system is that when a person envisions a movement, specific regions of their brain become activated, leading to alterations in their EEG signals. LORETA (Pascual-Marqui et al., 1994) is employed to visualize the source estimation of EEG data for the two datasets utilized in this article. This source estimation reveals the contributions of multiple sources to scalp EEG signals within a single cortical map. Figure 8 displays the EEG signal source estimation for the same action in both datasets, with a time interval of 250 ms spanning from −0.5 to 1 s. Figure 8A corresponds to Dataset I, while Figure 8B corresponds to Dataset II. This visualization is independent of TSPNet. The routines from the toolbox (Tadel et al., 2011) were employed to compute the inverse solutions for this visualization. The toolbox is open-source and available for free download at “https://github.com/aojeda/headModel.” As demonstrated in Figure 8, specific areas of the cerebral cortex become activated during motor imagination, resulting in corresponding changes in EEG signals.
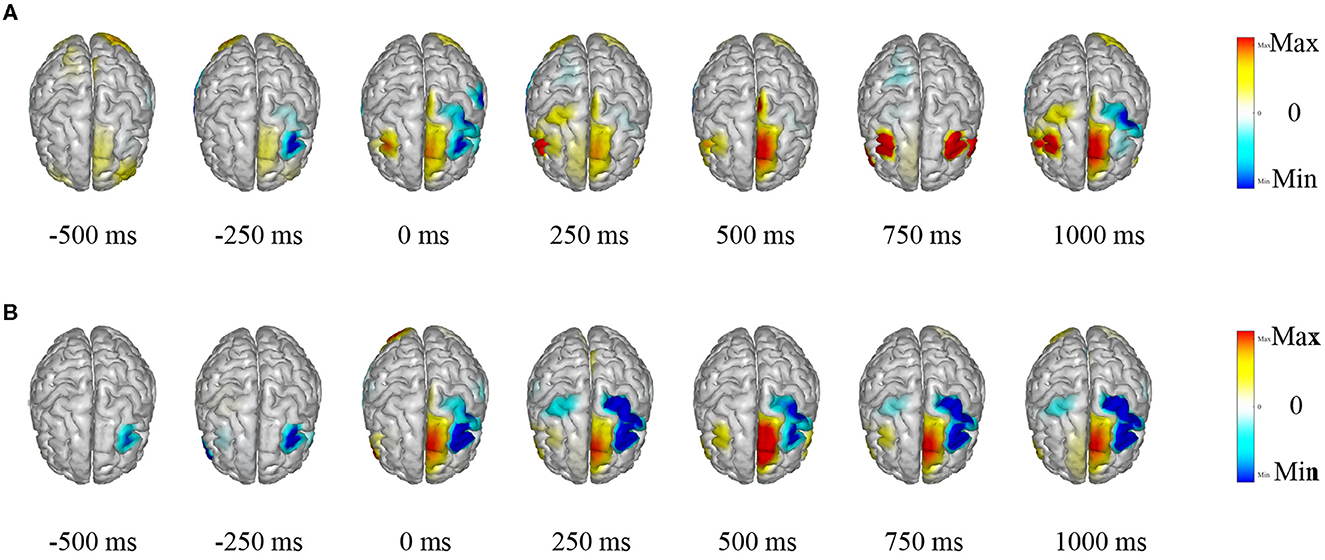
Figure 8. Visualization of EEG source estimation. (A) Visualization of EEG source estimation for Dataset I. (B) Visualization of EEG source estimation for Dataset II.
3.5.2 Feature visualization based on signal occlusion frequency
To investigate how TSPNet can successfully decode information from EEG signals, Algorithm 1 is utilized to visualize the features extracted from TSPNet, and the results are presented in Figure 9. The red circles in the Figure 9 indicate distinct classifier patterns that can be used for differentiation. It can be observed from Figure 9 that the movements hand open and hand close exhibit distinct classifier patterns in the frequency ranges θ: 3–7 Hz and α : 7–13 Hz. Similarly, the movements elbow flexion and elbow extension display distinctive patterns at δ : 0.5–3 Hz, θ: 3–7 Hz, and β: 13–200 Hz, while the movements forearm supination and forearm pronation feature unique classifier patterns at δ: 0.5–3 Hz and α: 7–13 Hz. These visualization results demonstrate that the proposed framework is capable of generating distinct classifier patterns for various upper limb motor imagery categories across different frequency bands in EEG signals.
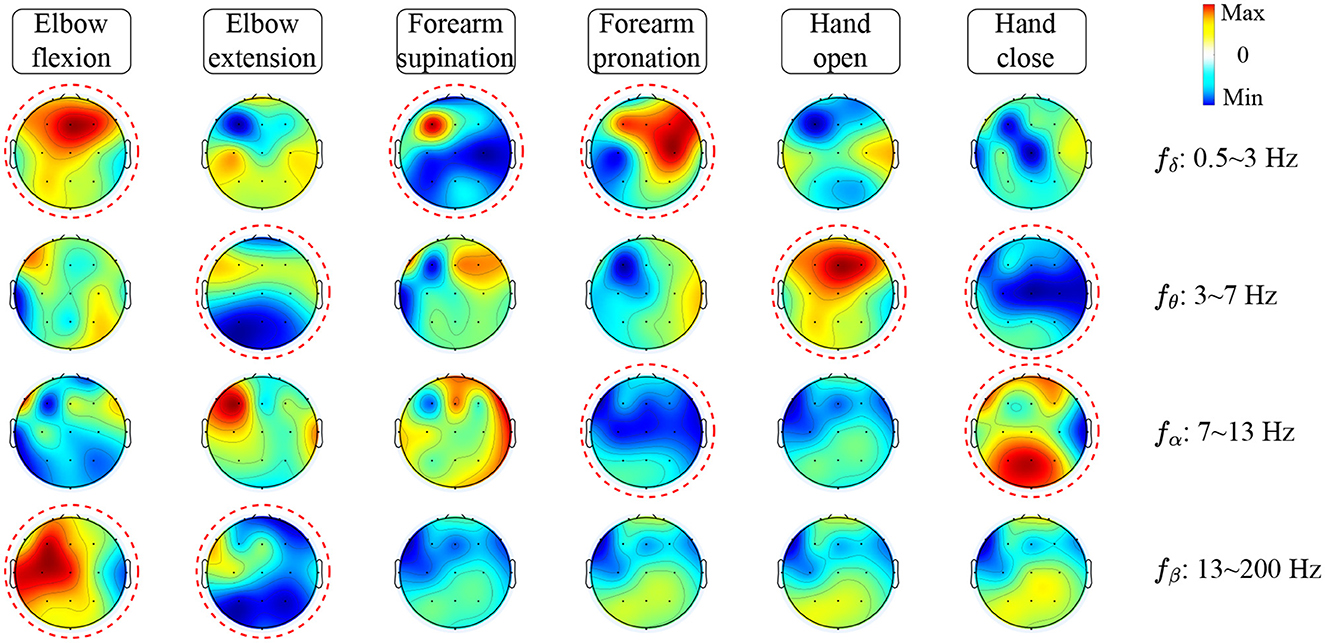
Figure 9. Feature visualization based on signal occlusion frequency.
3.5.3 Feature visualization before and after TSPFE
To elucidate the pivotal role of the TSPFE module in TSPNet, we present the transformation of feature maps before and after the TSPFE module into scalp topography maps in Figure 10. It can be observed that the features after the TSPFE module are more pronounced compared to those before the TSPFE. This is attributed to the fact that TSPFE module further extracts concurrent temporal and spatial features. The features before TSPFE undergo only time dimension feature extraction from the TDFE module and spatial feature extraction from the SDFE module. Combining the results of ablation experiments in Table 2, the absence of the TSPFE module results in a 24.3% accuracy decrease for TSPNet-w/o-TSPFE compared to TSPNet, while TSPNet-w/o-TDFE and TSPNet-w/o-SDFE experience decreases of 22.3 and 22.5%, respectively. This underscores the critical importance of TSPFE in TSPNet.
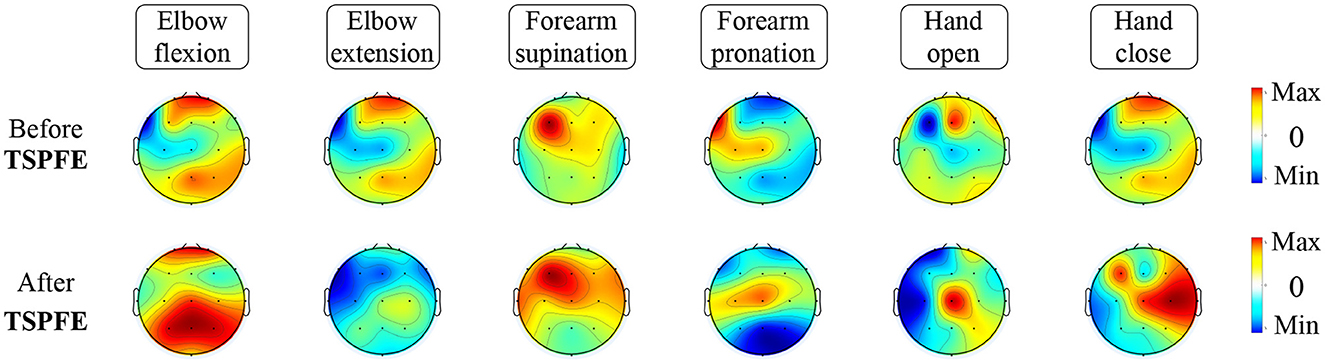
Figure 10. Feature visualization before and after TSPFE.
4 Discussion
In this work, we introduced TSPNet, a convolutional neural network classification model for motor imagery brain-computer interfaces. It enables the classification of six classes of upper limb movements based on motor imagery EEG signals. Our work provides a detailed explanation of its three constituent structures, TDFE, SDFE, and TSPFE. We conducted classification experiments on TSPNet using two datasets, comparing it with other deep learning methods [MSATNet (Hu et al., 2023), EEGSym (Perez-Velasco et al., 2022), DeepConvNet (Schirrmeister et al., 2017), EEGNet-8,2 (Lawhern et al., 2018)]. The experimental results demonstrate that our proposed TSPNet outperforms the compared methods in terms of classification accuracy. Additionally, results from the two-sample t-test indicate a significant difference in accuracy between TSPNet and the compared methods. Feature visualization results, as shown in Figure 10, suggest that the TSPFE module plays a crucial role in TSPNet. Before TSPFE, the TSFE module only convolves to extract time dimension features, while the SDFE module only convolves to extract spatial dimension features. TSPFE decouples the connection between time and spatial features, reducing feature redundancy. It utilizes a gating mechanism to optimize weight distribution, ultimately parallelizing time and spatial features. Furthermore, the proposed feature visualization algorithm based on signal occlusion frequency, qualitatively analyzes TSPNet's performance (as depicted in Figure 9), showing its ability to generate different classifier patterns for various classes across different frequency bands.
Compared to EEGNet (Lawhern et al., 2018) and MSATNet (Hu et al., 2023), TSPNet utilizes a signal frequency range of 0.01–200 Hz. This range is significantly broader than the signal frequency ranges used by EEGNet (0.1–40 Hz) and MSATNet (0.5–100 Hz). The qualitative analysis results of TSPNet using the feature visualization algorithm based on signal occlusion frequency indicate that TSPNet can generate different classifier patterns within the range of 0.1–200 Hz across various frequency bands. Additionally, TSPNet's signal sampling frequency of 500 Hz surpasses the sampling frequencies of EEGNet (128 Hz) and MSATNet (250 Hz). A higher sampling frequency results in a greater number of sampled points and more EEG information within a unit of time. It's worth noting that the TSPNet method proposed in this article demonstrates a higher accuracy (49.7% vs. 44%) in the motor imagery on Dataset II compared to the experimental results of Ofner et al. (2017) in movement execution. This difference can be attributed to several factors. Firstly, Ofner et al. utilized low-frequency signals (0.3–3 Hz), and the signal sampling frequency was 256 Hz, which is lower than the 500 Hz used in this paper. Secondly, and importantly, Ofner et al. employed a traditional approach involving feature extraction combined with machine learning classification patterns. The classification performance was highly dependent on the performance of the feature extraction algorithm. In contrast, TSPNet is an end-to-end deep learning model based on convolutional neural networks, where feature extraction and classification interact throughout the entire training process with shared weights, providing a distinct advantage in multi-class tasks.
In terms of limitations, despite the superior performance of the proposed TSPNet compared to other methods used in this paper, the accuracy in the six-class motor imagery task remains relatively low. Under the current research results, it is insufficient to generate precise and error-free control signals for the motion control of neural prosthetics or robotic arms. Several factors contribute to this limitation. Firstly, the intrinsic complexity and variability of EEG signals make achieving high decoding accuracy challenging. Secondly, EEG signals are generated by electrical potentials from different regions of the brain but are measured through electrodes placed on the scalp. Due to the conductivity and geometric properties of the head tissues, the recorded signals are spatially ambiguous and cannot accurately represent the potential neural sources. To address the current limitation of low classification accuracy, in future research, we will explore the integration of transfer learning into the classification of motor imagery EEG signals to enhance the performance of the classification model. Simultaneously, we will develop a continuous decoding strategy to further improve the classification accuracy of motor imagery tasks through multiple consecutive decoding steps.
5 Conclusion
In this article, the TSPNet is proposed to achieve intention recognition for multiclass upper limb motor imagery. Ablation studies demonstrate the necessity of each module in the proposed TSPNet. Our proposed TSPNet achieved a classification accuracy of 49.1% ± 0.043 in Dataset I and 49.7% ± 0.029 in Dataset II for 6 categories of upper limb motor imagery EEG signals. Comparison results with other deep learning methods demonstrate the superior performance of the TSPNet model. Subsequently, we introduce a feature visualization algorithm based on signal occlusion frequency to qualitatively analyze TSPNet. These visualization results demonstrate that the proposed TSPNet is capable of generating distinct classifier patterns for various upper limb motor imagery categories across different frequency bands in EEG signals. The results show that the proposed TSPNet can achieve intention recognition for multiple category upper limb motor imagery, which is of special significance in non-invasive BCI applications and provides the possibility to increase the degrees of freedom for devices controlled by BCI, such as robots, manipulators, or nerve rehabilitation devices.
Data availability statement
The datasets presented in this study can be found in online repositories. The names of the repository/repositories and accession number(s) can be found at: https://dx.doi.org/10.21227/8qw6-f578.
Author contributions
JB: Data curation, Methodology, Validation, Visualization, Writing—original draft. MC: Conceptualization, Project administration, Supervision, Writing—review & editing. GW: Data curation, Formal analysis, Writing—review & editing. XG: Data curation, Formal analysis, Writing—review & editing.
Funding
The author(s) declare financial support was received for the research, authorship, and/or publication of this article. This work was supported in part by the Beijing Municipal Natural Science Foundation (Grant No. 3202021) and in part by the National Natural Science Foundation of China (Grant No. 51875046).
Conflict of interest
The authors declare that the research was conducted in the absence of any commercial or financial relationships that could be construed as a potential conflict of interest.
Publisher's note
All claims expressed in this article are solely those of the authors and do not necessarily represent those of their affiliated organizations, or those of the publisher, the editors and the reviewers. Any product that may be evaluated in this article, or claim that may be made by its manufacturer, is not guaranteed or endorsed by the publisher.
References
Aghaei, A. S., Mahanta, M. S., and Plataniotis, K. N. (2016). Separable common spatio-spectral patterns for motor imagery BCI systems. IEEE Trans. Biomed. Eng. 63(1, SI), 15–29. doi: 10.1109/TBME.2015.2487738
Ang, K. K., and Guan, C. (2015). Brain-computer interface for neurorehabilitation of upper limb after stroke. Proc. IEEE 103(6, SI), 944–953. doi: 10.1109/JPROC.2015.2415800
Ang, K. K., and Guan, C. (2017). EEG-based strategies to detect motor imagery for control and rehabilitation. IEEE Trans. Neural Syst. Rehabil. Eng. 25, 392–401. doi: 10.1109/TNSRE.2016.2646763
Autthasan, P., Du, X., Arnin, J., Lamyai, S., Perera, M., Itthipuripat, S., et al. (2020). A single-channel consumer-grade EEG device for brain-computer interface: enhancing detection of SSVEP and its amplitude modulation. IEEE Sens. J. 20, 3366–3378. doi: 10.1109/JSEN.2019.2958210
Barachant, A., Bonnet, S., Congedo, M., and Jutten, C. (2012). Multiclass brain-computer interface classification by Riemannian geometry. IEEE Trans. Biomed. Eng. 59, 920–928. doi: 10.1109/TBME.2011.2172210
Cecotti, H., and Graeser, A. (2011). Convolutional neural networks for P300 detection with application to brain-computer interfaces. IEEE Trans. Pattern Anal. Mach. Intell. 33, 433–445. doi: 10.1109/TPAMI.2010.125
Chailloux Peguero, J. D., Hernandez-Rojas, L. G., Mendoza-Montoya, O., Caraza, R., and Antelis, J. M. (2023). SSVEP detection assessment by combining visual stimuli paradigms and no-training detection methods. Front. Neurosci. 17, 1142892. doi: 10.3389/fnins.2023.1142892
Chaisaen, R., Autthasan, P., Mingchinda, N., Leelaarporn, P., Kunaseth, N., Tammajarung, S., et al. (2020). Decoding EEG rhythms during action observation, motor imagery, and execution for standing and sitting. IEEE Sens. J. 20, 13776–13786. doi: 10.1109/JSEN.2020.3005968
Chaudhary, U., Birbaumer, N., and Ramos-Murguialday, A. (2016). Brain-computer interfaces for communication and rehabilitation. Nat. Rev. Neurol. 12, 513–525. doi: 10.1038/nrneurol.2016.113
Chen, C., Li, Z., Wan, F., Xu, L., Bezerianos, A., Wang, H., et al. (2022). Fusing frequency-domain features and brain connectivity features for cross-subject emotion recognition. IEEE Trans. Instrum. Meas. 71, 1–15. doi: 10.1109/TIM.2022.3168927
Duan, F., Jia, H., Sun, Z., Zhang, K., Dai, Y., Zhang, Y., et al. (2021). Decoding premovement patterns with task-related component analysis. Cogn. Comput. 13, 1389–1405. doi: 10.1007/s12559-021-09941-7
Edelman, B. J., Baxter, B., and He, B. (2016). EEG source imaging enhances the decoding of complex right-hand motor imagery tasks. IEEE Trans. Biomed. Eng. 63(1, SI), 4–14. doi: 10.1109/TBME.2015.2467312
Fan, C., Yang, B., Li, X., and Zan, P. (2023). Temporal-frequency-phase feature classification using 3D-convolutional neural networks for motor imagery and movement. Front. Neurosci. 17, 1250991. doi: 10.3389/fnins.2023.1250991
Foong, R., Ang, K. K., Quek, C., Guan, C., Phua, K. S., Kuah, C. W. K., et al. (2020). Assessment of the efficacy of EEG-based MI-BCI with visual feedback and EEG correlates of mental fatigue for upper-limb stroke rehabilitation. IEEE Trans. Biomed. Eng. 67, 786–795. doi: 10.1109/TBME.2019.2921198
Garcia-Martinez, B., Martinez-Rodrigo, A., Alcaraz, R., and Fernandez-Caballero, A. (2021). A review on nonlinear methods using electroencephalographic recordings for emotion recognition. IEEE Trans. Affect. Comput. 12, 801–820. doi: 10.1109/TAFFC.2018.2890636
Gaur, P., Gupta, H., Chowdhury, A., McCreadie, K., Pachori, R. B., Wang, H., et al. (2021). A sliding window common spatial pattern for enhancing motor imagery classification in EEG-BCI. IEEE Trans. Instrum. Meas. 70, 1–9. doi: 10.1109/TIM.2021.3051996
Hajinoroozi, M., Mao, Z., Jung, T.-P., Lin, C.-T., and Huang, Y. (2016). EEG-based prediction of driver's cognitive performance by deep convolutional neural network. Signal Process. Image Commun. 47(SI), 549–555. doi: 10.1016/j.image.2016.05.018
He, L., Hu, D., Wan, M., Wen, Y., von Deneen, K. M., Zhou, M., et al. (2016). Common Bayesian network for classification of EEG-based multiclass motor imagery BCI. IEEE Trans. Syst. Man Cybern. Syst. 46, 843–854. doi: 10.1109/TSMC.2015.2450680
Higashi, H., and Tanaka, T. (2013). Simultaneous design of FIR filter banks and spatial patterns for EEG signal classification. IEEE Trans. Biomed. Eng. 60, 1100–1110. doi: 10.1109/TBME.2012.2215960
Hu, L., Hong, W., and Liu, L. (2023). MSATNet: multi-scale adaptive transformer network for motor imagery classification. Front. Neurosci. 17, 1173778. doi: 10.3389/fnins.2023.1173778
Iacoviello, D., Petracca, A., Spezialetti, M., and Placidi, G. (2016). A classification algorithm for electroencephalography signals by self-induced emotional stimuli. IEEE Trans. Cybern. 46, 3171–3180. doi: 10.1109/TCYB.2015.2498974
Jeong, J.-H., Kwak, N.-S., Guan, C., and Lee, S.-W. (2020). Decoding movement-related cortical potentials based on subject-dependent and section-wise spectral filtering. IEEE Trans. Neural Syst. Rehabil. Eng. 28, 687–698. doi: 10.1109/TNSRE.2020.2966826
Jia, H., Feng, F., Caiafa, C. F., Duan, F., Zhang, Y., Sun, Z., et al. (2023). Multi-class classification of upper limb movements with filter bank task-related component analysis. IEEE J. Biomed. Health Inform. 27, 3867–3877. doi: 10.1109/JBHI.2023.3278747
Jia, H., Sun, Z., Duan, F., Zhang, Y., Caiafa, C. F., Sole-Casals, J., et al. (2022). Improving pre-movement pattern detection with filter bank selection. J. Neural Eng. 19, 066012. doi: 10.1088/1741-2552/ac9e75
Jiao, Y., Zhang, Y., Chen, X., Yin, E., Jin, J., Wang, X., et al. (2019). Sparse group representation model for motor imagery EEG classification. IEEE J. Biomed. Health Inform. 23, 631–641. doi: 10.1109/JBHI.2018.2832538
Jin, J., Miao, Y., Daly, I., Zuo, C., Hu, D., Cichocki, A., et al. (2019). Correlation-based channel selection and regularized feature optimization for MI-based BCI. Neural Netw. 118, 262–270. doi: 10.1016/j.neunet.2019.07.008
Jin, Z., Zhou, G., Gao, D., and Zhang, Y. (2020). EEG classification using sparse Bayesian extreme learning machine for brain-computer interface. Neural Comput. Appl. 32(11, SI), 6601–6609. doi: 10.1007/s00521-018-3735-3
Kingma, D. P., and Ba, J. L. (2015). “Adam: a method for stochastic optimization,” in Proc. 3rd Int. Conf. Learn. Represent. (San Diego, CA), 1–15.
Kwak, N.-S., and Lee, S.-W. (2020). Error correction regression framework for enhancing the decoding accuracies of Ear-EEG brain-computer interfaces. IEEE Trans. Cybern. 50, 3654–3667. doi: 10.1109/TCYB.2019.2924237
Lawhern, V. J., Solon, A. J., Waytowich, N. R., Gordon, S. M., Hung, C. P., Lance, B. J., et al. (2018). EEGNet: a compact convolutional neural network for EEG-based brain-computer interfaces. J. Neural Eng. 15, 056013. doi: 10.1088/1741-2552/aace8c
Leeb, R., Tonin, L., Rohm, M., Desideri, L., Carlson, T., Millan, J. d. R., et al. (2015). Towards independence: a BCI telepresence robot for people with severemotor disabilities. Proc. IEEE 103(6, SI), 969–982. doi: 10.1109/JPROC.2015.2419736
Li, S., Jin, J., Daly, I., Zuo, C., Wang, X., Cichocki, A., et al. (2020). Comparison of the ERP-based BCI performance among chromatic (RGB) semitransparent face patterns. Front. Neurosci. 14, 54. doi: 10.3389/fnins.2020.00054
Ma, Y., Wu, X., Zheng, L., Lian, P., Xiao, Y., Yi, Z., et al. (2022). Iterative outlier removal clustering based time-frequency-spatial feature selection for binary EEG motor imagery decoding. IEEE Trans. Instrum. Meas. 71, 1–14. doi: 10.1109/TIM.2022.3193407
Ofner, P., Schwarz, A., Pereira, J., and Mueller-Putz, G. R. (2017). Upper limb movements can be decoded from the time-domain of low-frequency EEG. PLoS ONE 12, e0182578. doi: 10.1371/journal.pone.0182578
Pascual-Marqui, R. D., Michel, C. M., and Lehmann, D. (1994). Low resolution electromagnetic tomography: a new method for localizing electrical activity in the brain. Int. J. Psychophysiol. 18, 49–65. doi: 10.1016/0167-8760(84)90014-X
Perez-Velasco, S., Santamaria-Vazquez, E., Martinez-Cagigal, V., Marcos-Martinez, D., and Hornero, R. (2022). EEGSym: overcoming inter-subject variability in motor imagery based BCIs with deep learning. IEEE Trans. Neural Syst. Rehabil. Eng. 30, 1766–1775. doi: 10.1109/TNSRE.2022.3186442
Rivera-Flor, H., Gurve, D., Floriano, A., Delisle-Rodriguez, D., Mello, R., Bastos-Filho, T., et al. (2022). CCA-based compressive sensing for SSVEP-based brain-computer interfaces to command a robotic wheelchair. IEEE Trans. Instrum. Meas. 71, 1–10. doi: 10.1109/TIM.2022.3218102
Sakhavi, S., Guan, C., and Yan, S. (2018). Learning temporal information for brain-computer interface using convolutional neural networks. IEEE Trans. Neural Netw. Learn. Syst. 29, 5619–5629. doi: 10.1109/TNNLS.2018.2789927
Schirrmeister, R. T., Springenberg, J. T., Fiederer, L. D. J., Glasstetter, M., Eggensperger, K., Tangermann, M., et al. (2017). Deep learning with convolutional neural networks for EEG decoding and visualization. Hum. Brain Mapp. 38, 5391–5420. doi: 10.1002/hbm.23730
She, Q., Zhang, C., Fang, F., Ma, Y., and Zhang, Y. (2023). Multisource associate domain adaptation for cross-subject and cross-session EEG emotion recognition. IEEE Trans. Instrum. Meas. 72, 1–12. doi: 10.1109/TIM.2023.3277985
Siuly, S., and Li, Y. (2012). Improving the separability of motor imagery EEG signals using a cross correlation-based least square support vector machine for brain-computer interface. IEEE Trans. Neural Syst. Rehabil. Eng. 20, 526–538. doi: 10.1109/TNSRE.2012.2184838
Suk, H.-I., and Lee, S.-W. (2013). A novel Bayesian framework for discriminative feature extraction in brain-computer interfaces. IEEE Trans. Pattern Anal. Mach. Intell. 35, 286–299. doi: 10.1109/TPAMI.2012.69
Tabar, Y. R., and Halici, U. (2017). A novel deep learning approach for classification of EEG motor imagery signals. J. Neural. Eng. 14, 016003. doi: 10.1088/1741-2560/14/1/016003
Tadel, F., Baillet, S., Mosher, J. C., Pantazis, D., and Leahy, R. M. (2011). Brainstorm: a user-friendly application for MEG/EEG analysis. Comput. Intell. Neurosci. 2011, 879716. doi: 10.1155/2011/879716
Vuckovic, A., and Sepulveda, F. (2012). A two-stage four-class BCI based on imaginary movements of the left and the right wrist. Med. Eng. Phys. 34, 964–971. doi: 10.1016/j.medengphy.2011.11.001
Wang, B., Wong, C. M., Kang, Z., Liu, F., Shui, C., Wan, F., et al. (2021). Common spatial pattern reformulated for regularizations in brain-computer interfaces. IEEE Trans. Cybern. 51, 5008–5020. doi: 10.1109/TCYB.2020.2982901
Wang, P., Gong, P., Zhou, Y., Wen, X., and Zhang, D. (2023). Decoding the continuous motion imagery trajectories of upper limb skeleton points for EEG-based brain-computer interface. IEEE Trans. Instrum. Meas. 72, 1–12. doi: 10.1109/TIM.2022.3224991
Wu, X., Zhang, W., Fu, Z., Cheung, R. T. H., and Chan, R. H. M. (2020). An investigation of in-ear sensing for motor task classification. J. Neural Eng. 17, 066010. doi: 10.1088/1741-2552/abc1b6
Xu, R., Jiang, N., Lin, C., Mrachacz-Kersting, N., Dremstrup, K., Farina, D., et al. (2014). Enhanced low-latency detection of motor intention from EEG for closed-loop Brain-computer interface applications. IEEE Trans. Biomed. Eng. 61, 288–296. doi: 10.1109/TBME.2013.2294203
Yan, W., He, B., and Zhao, J. (2023). SSVEP unsupervised adaptive feature recognition method based on self-similarity of same-frequency signals. Front. Neurosci. 17, 1161511. doi: 10.3389/fnins.2023.1161511
Zhang, D., Yao, L., Chen, K., Wang, S., Chang, X., Liu, Y., et al. (2020). Making sense of spatio-temporal preserving representations for EEG-based human intention recognition. IEEE Trans. Cybern. 50, 3033–3044. doi: 10.1109/TCYB.2019.2905157
Zhang, R., Chen, Y., Xu, Z., Zhang, L., Hu, Y., Chen, M., et al. (2023). Recognition of single upper limb motor imagery tasks from EEG using multi-branch fusion convolutional neural network. Front. Neurosci. 17, 1129049. doi: 10.3389/fnins.2023.1129049
Zhang, Y., Li, Z., Xie, S. Q., Wang, H., Yu, Z., Zhang, Z.-Q., et al. (2022). Multi-objective optimization-based high-pass spatial filtering for SSVEP-based Brain-computer interfaces. IEEE Trans. Instrum. Meas. 71, 4000509. doi: 10.1109/TIM.2022.3146950
Zhang, Y., Nam, C. S., Zhou, G., Jin, J., Wang, X., Cichocki, A., et al. (2019). Temporally constrained sparse group spatial patterns for motor imagery BCI. IEEE Trans Cybern. 49, 3322–3332. doi: 10.1109/TCYB.2018.2841847
Keywords: brain-computer interface, deep learning, electroencephalogram, multi classification, motor imagery
Citation: Bi J, Chu M, Wang G and Gao X (2023) TSPNet: a time-spatial parallel network for classification of EEG-based multiclass upper limb motor imagery BCI. Front. Neurosci. 17:1303242. doi: 10.3389/fnins.2023.1303242
Received: 27 September 2023; Accepted: 28 November 2023;
Published: 15 December 2023.
Edited by:
Angarai Ganesan Ramakrishnan, Indian Institute of Technology Hyderabad, IndiaReviewed by:
Hao Jia, University of Vic–Central University of Catalonia, SpainJayavardhana Gubbi, TCS Research, India
Copyright © 2023 Bi, Chu, Wang and Gao. This is an open-access article distributed under the terms of the Creative Commons Attribution License (CC BY). The use, distribution or reproduction in other forums is permitted, provided the original author(s) and the copyright owner(s) are credited and that the original publication in this journal is cited, in accordance with accepted academic practice. No use, distribution or reproduction is permitted which does not comply with these terms.
*Correspondence: Ming Chu, Y2h1bWluZ19idXB0QGJ1cHQuZWR1LmNu