- Chair of Aerodynamics and Fluid Mechanics, Technical University of Munich, Munich, Germany
The wide field of applications is the driving force behind the scientific interest in unmanned and micro air vehicles. For these aircraft, morphing wing technologies offer the possibility to adapt the aerodynamics to different flight stages. A morphing wing configuration with two elasto-flexible membrane wings is investigated numerically at a low Reynolds number of Re = 264000. The concept enables wing folding over a wide range and it allows the wing to adapt to changing aerodynamic loads. The focus is set on the benefits of the membrane in the high lift regime. Therefore, fluid-structure-interaction simulations are performed for the model equipped with a flexible and with a rigid wing. The comparison of the numerical results to data from previous experimental measurements show a good agreement. Compared with the rigid wing, the elasto-flexible membrane increases the gradient in the linear region and the maximum lift coefficient. In addition, the maximum lift coefficient is shifted to higher angles of attack. For selected wing positions and angles of attack, the aerodynamic behavior of the flexible and the rigid wing are investigated by means of the lift coefficient, the deformation of the membrane, the wall shear stresses and the wing surface pressure distribution. The deformation of the wing surface directly influences the area of flow separation at the extended wing and the separating leading-edge vortex at the folded wing. Both effects increase the generated lift of the wing with a flexible membrane.
1 Introduction
The growing interest in small-scale drones for the use in a wide range of different missions continues to spur scientific interest into novel aerodynamic design solutions for low-speed flows, inspired by natural fliers (Hassanalian and Abdelkefi, 2017). The field of application for those aircraft comprises search and rescue, environment protection, mailing and delivery, traffic and news coverage, or space exploration. In detail, drones can help mapping the extent of chemical and radiation spills or viral outbreaks (Waszak et al., 2001). They can be utilized in various situations where the presence of humans is difficult, impossible, or dangerous.
The mission scenarios often consist of very different segments with varying flight conditions. Thus, the need to operate a single aircraft in highly disparate parameter envelopes (i.e., dash/cruise, takeoff/landing, maneuver/loiter) throughout a single flight necessarily results in sub-optimal aircraft performance during different mission segments (Joshi et al., 2004). The different flight conditions lead to numerous design and construction requirements.
The morphing wing technology can help to address these problems. In a first approach, the aircraft shape is adapted for optimal performance at each flight stage. Computational and experimental studies have examined the aerodynamics of different concepts for shape-shifting. Ajaj and Jankee are testing a multi-mission unmanned aerial vehicle in the wind tunnel (W/T) which can extend the wingspan by up to 50% in a symmetrical way to increase the aerodynamic efficiency and in an asymmetrical way to perform roll control (Ajaj and Jankee, 2018). Oktay and Coban are using the same morphing technology for lateral and longitudinal flight control (Oktay and Coban, 2017). Pecora et al. have analyzed high aspect ratio wings with a roll control based on wing twist morphing by numerical investigations (Pecora et al., 2012). Cramer et al. are constructing a wing out of 3D lattice material structures, which can adapt its camber, twist and dihedral (Cramer et al., 2019). The benefits of shape-alteration are accompanied by the complicated technical realization concerning the structural design, actuators, materials and the flight controls. The aerodynamic improvements compete against the penalties by additional structures, increased weight and energy consumption (Moorhouse et al., 2006).
The second approach of morphing technologies is the use of deformable or elastic materials as lifting surfaces. A first feature is the superior stall characteristics, because the shape of the airfoil passively adapts to the inflow at high angles of attack. Guo et al. revealed a delayed stall and an increased lift for a W/T model with flexible membrane wings (Guo et al., 2021). Furthermore, small and lightweight vehicles like micro air vehicles are exposed to a turbulent flight environment, where flexible wing surfaces can reduce loads and improve the stability (Jenkins et al., 2011). Tiomkin and Raveh give an overview of recent developments in the understanding of membrane wing aeroelasticity (Tiomkin and Raveh, 2021). Song et al. (Song et al., 2008) analyzed membrane wings of varying aspect ratio, compliancy, and pre-stress values. The passively deflecting camber of the wing was measured by static and dynamic deformations measurements. He et al. deal with the changing camber of a two-dimensional membrane wing (He et al., 2019), at which they examine the fluid-structure-interaction.
Natural examples for the use of active and passive morphing are bats that are still alive or pterosaurs that are now extinct. Their wings consist of a thin, elastic skin membrane that is spanned by a bony skeleton. The flight mechanics of bats were analyzed e.g., by Breuer et al. (Breuer et al., 2012), Hedenström and Johansson, (Hedenström and Johansson, 2015), and Waldman et al. (Waldman et al., 2012). The dynamic complexity of bat airfoil geometry is enormous, and is characterized by varying planform, time- and span-varying camber, and high levels of wing bending and twist. They change their wing planform and airfoil to perform various flight maneuvers. Swartz et al. (Swartz et al., 2007) investigated the highly complex wing structure of bat wings and revealed quite flexible bones supporting very compliant and anisotropic wing membranes. Another natural example are the pterosaurs studied by Wilkinson (Wilkinson, 2007). Their wings are constructed similarly to those of bats. Figure 1 shows a simplified sketch of the typical morphology of the wing of a large pterosaur. The wing comprises a thin soft tissue membrane (patagium) attached to the body and hind limbs and supported by the bones of the forelimb. Between the shoulder and the wrist the membrane extends from both the anterior and posterior sides of the wing bones. Beyond the wrist the patagium is only present on the posterior side of the wing bones, and is attached to the fourth metacarpal and four hyper-elongated wing phalanges. It has no other bony tissue support, unlike bats, where the wing fingers extend posteriorly (Palmer, 2018). Some unearthed specimens suggest that they sometimes had wingspans of over 10 m (Naish et al., 2021).
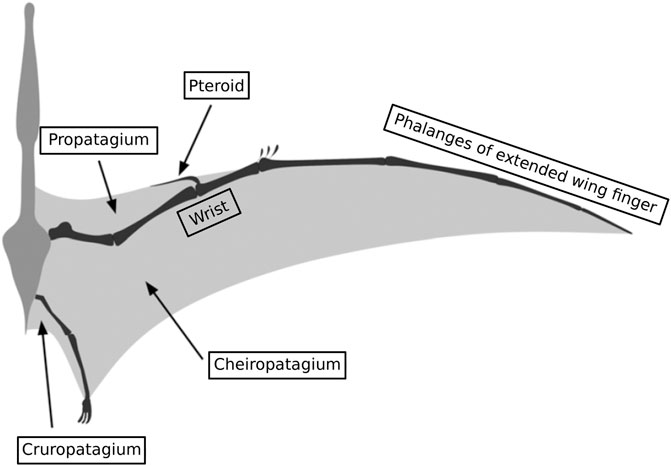
FIGURE 1. Simplified sketch showing the typical morphology of the wing of a large pterosaur, based on reconstructions by (Bennett, 2001) and (Wilkinson, 2007) and the illustration by (Palmer, 2018).
Concepts are often investigated using a single morphing technology. In contrast, this project investigates a combination of two methods using an active folding of the wing and a passive adaptation of the wing surface, as in natural flyers, to enhance the flight envelope of small aircraft. The investigated morphing wing is part of a common research project with the Beihang University (He et al., 2019; Guo et al., 2021). Both project partners investigate morphing W/T models in their facilities. The overall scientific aim is the extension and deepening of the understanding of concepts for morphing aircraft. The concept for the elasto-flexible morphing wing at the Technical University of Munich (TUM) was originally developed by Beguin (Béguin, 2014).
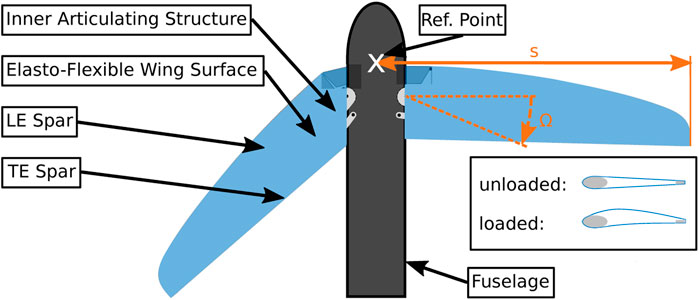
In contrast to the natural examples the degrees of freedom of the artificial membrane wing model are strongly reduced. The morphing wing model can only fold and unfold the wings and its wing surface can passively adapt to the inflow. Figure 2 shows the concept of the investigated morphing wing. The folding angle Ω defines the position of the leading-edge (LE) spar and thus the shape of the wing. So the wing half span s, the aspect ratio AR and the quarter line sweep angle Φ(1/4) can actively be changed. The wings are actuated individually, which enables asymmetric wing positions. The elastic membrane serves as the actual aerodynamic surface and guarantees a smooth and continuous wing surface during the inclination of the wings.
Furthermore, the elasticity of the membrane allows the airfoil to passively adapt to aerodynamic loads. This mechanism changes primarily the camber and the thickness of the airfoil as shown in (Pflüger et al., 2021). The membrane is mounted with a certain pre-stress, which is calculated in the mechanical-pre-stress module, shown in Section 3.2. For a similar morphing wing model, the influence of the pre-stress at different flow velocities and wing positions was already experimentally investigated in detail by Beguin and Breitsamter (Béguin and Breitsamter, 2014).
The membrane wing was already experimentally investigated in detail by force and moment, flow field and deformation measurements. The results indicate among others an improvement of the maximum lift-to-drag ratio with an increasing aspect ratio and a smooth stall behavior at high angles of attack. In addition, the asymmetric wing configurations deliver significant rolling moments, which can be used for an active control of the aircraft. Depending on the current flight stage the morphing wing model can for example deliver more aerodynamic efficiency for cruise or a better controllability for maneuvers. This article now investigates the efficacy of the flexible membrane at high lift conditions.
2 The elasto-flexible morphing wing model
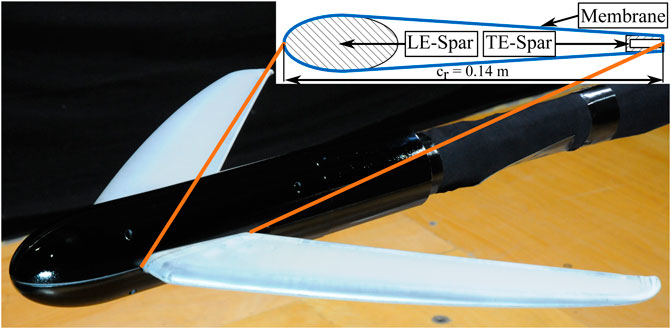
The two wings of the W/T model are equipped with an elasto-flexible membrane which represents the aerodynamic wing surface. Both wings are individually foldable and provide an aspect ratio of 5 ≤ AR ≤ 10 and a quarter-chord sweep angle of 5° ≤ Φ(1/4) ≤ 45°. Two stepper motors actuate the folding mechanisms inside the wings which then move the LE spars. The folding angle Ω in Figure 2 determines the position of the wing. Figure 3 shows the model mounted on a three-axis support in the W/T test section. The schematic cross section of the wing with its components, including the spanned membrane in blue, is illustrated in the upper right corner. The wing mainly consists of an elliptical LE spar, which controls the planform of the wing, and an rectangular trailing-edge (TE) spar. The actuated LE spar has an elliptical planform and tapers in spanwise direction. The TE spar is straight, because its length must adapt to the current wing position in order to provide a rigid closed frame to stretch the membrane.
The material of the membrane is an elasto-flexible commercial polyurethane (PU) foil provided by the PU-manufacturer Pharetra (Pharetra Textile Kunststoffanwendung GmbH & Co. KG). The membrane has a thickness of texp = 0.065 mm and an isotropic stiffness with a Young’s modulus of about Eexp ≈ 10 MPa. The high elasticity produces a measurable surface deformation by the expected aerodynamic loads. The membrane is welded along the LE, pulled over the wing and fixed under the fuselage cover by a wire. The pre-stress of the membrane strongly influences the deformation of the wing surfaces and is adjusted by shifting the attachment of the TE at the fuselage in axial direction. For the simulations within this paper, the wing root chord is fixed to cr = 0.14 m.
3 Numerical methods
The numerical model is simplified compared to the W/T model at the TE, the wing tip and the intersection between wing and fuselage. In addition, the rear sting support, which holds the model in the W/T, is neglected. Overall 21 cases are simulated: Seven angles of attack for each of the three different configurations, namely the high aspect ratio configuration (HAC) (Ω = 23°), the intermediate configuration (INT) (Ω = 43°) and the highly swept configuration (HSC) (Ω = 63°).
A sufficient dynamic pressure must be provided for a reasonably measurable deflection of the membrane. Therefore, the flow velocity is set to U∞ = 30 m/s. The largest possible wing half span in the test section and the required aspect ratio lead to a chord length of 0.14 m. This results in a Reynolds number of Re∞ = 264000.
3.1 FSI setup
The two-way fluid-structure-interaction (FSI) simulations are performed with the ANSYS System-Coupling (SC) Toolbox (ANSYS, 2021). ANSYS Mechanical solves the structural mechanics part, while ANSYS Fluent solves the fluid mechanics part. The SC setup consists of the pre-stress-mechanical, the FSI-mechanical and the FSI-fluid module. The SC toolbox manages the execution of the FSI-modules and controls the data transfer between their interfaces. The membranes on the upper and the lower side of the wing are defined as SC interfaces. The FSI-fluid module provides forces, which are acting on the membrane surface, while the FSI-mechanical module returns the resulting displacements. For the SC simulations, a maximum of five system coupling iterations per time step is set. The simulations run on 224 cores at the Linux-Cluster of the Leibnitz Rechenzentrum (Leibniz-Rechenzentrumn, 2021). The much larger fluid mesh runs on 214 cores and the mechanical solver runs on 10 cores. The two consecutive simulations of 140 timesteps last about 18 h, depending on the angle of attack.
3.2 Mechanical solver setup
Figure 4 shows the structural mesh which comprises 25000 for the underlying support structure and 10000 elements for the membranes. The mesh is subdivided into the LE-spar, the TE-spar and the upper and the lower membrane. All wing spars must be modeled as 3D flexible bodies, even though they are not deforming in the FSI simulations. The volume elements are created to consume as little resources as possible, for instances by using linear elements and a low internal resolution. The surface mesh of the spars is matching to the mesh of the membranes to ensure an accurate contact detection and calculation. The membranes are modeled by rectangular shell elements with a thickness of only one element. At the wing root, the elements have a size of 3 mm × 5 mm (streamwise × spanwise) which roughly corresponds to the fluid surface mesh. The streamwise size of the elements decreases in spanwise direction due to the tapered wing. The big challenge is to design a mesh suitable for the pre-stress and the FSI-module. In particular, the pre-stress-module is prone to numerical instabilities as the mesh is deformed unevenly and more extreme than in the FSI-module. In general, the higher the wing is swept, the more unstable the pre-stress simulations become. Increasing the size of the elements around the intersection of the membrane and fuselage improves the numerical stability of the mesh, since the elements at the wing root boundary are constrained in their movement and stretched the most considering the applied rotation around the wing tip. In addition, the size of the elements is reduced at the LE to resolve the local curvature.
The LE spar is always hold in position, while the TE spar is actively moved during the pre-stress calculations, but it is locked in position during the FSI simulations. The membrane is spanned over both spars by fixations at the apex of the LE and at the rear side of the TE. Between the membrane and the surfaces of the LE and TE spars, a frictionless contact condition is applied. At last, the membrane is held in spanwise direction at the wing tip and root. The initial numerical membrane cut is larger than the underlying structure, in order that the contact conditions between membrane and spars are setup correctly. During the pre-stress simulations, the membrane first wraps itself around the spars before being stretched further.
For the analysis settings, a sparse direct equation solver with nonlinear effects is chosen. Weak springs are deactivated and large deflections are activated. The energy dissipation ratio is set to 0.0001 and to shorten the calculation time, unnecessary nonlinear computations are deactivated for LE and TE spars. Thermal stress considerations are neglected for the membrane as well as for the structure. The spars are defined as steel, while the material of the membrane is designed to represent the PU foil of the W/T model. No converged simulations could be achieved with the membrane thickness of the experiments texp = 0.065 mm. Therefore, for all presented simulations, the thickness is set to tsim = 1 mm. This adaptation is balanced by an adjustment of the initial Young’s modulus Esim via a ratio of the thicknesses t and the mean stresses σmean as shown in the following equation:
This assumption is a strong simplification, thus two test simulations with the 2D planform of the LE, the TE and the membrane are performed with a test-pressure, one with the original properties, the second with the adapted properties. The deformation at both cases completely agree. The Young’s modulus controls the global pre-stress of the membrane. The local distribution between wing root and wing tip is defined by the backward translation and rotation of the TE which also ensure that the membrane always touches the surfaces of the spars. The rotation angle and the translation distance for all three configurations are [1 °, 1.02 °, 0 °] and [10 mm, 9 mm, 12 mm], respectively. The isotropic Young’s modulus of the membrane is adjusted by an extensive parameter study, so that the calculated membrane deformation matches the deformation measured during the W/T tests at an angle of attack of α = 10°. The Young’s modulus is set to Esim = 0.675 MPa for all three configurations, which corresponds to an experimental value of Eexp ≈ 10 MPa. The pre-stress is adjusted for each configuration individually, but held constant over all angles of attack. During the pre-stress calculations, the time step is set to Δt = 0.2 s and the calculation time to 1 s. The pre-stress-mechanical module provides the initial stresses and the deformed geometry that are used as inputs for the FSI-mechanical module.
3.3 Fluid solver setup
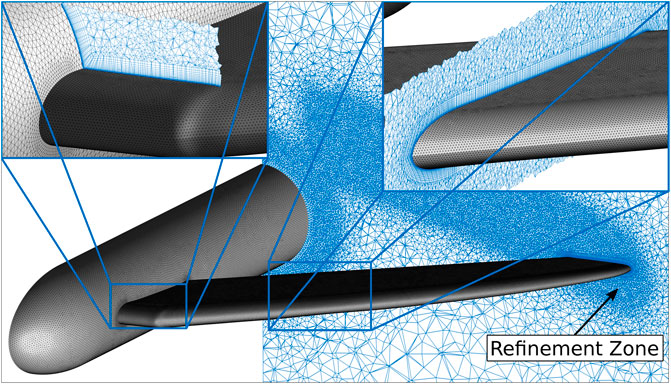
The deformed membrane of the pre-stress-mechanical module is considered for the geometry of the fluid domain. The grid generation is performed with the ANSYS Fluent Mesher. The grid size of the half model is depending on the folding angle and the angle of attack and consists of approximately 14–22 million cells. About 10 million cells are located in the refinement zone in the wake behind the wing, see Figure 5. A detailed mesh convergence study was carried out in two previous student theses, which results in the current grids. Two refinement zones around the LE and TE are limiting the maximum element size of the surface mesh to 1 mm. On the tip the maximum is set to 0.5 mm and on the rest of the wing to 1.5 mm. For y+ < 1, the initial layer height is set to Δn = 0.01 mm and the number of prism-layers to 25. The maximum element size is limited to 2.5 mm in the refinement zone, which is designed to cover the wake of the wing until 1.5 cr behind the wing tip. To allow the deformation of the membrane, a dynamic mesh with only diffusion based smoothing is used for the fluid domain. The diffusion coefficient is set to 3.
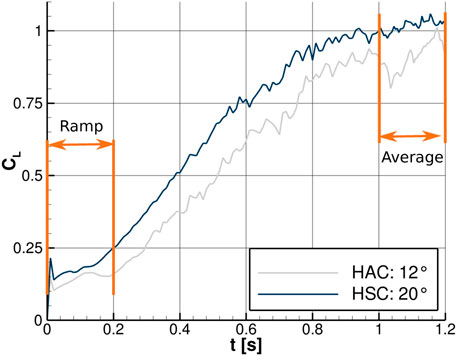
The dimensions of the fluid domain are depending on the wing half span of the extended wing s = 0.609 mm and are set to 13 s × 4 s × 12 s (length × width × height). Depending on the angle of attack, the rectangular fluid domain is rotated in relation to the model such that the inflow is always perpendicular to the inlet. The advantage is that the structural mesh stays always on the same position, so one pre-stress simulation can be used for all angles of attack. The inlet is set to pressure-inlet, the symmetry plane to symmetry and the outlet to pressure-outlet. The wall, the upper and the lower farfield are defined as free slip-walls. The membrane, the tip and the fairing are specified as no-slip walls. To avoid critical loads on the membrane in the mechanical module a pressure ramp over tRamp = 0.2 s is applied at the inlet. The fluid domain is initialized with U∞ = 10 m/s, then the corresponding gauge pressure at the inlet rises leading to an operating velocity of U∞ = 30 m/s.
In ANSYS Fluent, the incompressible, unsteady Reynolds-averaged Navier-Stokes equations (URANS) are solved. A pressure-based solver with an active pressure-velocity coupling and a first order implicit transient formulation is chosen. After a study of different turbulence models like the Spalart-Allmaras model, a Reynolds Stress model, the k-ω -model and the Shear-Stress-Transport model (SST), the turbulence modeling by the latter shows the results that are closest to the experimental data. After 100 time steps with Δt = 0.01 s, another 40 time steps with Δt = 0.005 s are simulated. In order to demonstrate the convergence behavior, Figure 6 shows the lift coefficient of the HAC at α = 12° and of the HSC at α = 20° as a function of time. At those high angles of attack, no convergence is reached due to unsteady flow phenomena. Another 200 time steps were simulated for one configuration, but even then no convergence or homogeneous oscillations were achieved. Therefore, the coefficients and the flow field data are averaged over the last 0.2 s, which means 40 timesteps for the surface data and 5 timesteps for the fluid volume data.
4 Results and discussion
4.1 Validation of the numerical results by experimental data
Before the comparison of the aerodynamic and flow field data associated to the flexible and the rigid wing, the numerical results are validated by experimental measurements and the resulting differences are explained. Therefore, the lift coefficient of the FSI simulations with a flexible wing is compared to the results of force and moment measurements of the original W/T model (Pflüger and Breitsamter, 2020). The resulting forces are made dimensionless by the dynamic pressure and the wing surface area for the experiment, and the half wing surface area for the numerics, respectively. The experimental data is averaged over 5 s and the numerical one over the last 0.2 s. Figure 7 shows the lift coefficient as a function of the angle of attack α at Re∞ = 264000. Three configurations are investigated, where the solid lines represent the experimental measurements and the dashed lines the numerical simulations.
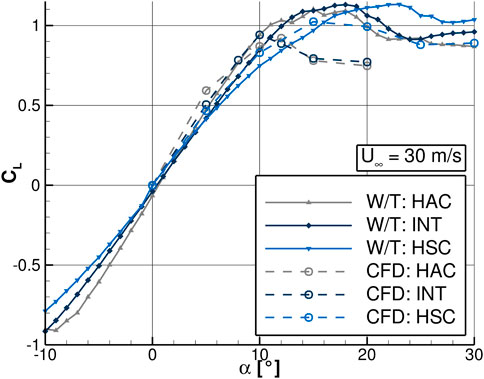
FIGURE 7. Effects of different wing positions on the lift coefficient CL as a function of the angle of attack α at Re∞ = 264000. Experimental data as solid lines, numerical data as dashed lines.
The experimental lift curves show a linear behavior for moderate angles of attack and a flattened region for high angles of attack. The gradient of the linear region increases with higher aspect ratios. All experimental configurations indicate a smooth stall behavior, while the maximum CL is shifted to higher α for the highly swept wings. Concerning the HSC, the lift coefficient increases up to an angle of attack of α = 24°. The results of the numerical simulations agree with the experiments in the linear region, but slightly overestimate the gradient. In the high lift regime, experiment and numerics differ more. On the one hand, the numerical simulations show smaller CL, max for all three configurations and on the other hand they indicate a more abrupt stall behavior especially for the more extended wings.
The most critical point is the correct prediction of the membrane deformation for all angles of attack. As explained in Section 3.2, the structural properties of the numerical membrane, mainly represented by Young’s modulus and pre-stress, are fitted to the experiment’s deformation at α = 10°. Previous investigations show that the more the angle of attack changes, the more the deformation of the experiment and the numerics differ which results in different airfoil cross sections. Different geometries directly influence the highly sensitive flow separation behavior of the wing. Therefore, a slightly different nose-section leads to different flow separation scenarios and thus to a different lift. The separation behavior was additionally analyzed by a comparison of the wake in the experiment and in the numerics. Simulations with different turbulence models, timestep sizes and finer meshes show that their effects on the aerodynamic coefficients of the wing are much smaller compared to the effects of the membrane structural properties discussed above.
4.2 Efficacy of an elasto-flexible morphing wing at high lift
The following section analyzes the benefits of an elasto-flexible wing compared to a rigid wing in the high lift regime. Therefore, the lift generation and the flow separation behavior are investigated by analysis of the lift coefficient, the deformation of the membrane, the wall shear stresses and the wing surface pressure coefficient distributions. The target is to understand the influence of the elasto-flexible membrane on the aerodynamic characteristics.
The structural model of the elasto-flexible membrane wing is explained in Section 3.2. For the rigid wing, CFD simulations of the pre-stressed geometry from the FSI-module are performed. The previous FSI interfaces are set to stationary wall but all other settings remain the same like for the FSI simulations. For both cases, the results are again averaged over the last 40 timesteps which represent the last 0.2 s.
4.2.1 Aerodynamic characteristics
The aerodynamic characteristics are analyzed by lift curves of all three configurations at a Reynolds number of Re = 264000. First, simulations are performed for α = [5°, 10°, 15°]. Because the advantages of flexible wings are of special interest in the stall and post-stall regime additional angles of attack are simulated. For the HAC and the INT, the range between α = 8° and α = 15° is resolved finer. For the HSC, the simulations are extended till α = 30°.
Figures 8A–C show the lift coefficient as a function of the angle of attack for the HAC, INT and HSC. For each configuration, the numerical results of the flexible wing are represented by dashed lines and the ones of the rigid wing by diamonds. For a better orientation, the W/T measurements are shown again by solid lines.

FIGURE 8. Lift coefficient CL of the W/T model, the flexible CFD model and the rigid CFD model as a function of the angle of attack α at Re∞ = 264000, (A) for the HAC, (B) for the INT, (C) for the HSC.
For all three configurations, the lift curves of the flexible wing show higher gradients then the ones of the rigid wing in the linear region. At the same inflow conditions, the flexible wing produces between 10 % and 20 % more lift for α = 5° and α = 10°. In addition, CL, max increases for all wing positions. At the HAC, Figure 8A, CL, max is reached for the rigid wing at α ≈ 10° and for the flexible wing at α ≈ 12°. At the INT, Figure 8B, the angle of attack with CL, max is approximately shifted from α = 10° to α = 11°. Both configurations show a distinct peak of the lift with a decrease thereafter. At α = 20°, the lift coefficient of the flexible and the rigid wing approach again. In Figure 8C, the HSC does not show a distinct peak for either the flexible or the rigid wing. The flexible wing achieves significantly higher lift values between α = 10° and α = 20°, then drops slightly and approaches the rigid wing at very large angles of attack.
Overall, for the elasto-flexible membrane both the gradient in the linear region and CL, max are increased. In addition, CL, max is shifted to higher angles of attack. In the next sections, the differences between the flexible and the rigid wing are explained based on selected configurations and angles of attack. The delayed stall and the higher CL, max of the HAC is investigated at α = 12° in Section 4.2.2. The higher lift level of the HSC at high angles of attack is analyzed at α = 20° in Section 4.2.3.
4.2.2 Delayed and increased maximum lift at the high aspect ratio configuration
The increased lift of the HAC with flexible wings is investigated at the critical angle of attack of α = 12°. Figure 9 shows the lift distribution in spanwise direction. The horizontal axis is made dimensionless by the respective wing half span. The HAC with flexible and rigid wings is represented by the grey, solid and dashed lines, respectively. The flexible wing produces significantly more lift in the mid section, therefore, the following analysis concentrates mainly on this area.
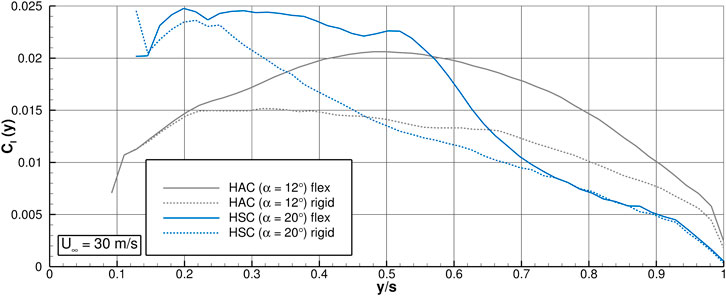
FIGURE 9. Lift distribution CL(y) in spanwise direction of the HAC at α = 12° and of the HSC at α = 20°. The solid lines represent the flexible and the dashed lines the rigid wing.
To identify areas on the model surface where the flow is likely to separate, the magnitude of the wall shear stress τw,mag is plotted on the upper side of the flexible wing in Figure 10A and of the rigid wing in Figure 10B. The axes refer to the wing half span of the HAC. Flow separation can be identified at points where τw,mag becomes zero. Consequently, areas with relatively low τw,mag are prone to flow separation. In addition, the figures depict the direction of the flow directly above the wing surface by skin-friction lines, which are distributed randomly.
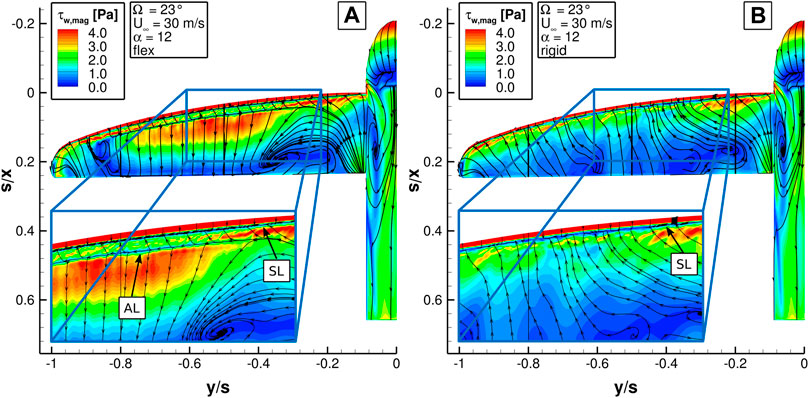
FIGURE 10. Wall shear stress magnitude τw,mag of the HAC at Re∞ = 264000 and α = 12° (A) with flexible and (B) with rigid wing.
From about a third of the wing root, the rigid wing in Figure 10B shows low wall shear stresses. Only close to the LE higher values indicate an attached flow. In addition, the skin-friction lines run from the TE towards a separation line (marked by SL in Figure 10B) close to the LE. Those characteristics indicate a flow separation close to the LE after about a third of the LE spar along most of the wingspan. The flexible wing in Figure 10A shows also low wall shear stresses in most of the rear part of the wing, but in the front half of the wing high wall shear stresses are visible between y/s = − 0.34 and y/s = − 0.76. In this area, the skin-friction lines show closely downstream of the separation line an attachment line (marked by SL and AL in Figure 10A). While at the rigid wing the flow separates almost immediately at the LE and along most of the wingspan, at the flexible wing the flow attaches again in the middle section of the wing.
Figure 11A shows the vertical deformation Δz of the upper membrane at the same inflow conditions. The HAC indicates the highest upward deflection in the middle section of the wing at the half wing root. The area of high deformation overlaps with the area of reattached flow in Figure 10A, which suggests that the upward deflection of the membrane results in the reattachment of the flow and thus reduces the area of separated flow.
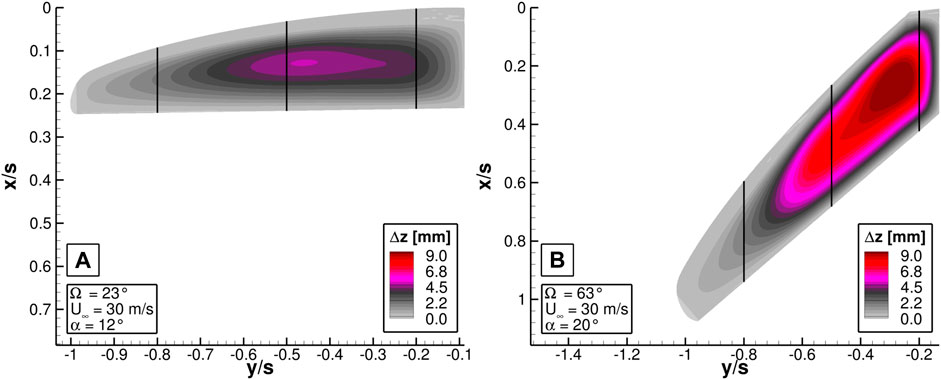
FIGURE 11. Deformation in vertical direction at Re∞ = 264000 (A) of the HAC at α = 12° and (B) of the HSC at α = 20°.
Figures 12A–C offers a more detailed view on the pressure distribution and the deformation of the membrane at three selected cross sections at y/s = [0.2, 0.5, 0.8]. The vertical and horizontal coordinates are made dimensionless by the local wing root. The position of the cross sections are also marked by the black lines in Figure 10 and Figure 11A. The upper plot shows the pressure coefficient cp and the lower plot the cross section of the wing including the membrane, the elliptical LE spar and the rectangular TE spar. The rigid wing is represented by black lines and the flexible by blue lines. The orange line represents the camber line and the orange cross the position of the maximum camber.
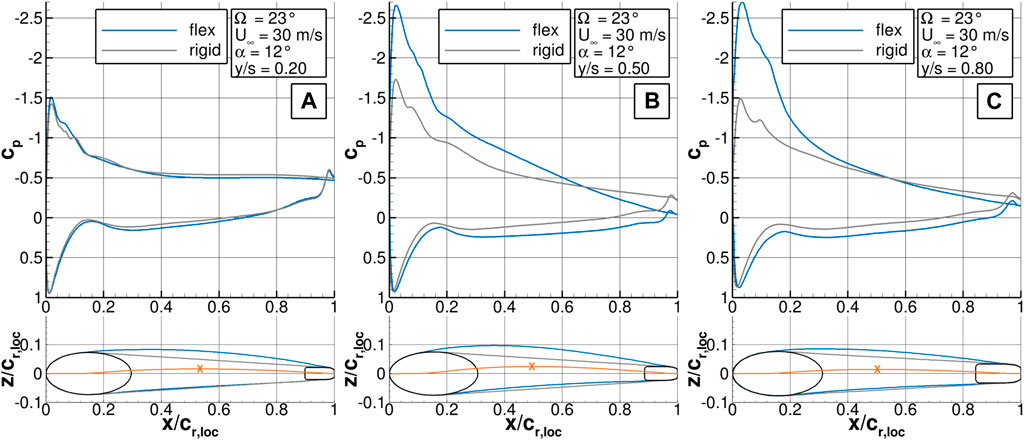
FIGURE 12. Pressure distribution along the airfoil for the HAC at α = 12° and Re∞ = 264000 (A) at y/s = 0.2, (B) at y/s = 0.5, (C) at y/s = 0.8.
The pressure distribution at y/s = 0.2 shows the classical trend with the stagnation point cp = 1 on the lower side and the suction peak on the upper side close to the LE. After the peak, for both wings the pressure rises until it reaches a pressure plateau at x/cr,loc = 0.4 which indicates an area of separated flow. The upper membrane is already deflected upwards which leads to an airfoil with a camber of c/cr,loc = 1.59 %, see Table 1. The contour gradient of the LE is still too strong so the flow cannot follow the curvature and separates from the surface.
At y/s = 0.5, the upper membrane is deflected further and the maximum deformation is reached at about x/cr,loc = 0.4. Here, also the lower membrane is deformed upwards. The camber of the flexible airfoil increases to c/cr,loc = 2.42 %. As a result, the flexible wing shows a significantly higher pressure peak on the upper side and the level remains larger in the further course. Additionally, the pressure coefficient along the lower side of the wing is higher compared to the rigid wing. Both effects lead to a higher local lift of the flexible wing.
At y/s = 0.8, the deformation is smaller than at y/s = 0.5 and the maximum shifts more towards the LE. The suction peak of the flexible wing is even more pronounced but in the rear part the pressure level approaches the one on the rigid wing. The lower side remain equal to y/s = 0.5.
The analysis of the cross sections confirms the observations of the flow separation characteristics and explains the higher lift of the flexible wing. At α = 12°, the membrane in the mid section of the HAC can still adapt to the inflow, whereby the flow only separates for a short distance. If the angle of attack is further increased, the flow separation area increases, as in the case of the rigid wing, until it separates over the entire wing.
4.2.3 Increased lift of the highly swept configuration at high angles of attack
The higher lift level at high angles of attack of the HSC with flexible wings is investigated at α = 20°. The lift distribution in Figure 9 indicates that the HSC produces most of the lift in the inner portion of the wing. The flexible wing generates more lift than the rigid one between y/s = 0.25 and y/s = 0.7.
Figures 13A,B show the magnitude of the wall shear stress on the upper side of flexible and rigid wing. The axes refer to the wing half span of the HSC. Again areas with values close to zero indicate a separated flow. The most evenly distributed skin-friction lines support the analysis of the separation behavior.
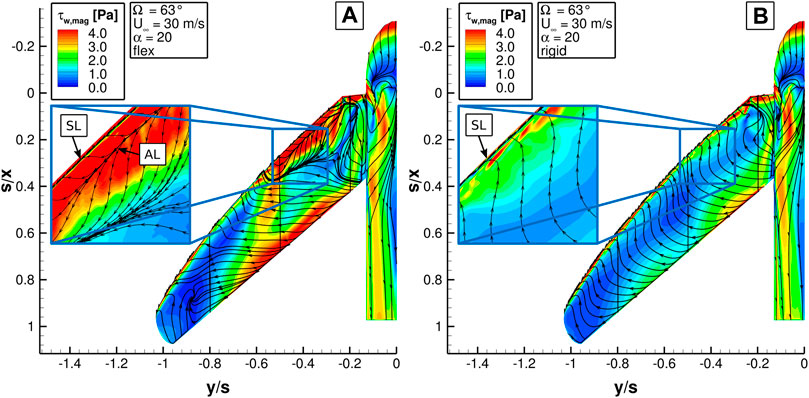
FIGURE 13. Wall shear stress magnitude τw,mag of the HSC at Re∞ = 264000 and α = 20° (A) with flexible and (B) with rigid wing.
The rigid wing in Figure 13B shows near-zero wall shear stresses over the entire span in the central section in chord direction, which in turn indicates flow separation over the entire wing. Along the LE, a thin zone shows higher values and thus an attached flow. At the inboard wing, higher wall shear stresses occur in the rear part which is a result of high local cross-flow velocities. The skin-friction lines show a separation line (marked by SL in Figure 13B) close to the LE and further downstream the skin friction-lines point upstream, except in a thin area at the TE, which confirms the observation about the flow separation on the whole wing. The flexible wing in contrast shows areas with high wall shear stresses on large areas close to the LE and TE. The latter extends from the kink at y/s = − 0.2 along the LE to y/s = − 0.6, where an area of high wall shear stresses connects LE and TE. At this spanwise position, the skin-friction lines show a separation line directly at the LE and an attachment line closely downstream, marked by SL and AL in the zoomed cutout in Figure 13A. After the reattachment the skin-friction lines quickly turn outwards and point perpendicular to the inflow. The skin-friction lines together with the band of high wall shear stresses suggest a LE vortex separating at y = − 0.6 and being present over the wing. The formation of the LE vortex is favored by the high sweep of the wing.
Figure 11B indicates that the vertical deformation Δz of the HSC is much stronger then at the HAC which is a result of the smaller pre-stress on the membrane. In addition, the peak is located on the inboard wing. Like at the HAC, nearly no deformation is observed on the outboard wing.
Figures 14A–C offers a more detailed view on the pressure distribution and the deformation of the membrane at three selected cross sections at y/s = [0.2, 0.5, 0.8]. The vertical and horizontal coordinates are made dimensionless by the local wing root. The position of the cross sections is again illustrated by black lines in Figure 11B and Figure 13.
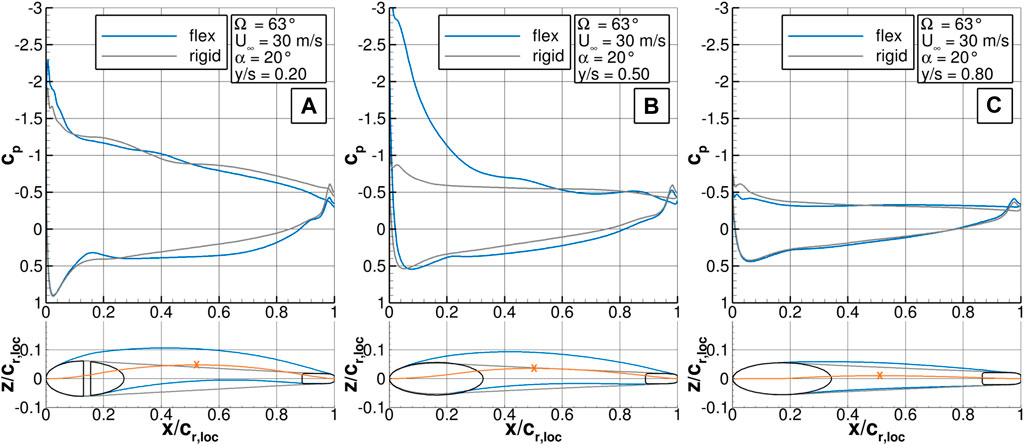
FIGURE 14. Pressure distribution along the airfoil for the HSC at α = 20° and Re∞ = 264000 (A) at y/s = 0.2, (B) at y/s = 0.5, (C) at y/s = 0.8.
At y/s = 0.2, the pressure distribution of the flexible and the rigid wing is quite similar, although the membrane shows high deflections on both sides. At the flexible wing, the suction peak is stronger and in the downstream part a higher positive pressure level is reached. On the top side, the flow is rather separated but a vortex from the fuselage wing transition delivers a certain cross-flow part, so a small pressure gradient towards the TE is observed.
At y/s = 0.5, the rigid wing shows almost only one constant pressure level which indicates a separated flow across most of the airfoil. The flexible wing has a high suction peak but also a pressure plateau in the rear part. The distinct suction peak is a result of the LE vortex with its high cross-flow velocities. On the lower side, again a higher pressure is reached for the flexible wing than for the rigid wing. Both phenomena lead to more lift. The deformation of the upper and lower membrane lead to an airfoil with a local camber of c/cr,loc = 3.55 %, see Table 1.
At y/s = 0.8, only the upper side is deformed to small extent. The pressure plateau over the whole airfoil indicates a separated flow at both wings.
The LE vortex is one reason why the folded membrane wing still generates significant lift at α = 20°. The deformation of the membrane contributes to a more stable and pronounced LE vortex even at very high angles of attack, which leads to an increase in lift compared to the rigid wing. The stall is delayed and only with the total breakdown of the LE vortex at even higher angles of attack the lift oft the flexible wing approaches the one of the rigid wing.
5 Conclusion and outlook
A morphing wing configuration with elasto-flexible membrane wings is investigated at low Reynolds numbers. The focus in this article is set on the efficacy of the membrane in the high lift regime. Therefore, fluid-structure-interaction (FSI) simulations and CFD simulations are performed for the model equipped with flexible and with rigid wings, respectively. In a first step, the lift coefficient of the FSI simulations is compared to experimental data. The results of the numerical simulations agree with the experiments in the linear region, but overestimate the gradient. In the high lift regime, the numerical simulations show smaller maximum lift coefficient values for all three configurations and indicate a more abrupt stall behavior especially for the more extended wings.
In a second step, the lift generation and the flow separation behavior of the flexible and the rigid wing are investigated by analysis of the lift coefficient, the deformation of the membrane, the wall shear stresses and the wing surface pressure coefficient. The elasto-flexible membrane increases the gradient in the linear region and the maximum lift coefficient. In addition, the maximum lift coefficient is shifted to higher angles of attack.
The gain in lift is investigated at α = 12° for the high aspect ratio configuration (HAC) and at α = 20° for the highly swept configuration (HSC). At α = 12°, the membrane in the mid section of the HAC can still adapt to the inflow. Thus the contour gradient seen by the airflow is reduced and the flow only separates for a short distance. Contrary to the rigid wing the flow stays attached in the mid wing section, hence more lift is generated. If the angle of attack is further increased, the flow separation area increases, as in the case of the rigid wing, until it separates over the entire wing.
At α = 20°, the HSC with flexible wings still produces significantly more lift than the rigid wing, because a leading-edge (LE) vortex is generated. The deformation of the membrane contributes to a more stable and pronounced LE vortex even at very high angles of attack. The stall is delayed and only with the total breakdown of the LE vortex at even higher angles of attack the lift of the flexible wing approaches the one of the rigid wing.
Fluid-structure-interaction simulations have already been carried out with a gust moving through the domain. By those simulations the differences between a rigid wing and a membrane wing can also be determined under unsteady conditions. This will show if the membrane can alleviate the gust loads compared to a rigid wing. In addition, the evaluation of the structural results will show whether the membrane can have a positive influence on the aeroelastic behavior of the wing.
Data availability statement
The raw data supporting the conclusions of this article will be made available by the authors, without undue reservation.
Author contributions
JP and MV contributed to the numerical simulations. JP performed the experimental measurements and wrote the first draft of the manuscript. JP and CB contributed to manuscript revision, read, and approved the submitted version.
Funding
The project is funded by the Deutsche Forschungsgemeinschaft (DFG, German Research Foundation) grant number BR 1511/12-1.
Acknowledgments
The authors want to thank ANSYS for providing the fluid-structure-interaction simulation software. Furthermore, the authors gratefully acknowledge the Leibniz Rechenzentrum for providing resources at the Linux Cluster and extensive technical support.
Conflict of interest
The authors declare that the research was conducted in the absence of any commercial or financial relationships that could be construed as a potential conflict of interest.
Publisher’s note
All claims expressed in this article are solely those of the authors and do not necessarily represent those of their affiliated organizations, or those of the publisher, the editors and the reviewers. Any product that may be evaluated in this article, or claim that may be made by its manufacturer, is not guaranteed or endorsed by the publisher.
References
Ajaj, R., and Jankee, G. (2018). The transformer aircraft: A multimission unmanned aerial vehicle capable of symmetric and asymmetric span morphing. Aerosp. Sci. Technol. 76, 512–522. doi:10.1016/j.ast.2018.02.022
ANSYS (2021). System coupling user’s guid, release 2021 R1. (Canonsburg, PA: ANSYS, Inc., ANSYS, Inc.). Southpointe, 2600 ANSYS Drive.
Béguin, B., and Breitsamter, C. (2014). Effects of membrane pre-stress on the aerodynamic characteristics of an elasto-flexible morphing wing. Aerosp. Sci. Technol. 37, 138–150. doi:10.1016/j.ast.2014.05.005
Béguin, B. (2014). Development and analysis of an elasto-flexible morphing wing. Ph.D. thesis. (Munich, Germany: Technical University of Munich).
Bennett, S. (2001). The osteology and functional morphology of the late cretaceous pterosaur pteranodon part ii. size and functional morphology. pala. 260, 113–153. doi:10.1127/pala/260/2001/113
Breuer, K., Swartz, S., Peraire, J., Drela, M., Willis, D., Moss, C., et al. (2012). Biologically-inspired flight for micro air vehicles. Final Report. Providence, United States: Brown University, School of Engineering.
Cramer, N., Cellucci, D., Formoso, O., Gregg, C., Jenett, B., Kim, J., et al. (2019). Elastic shape morphing of ultralight structures by programmable assembly. Smart Mat. Struct. 28, 055006. doi:10.1088/1361-665x/ab0ea2
Guo, Q., He, X., Wang, Z., and Wang, J. (2021). Effects of wing flexibility on aerodynamic performance of an aircraft model. Chin. J. Aeronautics 34, 133–142. doi:10.1016/j.cja.2021.01.012
Hassanalian, M., and Abdelkefi, A. (2017). Classifications, applications, and design challenges of drones: A review. Prog. Aerosp. Sci. 91, 99–131. doi:10.1016/j.paerosci.2017.04.003
He, X., Guo, Q., and Wang, J. (2019). Extended flexible trailing-edge on the flow structures of an airfoil at high angle of attack. Exp. Fluids 60, 122. doi:10.1007/s00348-019-2767-5
Hedenström, A., and Johansson, L. (2015). Bat flight: Aerodynamics, kinematics and flight morphology. J. Exp. Biol. 218, 653–663. doi:10.1242/jeb.031203
Jenkins, L., Ifju, P., Abdulrahim, M., and Olipra, S. (2011). Assessment of controllability of micro air vehicles. Proc. of 16th International Conference of Unmanned Air Vehicle Systems. 30. Bristol, UK: University of Bristol.
Joshi, S., Tidwell, Z., Crossley, W., and Ramakrishnan, S. (2004). Comparison of morphing wing stategies based upon aircraft performance impacts. doi:10.2514/6.2004-1722
Leibniz-Rechenzentrumn, B. (2021). Linux-cluster am leibniz-rechenzentrum. München, Germany: Leibniz-Rechenzentrum (LRZ) der Bayerischen Akademie der Wissenschaften. Boltzmannstrasse 1, D-85748 Garching bei.
Moorhouse, D., Sanders, B., Spakovsky, M., and Butt, J. (2006). Benefits and design challenges of adaptive structures for morphing aircraft. Aeronaut. J. 110, 157–162. doi:10.1017/s0001924000001135
Naish, D., Witton, M., and Martin-Silverstone, E. (2021). Powered flight in hatchling pterosaurs: Evidence from wing form and bone strength. Sci. Rep. 11, 13130. doi:10.1038/s41598-021-92499-z
Oktay, T., and Coban, S. (2017). Simultaneous longitudinal and lateral flight control systems design for both passive and active morphing tuavs. ElAEE. 23. doi:10.5755/j01.eie.23.5.19238
Palmer, C. (2018). Inferring the properties of the pterosaur wing membrane. Geol. Soc. Lond. Spec. Publ. 455, 57–68. doi:10.1144/SP455.4
Pecora, R., Amoroso, F., and Lecce, L. (2012). Effectiveness of wing twist morphing in roll control. J. Aircr. 49, 1666–1674. doi:10.2514/1.C000328
Pflüger, J., and Breitsamter, C. (2020). Experimental investigations of a full model with adaptive elasto-flexible membrane wings. Chin. J. Aeronautics 34, 211–218. doi:10.1016/j.cja.2020.03.037
Pflüger, J., Chen, Y., and Breitsamter, C. (2021). “Deformation measurements of a full span model with adaptive elasto-flexible membrane wings,” in New results in numerical and experimental fluid mechanics XIII. Editors A. Dillmann, G. Heller, E. Krämer, and C. Wagner (Cham: Springer International Publishing), 537–546. doi:10.1007/978-3-030-79561-0_51
Song, A., Tian, X., Israeli, E., Galvao, R., Bishop, K., Swartz, S., et al. (2008). Aeromechanics of membrane wings with implications for animal flight. AIAA J. 46, 2096–2106. doi:10.2514/1.36694
Swartz, S., Iriarte-Diaz, J., Riskin, D., Song, A., Tian, X., Willis, D., Breuer, K., et al. (2007). Wing structure and the aerodynamic basis of flight in bats. in Collection of Technical Papers - 45th AIAA Aerospace Sciences Meeting, Reno, Nevada. 1, 1–10. doi:10.2514/6.2007-42
Tiomkin, S., and Raveh, D. E. (2021). A review of membrane-wing aeroelasticity. Prog. Aerosp. Sci. 126, 100738. doi:10.1016/j.paerosci.2021.100738
Waldman, J. R., Hedenström, A., Winter, Y., and Johansson, L. (2012). Kinematics and wing shape across flight speed in the bat, leptonycteris yerbabuenae. Biol. Open 1, 1226–1238. doi:10.1242/bio.20122964
Waszak, M., Jenkins, L., and Ifju, P. (2001). Stability and control properties of an aeroelastic fixed wing micro aerial vehicle. in AIAA Atmospheric Flight Mechanics Conference and Exhibit 4005. Montreal,Canada. 06 August 2001 - 09 August 2001 .
Keywords: morphing wing, membrane wing, flexible wing surface, morphing camber, fluid-structure-interaction, CFD
Citation: Pflüger J, Von Langsdorff M and Breitsamter C (2022) Efficacy of an elasto-flexible morphing wing at high lift using fluid-structure-interaction simulations. Front. Aerosp. Eng. 1:975600. doi: 10.3389/fpace.2022.975600
Received: 22 June 2022; Accepted: 30 September 2022;
Published: 13 October 2022.
Edited by:
Oksana Stalnov, Technion Israel Institute of Technology, IsraelReviewed by:
Adnan Maqsood, National University of Sciences and Technology (NUST), PakistanTugrul Oktay, Erciyes University, Turkey
Copyright © 2022 Pflüger, Von Langsdorff and Breitsamter . This is an open-access article distributed under the terms of the Creative Commons Attribution License (CC BY). The use, distribution or reproduction in other forums is permitted, provided the original author(s) and the copyright owner(s) are credited and that the original publication in this journal is cited, in accordance with accepted academic practice. No use, distribution or reproduction is permitted which does not comply with these terms.
*Correspondence: J. Pflüger, am9uYXRoYW4ucGZsdWVnZXJAdHVtLmRl
 J. Pflüger
 M. Von Langsdorff