 Boris Sokolov
- Laboratory for Comparative Social Research, Higher School of Economics, St. Petersburg, Russia
This article offers a gentle introduction to the measurement invariance (MI) literature with a focus on its relevance to comparative political research. It reviews 1) the conceptual foundations of MI; 2) standard procedures of testing for MI in practical applications within the multiple-group confirmatory factor analysis (MGCFA) paradigm; and 3) two novel approaches to MI, Bayesian approximate measurement invariance, and MGCFA alignment optimization, which are especially suitable for dealing with extremely heterogeneous data from large-scale comparative surveys typical for modern political science. It then provides an empirical illustration of the key concepts and methods from the MGCFA-MI literature by applying them to testing for MI of two recently introduced measures of democracy attitudes, so-called liberal and authoritarian notions of democracy, across 60 countries in the sixth round of the World Values Survey. These analyses show that both measures can be considered reliable comparative measures of democratic attitudes, although for different reasons. Finally, this study emphasizes that some survey-based constructs, e.g., authoritarian notions of democracy, do not follow the reflective (correlation-based) logic of construct development. These alternative measures, known as formative measures, do not assume strong correlations between their indicators, for which reason it is inappropriate to test their comparability using the reflective MGCFA approach. Instead, their comparability can be tied to their correlations with theoretically relevant external variables.
Introduction
Comparativists increasingly use data from large cross-national surveys, such as the World Values Survey (WVS), the European Social Survey (ESS), the International Social Survey Programme (ISSP), and dozens of others, sometimes covering as much as 100 countries, representing up to 90% of the global population (as the WVS does). Evidence from such surveys can be used to compare how people living in different countries think about a diverse range of social and political issues and explore what their attitudes, opinions, and values have in common and where those are differing. These survey projects also enable scholars to thoroughly track changes in public opinion and prevalent political values region- or even worldwide and relate those changes to various political developments, e.g., democratization (Inglehart and Welzel 2005; Inglehart and Welzel 2010).
Insights from comparative survey data laid the foundation for a number of influential theories in political science, such as Almond and Verba’s (1963) civic culture theory, Putnam’s (1993; 2000) social capital theory, Norris’s (1999; 2011) critical citizen theory, or Inglehart and Welzel’s (Inglehart, 1977; Inglehart, 1990; Inglehart and Welzel, 2005) revised theory of modernization and its reformulation as a theory of emancipation by Welzel (2013)—to name just a few of the most renowned contributions. However, as it was acknowledged by leading comparative researchers as early as in the 1960s (Przeworski and Teune, 1966), to ensure meaningful comparisons of attitudes and opinions across groups (most notably countries), the measures of those attitudes and opinions should function equivalently across all compared groups (i.e., countries) to provide comparable numerical scores. When asking people living in different cultural, religious, linguistic, and political contexts about complex and abstract concepts, often of Western origins and not deeply rooted in local cultures, it is always possible to confuse meaningful information from the recorded responses with a good deal of measurement noise (e.g., stemming from translation errors, nation-specific response styles or social desirability biases, or substantively nonequivalent meanings attributed by respondents to seemingly the same concepts: van Deth, 2009; Davidov et al., 2014), which may finally result in, according to a popular metaphor, comparing “apples with oranges” (e.g., Stegmueller, 2011).
Measurement equivalence, or measurement invariance1 (MI, in short), cannot generally be taken for granted and needs to be tested empirically. Without such testing, both descriptive cross-national comparisons and inferential multilevel and aggregate-level analyses (e.g., regressions), which use non-invariant attitudinal measurements as inputs, are at constant risk of obtaining the biased2 estimates of the target quantities of interest (e.g., mean rankings or regression coefficients). Measurement noninvariance is a particular instance of measurement error, so using non-invariant (i.e., measured with error) individual or aggregate scores as inputs in, say, regression analysis,3 may have various negative effects on the quality of the resulting estimates, including inflated residual variance, reduced power, and, most importantly, biased or even reversed structural coefficients (Carroll et al., 2006, 41; Greenwood, 2012).
To date, various MI testing methods have been developed, and these methods are now widely used in a range of disciplines, such as marketing research (Steenkamp and Baumgartner, 1998), cross-cultural psychology (Milfont and Fischer, 2010), or comparative sociology (Davidov et al., 2014). However, despite some important recent contributions (King et al., 2004; Davidov, 2009; van Deth, 2009; Ariely and Davidov, 2011; Ariely and Davidov, 2012; Stegmueller, 2011; Alemán and Woods, 2016; Sokolov, 2018) and several long-lasting debates on the degree of comparability of popular political scientific concepts,4 these methods are still not as familiar to, and popular among, comparative political scientists as to scholars from other fields of the social sciences. This article aims at filling the gap by making the following contributions to the ongoing debate on comparability issues in political science.
First, this study introduces in an intuitively understandable fashion the conceptual foundations of measurement invariance and describes standard procedures used to test for MI in practical applications, mostly with the focus on the multiple-group confirmatory factor analysis (MGCFA) approach to MI.
Second, the study reviews two novel approaches to MI, Bayesian approximate measurement invariance, and MGCFA alignment optimization, which were purposefully designed for dealing with extremely heterogeneous data from large-scale comparative surveys and therefore often allow researchers to obtain reasonably comparable summary scores on attitudinal constructs in complex settings where standard MI testing methods typically reveal no comparability.
Third, the study provides an empirical illustration of the key concepts and methods from the MGCFA-MI literature by applying them to testing for MI of two recently introduced measures of democracy attitudes, so-called liberal and authoritarian notions of democracy (henceforth LNDs and ANDs; Kirsch and Welzel, 2019), across 60 countries included in the sixth round of the World Values Survey.
Fourth, the examination emphasizes that not all survey-based constructs are suitable for comparability assessment with the use of the MGCFA approach. The latter is just a special application of a more general approach to construct development and validation, which is often referred to as reflective measurement. The reflective approach, roughly speaking, ties measurement validity (including comparability) of complex multi-item constructs to the strength (and, in the case of MI, also cross-national similarity) of correlations between their observed indicators. It currently dominates both the measurement literature and applied survey research, but it is not the only available option. Another potentially fruitful approach is formative measurement (Bollen and Lennox, 1991; Welzel and Inglehart, 2016; Welzel et al., 2021), which does not require construct indicators to be correlated with each other, and, more generally, allows for using indicators that define, or form, rather than reflect, constructs. As it is explicated below, ANDs, in contrast to LNDs, can be better understood as a formative construct, and therefore MGCFA-based methods cannot be used to assess its cross-national comparability. Instead, it can be anchored in a broader nomological net of that measure (i.e., correlations of ANDs with their theoretically relevant antecedents).
LNDs and ANDs serve as empirical illustrations here for several reasons. First, democracy is clearly the most central concept in contemporary political science in general and especially in the subfield of comparative politics. Then, it is a widely supported point of view that democratic attitudes, in particular commitment to democracy and support for democracy, play a crucial role in ensuring the sustainability of democratic rule or successful consolidation of democracy after transition (Lipset, 1959; Easton, 1965; Linz and Stepan, 1996; Claassen, 2020; Zagrebina, 2020). However, comparative surveys have revealed that widespread support for democracy often coexists with the persistent absence of democracy itself (Norris, 2011; Coppedge, 2012, 244–45). LNDs and ANDs were developed to resolve this intriguing paradox. Indeed, Kirsch and Welzel (2019) (henceforth K and W) showed that in most autocracies where one can observe a high level of popular support for democracy, what the population actually supports is not democracy in its scholarly understanding (i.e., a political regime based on free elections and respecting human rights and gender equality), reflected in LNDs, but instead, a mix of the standard liberal understanding of the term and several authoritarian misunderstandings of it, reflected in ANDs (such as beliefs in that military rule or theocracy can be essential features of democratic regimes). Moreover, the relative prevalence of ANDs in national public opinion was found by K and W to be closely associated with 1) the propensity of WVS respondents to overrate their country’s level of democracy with respect to some objective measures of democracy (see also Ariely, 2015; Kruse et al., 2019), and 2) the overall lack of electoral democracy in a country.
Although the issue of comparability of the measures of democratic attitudes from the WVS has already gained scholarly attention (Ariely and Davidov, 2011), LNDs and ANDs are novel constructs that have never been tested for MI so far. At the same time, a few comparability assessments of various WVS attitudinal measures, including democratic attitudes, indicated that they often lack cross-national comparability (Ariely and Davidov, 2011; Alemán and Woods, 2016; Sokolov, 2018; see also references therein). It should, however, be noted that previous non-invariance findings could be produced not only by the real lack of equivalence in WVS attitudinal measures but also by the fact that the standard MGCFA-MI method might not be well equipped for handling such diverse and heterogeneous samples as those produced by the WVS (van de Schoot et al., 2013; Davidov et al., 2014).
The standard invariance tests of LNDs and ANDs suggest that 1) there is some evidence in favor of cross-national invariance of LNDs, but it is insufficient to enable accurate cross-national comparisons, and that 2) ANDs do not comply even with the basic requirement of so-called configural invariance. It is nevertheless possible to obtain reasonably precise estimates of national mean scores on LNDs using the alignment optimization method (but not the Bayesian approximate approach). As to ANDs, while being a very problematic measure according to the reflective MGCFA-MI perspective, it can still be defended as a relatively reliable comparative measure of misunderstandings of democracy in terms of the formative approach.
Summing up, using LNDs and ANDs together with the highly diverse WVS data in this illustrative study is highly instructive since it allows 1) highlighting the power of novel MI testing methods which can provide sufficiently reliable and accurate aggregate scores even in very complex and heterogeneous cross-national settings, such as WVS-6, and 2) clarifying that the current MGCFA-based generic approach to construct validation may sometimes be not optimal for some constructs of interest for comparative political scientists. The results presented below also have substantive implications since they suggest that LNDs and ANDs can, although for different reasons, be considered cross-nationally comparable measures and therefore can be used for both descriptive cross-national comparisons (e.g., mean score rankings) and inferential country-level or multilevel analysis (e.g., as outcomes or predictors in regression models). This finding may give an important impetus to further theorizing and empirical research on democratic attitudes and their overall importance for democratic development in a comparative perspective.
Measurement Invariance: Definition and Testing Guidelines
The Basics of MI Testing
According to a widely cited definition, “Measurement invariance is a property of a measurement instrument (in the case of survey research: a questionnaire), implying that the instrument measures the same concept in the same way across various subgroups of respondents” (Davidov et al., 2014, 58). This property of a measurement instrument can be tested using various approaches, but the most popular method in comparative survey research is multiple-group confirmatory factor analysis (MGCFA).5 To understand the basic ideas behind the concept of MI and its factor-analytic operationalization, consider the standard CFA model:
where
Researchers may impose cross-group equality constraints on any type of parameters appearing in this model, but in practical applications, the following three types of invariance are most frequently tested: configural, metric, and scalar invariance (Davidov et al., 2014).
Configural invariance is the least demanding type, or level, of MI. It requires only that factor structures are equivalent across groups. Configural invariance holds if all items that are supposed to be related to the construct of interest indeed load high on that construct in all countries6 under study.7 If some items do not load high in some countries then the assumption of configural invariance is undermined since the same construct is in fact measured by different sets of observed attributes and therefore has non-equivalent substantive content in different countries. Therefore, comparisons of numerical scores obtained with the tested set of measures may be meaningless.
To test for configural invariance, it is typically recommended to fit the same hypothesized CFA model in each country separately and then inspect 1) country-specific goodness-of-fit measures (e.g., the
The next, and more strict, level of MI is metric invariance. It requires the cross-national equality of factor-loading parameters. Formally speaking, it requires that
It can also be understood in a sense that, if metric invariance holds, the latent variable has the same unit of measurement in each country. Once established, metric invariance allows for meaningful comparisons of latent variances and, probably more important for practical purposes, covariances between the factor of interest and other theoretically relevant structural variables.
One can test for metric invariance of an MGCFA model by imposing equality constraints on factor loadings (which can routinely be done in any popular software for latent variable modeling) and then comparing the metric model to the configural model. Since the former is nested in the latter, the standard
The most popular guidelines for using fit indices for invariance testing are those proposed by Chen (2007). Chen claims that metric non-invariance is indicated by a change in the CFI value larger than −0.01, when supplemented by a change in the RMSEA value larger than 0.015 and a change in the SRMR value larger than 0.03 compared with the configural model. Chen’s recommendations are however based on the simulation of a two-group setting. Some recent research suggests that those recommendations might not be generalizable to the scenarios when the number of groups is large (>10), which is the typical setting in modern comparative surveys. Hence, somewhat softer cutoff values might be more adequate. For instance, Rutkowski and Svetina (2014) propose that metric non-invariance is indicated by a change in CFI larger than −0.02 when supplemented by a change in the RMSEA larger than 0.03 compared with the configural model.10
Finally, the third level of MI, scalar invariance, requires the cross-national equality of item intercept parameters, i.e. that
To check the credibility of the scalar invariance assumption the same approaches can be used as for metric invariance, that is the
What to Do if MI Tests Fail?
It is a common situation, especially when the number of countries is large, that applied researchers fail to establish one or another level of MI, primarily scalar invariance (van de Schoot et al., 2013; Davidov et al., 2014). While annoying, such findings do not necessarily prohibit cross-national comparisons. First, some authors (e.g., Meuleman, 2012; Oberski, 2014) argue that often in practice measurement bias due to non-invariance does not lead to wrong substantive conclusions about mean rankings or structural coefficients. Second, it is sometimes possible to 1) re-specify a measurement model by removing the most problematic indicators or 2) exclude countries that exhibit the largest amount of non-invariance, although these remedies for the issue of non-invariance are not always practically feasible. For instance, there may be too few indicators to remove any of them without sacrificing the model’s identifiability or validity, or dropping indicators may be theoretically inappropriate. In its turn, dropping non-invariant countries leads to a loss of important information and undermines the degree of the cross-national coverage, and therefore representativeness, of the sample. Third, there are several approaches to MI that are not so restrictive as the standard MI testing framework but nonetheless believed to be able to recover aggregated quantities of interest, such as latent means and variances, quite accurately.
The historically first such approach is testing for partial MI (Byrne et al., 1989) if full metric or scalar invariance does not hold. The concept of partial MI suggests that group-specific latent variances and means can be validly compared when at least 50% of items per construct function equivalently across groups, that is they have equal loadings and/or equal intercepts. If a fully metric invariant or a fully scalar invariant model does not fit well, it is possible to use various local misspecification detection tools, such as modification indices, to identify items with the most non-invariant parameter values.11 At the next step, one may relax equality constraints on loadings and/or intercepts of those items. The resulting partial metric/scalar invariant model can be tested against a more liberal model (i.e., the configural model, in case of partial metric invariance, or the [partial] metric model, in case of partial scalar invariance) using the same model comparison methods as in the tests for full invariance.
Throughout the 2010s, several more sophisticated approaches to dealing with metric and scalar non-invariance have been introduced, from which the most notable are approximate Bayesian measurement invariance (or AMI; Muthén and Asparouhov, 2012; van de Schoot et al., 2013) and MGCFA alignment optimization (Asparouhov and Muthén, 2014). The concept of AMI is based on the idea to allow for some small variability in group-specific deviations of measurement parameters from their sample-average values. This can easily be done in the Bayesian paradigm by treating these deviations as an auxiliary family of model parameters and defining prior distributions with zero means and small variances over them (for technical details see Van de Schoot et al., 2013). It is considered that if the variance of measurement parameters across groups is indeed small enough, then latent means and variances can be estimated reasonably close even if loadings and intercepts are not exactly equivalent across groups. It is important to mention that the AMI approach is believed to provide the most reliable results in scenarios in which most differences in measurement parameter values between groups are small to moderate and, in addition, non-systematic (that is, cancel each other out). When there are a few groups with very different parameter values, it may provide biased estimates of latent means and variances (Lek et al., 2018, 924).
The key issue with this approach is how small the variance of group-specific deviations should be to be considered “small enough.” While initial research on that issue suggested that even a prior variance of loading and intercept deviations as high as 0.05 would not undermine the overall comparability of latent means and variances (Muthén and Asparouhov, 2013; van de Schoot et al., 2013), more recent simulation evidence indicates that more restrictive prior variances of 0.005–0.01 may be necessary to recover group latent mean rankings accurately (Pokropek et al., 2019; Pokropek et al., 2020).
In contrast to the nested model comparison approach widely employed in the frequentist MI tests, in the Bayesian approach, the main focus is typically on comparing model specifications with different prior variances of group-specific parameter deviations. In other words, one needs to estimate a set of models with increasingly high prior variances of measurement parameter differences (say, 0.001, 0.005, 0.01, 0.05, and 0.01) and then use various Bayesian model fit measures to establish what prior level of non-invariance fits the actual data best.
While there are many tools to assess model quality in the Bayesian framework (Vehtari et al., 2017), the choice of applied researchers performing AMI tests is mostly limited to the fit measures available in the MPLUS software, one of the few existing to date statistical packages that implement the AMI method in a straightforward and relatively easy-to-use (for non-statisticians) way (Pokropek et al., 2020).12 The main options are the Posterior Predictive p-value (PPP), the Bayesian Information Criterion (BIC), and the Deviance Information Criterion (DIC). The former measure can be used as a metric of absolute fit (one can use it to evaluate the quality of a single model against some more or less universal benchmark, which is often claimed to be PPP > 0.05), while the two latter criteria are generally meaningful only when used for the assessment of relative fit, with lower values of BIC or/and DIC indicating better-fitting models. According to Pokropek et al. (2020), in the context of AMI testing, the DIC seems to perform best in terms of its ability to identify the correct prior variance, but the PPP and the BIC can also be useful under certain conditions. As to cutoff values, these authors note that the size of fit measures thresholds is heavily dependent on both the individual- and group-level sample size, so it is difficult to formulate any generalizable recommendations with respect to this (Pokropek et al., 2020, 761–762).
Another promising approach to MI, alignment optimization, does not involve any direct tests for MI. Instead, this method aims at getting reliable estimates of the latent group means and variances while allowing, to some extent, for approximate measurement invariance of the model parameters (Asparouhov and Muthén, 2014; Muthén and Asparouhov, 2018; Marsh et al., 2018). Estimating an MGCFA model with alignment optimization involves two steps. At the first step, a configural model with unconstrained loadings and intercepts is fitted to the data. In that model, or
A useful by-product of the optimization algorithm lying in the core of the alignment approach is that it allows for quantifying the degree of measurement non-invariance for every loading and intercept in the model by calculating the proportion of groups for which pairwise tests do not reveal significant between-group differences in the values of a specific parameter. Several cut-off values have been proposed in the literature to provide guidelines with respect to how much non-invariance can be allowed for in the model to keep the estimates of latent means and variances reliable. Various authors claim that as much as 20% (Asparouhov and Muthén, 2014), 25% (Muthén and Asparouhov, 2014), or even 29% (Flake and McCoach, 2018) of non-invariant model parameters still constitute a tolerable degree of non-invariance.
Moreover, even if the proportion of non-invariant parameters exceeds the aforementioned thresholds it is still possible in some occasions to obtain reliable estimates of latent means and variances. To check whether this possibility is feasible in a particular application, one needs to perform a simulation study in which the estimated parameter values from the actual MGCFA model are used as the true population values. If the simulation results suggest that the estimates of latent means and variances can be recovered by the model sufficiently well (that is, if the correlations between the generated and estimated parameter values are very high, e.g., > 0.98), then the model can be considered a reliable tool of obtaining various group-level latent summaries even despite the seemingly high degree of non-invariance in its parameters (Asparouhov and Muthén, 2014; Muthén and Asparouhov, 2018).
Finally, two additional metrics can be used to explore the degree of non-invariance in item-specific loadings and intercepts. First, for every measurement parameter, it is straightforward to calculate its contribution to the simplicity function. Parameters with smaller contributions can be considered more invariant ones. Second, for every measurement parameter, it is possible to compute the
Data and Measurements
To test MI of LNDs and ANDs I use data from the sixth wave of the World Values Survey. While most WVS items measuring these two concepts appeared also in the questionnaire of the previous, fifth WVS round, one particular question used by K and W to define ANDs, that about people’s obedience to their rulers, was introduced only in the sixth round. Still, the sixth round’s data represent an excellent opportunity to assess the measurement properties of LNDs and ANDs in a comparative perspective for two related reasons. First, more countries (60) participated in that round than in any other round of the WVS completed to date. Second, that round also covered unprecedentedly many developing countries, including 17 Arab and Middle Eastern countries and 11 sub-Saharan countries, which had never been so widely represented in any previous WVS round. In other words, the sixth wave provides researchers with one of the most geographically, economically, politically, culturally, and linguistically diverse samples of countries in the entire history of cross-cultural survey research. Such a great degree of diversity offers multiple, and invaluable, opportunities to test grand theories about the cultural, social, and political evolution of human societies. At the same time, it poses multiple challenges to researchers using the WVS data, since it magnifies, by a very high rate, the effects of various substantive and methodological factors that may undermine cross-cultural comparability.
Using a data set, which is so rich, for MI tests is always fruitful and instructive. First, if some construct can pass such a severe trial, then it is likely to reflect a nearly universal cultural concept that has a similar meaning for most currently living humans and therefore deserves greater attention from comparative researchers. Second, given all the non-invariance findings published to date, it seems imprudent to expect that MI can be established with the standard testing strategy in such a multifarious setting (Davidov et al., 2014; Marsh et al., 2018; Davidov et al., 2018). This therefore can serve as a good, and highly illustrative, test case for whether novel MI-testing approaches are indeed able to obtain more promising results, compared to the classic one, in complex settings. Third, even if those more flexible and sophisticated methods fail to achieve a sufficient level of comparability, it is still possible to leverage the depth and breadth of the WVS data to inform our understanding of the various factors driving the observed patterns of non-invariance (e.g., with the use of multilevel modeling: see Davidov et al., 2018).
As it has already been mentioned above, 60 countries participated in the sixth round of the WVS. However, in China and Egypt one indicator of ANDs, that asking about army rule, was not included in the national questionnaires, so in some analyses reported below, I used data only from 58 countries. In the WVS, national samples are typically collected using face-to-face interviews (PAPI or CAPI) and are intended to “be representative of all people in the age 18 and older residing within private households in each country, regardless of their nationality, citizenship or language.”14 The overall individual-level sample size comprises 89,565 respondents, with national sample sizes ranging from 841 in New Zealand to 4,078 in India (but most, 42 out of 60, are between 1,000 and 2,000 respondents).
The data file used for most analyses reported below can be obtained from the WVS website (Inglehart et al., 2014). For additional tests of nomological validity of ANDs I used replication data from Kirsch and Welzel, 2019 paper in Social Forces, kindly provided by Christian Welzel. Data and code (R and MPLUS scripts) necessary to reproduce all results reported in the main text of this article and in the Supplementary Material (henceforth, SM) can be obtained from the author upon request.
In defining LNDs and ANDs I precisely follow K and W who used six WVS questions, asking how essential respondents think the following things are as characteristics of democracy:
1) LND-1: “People choose their leaders in free elections” (for the sake of brevity I will use a short label Elections to refer to this item in what follows; its WVS-6 variable code is V133)
2) LND-2 “Civil rights protect people from state oppression” (Rights; V136)
3) LND-3 “Women have the same rights as men.” (Equality; V139)
4) AND-1: “Religious authorities ultimately interpret the laws.” (Religion; V132)
5) AND-2: “The army takes over when government is incompetent” (Army; V135)
6) AND-3: “People obey their rulers.” (Obedience; V138)
Individual responses to those items were recorded on a 1 to 10 scale where 1 means “not at all an essential characteristic of democracy” and 10 means it definitely is “an essential characteristic of democracy.” The pooled-sample and country-specific means and variances for all six items are shown in Supplementary Table A1 in the SM. In almost all WVS countries people are, on average, able to correctly recognize free elections, civil rights, and gender equality as constitutive features of democratic regimes. The total national LND scores, which are just the averages of the three individual-item scores, range from 6.52 in Lebanon to 9.15 in Sweden. In contrast, most countries score quite low on the AND items: The overall AND score varies from only 2.26 in Germany to 7.22 in Pakistan. Typically, the by far highest-scoring AND item is “Obedience,” which may be less related, semantically, to authoritarian practices (indeed, no democracy could survive if its citizens once refused to obey their government’s decrees). In not a single country does the AND score exceed the LND score.
From these naive comparisons one might be tempted to conclude, for example, that people all over the world have a generally correct understanding of what democracy is and, perhaps to a somewhat lesser extent, what it is not, at least according to one, although presumably mainstream, scholarly definition of the term. It is also possible to use these scores to model various micro- and macro-level processes shaping individual and culture-level perceptions of democracy and relating those perceptions to various political outcomes, e.g., the persistence of authoritarian rule in many modern societies (Kirsch and Welzel, 2019; Kruse et al., 2019). The former conclusion, and the latter empirical analyses, may nevertheless be premature since it is not yet clear whether the WVS-based measures of LNDs and ANDs yield equivalent national scores or not.
MGCFA of LNDs and ANDs
Pooled-Sample Factor Analysis of LNDs and ANDs
Kirsch and Welzel did not use any kind of confirmatory analysis to validate their measures of LNDs/ANDs or to assess MI of their measures. They nonetheless reported the results of exploratory factor analysis of six items used to measure LNDs and ANDs. I replicated, using a slightly different approach, their exploratory analysis. Overall, the pooled-data EFA results (see Supplementary Figure A1 and comments on it in the SM) generally support the two-factor structure proposed by K and W, but also point out that the “Obedience” item may poorly discriminate between the LND factor and the AND factor.
Then, following K and W and my own exploratory analysis, I estimated a two-factor confirmatory model of LNDs and ANDs. In its basic specification, it assumed two factors and a simple factor structure (no cross-loadings or residual covariances between indicators). To account for non-normality (recall that all manifest variables are 1–10 scales), I used robust maximum likelihood estimation (MLR) as implemented in the R package lavaan version 0.6–7. Since a considerable proportion (13.4%) of observations contained missing values on at least one indicator, the full information maximum likelihood approach was used to handle missing data.
The scaled
The analysis of local misspecification revealed two potential parameters worth adding to the model, a cross-loading between the LND factor and V138 (MI = 3,200.98, standardized EPC = 0.32) and a residual covariance between V132 and V135 (MI = 3,200.97, standardized EPC = 5.67), so they could not be added to the model simultaneously. For the latter parameter, its standardized EPC had an implausible value (standardized covariances cannot exceed 1), and adding it to the model in fact led to some negative estimated variances, so I preferred to add the former. That decision was further supported by the analysis of the model’s standardized residuals: three out of the four largest residuals were for the covariances between V138 and the three LND indicators (33.83, 39.79, and 38.26 respectively).
With a cross-loading between the LND factor and V138, the model fit improved significantly: scaled
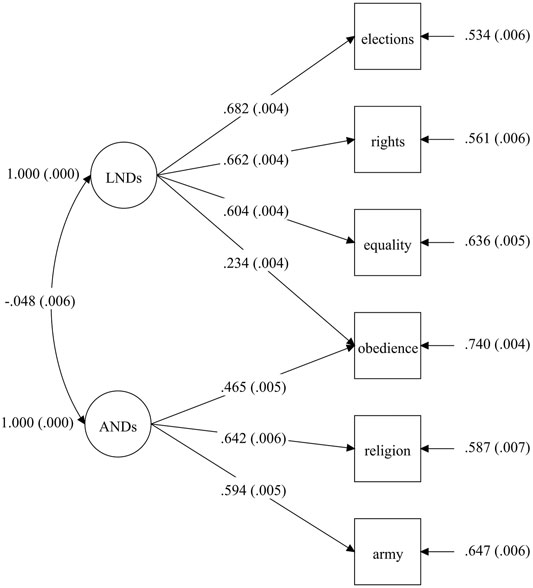
FIGURE 1. A two-factor model of LNDs and ANDs. Note: According to CFA visualization conventions, circles represent latent variables and boxes represent observed variables. Unidirectional arrows between latent factors and their indicators show factor-loading estimates; bidirectional arrows show covariance estimates, and unidirectional arrows incoming to indicators from the right show their respective residual variances. For all model parameters, their standardized estimates are shown, with standard errors in parentheses. To identify the model, the marker variable method was used, with “Elections” being a marker for the LND factor and “Religion” for the AND factor. Data are from WVS round six (N = 89,565, 60 countries).
The only problematic indicator was “Obedience” which had the lowest loading (of 0.465) on its targeted construct, ANDs, among all six items and additionally was also non-trivially related to another, nontarget factor (the respective cross-loading was statistically significant and its standardized value of 0.234 was large enough to not be considered trivial), which might indicate a low discriminating capacity of that item15 (although the correlation between two factors themselves was quite small, only
Standard MGCFA Tests for MI of the LND Factor
To test the modified two-factor model of LNDs and ANDs for configural invariance, I estimated the model separately for each WVS country, except China and Egypt (where the “Army” question was not asked). Three important findings deserve attention in regard to that set of analyses. First, as Supplementary Table A2 in the SM illustrates, in a sizable number of national samples the model did not fit well. Second, as shown in Supplementary Table A3 in the SM, loadings of the AND items varied considerably in their sizes, significance, and even signs across countries. In contrast, loadings of the LND items were significant, positive, and large, although not perfectly equal, in all but one country. The only exception was Haiti, where the “Rights” and “Equality” items had negative loadings, but that seemed to be an artifact of the overall implausibility of the two-factor model structure for that country: in a single-factor model of LNDs, which did not include the AND factor and its three indicators, all LND loadings were positive in Haiti. Third, as had already been noted by K and W themselves, the strength of the correlation between the LND and AND factors was very different across WVS countries. All these observations suggest that the two-factor model does not fit even the basic requirement of similar factor structures in different countries. However, most cross-national differences came from the AND part of the model, while its LND part performed sufficiently well in terms of configural invariance. I therefore proceeded with tests for more demanding types of invariance for the LND factor only. Notice that the finding of configural non-invariance for ANDs does not necessarily mean that this measure is entirely unsuitable for use in comparative contexts. This issue is discussed in depth below in the section ANDs: Comparability beyond MGCFA?
The configural MGCFA model for LNDs alone has only three indicators so it is just-identified and therefore has perfect values of all fit indices. This means that one cannot assess its fit to the data directly, but, as noted above, factor loadings for all three items are at least positive and statistically significant in all countries. In addition, what matters for the overall plausibility of the metric and scalar invariance assumptions, is mostly the relative fit of these two models in comparison with less restrictive model specifications. As to the metric model, the
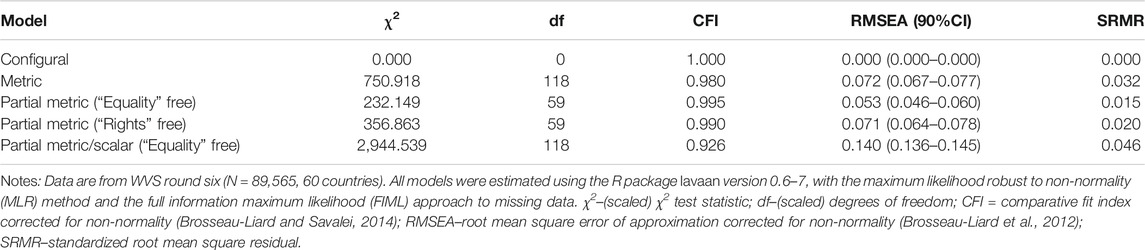
TABLE 1. Multiple-group CFA of LNDs.
Nevertheless, partial metric invariance seemed to be a plausible assumption since for the model where the loading of the “Equality” item was allowed to vary across countries,
To sum up, neither full metric invariance nor full or even partial scalar invariance held for LNDs, and evidence in favor of partial metric invariance was fairly contradictory: the latter could not be considered as proved “beyond reasonable doubts.” Hence, according to the standard CFA testing approach, the cross-national comparability of LNDs is highly questionable. It seems that one can at best compare latent variance estimates or various structural coefficients related to LNDs across different countries but certainly cannot compare latent mean scores or use them as inputs in country- or multilevel inferential analyses.
AMI Tests of the LND Factor
Some recent simulations and applied studies have shown that novel AMI-testing methods, such as the Bayesian AMI approach (Cieciuch et al., 2014; Zercher et al., 2015; Sokolov, 2018) or MGCFA alignment (e.g., Jang et al., 2017; Lomazzi, 2018; Marsh et al., 2018; Munck et al., 2018; Pokropek et al., 2019; Lomazzi and Seddig, 2020), could provide more promising results with respect to the issue of cross-national (non-)comparability in large samples. Can these methods help to ensure that LNDs are at least approximately comparable across WVS-6 countries? I first tested for AMI of that measure using the Bayesian approach. Specifically, I estimated five models with differing levels of prior variance on the distributions of between-group differences in model parameters: 0.001, 0.005, 0.01. 0.05, and 0.1.18 Various fit statistics for those models are shown in Table 2. In addition to three measures discussed above, the PPP, the BIC, and the DIC, I also included the 95% credibility interval (CI) for the difference between the observed and the replicated
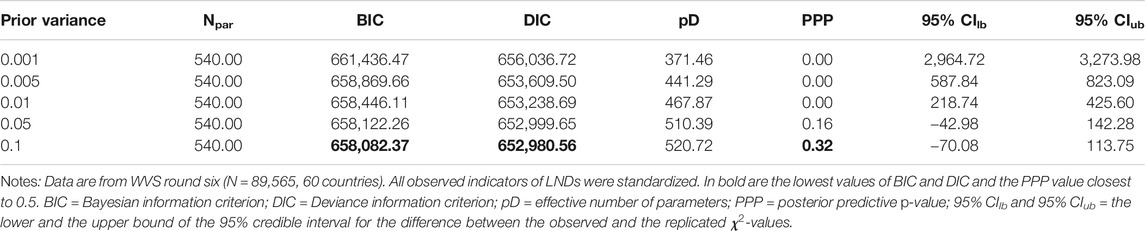
TABLE 2. Bayesian approximate invariance tests of LNDs.
All these four model quality indicators unanimously suggest that the least restrictive model (that with a prior variance of 0.1) has also the best fit among the five models presented in Table 2: it has the lowest values of BIC and DIC, the PPP value closest to 0.5, and the middle value of its CI closest to zero. Another important observation with respect to Table 2 is that allowing for an increasingly large variation in measurement parameters leads to systematically better values model fit indices. It is likely that increasing the prior variance above 0.1 might lead to even better model quality. However. the prior variance of 0.1 means that 95% of group-specific deviations of unstandardized loadings and intercepts from their sample average values belong to the interval between
What about the MGCFA alignment method? At first glance, it did not do better than the Bayesian approach. According to the results reported in Table 3, the proportion of countries with large deviations of loadings was small. For the most non-invariant item, “Equality,” it is only 21.7%, which was slightly above the conservative threshold of 20% and below 25%. However, for intercepts, the proportions of significantly deviating country-specific estimates were much larger, ranging from 36.7% for “Equality” to 55% for “Rights.” Surprisingly, the R2 statistics for those largely non-invariant parameters was much higher, and quite close to 1, than the R2s for quite invariant loading parameters.21
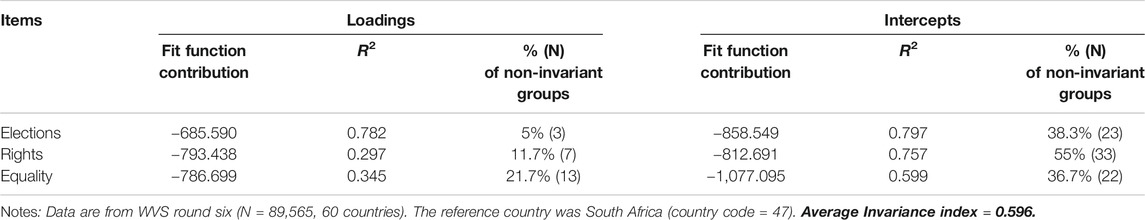
TABLE 3. Fixed alignment fit statistics.
As recommended by Asparouhov and Muthén (2014), this study complemented the alignment analysis by a simulation study, using the parameter estimates from the final alignment model as true population values. To control for whether the estimation accuracy for latent means and variances is sample-size dependent, separate simulations for four different group sample sizes were run: 500, 1,000, 1,500, and 2.000 observations per group (except the smallest one, these group sample sizes are typical for national WVS samples). Quite strikingly again, despite the large proportions of deviating countries, the correlations between the generated and estimated means were extremely high for all sample sizes (all >0.98 and all but one >0.99; see Table 4), suggesting that the alignment model was able to recover latent means sufficiently good. However, even with the largest sample size of 2,000 the correlation between the generated and estimated latent variances was only 0.82. In other words, 500 observations per group it was effectively zero. In other words, despite a small number of countries with substantively different values of factor loadings and even standard MI tests pointing to the plausibility of the partial metric invariance assumption, according to that simulation, the three-item model LNDs experienced severe troubles with recovering latent variances from WVS data.
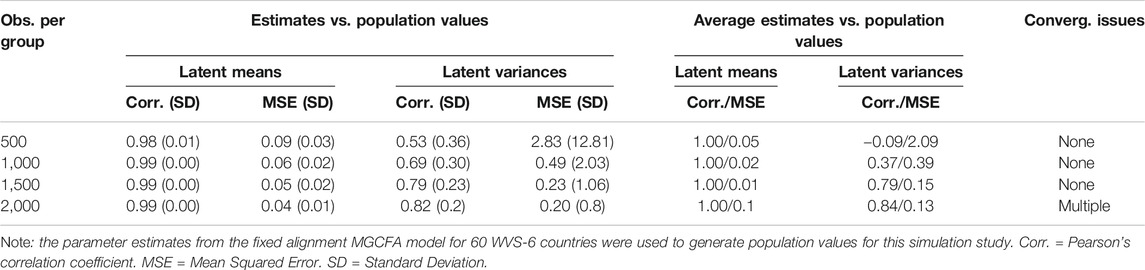
TABLE 4. Correlations of generated and estimated factor means across 60 groups.
A deeper investigation of that issue nevertheless showed that such low correlations were caused by two countries with severely misestimated variances, Kuwait and Haiti. For all other countries, their respective latent variances were recovered quite precisely: without Kuwait and Haiti, the relative bias was about 1% (for 1,000 and 1,500 sample size conditions), and the confidence interval coverage for most countries was in the range from 0.93 to 0.97, quite close to the desired 95% level. When simulations were run again for the alignment model for 58 countries, in all conditions, except that with 500 observations per group, the correlation between estimated and generated variances improved a bit and reached levels indicating acceptable estimation accuracy.
Thus, it seems that despite 1) the fairly high level of between-group variation in measurement parameters, especially intercepts, of the three-item LND model and 2) the failure of other methods to establish MI for that model, the alignment optimization method still allows for obtaining approximately comparable estimates of latent means and variances. This is encouraging news because the alignment-based mean and variance estimates can be safely used further for substantive analyses. This finding also clearly illustrates the power of the alignment method to approach cross-national comparability in a very complex setting, where other methods, including quite flexible Bayesian AMI tests, failed. Last, but not least, it has clear substantive importance: an outstanding degree of equivalence in the LND scale suggests that people in very different—in terms of their political regimes and political cultures—countries, share a very similar understanding of what features are essential characteristics of democracy.
One small but important final thing to discuss in this section is how different are mean ranking obtained with different methods. Figure 2 presents four pairwise comparisons, juxtaposing latent means obtained using MGCFA alignment and four other methods: 1) raw means (computed as the average score over three LND items) which are by far the simplest and most widely used method of estimating group scores on complex constructs in comparative research (Panel A); 2) latent means from the partial metric/scalar model (where the loadings and intercepts of “Equality” were freely estimated in all groups; Panel B); 3) latent means from the Bayesian AMI model with a prior variance of between-group differences equal to 0.1 (best-fitting Bayesian model; Panel C); 4) latent means from the Bayesian AMI model with a prior variance of between-group differences equal to 0.05 (second best-fitting Bayesian model; Panel D). According to these plots, the alignment-based means correlate quite strongly with the raw mean scores and with the means from the partial MI model. The correlations between the alignment-based means and the means from two Bayesian AMI models were considerably lower (correlations between Bayesian means and other types of means were also relatively low; see Supplementary Figure A2 in SM). This may suggest that the assumptions of the Bayesian AMI approach might not hold in the WVS data on LNDs. Notice also that despite the high correlation between the alignment estimates and the raw mean scores, the ranks of some countries differ significantly between the two methods. The same is true for the means from the partial MI model vs. the alignment means.
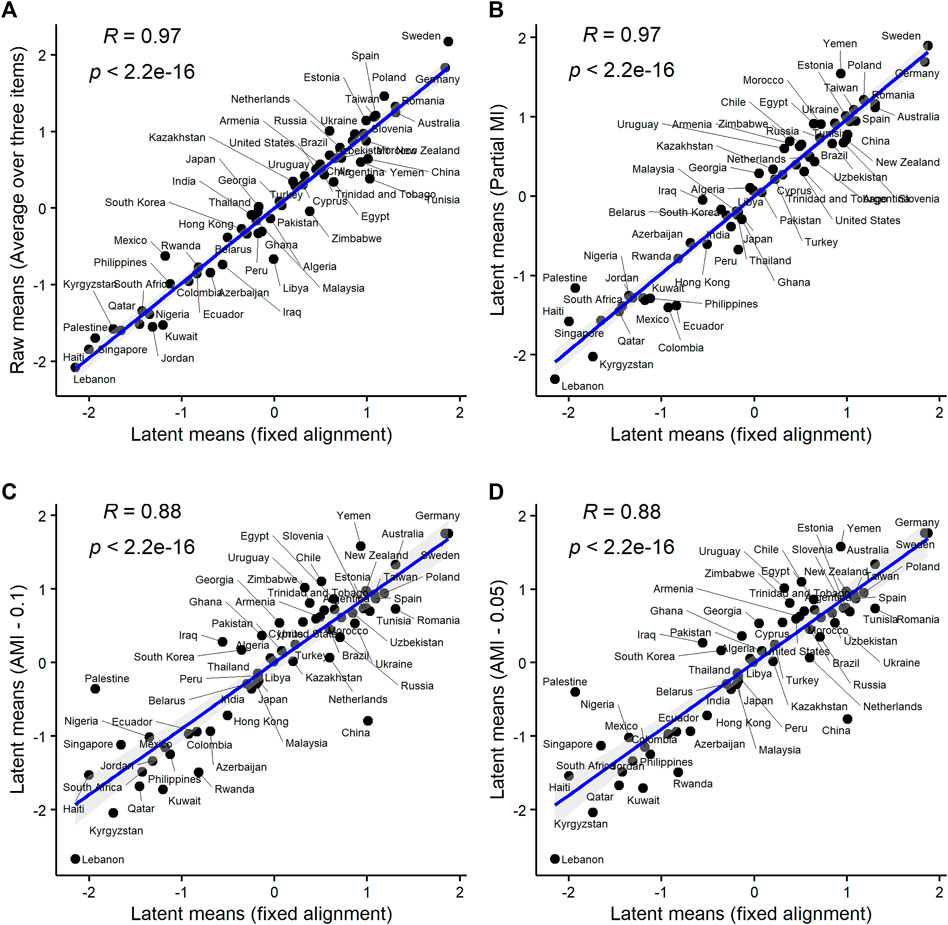
FIGURE 2. Latent means on LDNs from alignment optimization vs. latent means on LNDs obtained with other approaches. Notes: Data are from WVS round six (N = 89,565, 60 countries). All correlations are Spearman’s ⍴s. Raw means = the unweighted average scores over three LND items (Panel A). Partial MI = the latent mean estimates from the partial metric + scalar model (loadings and intercepts of “Equality” freely estimated; Panel B). AMI 0.1 = the latent means from the Bayesian AMI model with prior variance of between-group differences in measurement parameters of 0.1 (Panel C). AMI 0.05 = the latent means from the Bayesian AMI model with prior variance of between-group differences in measurement parameters of 0.05 (Panel D).
ANDs: Comparability Beyond MGCFA?
In their response to the critique of the measures of value priorities in the World Values Survey, based on the notion of measurement non-invariance (Alemán and Woods, 2016), Welzel and Inglehart (2016) (hereafter W and I) made several important claims about why multi-item constructs may sometimes exhibit comparability even if they fail to pass standard or even advanced, but more liberal, MGCFA-based invariance tests. Though W and I’s argumentation is not very convincing with respect to the measures (postmaterialist values and emancipative values) that it was originally designed to defend, there is some potential in using W and I’s ideas to prove the point that ANDs can be seen as a measurement instrument that is relatively comparable cross-nationally.
Three key points raised by W and I are the following. First, they note that many WVS attitudinal measures, contrary to a widespread misconception, are formative constructs, not reflective ones.22 Therefore, measurement validity (including cross-national comparability) of such constructs should not be assessed using reflective approaches (i.e., various correlation-based techniques, among which MGCFA is probably the most popular one). Second, W and I argue that WVS attitudinal measures are aimed at measuring exclusively culture-level phenomena, and therefore their validity should not be judged using individual-level covariance patterns (see also Akaliyski et al., 2021).23 Instead, and this is their third important point, it can be assessed using the strength of relationships between the construct of interest and its theoretically expected antecedents and consequences: if some measure is closely related, in a predictable and theoretically consistent manner, to other important aspects of reality, it should indeed capture something real and hence cannot be invalidated by small observed correlations between its indicators. Below, these arguments will be used to justify the approximate cross-national comparability of AND scores.
Are ANDs a Formative Construct?
Most scholars agree that the most important distinction between reflective and formative measurement models is that in the former constructs are causes of indicators, while in the latter indicators are causes of constructs (e.g., Jarvis et al., 2003; MacKenzie et al., 2005; Diamantopoulos et al., 2008; Bollen and Diamantopoulos, 2017). Still, it is unclear whether 1) being reflective or formative is an intrinsic property of a construct which ultimately determines the choice of measurement strategy, or 2) “constructs exist apart from their measurement” and therefore are neither reflective nor formative on their own, so the choice of an appropriate measurement approach is mostly driven by conceptual and empirical considerations relevant for a particular application (e.g., Wilcox et al., 2008, 1,220; Treiblmaier et al., 2011, 3).
The literature on formative measurement offers several guidelines for deciding on whether a particular construct is a reflective or formative one. Again, perhaps the most important criterion is what is the direction of causality in the measurement model: from construct to indicators or from indicators to construct. Some related considerations also deserve attention in this respect: 1) whether the construct exists at the same level (and so is a formative one) or at a deeper level (and so is a reflective one) of abstraction than its indicators (Law et al., 1998, 742–743) and 2) whether the construct exists independently of its indicators (reflective) or it is formed by its indicators (formative) (Coltman et al., 2008, 1,252). Other helpful24 criteria include the expected strength of pairwise correlations between the indicators of a construct, the degree of interchangeability among the indicators, and the structure of the nomological net of the indicators (Jarvis et al., 2003; Coltman et al., 2008). It is expected that the indicators of a reflective construct should be highly correlated with each other and therefore be interchangeable to a large extent, as well as have the same antecedents and consequences. In their turn, formative indicators need not (yet they may) be strongly interrelated, are not generally interchangeable (each covers a conceptually distinct part of the overall domain of a construct), and may have different antecedents or effects. Finally, in terms of statistical modeling, reflective indicators can be best understood as latent factors that manifest themselves in the variances and covariances of their indicators, while formative constructs are linear functions (or even composites) of their indicators (Bollen, 2011).
According to these criteria, it seems that LNDs likely do qualify as a reflective construct but ANDs do not. On one hand, democracy itself is nothing but a type of political regime that is characterized by the presence, or absence, of some constitutive features.25 Hence, the formative, or combinatorial, approach to the measurement of individual perceptions of the concept may be appealing. On the other hand, it is intuitively clear that it is a latent understanding of democracy that determines individual responses to the respective WVS questions, not the other way around. Furthermore, to be qualified as having a correct understanding of what democracy is, according to a particular operational definition of the term (like the one behind LNDs), a respondent needs to correctly recognize all features implied by that definition as essential for democratic regimes. If this reasoning is correct one should expect high correlations between different LND items and also some degree of interchangeability between them. It is true that some people may believe that free elections are essential for democracy but civic rights or gender equality is not, but this seems to be a largely theoretical possibility. Indeed, we already saw the LND items correlate with each other quite strongly both at the individual level and at the country level (see also Table 1 in K and W). Moreover, these correlations are remarkably similar across different countries. Thus, both theoretical considerations and empirical tests point to LNDs as a primarily reflective construct.
Consider now ANDs. If one misunderstands democracy in one way, it does not imply that the same person should share other misconceptions of the term as well. A highly religious individual may believe that religious authorities (but not the military) should play an important role in governing her country, while another individual, nonreligious and with a military background, may have a similar belief but about the primary role of the army (and not religious authorities). Of course, it is hard to say who of the two misunderstands democracy to a larger degree, but it is intuitively clear 1) that both have some difficulties with recognizing the meaning attributed to the term “democracy” by most political scientists and 2) that both are likely to misunderstand the term to a lesser extent than a third person who believes that giving political power to both religious leaders and high-rank military officers is essential for democracy. Furthermore, 3) what individual misunderstandings of democracy indeed reflect is not some kind of general latent misunderstanding, but rather individual social backgrounds This logic generalizes also to the aggregate level: there is nothing particularly striking in observing a high prevalence of the theocratic misunderstanding of democracy in a highly religious society. This nevertheless does not imply that it is mandatory for that society to have a high score also on the militarist misunderstanding.26
This hypothetical and highly stylized example makes it obvious that various indicators measuring the degree of misunderstanding of a normative, abstract construct should be treated as additive, not interchangeable. In other words, it is theoretically unjustified to require strong intercorrelations and, thus, interchangeability, between different indicators used to measure ANDs. Moreover, this measure does not even require equivalent indicator weights across countries, which is sometimes referred to as one of the important MI conditions for formative constructs (Diamantopoulos and Papadopoulos, 2010; Henseler et al., 2016). The immediate implication of this conclusion is that it would be inappropriate to use correlation-based SEM methods to assess cross-national comparability of this measure in particular and measurement validity in general. Still, as (Edwards and Bagozzi, 2000, p. 171) note that “It is bad practice to (…) claim that one’s measures are formative, and do nothing more.” What one could do to prove validity of ANDs? Here another key point raised by W and I comes into play: if internal validity of a measure (which reflects the strength of correlations between the construct and its indicators) cannot be assessed or is not applicable at all, then the measure should demonstrate strong external linkages with other theoretically relevant variables to be considered meaningful.
Exploring the Nomological Nets of the AND Items
K and W provided impressive evidence of strong individual- and aggregate-level correlations between ANDs and their theoretical antecedents. The analysis below extends their results and shows that 1) the cross-national differences in means of specific AND items are best explained by different, item-specific historical legacies (although the effects of different legacies overlap to a large extent across AND items) and that 2) the signal-to-noise ratio for ANDs is sufficiently high to consider this measure as invalid or incomparable, at least at the country level. For the sake of brevity, and also because it is the comparability of aggregated scores that constitutes the central theme both in the mainstream MI literature and in the Welzel-Inglehart alternative approach to the matter, in what follows, the focus is exclusively on the aggregate-level nomological nets of ANDs.
As an aggregate-level quantity, ANDs are likely to reflect the impact of various national-specific historical legacies on nowadays political cultures of WVS societies. Recall also that since ANDs are likely to be a formative measure, its indicators may have different antecedents. For example, it is natural to hypothesize that people in more religious countries may be more supportive of various kinds of theocratic rule, while people in more violent countries may be more supportive of military rule.27,28 To test these predictions, two measures of religiosity, the share of self-reported Muslims in the national population,29 according to WVS-6, and the average level of religiosity in the country, are used.30 In addition, what K and W call the repression score is used to approximate the level of political violence and repression in the country is used.31
Then, K and W argue that ANDs can be meaningfully predicted by the level of societal modernization, reflected in the prevalence of emancipative values (Welzel, 2013). However, it is preferable to measure emancipative values using only one specific component of that construct, the “Choice” index,32 which was shown to be relatively invariant across WVS-6 countries (Sokolov, 2018). The LND score is also added as a potential predictor of nation-level ANDs.
Importantly, to ensure the validity of ANDs the correlations of AND items with their theoretical antecedents should be stronger than their correlations with various indicators of measurement error. If they are not, it means that the share of measurement noise in these scores is likely larger than the “signal,” or imprints of systematic culture-level processes relating ANDs and other structural variables. The study follows K and W and uses four distinct proxies of typical instances of survey measurement errors, measuring per country the proportion of 1) missing responses,33 2) contradictory responses,34 3) affirmative responses,35 and 4) duplicate responses.36 For a detailed description of all variables used in this section, please see the original K and W paper and the online appendix to it.
The correlations between country mean scores on “Religion” and “Army” on one hand and various substantive aggregate-level variables, as well as proxies for country-level measurement error, on the other hand, are shown in Table 5. The key observations are 1) the strongest correlation for “Religion” is with the average religiosity, while for “Army” it is with the repression score; 2) the correlations of both items with theoretically relevant variables are generally stronger than their correlations with measurement error indicators; 3) among measurement error indicators only two, the proportion of contradictory responses and the affirmation rate, are significantly related to AND items. These findings suggest that the cross-national variation in the means of two AND items reflects substantive macro-level processes to a larger extent than measurement error. They also show that the nomological nets of different items are not perfectly identical, thus justifying their amalgamation into a single summary score.37
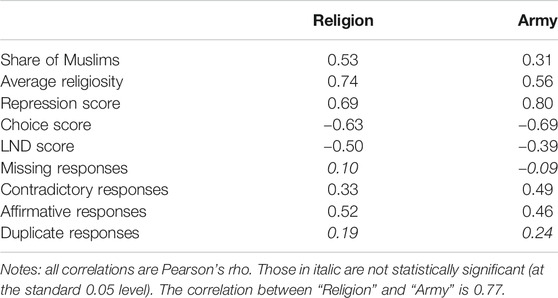
TABLE 5. Correlations between national means of two AND items and their various expected antecedents.
Regression-based evidence presented in Table 6 further confirms conclusions from correlational analyses. The first two models in Table 6 show the effects of various substantive and data quality variables (same as presented in Table 5) on the national means of “Religion” and “Army.” As expected, the mean on “Religion” is best predicted by the average religiosity (std. β = 0.63). The effect of another religious variable, the share of the Muslim population, is also statistically significant, but weaker (std. β = 0.28). The only two other significant variables are the repression score (std. β = 0.51) and the rate of affirmative responses (std. β = 0.30). As to “Army,” the only significant effect is that of the level of repression (std. β = 0.71). The third model in Table 6 shows the effects of the same variables on the total country-level AND score. The fourth model does the same but uses only significant predictors from Model 3, which are, quite predictably, the average religiosity (std. β = 0.37), the repression score (std. β = 0.56), and the average “affirmativeness” (std. β = 0.26). Noticeably, the adjusted R2 of Model 4, which excludes most data quality measures and also some substantive variables, is essentially as high as the adjusted R2 of Model 3. Again, it is clear that substantive factors, the country-level religiosity and the level of repression, play a much more important role in determining national scores on ANDs,38 than measurement error.
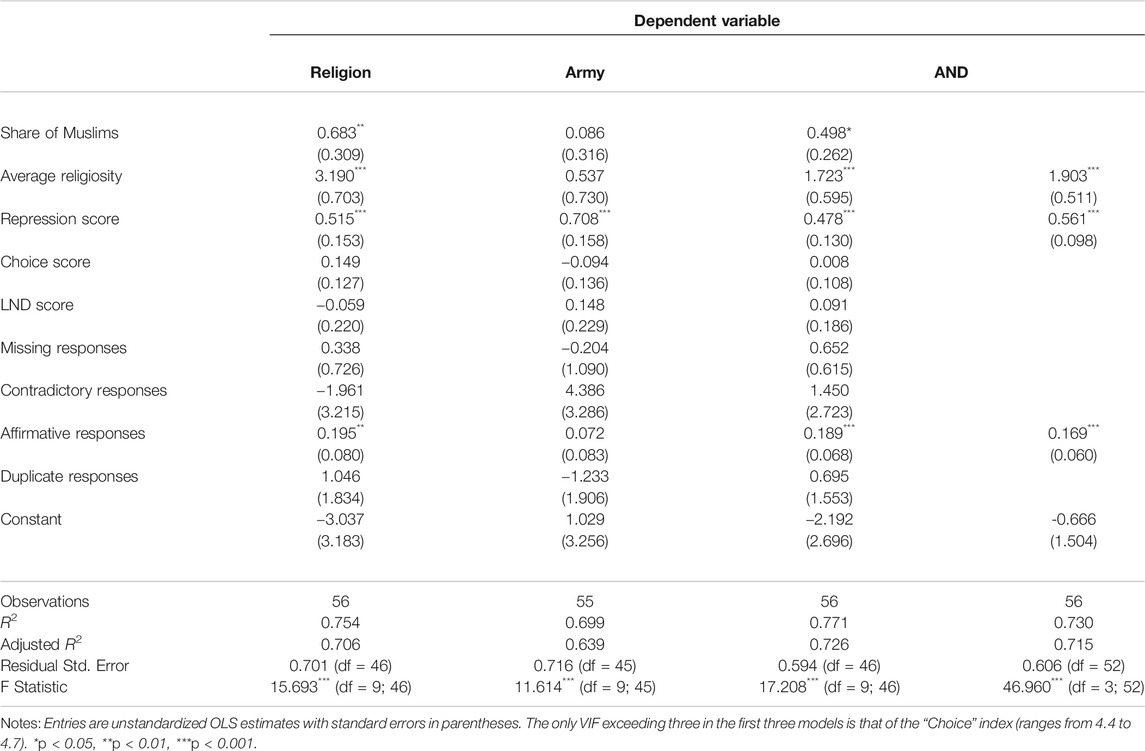
TABLE 6. Regressions of ANDs on their substantive antecedents and data quality indicators.
These findings clearly illustrate that ANDs are a meaningful measure since it captures effectively the relationships between historical legacies and national political cultures (in terms of prevalent democratic attitudes). One may nonetheless wonder why we need to use ANDs in, say, models of democratic sustainability or democratic transitions if this measure is just a reflection of some aggregate-level influences. Why do we not use the presumably exogenous driving forces behind ANDs as explanatory factors in such models directly? The answer is because ANDs, while indeed not being a truly exogenous variable, still can be seen as an important mediating variable that helps to advance our understanding of the macro-micro-macro mechanism through which cultural and structural factors affect political outcomes, and therefore is a valuable measure on its own.
Further Considerations on Comparability of Formative Measures
The results presented in the previous two sections suggest that ANDs reflect some meaningful culture-level processes and therefore it may be a useful attitudinal summary in comparative political research. This does not mean that the national scores on ANDs are a perfectly reliable measure of cross-national differences in the respective construct. Since these scores are computed (by K and W and in the current study) as the average scores across three WVS items, they can be seen as what Bollen and Diamantopoulos (2017) in their typology of formative and composite models called Specification C: a measurement model that involves conceptually related indicators, uses fixed and equal indicator weights set in advance, and does not take into account measurement error at either the indicator or the construct level.39 In addition, obviously not all possible misunderstandings are covered by the WVS collection of indicators of ANDs.
Therefore, the resulting measure of ANDs is unavoidably noisy and contaminated with multiple measurement artifacts. Importantly, even if one uses ANDs as a country-level variable, the respective national mean scores are still computed using individual responses, and the latter, in turn, may be affected by various random factors that may cause observed personal scores on each indicator to be different from the true opinions that a respondent holds with respect to one or another AND. These errors may be person-specific, such as response style (related to unmeasured personality traits), or emotional condition at the time of interview (produced by a unique constellation of various environmental effects). Such influences are typically distributed randomly so they are not so dangerous for the validity of population-level estimates, such as mean scores or various covariance coefficients since they mostly cancel each other out in the aggregate (Welzel and Inglehart 2016). However, systematic, society-level errors are also possible, which may significantly bias the estimated country mean scores compared to the unobserved true scores: data collection errors (e.g., incorrect translation of a survey item, using an unrepresentative sample for a given country, etc.; see Davidov et al., 2014). The latter type of error poses the most important danger to the measurement validity of ANDs as a comparative measure.
Fortunately, the presence of country-level bias is often not critical, either. First, if the country-specific biases do not correlate systematically with either true national scores on the measured construct or its hypothesized causes or effects, or both, then the imperfect measurement leads to the underestimation of the structural coefficients involving the construct of interest (because the bias increases the variance of the measured score, compared to the variance of the true score: Carroll et al., 2006, 42–43; Greenwood, 2012, 39). This can hardly undermine the validity of statistically significant aggregate-level relationships. If the country-level measurement error correlates systematically with the true construct scores or their antecedents of consequences, this may influence structural coefficients in a more sophisticated way. But even in this case researchers can construct some proxies for country-level measurement biases and use them as control variables in country-level inferential analyses or apply various methods of direct modeling of measurement error. An extensive review of available options can be found in Carroll et al. (2006).
Of course, due to the aforementioned shortcomings, both individual and aggregate scores obtained in a similar fashion to ANDs may be less reliable than model-based scores. Yet, the ultimate decision whether such scores are useful and valid should be made with respect to the scientific goal of a particular study. If it is to obtain the highest numerical precision possible with respect to the key quantities of interest (that is, to obtain, at first, unbiased estimates of individual and mean scores, and then individual- and/or country-level regression coefficients, based on those scores as inputs), then such measures as ANDs are undoubtedly problematic since using them we should make a lot of assumptions that are very hard to justify. If, however, the goal is to uncover theoretically and practically important relationships between some political variables (that is, detect correct estimates of the direction of respective effects), then even such imperfect measures as ANDs may be useful.
Many applied researchers interpret measurement invariance (or its absence) as evidence in favor (or against) the claim that people in different countries understand some construct of interest in the same way. It is much less acknowledged, however, that the current machinery of measurement invariance testing using latent variable models concentrates primarily on establishing equivalence of numeric estimates of latent scores in different countries. This is not the same as establishing cognitive or substantive equivalence. First, even achieving full scalar invariance may be insufficient to prove cognitively equivalent understanding of a construct by respondents from different countries, and therefore numeric tests should be complemented by further qualitative checks, such as cognitive interviews (Meitinger, 2017). Second, the lack of MI does not necessarily imply the lack of cognitive equivalence: it is essentially this intuition that drives the development of various novel approximate approaches to invariance testing and also sensitivity-assessment methods (Meuleman, 2012; Obersky, 2014). Numerical inequivalence is annoying since it prevents us from obtaining precise statistical estimates of various interesting effects. Yet, it is the strictest level of (broadly understood) measurement invariance. Sometimes even imperfect measures may provide insightful results if our key interest is not numbers but effect directions.
Final Remarks
This article sought to provide a comprehensive, but at the same time accessible to non-statisticians, guide to the assessment of the comparability of survey-based attitudinal constructs. First, the basics of the so-called measurement invariance approach to comparability, using the multiple-group confirmatory factor analytic framework, are introduced. Then, the study presented an overview of two flexible extensions of the standard MGCFA approach to MI, especially suitable for applications to large, and highly heterogeneous, cross-national datasets (such as the European Social Survey or the World Values Survey), namely, the Bayesian approximate MI and the alignment optimization approach. Next, the central MI concepts and methods are illustrated alongside the main substantive and technical issues arising in their practical applications by using the aforementioned approaches to examine measurement invariance of two recently introduced measures of democratic attitudes, the liberal and the authoritarian notions of democracy.
With respect to LNDs, one can obtain cross-nationally comparable latent scores on that measure using the MGCFA alignment optimization method. This is an important result from the methodological point of view since it illustrates that novel methods of invariance testing, more flexible than the standard MGCFA approach, may be extremely useful for political scientists searching for cross-nationally comparable measures of theoretically interesting attitudinal constructs. Establishing the cross-national comparability of LNDs is no doubt important in substantive terms as well, although the discussion of its theoretical implications goes beyond the scope of the current article.
The ANDs, while not fitting even the basic requirement of configural invariance, could still be considered a meaningful comparative measure of democratic attitudes for three reasons: 1) it does not require, conceptually, strong intercorrelations of its indicators, therefore its validity cannot be accurately assessed using MGCFA-based tools; 2) it nevertheless demonstrates high and theoretically consistent correlations with some structural and attitudinal variables, especially at the aggregate level; 3) the contribution of measurement error to the cross-national variation in ANDs is not as large (at least compared to various substantive factors) and can be, to some extent, controlled by researchers.
A distinct, and perhaps more important, contribution of this study related to ANDs is that it clearly showcases that not all theoretically relevant constructs can be operationalized using the reflective measurement approach (which underlies essentially all modern comparability testing methods, from MGCFA, the by far most popular one, to IRT, to LCA). The study also briefly discussed what can be used as comparability criteria for formative measures, advancing the argument that their comparability can be anchored in their nomological nets. Yet, it is obvious that comparative researchers urgently need much more general and comprehensive guidelines for the assessment of measurement invariance of survey-based attitudinal variables. Perhaps two key avenues for further research in this regard are 1) further development of decision criteria for approximate MI methods (i.e., Bayesian AMI and alignment optimizations) and 2) deeper, full-scale examination of the measurement properties of formative constructs in comparative settings.
Data Availability Statement
Data and code (R and MPLUS scripts) necessary to reproduce all results reported in the main text of this article and in the Supplementary Material can be obtained from the author upon request. The WVS data are also publicly available and can be found here: http://www.worldvaluessurvey.org/WVSDocumentationWV6.
Ethics Statement
Ethical approval was not provided for this study on human participants because the paper analyzes secondary anonymous survey data collected by a third-party organization. Written informed consent for participation was not required for this study in accordance with the national legislation and the institutional requirements.
Author Contributions
The author confirms being the sole contributor to this work and has approved it for publication.
Funding
The article was prepared within the framework of the HSE University Basic Research Program.
Conflict of Interest
The author declares that the research was conducted in the absence of any commercial or financial relationships that could be construed as a potential conflict of interest.
Publisher’s Note
All claims expressed in this article are solely those of the authors and do not necessarily represent those of their affiliated organizations, or those of the publisher, the editors and the reviewers. Any product that may be evaluated in this article, or claim that may be made by its manufacturer, is not guaranteed or endorsed by the publisher.
Supplementary Material
The Supplementary Material for this article can be found online at: https://www.frontiersin.org/articles/10.3389/fpos.2021.642283/full#supplementary-material
Abbreviations
K and W, Kirsch and Welzel (2019); W and I, Welzel and Inglehart (2016); MI, measurement invariance; AMI, approximate measurement invariance; MGCFA, multiple-group confirmatory factor analysis; CFA, confirmatory factor analysis; EFA, exploratory factor analysis; LNDs, liberal notions of democracy; ANDs, authoritarian notions of democracy; WVS, world values survey; SM, supplementary material.
Footnotes
1In what follows I use the terms “measurement equivalence” and “measurement invariance” as interchangeable.
2Sometimes severely; see Online Appendices C and D to Sokolov (2018; pp. 26–29 in the online supplementary materials).
3If, for example, a researcher wants to estimate an (presumably causal) effect of a nation-level cultural variable X (e.g., prevalence of a particular attitude) on another nation-level cultural variable Y (e.g., average support for a specific type of political regime), and both X and Y are measured using nonequivalent instruments.
4Perhaps the most important such debate (lasting for at least 3 decades) concerns comparability of various measures of value priorities developed by Ronald Inglehart and his coauthors, such as the index of post-materialist values or the index of emancipative values. For more information on the subject and history of the debate see recent contributions by Alemán and Woods (2016), Welzel and Inglehart (2016), Sokolov (2018), and Welzel et al. (2021), as well as references therein.
5Other popular approaches are item response theory, or IRT (e.g., Stegmueller, 2011), and latent class analysis, or LCA (e.g., Kankaraš et al., 2010; Rudnev, 2018).
6The focus of this article is on MI in cross-national research so I refer to countries as a typical group-level unit of observation throughout the article. However, the same principles of MI testing apply to essentially any grouping variable that may affect measurement properties of a survey-based instrument, e.g., subnational geographical units, survey round or mode, etc.
7Notice also that in models with more than one factor all items that are not supposed to be related to a particular construct should not load high on that construct in all countries. In the CFA setting, it implies the requirement of no significant cross-loadings between indicators and their nontarget factors in any country. In addition, correlations between factors should be considerably smaller than ones in all groups, i.e., the model should demonstrate a reasonable level of discriminant validity (Steenkamp and Baumgartner, 1998, 80).
8For well-fitting models, the χ2 statistic is expected to be insignificant. It should nonetheless be noticed that this fit statistic is known to be quite sensitive to even minor model misspecification with large samples, typical for cross-national surveys. CFI stands for “Comparative Fit Index.” This measure is restricted to a 0−1 range, with values closer to 1 (typically, higher than 0.9 or 0.95) indicating a good fit. RMSEA stands for “Root Mean Square Error of Approximation.” This measure varies from 0 to 1, with values lower than 0.05 indicating an acceptable model fit (Browne and Cudeck, 1993, 144). Finally, SRMR stands for “Standardized Root Mean Square Residual.” It can take a range of values between 0.0 and 1.0, with smaller values indicating better fit. (Hu and Bentler, 1999; Brown, 2015, Ch. 3; Kline, 2015, Ch. 8).
9I am not aware of a universally accepted criterion of being “substantively large” for factor loadings in cross-national research. One possible, although perhaps too liberal, the threshold is to have a standardized estimate greater than 0.3, which is sometimes cited as a cutoff for critically small loadings in single-population CFA models (e.g., Brown, 2015, 115).
10These authors claim that the SRMR is generally not a reliable indicator of the overall goodness-of-fit in large samples.
11This approach is often criticized for various shortcomings inherently related to the idea of using post hoc adjustments to find a well-fitting model specification without a sufficient a priori theoretical justification for such adjustments. As (Marsh et al., 2018, 525) note, “the stepwise selection process of relaxing invariance constraints one parameter at a time is highly cumbersome, idiosyncratic, and likely to capitalize on chance so that the final solution is not replicable.”
12Another option is the R package sirt (Robitzsch, 2019). For a general overview or MI testing possibilities of the R environment for statistical computing see Fischer and Karl (2019).
13Both approaches can also be used together (Asparouhov and Muthén, 2014).
14http://www.worldvaluessurvey.org/WVSContents.jsp?CMSID=FieldworkSampling.
15Perhaps due to the presence of that cross-loading, and also to the small number of indicators per construct, internal consistency measures for the models had quite low values (Cronbach’s α = 0.54, McDonald’s ω = 0.65, Average Variance Extracted = 0.37).
16With only two indicators of ANDs, the two-factor model did not even converge.
17Rutkowski and Svetina formulated their recommendations using simulation evidence from the 10- and 20-group settings, while WVS-6 includes a highly diverse set of 60 countries.
18Notice that in each model the same prior variance was assumed for differences in each measurement parameter (three loadings and three intercepts). In principle, nothing prevents one from using different prior variances for different measurement parameters, but all applications of the Bayesian AMI approach I am aware of, used the single prior variance value for all parameters.
19In a very nutshell, in the context of Bayesian structural equation modeling, the PPP represents a proportion of MCMC iterations for which the standard χ2 test statistic for the estimated model is smaller than the analogous statistic for the model fitted to a new data set, of the same size as the original data, but generated using parameter values at the ith iteration (Muthen and Asparouhov, 2012, 315). For a more general discussion of posterior predictive checking, see Gelman et al. (2013).
20It was possible to test LNDs for partial AMI, but the only, to my knowledge, simulation study exploring the performance of partially invariant AMI models found its questionable, especially when the number of items used in the model is small (Pokropek et al., 2019). Indeed, when I attempted to estimate a partially metric and scalar-invariant model (where both the loading and the intercept of the “Equality” item were allowed to vary across groups freely), I found that its convergence speed was prohibitively slow—so slow that I was forced to stop the estimation process that had been lasting for more than 2 days to the moment while estimating any of the models reported in Table 2 took no more than a few hours. Another opportunity was to remove countries where the three-item model of LNDs did not fit well and repeat the Bayesian AMI tests with a smaller set of more comparable countries, but that strategy also had its own shortcomings, already discussed above, in the section on MI testing methods. I nevertheless provided in the SM (see Supplementary Table A4) a list of countries with the lowest PPP values for models with different prior variances. Most of them were Muslim countries, and indeed, removing three of the most problematic ones, which were Kuwait, Yemen, and Jordan, resulted in the PPP of 0.436 for the model with a prior variance of 0.05 fitted to the data from the remaining 57 countries.
21E.g., the R2 for the loading of the “Rights” item was 0.3, with only 12% of countries having significantly different values of that parameter, while the R2 for the intercept of the same item (55% non-invariance) was 0.76!
22W and I use the terms “combinatorial” and “dimensional,” instead of “formative” and “reflective,” respectively, but I prefer, in order to avoid confusion, to use the latter terms, which are conventions in the measurement literature.
23Whether this particular argument works for ANDs or not is unclear. It is possible to quantify the amount of total variation of a variable that is due to the influence of various country-level factors using a measure known as the Intraclass Correlation Coefficient, or ICC. Item-specific ICCs for the AND items are 0.184 (v132), 0.159 (v135), and 0.180 (v138), and the ICC for the total score (computed as the arithmetic average over the three items) is 0.248. This suggests that up to a quarter of the total variance in ANDs comes from the differences between countries. This is about twice as large the same quantity for LNDs (for the LND items ICCs are 0.076 (v133), 0.064 (v136), and 0.095 (v139), and for the overall score the ICC is 0.095), but not as high in absolute terms, because the remaining 75% of the total variance is due to individual differences. In addition, the AND items ask respondents about their own beliefs about democracy, not about what most people in their country think about the importance of various features for democracy, while it is sometimes recommended that item referents should focus on the cluster, not the individual, to measure cluster-level constructs properly (Fischer, 2009; Stapleton et al., 2016). At the same time, as W and I claim, referring to Alwin (2007), 50 percent and more of the variance in individual-level survey data may be random noise. Thus, the actual ratio of the aggregate-level variance to the meaningful individual-level variance in ANDs may be somewhat smaller than the ICC-based estimate of one third. Overall, ANDs (even more so LNDs) are not an exclusively country-level construct, but their between-country variation is, of course, not trivial.
24Although, as Wilcox et al. (2008) and Bollen and Diamantopoulos (2017) note, neither necessary nor sufficient.
25Of course, various authors may argue for different features to be important, but those three selected by K and W to measure LNDs would not likely be challenged by most mainstream political scientists. See Held (2006) for the overview of major theories of democracy.
26Even in the reflective paradigm, it is sometimes acknowledged that different indicators may be used to measure culture-specific components of the same concept in different contexts, provided that there is also a set of “core” indicators invariantly used in all groups under comparison (Przeworski and Teune 1966; Boehnke et al., 2014).
27Either because they tend to associate it with a higher level of order and stability in society, or because of some sort of institutional learning, or because of simply falsifying their preferences to adjust what they tell to interviewers with what they expect authorities would like them to tell.
28In this section I focus on two particular AND items, “Religion” and “Army.” “Obedience” is not considered, as the results reported above suggest that this item may be a poor measure of ANDs.
29It is measured by the following WVS-6 question (V144): “Do you belong to a religion or religious denomination? If yes, which one.”
30This variable is based on WVS round-six questions V19, V145, and V152. For more details on its construction, see Online appendix to K and W, pp. 16–17.
31It is a standardized factor score from an EFA model with three indicators: (a) Gibney et al. (2016) “political terror score,” (b) Cingranelli and Richards’s index of “physical integrity rights,” and (c) the Reporters sans Frontiers’ “press freedom index.“
32This construct reflects how acceptable respondents find (a) divorce, (b) abortion, and (c) homosexuality (V203-205 in the WVS-6 questionnaire).
33This is a dummy variable assigning interviewees code 1 when they did not respond to at least two of the items used to calculate the AND-index and 0 otherwise.
34This is a dummy variable assigning interviewees code 1 when they answered two questions on the importance of politics in one’s life and one’s political interest in the most contradictory way, using WVS-6 questions V7 and V84.
35This is a continuous variable measuring the extent to which respondents tend to take the most affirmative (agreeable) option on four questions about the importance of science-vs.-religion (coded as V153-156 in the WVS-6 codebook), despite the fact that the polarity of these four questions points two times in favor of science and another two times in favor of religion.
36Duplicate cases refer to respondents who give identical answers over a defined set of variables. K and W identify duplicate cases over the first 65 substantive variables in the country-pooled individual-level dataset of the round-six WVS. Duplicate respondents are indicated by a dummy variable, using code 1 for duplicate respondents and 0 for unique respondents.
37Collapsing different formative indicators into a single measure allow us to capture nonoverlapping effects. This strengthens the link between the overall measure and its predictors or effects, relative to the links between specific indicators and the same predictors/effects.
38At the same time, my results differ from the results of K and W in that I fail to find any systematic effect of emancipative values on ANDs. This is likely due to the differences in operationalizations of values between this study and K and W, but since it does not matter much for my general argument for comparative validity of ANDs, I do not discuss this finding further.
39In theory, it is possible to estimate indicators’ weights and construct-level measurement error for formative measures empirically, using a so-called multiple-indicator multiple-cause (MIMIC) modeling approach, where some (typically two or more) reflective indicators, or endogenous reflective factors, are added to the model as effects of the formative construct (Jarvis et al., 2003; Bollen and Diamantopoulos, 2017). However, this mixed formative-reflective operationalization of the construct of interest may often be theoretically implausible. Furthermore, the resulting estimates, and therefore the overall empirical interpretation of the focal formative measure, may be sensitive to the choice of the reflective indicators (this phenomenon is often referred to as interpretational confounding: e.g., Wilcox et al., 2008). Exactly for this reason the reflective model parameters are required to be at least metric invariant in comparative contexts (Diamantopoulos and Papadopoulos, 2010, p. 363). Overall, it is often difficult to find appropriate reflective indicators of formative constructs in practice. For example, an attempt was made to estimate a MIMIC model of ANDs by using two WVS items, measuring (a) how important it is for a respondent to live in a democratic country and (b) how democratically is a respondent’s country actually being governed, as reflective indicators of ANDs. The global model fit turned out to not be miserable, at least, in the pooled WVS-6 sample:
References
Alemán, J., and Woods, D. (2016). Value Orientations From the World Values Survey: How Comparable are They Cross-Nationally?. Comp. Polit. Stud. 49, 1039–1067. doi:10.1177/0010414015600458
Akaliyski, P., Bond, M. H., and Welzel, C. (2021). Nations as Gravitational Fields of Culture: In Defence of "Nationology". SocArXiv [preprint]. doi:10.31235/osf.io/94msk
Almond, G., and Verba, S. (1963). The Civic Culture: Political Attitudes and Democracy in Five Nations. Princeton, NJ: Princeton University Press.
Alwin, D. F. (2007). Margins of Error: A Study of Reliability in Survey Measurement. Hoboken, New Jersey: John Wiley & Sons.
Ariely, G., and Davidov, E. (2012). Assessment of Measurement Equivalence with Cross-National and Longitudinal Surveys in Political Science. Eur. Polit. Sci. 11, 363–377. doi:10.1057/eps.2011.11
Ariely, G., and Davidov, E. (2011). Can We Rate Public Support for Democracy in a Comparable Way? Cross-National Equivalence of Democratic Attitudes in the World Value Survey. Soc. Indic. Res. 104, 271–286. doi:10.1007/s11205-010-9693-5
Ariely, G. (2015). Democracy-Assessment in Cross-National Surveys: A Critical Examination of How People Evaluate Their Regime. Soc. Indic. Res. 121, 621–635. doi:10.1007/s11205-014-0666-y
Asparouhov, T., and Muthén, B. (2014). Multiple-group Factor Analysis Alignment. Struct. Equation Model. A Multidisciplinary J. 21, 495–508. doi:10.1080/10705511.2014.919210
Boehnke, K., Arnaut, C., Bremer, T., Chinyemba, R., Kiewitt, Y., Koudadjey, A. K., et al. (2014). Toward Emically Informed Cross-Cultural Comparisons. J. Cross-Cultural Psychol. 45, 1655–1670. doi:10.1177/0022022114547571
Bollen, K. A., and Diamantopoulos, A. (2017). In Defense of Causal-Formative Indicators: A Minority Report. Psychol. Methods 22, 581–596. doi:10.1037/met0000056
Bollen, K. A. (2011). Evaluating Effect, Composite, and Causal Indicators in Structural Equation Models. MIS Q. 35, 359–372. doi:10.2307/23044047
Bollen, K., and Lennox, R. (1991). Conventional Wisdom on Measurement: A Structural Equation Perspective. Psychol. Bull. 110, 305–314. doi:10.1037/0033-2909.110.2.305
Brosseau-Liard, P. E., and Savalei, V. (2014). Adjusting Incremental Fit Indices for Nonnormality. Multivariate Behav. Res. 49, 460–470. doi:10.1080/00273171.2014.933697
Brosseau-Liard, P. E., Savalei, V., and Li, L. (2012). An Investigation of the Sample Performance of Two Nonnormality Corrections for RMSEA. Multivariate Behav. Res. 47, 904–930. doi:10.1080/00273171.2012.715252
Brown, T. A. (2015). Confirmatory Factor Analysis for Applied Research. 2nd Edn. New York, NY: Guilford Press.
Browne, M. W., and Cudeck, R. (1993). “Alternative Ways of Assessing Model Fit,” In Testing Structural Equation Models. Editors K. A. Bollen, and J. S. Long (Newbury Park, CA: Sage), 136–162.
Byrne, B. M., Shavelson, R. J., and Muthén, B. (1989). Testing for the Equivalence of Factor Covariance and Mean Structures: the Issue of Partial Measurement Invariance. Psychol. Bull. 105, 456–466. doi:10.1037/0033-2909.105.3.456
Carroll, R. J., Ruppert, D., Stefanski, L. A., and Crainiceanu, C. M. (2006). Measurement Error in Nonlinear Models: A Modern Perspective. 2nd Edn. London, UK: Chapman & Hall.
Chen, F. F. (2007). Sensitivity of Goodness of Fit Indexes to Lack of Measurement Invariance. Struct. Equation Model. A Multidisciplinary J. 14, 464–504. doi:10.1080/10705510701301834
Cheung, G. W., and Rensvold, R. B. (2002). Evaluating Goodness-Of-Fit Indexes for Testing Measurement Invariance. Struct. Equation Model. A Multidisciplinary J. 9, 233–255. doi:10.1207/S15328007SEM0902_5
Cieciuch, J., Davidov, E., Schmidt, P., Algesheimer, R., and Schwartz, S. H. (2014). Comparing Results of an Exact vs. An Approximate (Bayesian) Measurement Invariance Test: a Cross-Country Illustration with a Scale to Measure 19 Human Values. Front. Psychol. 5, 982. doi:10.3389/fpsyg.2014.00982
Claassen, C. (2020). Does Public Support Help Democracy Survive?. Am. J. Polit. Sci. 64, 118–134. doi:10.1111/ajps.12452
Coltman, T., Devinney, T. M., Midgley, D. F., and Venaik, S. (2008). Formative versus Reflective Measurement Models: Two Applications of Formative Measurement. J. Business Res. 61, 1250–1262. doi:10.1016/j.jbusres.2008.01.013
Coppedge, M. (2012). Democratization and Research Methods. New Uork, NY: Cambridge University Press.
Davidov, E., Dülmer, H., Cieciuch, J., Kuntz, A., Seddig, D., and Schmidt, P. (2018). Explaining Measurement Nonequivalence Using Multilevel Structural Equation Modeling. Sociological Methods Res. 47, 729–760. doi:10.1177/0049124116672678
Davidov, E. (2009). Measurement Equivalence of Nationalism and Constructive Patriotism in the ISSP: 34 Countries in a Comparative Perspective. Polit. Anal. 17, 64–82. doi:10.1093/pan/mpn014
Davidov, E., Meuleman, B., Cieciuch, J., Schmidt, P., and Billiet, J. (2014). Measurement Equivalence in Cross-National Research. Annu. Rev. Sociol. 40, 55–75. doi:10.1146/annurev-soc-071913-043137
Diamantopoulos, A., and Papadopoulos, N. (2010). Assessing the Cross-National Invariance of Formative Measures: Guidelines for International Business Researchers. J. Int. Bus. Stud. 41, 360–370. doi:10.1057/jibs.2009.37
Diamantopoulos, A., Riefler, P., and Roth, K. P. (2008). Advancing Formative Measurement Models. J. Business Res. 61, 1203–1218. doi:10.1016/j.jbusres.2008.01.009
Edwards, J. R., and Bagozzi, R. P. (2000). On the Nature and Direction of Relationships Between Constructs and Measures. Psychol. Methods. 5, 155–174. doi:10.1037/1082-989X.5.2.155
Fischer, R. (2009). Where is Culture in Cross-Cultural Research? An Outline of a Multilevel Research Process for Measuring Culture as a Shared Meaning System. J. Cross-Cult. Manag. 9, 25–49. doi:10.1177/1470595808101154
Fischer, R., and Karl, J. A. (2019). A Primer to (Cross-cultural) Multi-Group Invariance Testing Possibilities in R. Front. Psychol. 10, 1507. doi:10.3389/fpsyg.2019.01507
Flake, J. K., and McCoach, D. B. (2018). An Investigation of the Alignment Method with Polytomous Indicators under Conditions of Partial Measurement Invariance. Struct. Equation Model. A Multidisciplinary J. 25, 56–70. doi:10.1080/10705511.2017.1374187
Gelman, A., Carlin, J. B., Stern, H. S., Dunson, D. B., Vehtari, A., and Rubin, D. B. (2013). Bayesian Data Analysis. Boca Raton, FL: CRC Press.
Gibney, M., Cornett, L., Wood, R., Haschke, P., and Arnon, D. (2016). The Political Terror Scale 1976-2015. Available online at: http://www.politicalterrorscale.org. (Stand: 26.10. 2016).
Greenwood, D. C. (2012). “Measurement Errors in Epidemiology,” in Modern Methods for Epidemiology. Editors Y.-K. Tu, and D. C. Greenwood (Dordrecht: Springer), 33–55. doi:10.1007/978-94-007-3024-3_3
Henseler, J., Ringle, C. M., and Sarstedt, M. (2016). Testing Measurement Invariance of Composites Using Partial Least Squares. Int. Market. Rev. 33, 405–431. doi:10.1108/IMR-09-2014-0304
Hu, L. T., and Bentler, P. M. (1999). Cutoff Criteria for Fit Indexes in Covariance Structure Analysis: Conventional Criteria versus New Alternatives. Struct. Equation Model. A Multidisciplinary J. 6, 1–55. doi:10.1080/10705519909540118
Inglehart, R. (1990). Culture Shift in Advanced Industrial Society. Princeton, NJ: Princeton University Press.
Inglehart, R. (1977). The Silent Revolution: Changing Values and Political Styles Among Western Publics. Princeton, NJ: Princeton University Press.
Inglehart, R., and Welzel, C. (2010). Changing Mass Priorities: The Link between Modernization and Democracy. Persp Pol. 8, 551–567. doi:10.1017/S1537592710001258
Inglehart, R., and Welzel, C. (2005). Modernization, Cultural Change, and Democracy: The Human Development Sequence. Cambridge, MA: Cambridge University Press.
Jang, S., Kim, E. S., Cao, C., Allen, T. D., Cooper, C. L., Lapierre, L. M., et al. (2017). Measurement Invariance of the Satisfaction with Life Scale across 26 Countries. J. Cross-Cultural Psychol. 48, 560–576. doi:10.1177/0022022117697844
Jarvis, C. B., MacKenzie, S. B., and Podsakoff, P. M. (2003). A Critical Review of Construct Indicators and Measurement Model Misspecification in Marketing and Consumer Research. J. Consum. Res. 30, 199–218. doi:10.1086/376806
Kankaraš, M., Moors, G., and Vermunt, J. K. (2010). “Testing for Measurement Invariance with Latent Class Analysis,” in Cross-cultural Analysis: Methods and Applications. Editors E. Davidov, P. Schmidt, J. Billiet, and B. Meuleman 2nd edition (London, UK: Routledge), 359–384.
King, G., Murray, C. J. L., Salomon, J. A., and Tandon, A. (2004). Enhancing the Validity and Cross-Cultural Comparability of Measurement in Survey Research. Am. Polit. Sci. Rev. 98, 191–207. doi:10.1017/S000305540400108X
Kirsch, H., and Welzel, C. (2019). Democracy Misunderstood: Authoritarian Notions of Democracy Around the globe. Soc. Forc. 98, 59–92. doi:10.1093/sf/soy114
Kline, R. B. (2015). Principles and Practice of Structural Equation Modeling. 4th Edn. New York, NY: Guilford publications.
Kruse, S., Ravlik, M., and Welzel, C. (2019). Democracy Confused: When People Mistake the Absence of Democracy for its Presence. J. Cross-Cultural Psychol. 50, 315–335. doi:10.1177/0022022118821437
Law, K. S., Wong, C.-S., and Mobley, W. M. (1998). Toward a Taxonomy of Multidimensional Constructs. Amr 23, 741–755. doi:10.5465/amr.1998.1255636
Lek, K., Oberski, D., Davidov, E., Cieciuch, J., Seddig, D., and Schmidt, P. (2018). “Approximate Measurement Invariance,” in “Approximate Measurement Invariance,” in Advances In Comparative Survey Methodology. Editors T. P. Johnson, B.-E. Pennell, I. A. L. Stoop, and B. Dorer (Hoboken: John Wiley & Sons Inc), 911–929. doi:10.1002/9781118884997.ch41
Linz, J., and Stepan, A. (1996). Problems of Democratic Consolidation. Baltimore, MD: Johns Hopkins University Press.
Lipset, S. M. (1959). Some Social Requisites of Democracy: Economic Development and Political Legitimacy. Am. Polit. Sci. Rev. 53, 69–105. doi:10.2307/1951731
L. Milfont, T., and Fischer, R. (2010). Testing Measurement Invariance across Groups: Applications in Cross-Cultural Research. Int. J. Psychol. Res. 3, 111–130. doi:10.21500/20112084.857
Lomazzi, V., and Seddig, D. (2020). Gender Role Attitudes in the International Social Survey Programme: Cross-National Comparability and Relationships to Cultural Values. Cross-Cultural Res. 54, 398–431. doi:10.1177/1069397120915454
Lomazzi, V. (2018). Using Alignment Optimization to Test the Measurement Invariance of Gender Role Attitudes in 59 Countries. Methods Data Anal. 12, 77–103. doi:10.12758/mda.2017.09
MacKenzie, S. B., Podsakoff, P. M., and Jarvis, C. B. (2005). The Problem of Measurement Model Misspecification in Behavioral and Organizational Research and Some Recommended Solutions. J. Appl. Psychol. 90, 710–730. doi:10.1037/0021-9010.90.4.710
Marsh, H. W., Guo, J., Guo, J., Parker, P. D., Nagengast, B., Asparouhov, T., Muthén, B., et al. (2018). What to do When Scalar Invariance Fails: The Extended Alignment Method for Multi-Group Factor Analysis Comparison of Latent Means across Many Groups. Psychol. Methods. 23, 524–545. doi:10.1037/met0000113
Meitinger, K. (2017). Necessary but Insufficient. Public Opin. Q. 81, 447–472. doi:10.1093/poq/nfx009
Meuleman, B. (2012). “When Are Item Intercept Differences Substantively Relevant in Measurement Invariance Testing?,” in Methods, Theories, and Empirical Applications in the Social Sciences. Editors S. Salzborn, E. Davidov, and J. Reinecke (VS Verlag für Sozialwissenschaften), 97–104. doi:10.1007/978-3-531-18898-0_13
Munck, I., Barber, C., and Torney-Purta, J. (2018). Measurement Invariance in Comparing Attitudes toward Immigrants Among Youth across Europe in 1999 and 2009. Sociological Methods Res. 47, 687–728. doi:10.1177/0049124117729691
Muthén, B., and Asparouhov, T. (2013). BSEM measurement invariance analysis. Mplus Web Notes17. Available online at: https://www.statmodel.com/examples/webnotes/webnote17.pdf.1–48.
Muthén, B., and Asparouhov, T. (2012). Bayesian Structural Equation Modeling: a More Flexible Representation of Substantive Theory. Psychol. Methods 17, 313–335. doi:10.1037/a0026802
Muthén, B., and Asparouhov, T. (2014). IRT Studies of many Groups: The Alignment Method. Front. Psychol. 5, 978. doi:10.3389/fpsyg.2014.00978
Muthén, B., and Asparouhov, T. (2018). Recent Methods for the Study of Measurement Invariance with Many Groups. Sociological Methods Res. 47, 637–664. doi:10.1177/0049124117701488
Oberski, D. L. (2014). Evaluating Sensitivity of Parameters of Interest to Measurement Invariance in Latent Variable Models. Polit. Anal. 22, 45–60. doi:10.1093/pan/mpt014
P. Norris (1999). Critical Citizens: Global Support for Democratic Government (Oxford, UK: Oxford University Press).
Pokropek, A., Davidov, E., and Schmidt, P. (2019). A Monte Carlo Simulation Study to Assess the Appropriateness of Traditional and Newer Approaches to Test for Measurement Invariance. Struct. Equation Model. A Multidisciplinary J. 26, 724–744. doi:10.1080/10705511.2018.1561293
Pokropek, A., Schmidt, P., and Davidov, E. (2020). Choosing Priors in Bayesian Measurement Invariance Modeling: A Monte Carlo Simulation Study. Struct. Equation Model. A Multidisciplinary J. 27, 750–764. doi:10.1080/10705511.2019.1703708
Przeworski, A., and Teune, H. (1966). Equivalence in Cross-National Research. Public Opin. Q. 30, 551–568. doi:10.1086/267455
Putnam, R. D. (2000). Bowling Alone : The Collapse and Revival of American Community. New York, NY: Simon & Schuster.
R. Inglehart, C. Haerpfer, A. Moreno, C. Welzel, K. Kizilova, J. Diez-Medrano, M. Lagos, P. Norris, E. Ponarin, B. Puranenet al. (2014). World Values Survey: Round Six - Country-Pooled Datafile Version (Madrid: JD Systems Institute). Available online at www.worldvaluessurvey.org/WVSDocumentationWV6.jsp.
Robitzsch, A. (2019). Sirt: Supplementary Item Response Theory Models. Available online at: https://CRAN.R-project.org/package=sirt.
Rudnev, M. (2018). “Testing for Invariance of Latent Classes,” in “Testing for Invariance of Latent Classes: Group-As-Covariate Approach,” in Cross-Cultural Analysis: Methods and Applications. Editors E. Davidov, P. Schmidt, J. Billiet, and B. Meuleman 2nd edition (London, UK: Routledge), 449–479. doi:10.4324/9781315537078-16
Rutkowski, L., and Svetina, D. (2014). Assessing the Hypothesis of Measurement Invariance in the Context of Large-Scale International Surveys. Educ. Psychol. Meas. 74, 31–57. doi:10.1177/0013164413498257
Sokolov, B. (2018). The index of Emancipative Values: Measurement Model Misspecifications. Am. Polit. Sci. Rev. 112, 395–408. doi:10.1017/S0003055417000624
Stapleton, L. M., Yang, J. S., and Hancock, G. R. (2016). Construct Meaning in Multilevel Settings. J. Educ. and Behav. 41, 481–520. doi:10.3102/1076998616646200
Steenkamp, J. B. E. M., and Baumgartner, H. (1998). Assessing Measurement Invariance in Cross-National Consumer Research. J. Consum. Res. 25, 78–107. doi:10.1086/209528
Stegmueller, D. (2011). Apples and Oranges? the Problem of Equivalence in Comparative Research. Polit. Anal. 19, 471–487. doi:10.1093/pan/mpr028
Treiblmaier, H., Bentler, P. M., and Mair, P. (2011). Formative Constructs Implemented via Common Factors. Struct. Equation Model. A Multidisciplinary J. 18, 1–17. doi:10.1080/10705511.2011.532693
Van de Schoot, R., Kluytmans, A., Tummers, L., Lugtig, P., Hox, J., and Muthén, B. (2013). Facing off with Scylla and Charybdis: a Comparison of Scalar, Partial, and the Novel Possibility of Approximate Measurement Invariance. Front. Psychol. 4, 770. doi:10.3389/fpsyg.2013.00770
Van Deth, J. W. (2009). “Establishing Equivalence,” in The SAGE Handbook of Comparative Politics. Editors T. Landman, and N. Robinson (London, UK: Sage Publications), 84–100.
Vehtari, A., Gelman, A., and Gabry, J. (2017). Practical Bayesian Model Evaluation Using Leave-One-Out Cross-Validation and WAIC. Stat. Comput. 27, 1413–1432. doi:10.1007/s11222-016-9696-4
Welzel, C., Brunkert, L., Kruse, S., and Inglehart, R. F. (2021). Non-invariance? an Overstated Problem with Misconceived Causes. Sociological Methods Res., 004912412199552. doi:10.1177/0049124121995521
Welzel, C., and Inglehart, R. F. (2016). Misconceptions of Measurement Equivalence. Comp. Polit. Stud. 49, 1068–1094. doi:10.1177/0010414016628275
Wilcox, J. B., Howell, R. D., and Breivik, E. (2008). Questions about Formative Measurement. J. Business Res. 61, 1219–1228. doi:10.1016/j.jbusres.2008.01.010
Yuan, K.-H., and Chan, W. (2016). Measurement Invariance via Multigroup SEM: Issues and Solutions with Chi-Square-Difference Tests. Psychol. Methods 21, 405–426. doi:10.1037/met0000080
Zagrebina, A. (2020). Concepts of Democracy in Democratic and Nondemocratic Countries. Int. Polit. Sci. Rev. 41, 174–191. doi:10.1177/0192512118820716
Keywords: world value survey, measurement invariance, democratic attitudes, formative measurement, multiple group confirmatory factor analysis, alignment optimization, Bayesian approximate measurement invariance
Citation: Sokolov B (2021) Measurement Invariance of Liberal and Authoritarian Notions of Democracy: Evidence From the World Values Survey and Additional Methodological Considerations. Front. Polit. Sci. 3:642283. doi: 10.3389/fpos.2021.642283
Received: 15 December 2020; Accepted: 23 June 2021;
Published: 28 July 2021.
Edited by:
Jose A. Aleman, Fordham University, United StatesReviewed by:
Gijs Schumacher, University of Amsterdam, NetherlandsPeter Schmidt, University of Giessen, Germany
Copyright © 2021 Sokolov. This is an open-access article distributed under the terms of the Creative Commons Attribution License (CC BY). The use, distribution or reproduction in other forums is permitted, provided the original author(s) and the copyright owner(s) are credited and that the original publication in this journal is cited, in accordance with accepted academic practice. No use, distribution or reproduction is permitted which does not comply with these terms.
*Correspondence: Boris Sokolov, YnNzb2tvbG92QGdtYWlsLmNvbQ==