 Pengdewendé Maurice Sawadogo
 Jean-François Kobiané
 Eric Tchouaket Nguemeleu
- 1Institut Supérieur des Sciences de la Population (Higher Institute of Population Sciences), Joseph Ki-Zerbo University (ISSP/UJKZ), Ouagadougou, Burkina Faso
- 2Département Sciences Infirmières (Nursing Science Department), University of Quebec in Outaouais, Saint-Jérôme, QC, Canada
Malnutrition seriously affects children’s health, survival, and future productivity. According to the literature, increasing the supply of health services should help reduce the spread of malnutrition. This article analyses the sources of changes in the decline of chronic malnutrition during the 2000s, where there was an increase in the supply of health services in Burkina Faso. We used data from demographic and health surveys conducted in 2003 and 2010 in Burkina Faso. Malnutrition was defined according to the recommendations of the World Health Organization, while using standards of growth which are current and uniform for the two periods of study considered. We analyzed the source of temporal variation of chronic malnutrition through the Oaxaca-Blinder multivariate decomposition of the proportion of children suffering from chronic malnutrition. The analyses showed that the relative extent of chronic malnutrition in children decreased significantly, from 43.4% (CI 95%: 42.3–44.4) in 2003 to 34.7% (CI 95%: 33.6–35.9) in 2010. A quarter of this variation is due to a change in characteristics (composition effect), and the remaining 74.74% is due to a difference in coefficients (performance or behavior effect). Improved access to health services played a crucial role in reducing the scale of chronic malnutrition between 2003 and 2010. Other factors, such as educating mothers and urbanization, also contributed significantly. This study shows that improving access to health services is crucial for reducing chronic malnutrition. So, programs tackling child malnutrition must first and foremost ensure that children have access to health services.
1 Introduction
Malnutrition is still a significant threat to the survival and development of children. In developing countries, it accounts for 45% of under-five mortality (1). Chronic malnutrition is the most widespread form, affecting 148.1 million under-five children worldwide in 2023. Its prevalence is highest in Melanesia (46.4%) and Central Africa (37.4%) (2). Furthermore, contrary to the trend observed in other parts of the world, the number of under-five children affected by chronic malnutrition continues to rise sharply in West and Central Africa (2). This continued increase in the number of malnourished children does not support the goal of eliminating chronic malnutrition by 2030 (3).
Temporal variation refers to the change in the extent of chronic malnutrition between two period. According to the scientific literature, factors influencing the temporal variation of child chronic malnutrition are mothers’ access to healthcare (prenatal consultation, assisted childbirth, iron supplementation), child immunization coverage, household purchasing power, mothers’ level of education, access to the media, variations in food prices, fertility and variations in GDP per capita (4–9). Although these studies have provided an inventory of factors, the methods used do not allow for estimating the contribution of each factor. Therefore, ranking contribution is necessary to assess more accurately the effects of public policies on improving the state of health of our populations. Furthermore, to our knowledge, no study has analyzed the sources of chronic malnutrition among children in Burkina Faso during the decade 2000.
In Burkina Faso, the chronic malnutrition situation is just as worrying. The national nutrition survey showed that around one child in four suffers from malnutrition in Burkina Faso (10). During the 2000s, Burkina Faso strengthened its health system by increasing health funding, conforming to the Abuja Declaration. The country also adopted a health policy in 2006 and drew up the National Health Development Plan (PNDS) 2001–2010. These policy initiatives have led to a significant increase in the supply and use of health services. For example, the use of general consultation services has tripled, rising from 0.22 contact per inhabitant per year in 2001 to 0.63 in 2010. Over the same period, assisted childbirth coverage rose from 34 to 75% (11, 12). The use of child health services has also increased. For example, the percentage of children aged 12–23 months fully immunized rose from 29% in 1998/1999 to 81% in 2010. The percentage of children receiving treatment for diarrhea also increased from 18 to 48% (13, 14). During the same period, the prevalence of chronic malnutrition remained almost constant, rising from 37% in 1998 to 34.6% in 2010 (13, 14). This study examines the sources of variation in chronic malnutrition in children during the 2000 decade, where we observed a strengthening in health service provision in Burkina Faso.
2 Data and methods
We used data from the Demographic and Health Surveys (DHS) conducted in 2003 and 2010. The DHS data are the most complete and disaggregated source on chronic malnutrition in children in Burkina Faso during the study period. Following WHO recommendations, we considered that a child was suffering from chronic malnutrition when the ratio of height to age was less than two (−2) standard deviations from the mean reference value. We obtained these reference values from the parameters (height and age) of children who, given the optimal conditions in which they were born and are growing harmoniously (15). In this article, we used the WHO Growth Standards 2006 version as reference values for estimating the nutritional status of children. This study focused on children aged 6–59 months, who are a group at high risk of malnutrition. The variable to be decomposed is the child’s nutritional status. Variables previously identified as having a significant effect on chronic malnutrition in children were retained as independent variables (16). The complete list of variables used in the analysis and their construction is presented in Table 1.
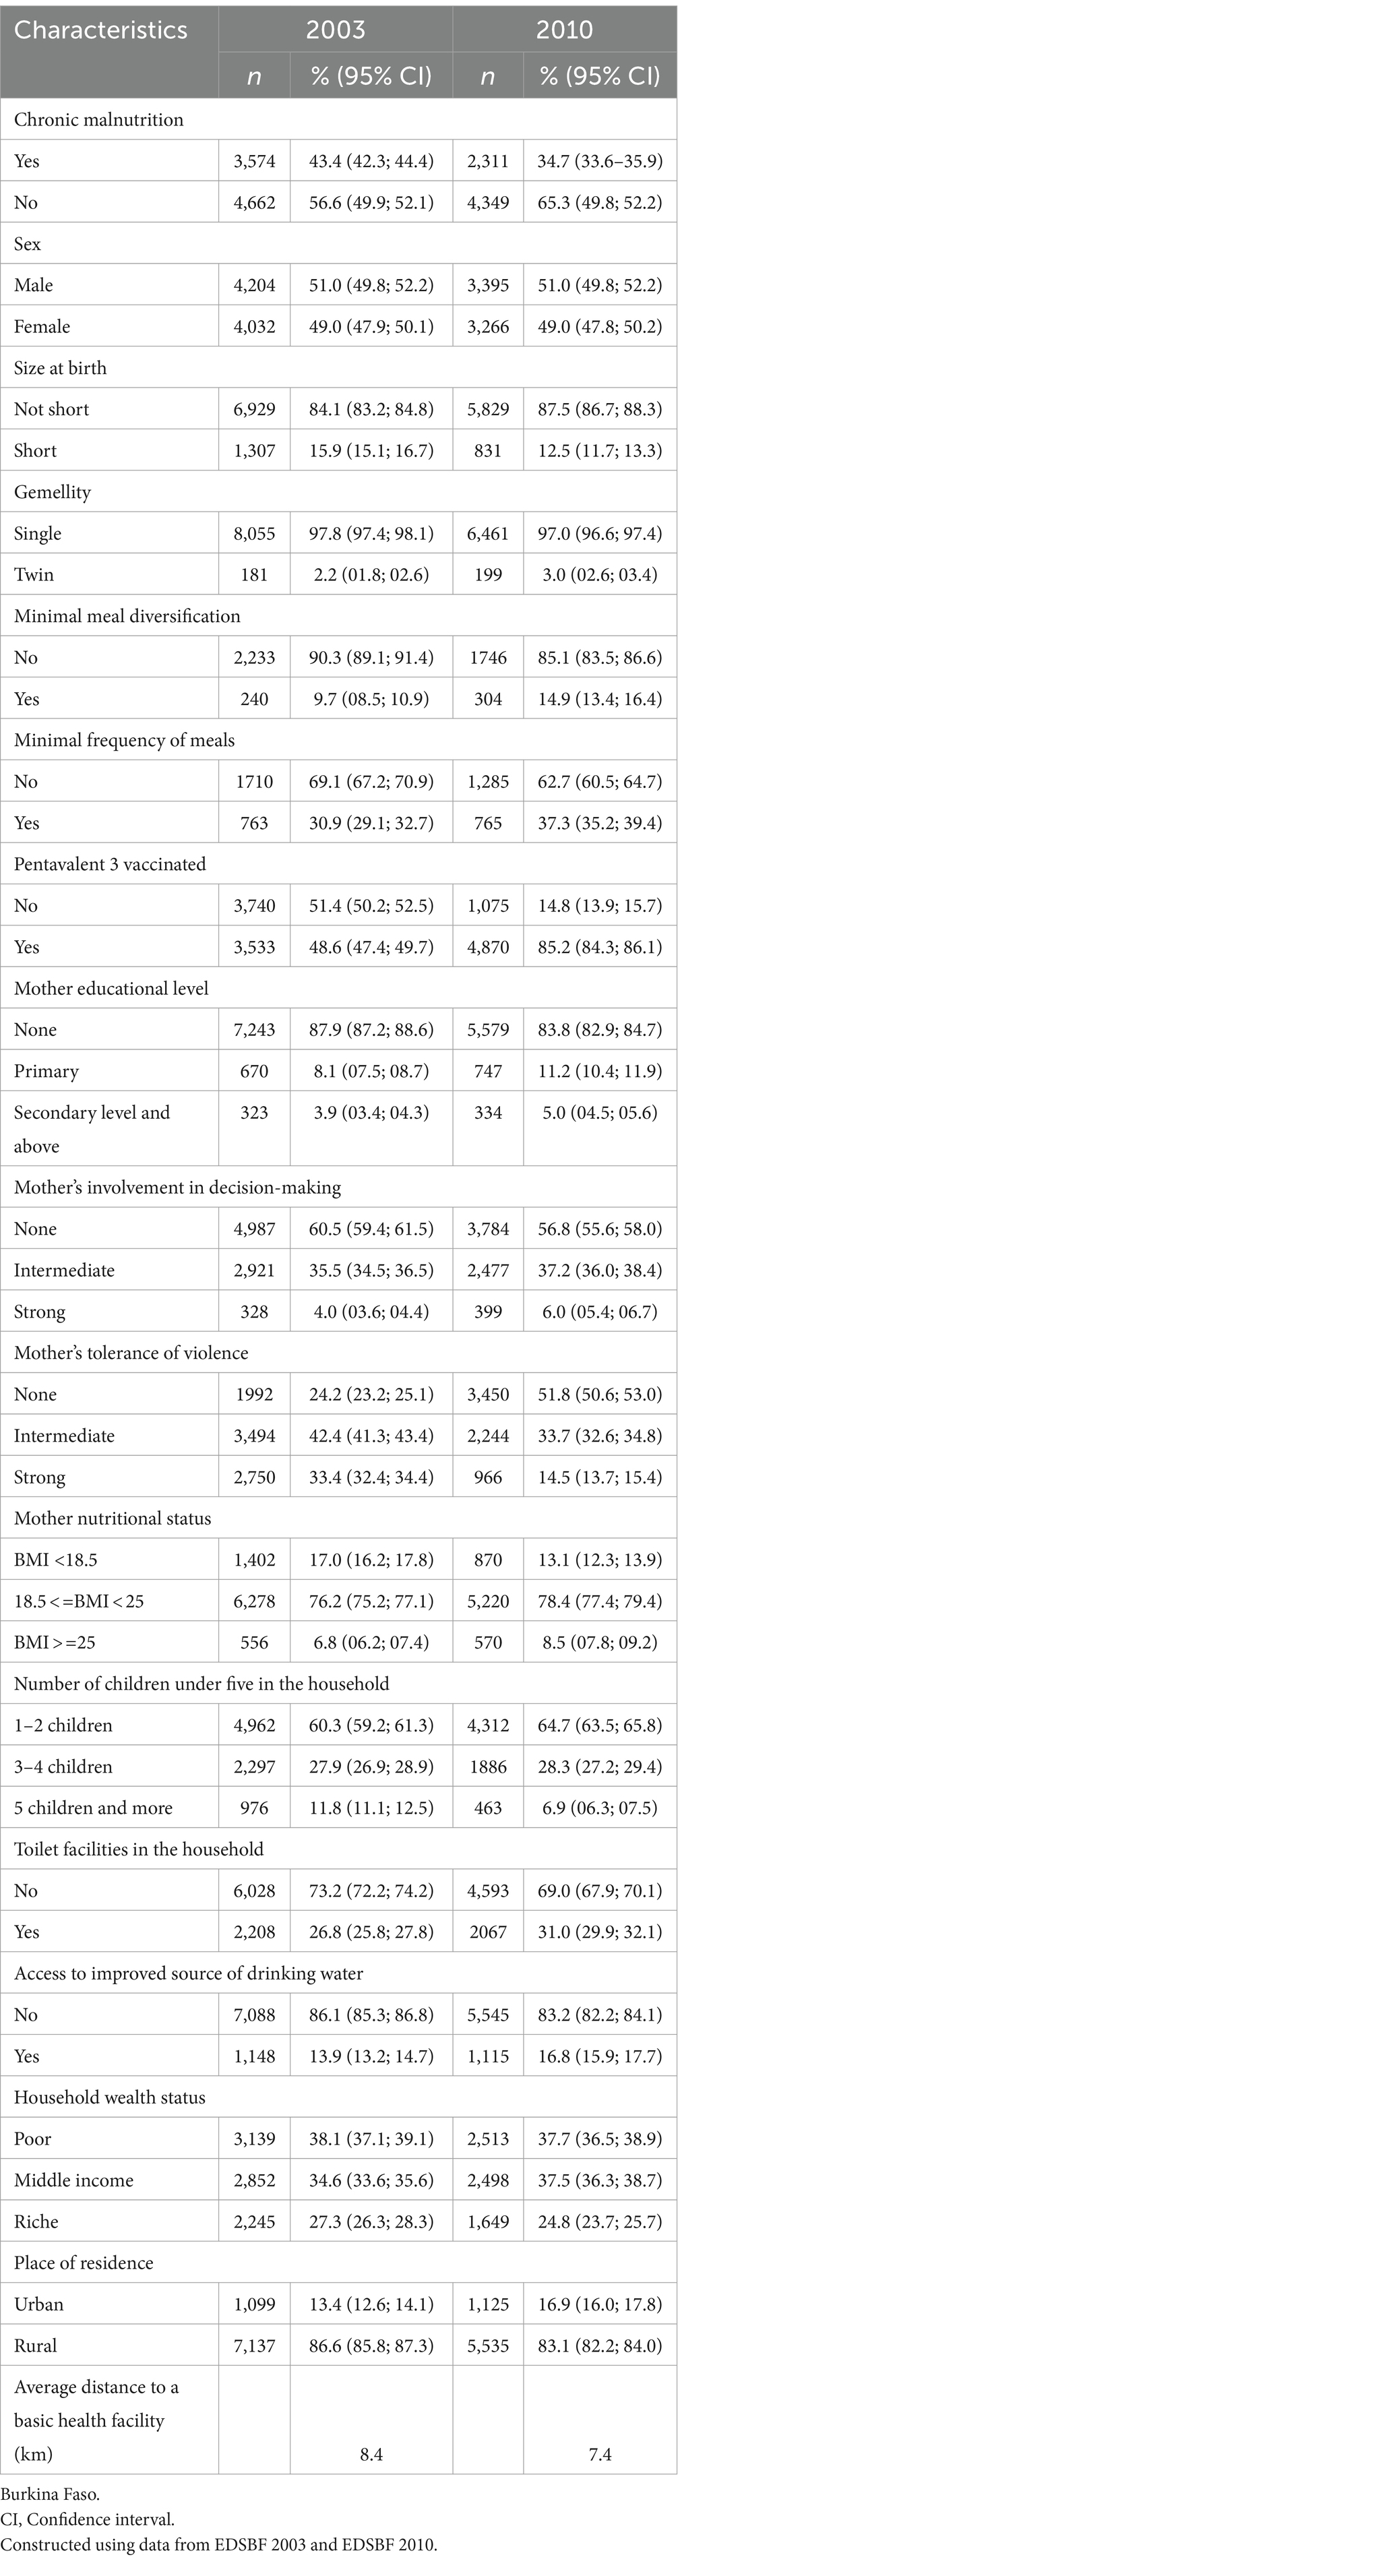
Table 1. Characteristics of the study population in 2003 and 2010.
The source of temporal variation in chronic malnutrition was analyzed using a multivariate decomposition of the proportion of children suffering from chronic malnutrition. In its simplest form, the decomposition allows us to distinguish between sources of change attributable to a change in the structure of the population (composition effect) and those linked to changes in behavior of the population (17). The decomposition method of Oaxaca and Blinder as adopted by Powers et al., (18) was used in this study to identify the contributions of various factors to the change in the extent of chronic malnutrition between 2003 and 2010 in Burkina Faso. Considering Y as the N x l vector of the dependent variable, X the N x K matrix of the independent variables and β a K x l vector of the regression coefficients. The difference in the proportion of the extent of chronic malnutrition between two periods A and B (2003 and 2010 respectively) is expressed as follows:
After adjusting this equation, we obtain:
-) represents the proportion attributable to differences in characteristics and is denoted E. - represents the part due to differences in the coefficients and is denoted C. Details of the decomposition equation can be found in the article by Powers et al. (18).
2.1 Ethical considerations
This research is based exclusively on secondary data. Ethical requirements were taken into account when selecting data sources. We obtained authorization to access the demographic and health survey databases via an online request to the Macro International website (www.dhsprogramm.com).
3 Results
3.1 Characteristics of the study population in 2003 and 2010
Table 1 shows the characteristics of the study population in 2003 and 2010. It shows that 43.4% of children under five suffered from chronic malnutrition in 2003, compared with 34.7% in 2010. The proportion of children vaccinated almost doubled, rising from 49 to 85% over the same period. Similarly, the proportion of children from households with improved toilets rose by four percentage points, and those from the ones with access to an improved source of drinking water increased by three percentage points. In addition, mothers’ level of education and autonomy improved significantly between 2003 and 2010.
3.2 Sources of variation in the extent of chronic malnutrition
The results of Oaxaca and Blinder’s multivariate decomposition present the effects of change attributable to variation in individual characteristics (E) and the effects of change attributable to the difference in coefficients (C). Overall, the change in the extent of chronic malnutrition between 2003 and 2010 is estimated at 0.102 or 10.2% (Table 2).
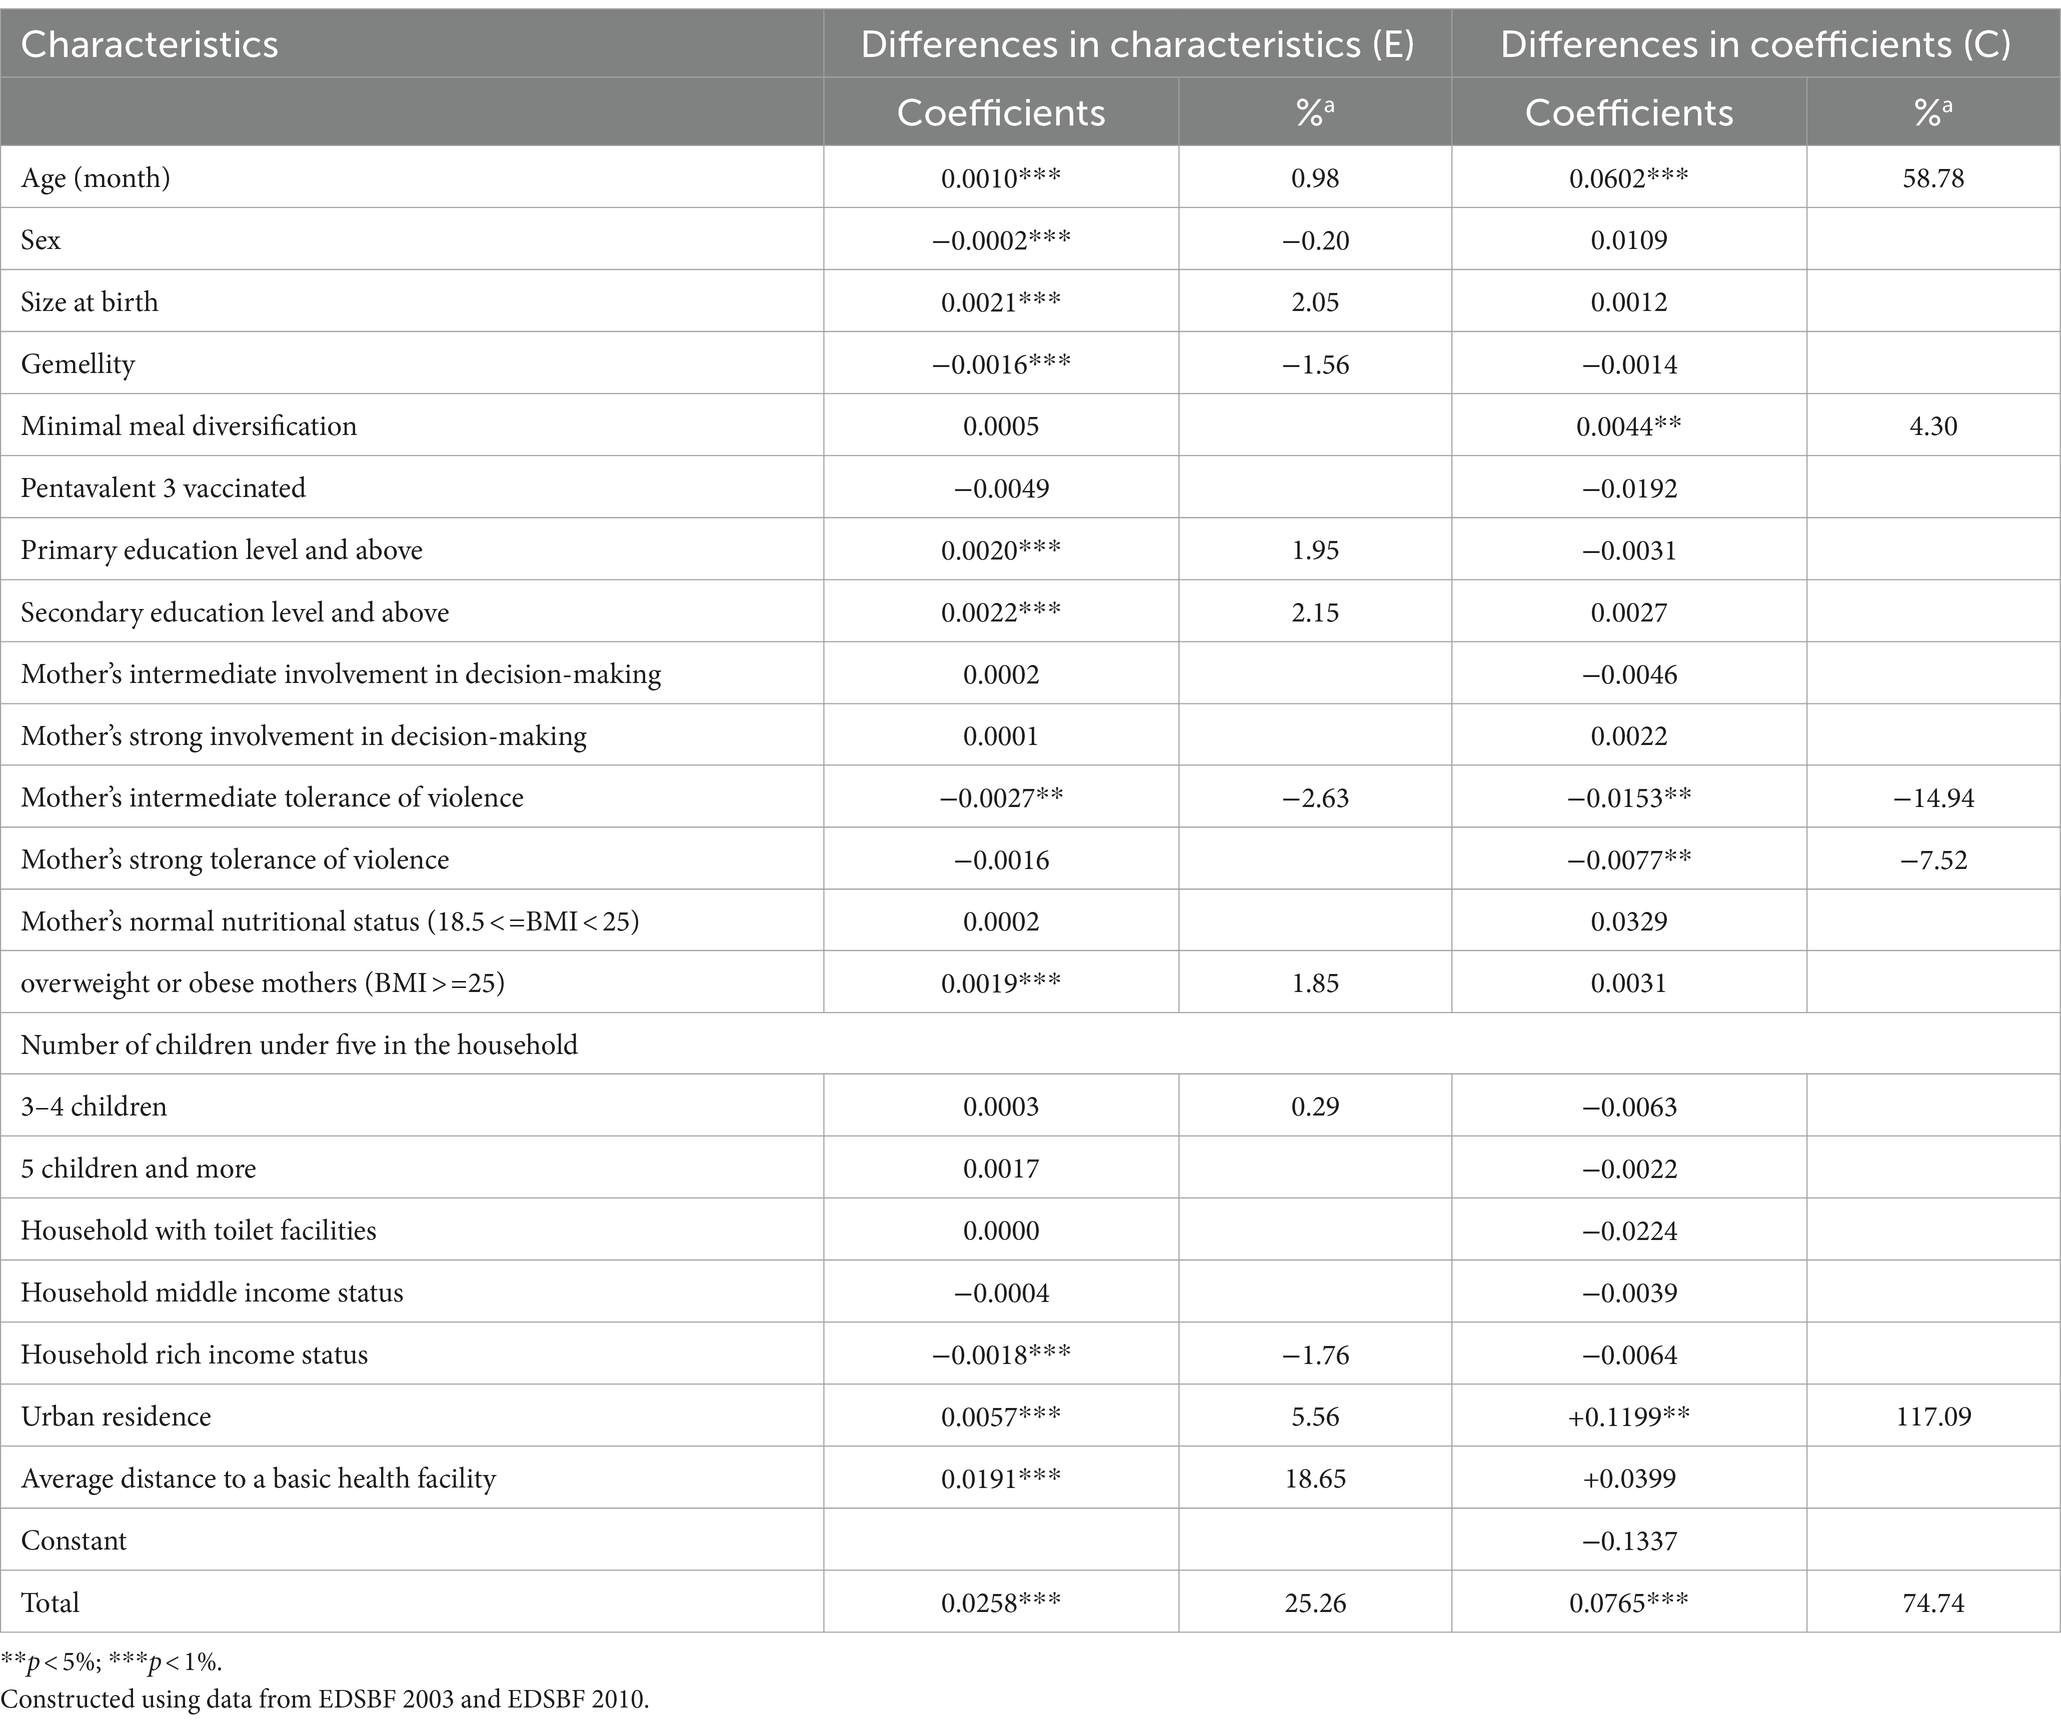
Table 2. Results of the Oaxaca-Blinder multivariate decomposition analysis of the change in the proportion of children aged 6–59 months between 2003 and 2010.
3.2.1 Contribution of the change in characteristics
Overall, a change in the characteristics of the study population contributed to reducing the extent of chronic malnutrition by 2.6 percentage points, representing 25.26% of the total variation between 2003 and 2020. In the same vein, the contributions linked to the increase in the urban population (5.6%) and the ones linked to the increase in the proportion of educated mothers (1.95% for primary education and 2.15% for secondary education) are also significant. On the other hand, negative contributions linked to the variation in the proportion of children of mothers with an average tolerance of violence (−2.6%), the proportion of wealthy households (−1.8%) and the proportion of twins (−1.95%) were also observed (Table 2).
3.2.2 Contribution of the change in coefficients
The change in coefficients (C) contributed to a reduction in the relative extent of chronic malnutrition of 7.7 percentage points, corresponding to 74.74% of the total change. The analysis shows that changes in the coefficients for urbanization (+117%) and child age (+59%) contributed significantly to a reduction in the scale of chronic malnutrition between 2003 and 2010. However, changes in the coefficients associated with moderate (−15%) and high (−7%) tolerance of violence contributed significantly, but in the opposite direction to the trend observed between 2003 and 2010.
4 Discussion
The relative magnitude of chronic malnutrition in children decreased significantly over the period 2003–2010, from 43.4% [42.3; 44.4] in 2003 to 34.7% [33.6–35.9] (Figure 1). The Oaxaca-Blinder multivariate decomposition showed that 25.26% of the variation in the extent of chronic malnutrition is due to a change in characteristics (composition effect), and the remaining 74.74% is due to a change in coefficients (performance or behavior effect).
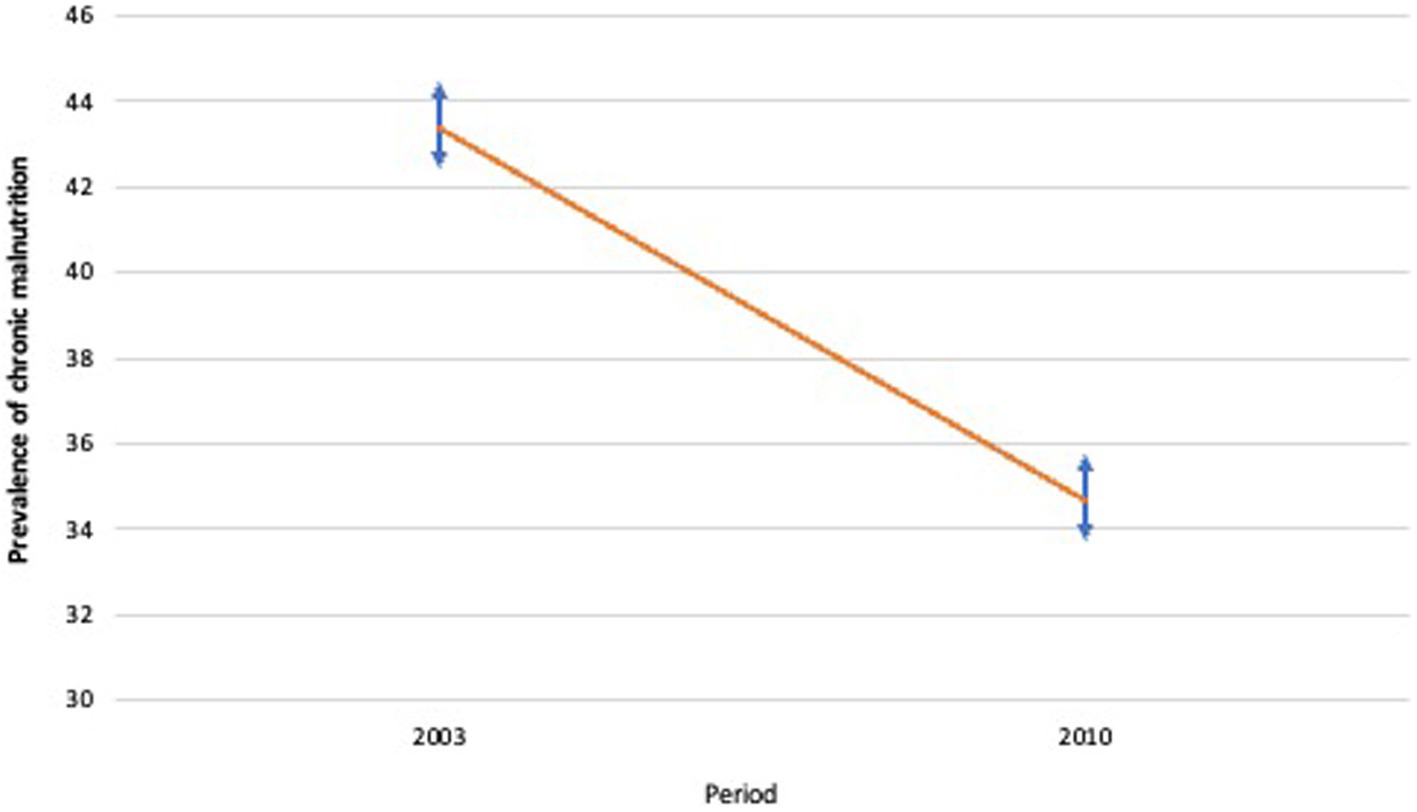
Figure 1. Trend in variation in child chronic malnutrition  confidence interval
  .
.
4.1 Compositional effects
With regard to the variation attributable to the compositional effect, it appeared that the improvement in the population’s geographical accessibility to health services made a significant contribution, accounting for 18.6% of the total variation in the extent of chronic malnutrition between 2003 and 2010. At the national level, 282 new health facilities were built, contributing to reduce the average distance to a basic health facility from 8.68 km in 2003 to 7.34 km in 2010 (12, 19). With this closer proximity to health centers, women and children have greater access to preventive care (vaccination, micronutrient supplementation, monitoring of growth and weight) and curative care in the event of illness, which contributes to reducing the extent of chronic malnutrition in children. Previous studies conducted in sub-Saharan Africa have also shown similar effects, in particular a significant effect of vaccination and access to healthcare (6, 20, 21). Given its strong contribution to reducing the extent of chronic malnutrition, improving geographical accessibility to healthcare services could play an important role in achieving the objective of eliminating chronic malnutrition in children in Burkina Faso by 2030, given that the average radius of action is continuing to be reduced at a rate almost similar to that observed over the 2000s decade (12, 22).
The increase in the proportion of the population living in cities generated the second largest compositional effect on the change in chronic malnutrition between 2003 and 2010. i.e. 5.6% of the total change. A similar significant effect of urbanization was highlighted during the 1990s in Burkina Faso (23). However, the contribution was relatively modest, as the proportion of urban households increased by only 3.5 percentage points between the two periods (Table 1). In addition, the growth of the urban population over the period was followed by an expansion of informal settlements whose inhabitants do not have access to basic social services (water, sanitation, health centers) (24, 25). As a result, a large proportion of the inhabitants of large cities such as Ouagadougou do not have access to basic urban facilities, which should be beneficial for the healthy growth of children.
The increase in the proportion of mothers’ educational level provided the third most significant contribution to the decline in the scale of chronic malnutrition between 2003 and 2010. Taking into account both the change in the proportion of mothers with primary education and the one in the proportion of those with secondary education and above, the overall contribution represents 4%. This result is similar to that of previous studies conducted in Ethiopia, Ghana, Nigeria and Liberia, which found that improving the educational level of mothers significantly contributed to reducing the prevalence of chronic malnutrition (6, 20, 26, 27). Considering the scientific literature, we would expect a greater contribution from mothers’ education, since it has helped to reduce child mortality by more than 50% in developing countries (28). In our case, its contribution to reducing the prevalence of chronic malnutrition has been relatively small as the increase in the proportion of mothers educated to the secondary level has been very small (+1 percentage point). However, only education up to a secondary level has the greatest effect on chronic malnutrition in children (29, 30). This result shows that pursuing policies that encourage girls to attend school in Burkina Faso could significantly contribute to reducing the prevalence of chronic malnutrition.
4.2 Behavioral effects
Most of the variation in the extent of chronic malnutrition is due to changes in behavior. Those changes in behavior are mainly associated with urbanization and the age of the child. The change in behavior associated with urbanization has made a major contribution to the reduction in chronic malnutrition in children, i.e., by 117%. This strong contribution can be explained by the reduction in inequalities in health-promoting behavior between urban and rural areas. With the significant increase in health coverage in rural areas (31), rural women’s knowledge of health and nutrition has been raised. In addition, programs and projects have used communication sessions to boost rural women’s knowledge. Consequently, the gap between rural and urban areas has narrowed so that place of residence, a determining factor in chronic child malnutrition in 2003, was no longer a factor in 2010 (16).
Behavior change associated with children’s age contributed 59% in reducing the extent of chronic malnutrition in children between 2003 and 2010. This effect could reflect a reduction in vulnerability to disease with age. Empirical studies and theoretical frameworks show that the frequency of illness is a major factor in chronic malnutrition in children (32–35). This vulnerability to disease is closely linked to the child’s age. During the first six months of life, the child benefits from the protection of maternal antibodies and is therefore relatively less susceptible to disease. Between 12 and 23 months of age, the child is more vulnerable to disease since the maternal antibodies have almost disappeared and the child’s immune system is still weak. By the age of 24 months, the child’s immune system becomes more mature and he or she is still relatively protected against early childhood illnesses. With the increase in health coverage, children of all ages are benefiting from vaccination and vitamin A supplementation, which strengthens their immune system and means that they are less frequently ill. As a result, children’s age-related vulnerability to diseases, including chronic malnutrition, is reduced, hence the behavioral effect highlighted in this study. In summary, the residence or the age-related behavioral effect reflect the effects of projects and programs in improving access to health services, which have substantially improved the health and nutritional behavior of rural people and reduced the frequency of illness among children.
Although this study produced original results, we should acknowledge a shortcoming in assessing the effects of accessibility to health services. The indicator used -the theoretical average radius of action of health facilities- does not allow for a detailed assessment of geographical accessibility to health services. The use of geographical information tools to calculate the distance (as the crow flies) between each household and the nearest health center should make it possible to estimate these effects more accurately. Analyses of this kind, which were not carried out as part of this study due to the lack of data, could provide further avenues for this research. Finally, the proportion of temporal variation in chronic malnutrition attributable to a change in structural characteristics (education, wealth status) is relatively small. Given that these factors change slowly (inertia of demographic phenomena), it is understandable that the observation period of 7 years (between 2003 and 2010) is insufficient to observe significant demographic changes capable of having a considerable effect on the scale of chronic malnutrition. Analysis over a longer period is needed to better assess the effects of changes in population structure on the development of chronic malnutrition in children.
5 Conclusion
This study has shown that an improved provision of healthcare services constituted a significant contribution in reducing the prevalence of chronic malnutrition in children between 2003 and 2010. As a result, the population has had closer access to health services, and rural children, in particular, have had greater access to care, thus protecting them from illnesses that are detrimental to their healthy growth. Similarly, health and nutrition programs have helped to increase the adoption by mothers and households of behaviors conducive to healthy child growth. These results show that projects and programs to combat chronic malnutrition must first and foremost work to increase access to health services.
Data availability statement
Publicly available datasets were analyzed in this study. This data can be found at: https://dhsprogram.com/data/available-datasets.cfm.
Author contributions
PS: Writing – original draft, Methodology, Formal analysis, Conceptualization. J-FK: Writing – review & editing, Conceptualization. ET: Writing – review & editing, Conceptualization.
Funding
The author(s) declare that financial support was received for the research, authorship, and/or publication of this article.
Acknowledgments
The authors would like to thank SD and YO for their valuable contribution to the doctoral thesis from which this article is taken.
Conflict of interest
The authors declare that the research was conducted without any commercial or financial relationships that could be construed as a potential conflict of interest.
Publisher’s note
All claims expressed in this article are solely those of the authors and do not necessarily represent those of their affiliated organizations, or those of the publisher, the editors and the reviewers. Any product that may be evaluated in this article, or claim that may be made by its manufacturer, is not guaranteed or endorsed by the publisher.
Supplementary material
The Supplementary material for this article can be found online at: https://www.frontiersin.org/articles/10.3389/fpubh.2024.1356918/full#supplementary-material
References
1. Black, RE, Victora, CG, Walker, SP, Bhutta, ZA, Christian, P, de Onis, M, et al. Maternal and child undernutrition and overweight in low-income and middle-income countries. Lancet. (2013) 382:427–51. doi: 10.1016/S0140-6736(13)60937-X
2. United Nations Children’s Fund, World Health Organization, and International Bank for Reconstruction and Development. Levels and trends in child malnutrition: key findings of the 2023 edition of the joint child malnutrition estimates. Geneva: World Health Organization (2023).
3. Organisation des Nations Unies. Objectifs de developpement durable (2015); Available at: https://www.un.org/sustainabledevelopment/fr/objectifs-de-developpement-durable/
4. Agee, MD. Reducing child malnutrition in Nigeria: combined effects of income growth and provision of information about mothers’ access to health care services. Soc Sci Med. (2010) 71:1973–80. doi: 10.1016/j.socscimed.2010.09.020
5. Barankanira, E, Molinari, N, Msellati, P, Laurent, C, and Bork, KA. Stunting among children under 3 years of age in Côte d'Ivoire: spatial and temporal variations between 1994 and 2011. Public Health Nutr. (2017) 20:1627–39. doi: 10.1017/S1368980017000544
6. Buisman, LR, van de Poel, E, O'Donnell, O, and van Doorslaer, EKA. What explains the fall in child stunting in sub-Saharan Africa? SSM Population Health. (2019) 8:100384. doi: 10.1016/j.ssmph.2019.100384
7. Nabwera, HM, Fulford, AJ, Moore, SE, and Prentice, AM. Growth faltering in rural Gambian children after four decades of interventions: a retrospective cohort study. Lancet Glob Health. (2017) 5:e208–16. doi: 10.1016/S2214-109X(16)30355-2
8. Nandy, S, Daoud, A, and Gordon, D. Examining the changing profile of undernutrition in the context of food price rises and greater inequality. Soc Sci Med. (2016) 149:153–63. doi: 10.1016/j.socscimed.2015.11.036
9. Yaya, S, Uthman, OA, Kunnuji, M, Navaneetham, K, Akinyemi, JO, Kananura, RM, et al. Does economic growth reduce childhood stunting? A multicountry analysis of 89 demographic and health surveys in sub-Saharan Africa. BMJ Glob Health. (2020) 5:e002042. doi: 10.1136/bmjgh-2019-002042
10. Ministère de la santé, Enquête Nutritionnelle Nationale. (2020), Direction de la Nutrition, Ouagadougou. 72.
11. Ministère de la santé, Annuaire statistique/santé 2001. (2002), Direction des études et de la planification. 149.
12. Ministère de la santé, Annuaire statistique 2010. (2011), Direction Générale des études et des statistiques sectorielles, 192.
13. Institut National de la Statistique et de la Démographie and ICF International. Enquête Démographique et de Santé et à Indicateurs Multiples du Burkina Faso 2010. Calverton, Maryland, USA: INSD et ICF international (2012).
14. Institut National de la Statistique et de la Démographie and M.I. Inc. Enquête Démographique et de Santé, Burkina Faso 1998–1999. Calverton, Maryland (USA): Macro International Inc (2000).
15. WHO Multicentre Growth Reference Study Group and M. de Onis. Enrolment and baseline characteristics in the WHO multicentre growth reference study. Acta Paediatr. (2006) 95:7–15. doi: 10.1111/j.1651-2227.2006.tb02371.x
16. Pengdewendé Maurice Sawadogo. Analyse de la malnutrition chronique des enfants au Burkina Faso: facteurs associés, sources de variations spatiales et temporelles, in Ecole doctorale Lettres Sciences Hurmaines et Communication. Ouagadougou: Université Joseph Ki-Zerbo (2022).
17. Eloundou-Enyegue, PM, and Giroux, SC. Comprendre le changement social: apports des méthodes de décomposition Panel UIESP sur le renforcement de formation démographique en Afrique francophone. Yaoundé (Cameroun): Media Print (2010).
18. Powers, DA, Yoshioka, H, and Yun, M-S. mvdcmp: Multivariate decomposition for nonlinear response models. Stata J. (2011) 11:556–76. doi: 10.1177/1536867X1201100404
19. Ministère de la santé, Annuaire statistique 2003. (2004), Direction études et de la planification. 147.
20. Asuman, D, Ackah, CG, Fenny, AP, and Agyire-Tettey, F. Assessing socioeconomic inequalities in the reduction of child stunting in sub-Saharan Africa. J Public Health. (2019) 28:563–73. doi: 10.1007/s10389-019-01068-2
21. Chauhan, BG, Chauhan, S, and Chaurasia, H. Decomposing the gap in child malnutrition between poor and non-poor in Sierra Leone. J Public Health. (2019) 27:119–27. doi: 10.1007/s10389-018-0924-6
22. Ministère de la santé, Annuaire statistique 2020. (2021), Direction Générale des études et des statistiques sectorielles, Ouagadougou, 192.
23. Lachaud, J-P. Urbanisation, malnutrition des enfants et genre au Burkina Faso: une approche économétrique spatiale. Document de travail. (2002) 76:23.
24. Cadot, E, and Harang, M. Offre de soins et expansion urbaine, conséquences pour l’accès aux soins. L’exemple de Ouagadougou (Burkina Faso). Espace Populations sociétés Space Populations Societies. (2006) 2006/2-3:329–39. doi: 10.4000/eps.1739
25. Dos Santos, S., L’accès à l’eau des populations dans les quartiers informels de Ouagadougou: un objectif loin d’être atteint. Climat et accès aux ressources en eau en zones informelles de Ouagadougou, Ouagadougou, Presses universitaires de Ouagadougou, (2015): 57–72.
26. Garenne, M. Tendances de l’état nutritionnel des jeunes enfants dans les pays francophones du Sahel: 1990–2015 FERDI (2018).
27. Akombi, BJ, Agho, KE, Renzaho, AM, Hall, JJ, and Merom, DR. Trends in socioeconomic inequalities in child undernutrition: evidence from Nigeria demographic and health survey (2003 - 2013). PLoS One. (2019) 14:e0211883. doi: 10.1371/journal.pone.0211883
28. Gakidou, E, Cowling, K, Lozano, R, and Murray, CJL. Increased educational attainment and its effect on child mortality in 175 countries between 1970 and 2009: a systematic analysis. Lancet. (2010) 376:959–74. doi: 10.1016/S0140-6736(10)61257-3
29. Agu, N, Emechebe, N, Yusuf, K, Falope, O, and Kirby, RS. Predictors of early childhood undernutrition in Nigeria: the role of maternal autonomy. Public Health Nutr. (2019) 22:2279–89. doi: 10.1017/S1368980019000818
30. Fadare, O, Amare, M, Mavrotas, G, Akerele, D, and Ogunniyi, A. Mother's nutrition-related knowledge and child nutrition outcomes: empirical evidence from Nigeria. PLoS One. (2019) 14:e0212775. doi: 10.1371/journal.pone.0212775
31. Ministère de l'économie et des finances. Stratégie de croissance accélerée et du developpement durable 2011–2015. Ouagadougou: Ministère de l'économie et des finances (2010).
32. Adeyemi, RA, Zewotir, T, and Ramroop, S. Joint spatial mapping of childhood anemia and malnutrition in sub-Saharan Africa: a cross-sectional study of small-scale geographical disparities. Afr Health Sci. (2019) 19:2692–712. doi: 10.4314/ahs.v19i3.45
33. Amare, M, Benson, T, Fadare, O, and Oyeyemi, M. Study of the determinants of chronic malnutrition in northern Nigeria: quantitative evidence from the Nigeria demographic and health surveys international food policy research institute (IFPRI) working paper 45 (September 2017). Food Nutrition Bulletin. (2018) 39:296–314. doi: 10.1177/0379572118768568
34. Berenger, V, and Vérez, J-C. Les Déterminants individuels et contextuels de la sous-nutrition des enfants d'âge préscolaire au Sénégal. J de gestion et d'économie de la santé. (2019) 3:237–58. doi: 10.3917/jges.193.0237
Keywords: chronic malnutrition, temporal change, Oaxaca-Blinder decomposition, healthcare services, child health, Burkina Faso
Citation: Sawadogo PM, Kobiané J-F and Tchouaket Nguemeleu E (2024) Temporal variation of chronic child malnutrition in the context of strengthening healthcare services in Burkina Faso: an Oaxaca-Blinder multivariate decomposition analysis. Front. Public Health. 12:1356918. doi: 10.3389/fpubh.2024.1356918
Edited by:
Mojisola Olanike Kehinde, Landmark University, NigeriaReviewed by:
Olutosin Ademola Otekunrin, Federal University of Agriculture, Abeokuta, NigeriaOpeyemi Abosede Faronbi, Landmark University, Nigeria
Copyright © 2024 Sawadogo, Kobiané and Tchouaket Nguemeleu. This is an open-access article distributed under the terms of the Creative Commons Attribution License (CC BY). The use, distribution or reproduction in other forums is permitted, provided the original author(s) and the copyright owner(s) are credited and that the original publication in this journal is cited, in accordance with accepted academic practice. No use, distribution or reproduction is permitted which does not comply with these terms.
*Correspondence: Pengdewendé Maurice Sawadogo, sawpmaurice2013@gmail.com