 Zheqi Yu
 Adnan Zahid
 Shuja Ansari
 Hasan Abbas
 Hadi Heidari
 Muhammad A. Imran
 Qammer H. Abbasi
- 1James Watt School of Engineering, University of Glasgow, Glasgow, United Kingdom
- 2School of Engineering and Physical Sciences, Heriot Watt University, Edinburgh, United Kingdom
Aiming at the self-association feature of the Hopfield neural network, we can reduce the need for extensive sensor training samples during human behavior recognition. For a training algorithm to obtain a general activity feature template with only one time data preprocessing, this work proposes a data preprocessing framework that is suitable for neuromorphic computing. Based on the preprocessing method of the construction matrix and feature extraction, we achieved simplification and improvement in the classification of output of the Hopfield neuromorphic algorithm. We assigned different samples to neurons by constructing a feature matrix, which changed the weights of different categories to classify sensor data. Meanwhile, the preprocessing realizes the sensor data fusion process, which helps improve the classification accuracy and avoids falling into the local optimal value caused by single sensor data. Experimental results show that the framework has high classification accuracy with necessary robustness. Using the proposed method, the classification and recognition accuracy of the Hopfield neuromorphic algorithm on the three classes of human activities is 96.3%. Compared with traditional machine learning algorithms, the proposed framework only requires learning samples once to get the feature matrix for human activities, complementing the limited sample databases while improving the classification accuracy.
1 Introduction
Human activities are movement postures with various features that human beings do while at study, work, production, and other situations (Grossi, 2019), including regular or irregular movement patterns and states such as running, walking, standing, sitting, and lying (Guiry et al., 2014). As society is consistently changing, science and technology are advancing rapidly, while artificial intelligence is becoming more and more popular. Research methods for human activity recognition are continually evolving, and it has become the primary technology for many applications such as health care (Liu et al., 2018; Yang et al., 2018), human–computer interaction (Zhang et al., 2017), and robotic control (Schmucker et al., 2018). Meanwhile, with the development of mobile computing and sensing technology, wearable sensor signals have become common data (Banaee et al., 2013). When an object stays in a different position, performs different activities, or performs different gestures, it will have different effects on the signal characteristics of surrounding sensors (Hussain et al., 2019).
At present, the human activity recognition of wearable devices has strong applicability and use value. For instance, the intelligent nursing scene system for the elderly detects and analyses the actions in real time using portable sensors. It can determine whether the elderly has eaten, medicated, or carried out the minimum exercise. To ensure the health and safety of the elderly, information around the amount of exercise and detection of abnormal actions such as falling (Ojetola, 2013) is vital. For the human–computer interaction system, through the recognition of human activity, timely and accurate responses are highly vital for the different actions (Kumar et al., 2012). For the robotic control, rehabilitation training within hospitals by identifying the degree of standardization of movement behavior, and the recovery can be evaluated to provide better rehabilitation guidance (Lambercy et al., 2016).
Compared with the activity monitoring of external means such as radar (Zhu et al., 2018) and cameras (Ke et al., 2013), the advantages of wearable sensors are more concentrated in open-scene applications. The user is not limited to a specific monitoring area, can freely enter and exit places, and carry on behavior without the obstacles of blind spot recording and capturing (Shah et al., 2016). Therefore, human activity recognition based on wearable sensor signals overcomes the drawbacks of traditional methods and has become a promising technology for future mobile computing applications. It will play an essential role in intelligent applications such as smart health (Suzuki et al., 2013), smart space (Shelke and Aksanli, 2019), and behavioral analysis (Munoz-Organero, 2019).
Currently, machine learning methods, especially deep learning algorithms, have been widely used for human activity recognition (HAR). However, existing machine learning, especially convolutional neural network (CNN) models, induces overwhelming training data collection overhead. The problems caused by massive samples’ algorithm requirement to learning for the feature are not suitable for small datasets, which greatly reduced machine learning algorithm practicability, for example, Ayman et al. (2019) realized multi-activity recognition by a support vector machine (SVM) algorithm, with preprocessed activity data, and Chavarriaga et al. (2013) used cluster recognition activities by naive Bayes (NB) and K-nearest neighbors (KNN) algorithm. However, these are all traditional machine learning algorithms. Its algorithm capability limits its robustness, and since it focuses on a single operation, it lacks consistency and shows poor recognition effect in complicated and diverse human movement scenes. Recently, there has been a growing trend in improving recognition accuracy and applicability by deep learning. For example, Terry et al. (Um et al., 2017) proposed a CNN model that can better classify to the non-linear model to avoid the hysteresis and time-varying behaviors in sensors with higher frequency strain rate. Francisco et al. (Ordóñez and Roggen, 2016) uses the LSTM algorithm to improve the CNN structure and introduces the concept of time series of activity sensor data. This implementation is a deep learning framework composed of convolutional layers and long short-term memory (LSTM) recursive layers, which can automatically learn feature representations and build time dependencies between activity models. However, the costs of training samples for deep learning methods are not friendly to small datasets, and it depends on a wide variety of training datasets to achieve correct activity recognition. The aforementioned factors cause uncertainties, resulting in high computational complexity for training and large dataset requirements for datasets. With limited sample datasets, the classification accuracy cannot meet the requirements (O’Mahony et al., 2019). Researchers have also implemented the unsupervised learning method to clustering analysis limited datasets; however, the idea of learning transfer approaches complex algorithms, soft labeling examples increases which also leads to the design missing feature calculations (Sucholutsky and Schonlau, 2020). Following our previous study (Yu et al., 2020a), reducing the need for training data without losing classification accuracy has been a significant problem for researchers in the science community.
In this study, we present a novel framework based on the Hopfield neural network for wearable multisensor data knowledge fusion preprocessing and classification. The Hopfield neural network can be used for a single task, such as human fall recognition, as seen in earlier studies (Yu et al., 2020b). To extend the research on the data fusion of multiple sensors with the Hopfield neural network to a series of human movements, we built a dimensionality reduction matrix and placed it in the singular value decomposition (SVD) algorithm for feature extraction, also termed as data preprocessing method. Then we follow the Hebbian learning method for training the Hopfield neural network based on the corresponded human activity feature matrix. Finally, we achieve multiple human activities recognition result output by similarity calculation. Rather than considering separate single activity data in isolation, we studied the comprehensive data of three activities for comparative output to obtain significantly different feature templates for each human activity. It ensures the Hopfield algorithm can learn the related activities through the corresponding feature templates. Hence, reducing the number of training samples required while maintaining high classification accuracy.
The rest of this article is organized as follows: Section 2 presents data collection, preprocessing, and feature extraction method. Section 3 shows the implementation, evaluation, and results. Section 4 discusses and compares the project with others. Finally, Section 5 focuses on conclusions and future work.
2 Data Preprocessing and Feature Extraction
The dataset used in this work was from Li et al (Li et al., 2018a) who works at the University of Glasgow. It collects multiple activities of 20 volunteers aged between 22 and 32 years, where each activity is repeated three times. Although the sample of this dataset is limited, it is still in the top 3% in terms of the number of subjects compared with other wearable human motion analysis works (Li et al., 2017; Li et al., 2018a; Li et al., 2018b). All activities are collected by inertial measurement unit (IMU) sensors worn on the wrist. In this work, the dataset is 60 data for each activity and only requests one data in training as one-shot learning.
Ortiz (Ortiz, 2015) defines how to divide human activities. Short event activities generally refer to fast transitions between human body postures and behaviors. The basic activity lasts longer than short event activities and is usually the most frequently occurring episodes in daily human life, such as sitting, standing, running, and other behaviors. Meanwhile, these are also further divided into static activity and dynamic activity, according to the state of the human body. Moreover, there are two ways for complex activity: one is a combined activity that is aggregated through a variety of basic activities, and the other includes multiple users participating during the activity. Therefore, complex behaviors are usually divided into two further strains, that is, multi-activity and multiuser. Table 1 shows the details of selected activities based on the activity principles of duration, complexity, type, etc., the work selects three classes and activities data for experimentation which includes fall, carry, and bending to tie shoelaces. These activities have been purposefully selected into different types and include a potential class that can be misclassified as falls, such as the complex activity of bending to tie shoelaces; it involves changing the position of the bow and the complex motion of the hand. This helps test the robustness of neuromorphic computing classification. Falls cause a severe impact on the health of the elderly or the disabled; it is incredibly essential to achieve reliable recognition of low false-positive alarms and low missed detections.
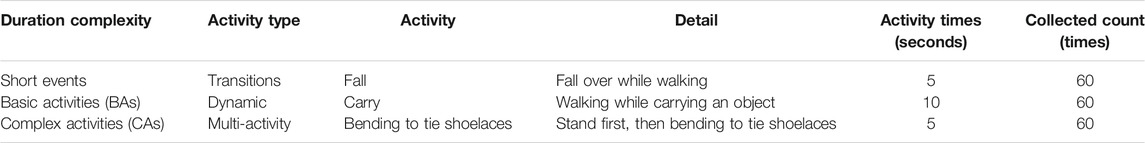
TABLE 1. Activity selected and details.
Inertial measurement unit (IMU) sensors contain three specific sensors: gyroscope, accelerometer, and magnetometer. The gyroscope sensor measures the angular velocity, that is, the speed at which the object rotates. It multiplies the speed and time to get the angle that the object rotates in a particular period. It captures the angle between the vertical axes of the gyro rotor with the device in the three-dimensional coordinate system and then calculates the angular velocity. Finally, it judges the movement state of the object in the three-dimensional space (X, Y, Z axes) through the included angle and angular velocity.
The accelerometer measures the gravitational acceleration of the object. It can sense acceleration in any direction, expressed in the three axes (X, Y, and Z axes)—acceleration, magnitude, and direction. The magnetometer is used to record the strength and direction of the magnetic field, subsequently locating the orientation (heading direction) of the device. The principle of the magnetometer is similar to the compass, which can measure the included angle between the current device and the four directions of the south, east, north, and west. Finally, the gyroscope sensor records the rotation of the device itself, the accelerometer sensor records the force exerted on the device, and the magnetometer positions the device’s orientation. All the activities will get 9-axis data by each sensor of X, Y, and Z axes.
2.1 Sensor Fusion by Quaternion and Euler Angle
The accelerometer sensor’s data provide an absolute reference for the horizontal position but cannot provide the azimuth reference. The angle is not accurately measured by the accelerometer sensor alone, which can be addressed by data fusion with a gyroscope sensor. While the magnetic field information is in a stable environment, the sensor achieves the same magnetic field intensity in each activity. However, it can help correct the gyroscope angular velocity parameter. Therefore, the appropriate algorithm can fuse the data from various sensors to make up for the shortage of a single sensor in calculating the accurate position and direction, thereby achieving high-precision activity recognition. Meanwhile, to reduce the computational complexity of multidimensional data, the signal processing needs to consider dimensionality reduction to simplify the calculation. Here, the quaternion (Kuipers, 1999) and Euler angle (Madgwick, 2010) computing are used for the sensor data fusion. Depending on the accelerometer, magnetometer, and gyroscope sensors’ data, we update the quaternion output and then convert it to the Euler angle. Finally, the 9-axis data of three sensors are fused and reduced to a 3-dimensional dataset.
Following the raw nine-axis data calculated into the coordinate system from the three sensors, the respective three components of the gravity vector and the magnetic field vector in the world coordinate system can be obtained. Subsequently, the accelerometer achieves the three components of the gravity vector in the sensor coordinate system. Finally, the magnetometer measures the magnetic field vector in the sensor coordinate system. Let dE = [0,dex, dey, dez] be the vector coordinates in the world coordinate system. Let q be the sensor attitude. So that it can be used as q−1 to transform dE into the vector coordinate dS = [0,dsx, dsy, dsz] in the sensor coordinate system. The gyroscope sensor data achieve the angular velocity (ω) by integrated computation and then follow the accelerometer and magnetometer attitude (dS) to update q as quaternion at each sampling interval by Eq 1:
where f is the device attitude fitting error, which can be calculated from the current attitude q and the attitude dS. These are according to Eq. 2 to achieve Eq. 3 as an integrated calculation as follows, where
Since combined rotation and vector transformation are frequently used in attitude calculation, the quaternion can simplify the calculation and smoothen interpolation. Quaternion parametrization (of the rotation) only needs a four-dimensional quaternion to express arbitrary rotation, which is more efficient than the matrix method (Ben–Ari, 2014).
The Euler angle is used to define the rotation of the device in space. It rotates as a fixed angle to sequence around the coordinate system of Z, Y, and X axes. The roll angle (ϕ), pitch angle (θ), and yaw angle (ψ) were used to represent the rotation angle around X, Y, and Z axes on the coordinate system of the object (Janota et al., 2015). The attitude matrix determined by the Euler angle is the product of the cubic coordinate transformation matrix.
For the sensor fusion, this work first converts the accelerometer and magnetometer sensor’s data to the coordinate system and then calculates the deviation with the corresponding reference gravity vector and magnetic field vector. This deviation is used to correct the output of the gyroscope; after that, we use the gyroscope data to update the quaternion to the 4-dimensional feature expression of activity. Finally, we follow the Euler angle computing to convert the quaternion. Figure 1 shows 9-axis sensor’s raw data (Figure 1A) which are dimensionally fused and given to the 3-dimensional Euler angle feature (Figure 1B), without affecting the expression of the corresponding action.
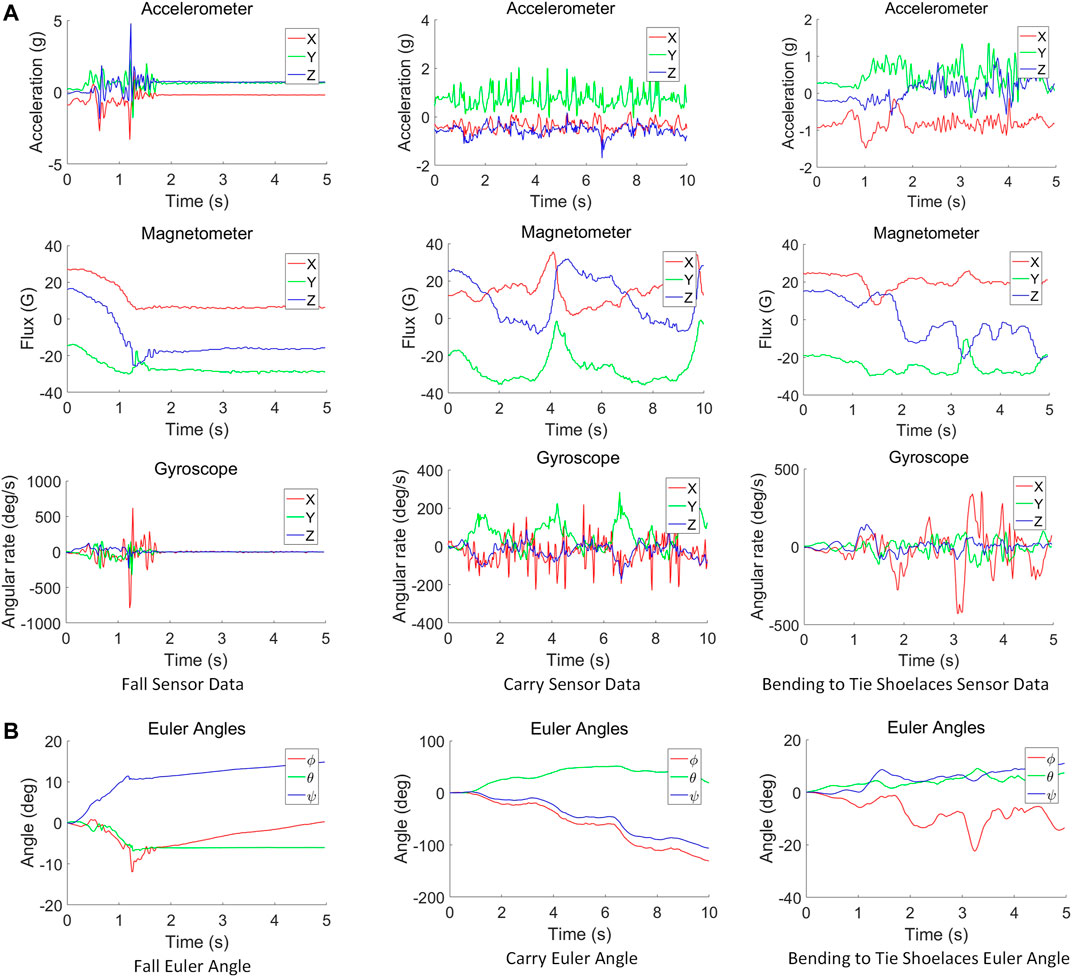
FIGURE 1. Activity calculated from the IMU raw sensor data to the Euler angle feature: (A) IMU 9-axis sensor data. (B) Euler angle feature.
2.2 Feature Extraction by SVD: Singular Value Decomposition
When performing dimensionality reduction processing on a high-dimensional vector space model, there are usually two methods that are feature selection and feature extraction. Feature extraction has changed the original feature space, which is created and refines new features on the basis of the original features. It converts the original data into a set of apparent physical features, or kernel features. Feature selection only filters the original features that are selecting a set of statistically significant features from a set of predefined features, and hence, it can also be called feature subset selection. Therefore, feature extraction is different from feature selection solution. It extracts the abstract features contained in the original features according to a specific algorithm.
The simple way to obtain a low-dimensional feature subspace expression is to perform a linear transformation on the original high-dimensional feature space. Here, the study chooses the singular value decomposition (SVD) (Klema and Laub, 1980) to extract features of different human activities. It is crucial matrix decomposition in linear algebra, which is based on the singular value decomposition method to calculate the feature spaces and feature vectors of the matrix, so that low-dimensional features can represent the original data. SVD decomposes the original matrix data into three submatrices U, Σ, and VT following Eq. 4:
where U is an m×m matrix, Σ is an m×n matrix, and VT is an n×n matrix, which is the conjugate transpose of V, an n×n matrix. U and VT are two sets of orthogonal vectors, which means we get two sets of the orthogonal basis. The A matrix as original data, which rotates a vector from orthogonal basis vector space of VT to the orthogonal basis vector space of U, with certain scaling in each direction. Then we achieve the scaling factor as singular values of Σ. Σ being a diagonal matrix, we sort the diagonal values in descending order. It is corresponding to the singular values of the original data, and the matrix values are all 0, except the values on the main diagonal, where each element on the main diagonal is called a singular value.
The singular value can be used as a feature to express a rectangular matrix or a singular matrix, which can be regarded as mapping from one feature space to another feature space, whereby the project completes the feature extraction of the Euler angle feature to each activity matrix pattern. Figure 2 shows the Euler angle data through 3 times SVD computing for dimension reduction and feature extraction that is scaled to a 5 × 5 feature matrix to distinguish different human activities. Figure 2A is a construction matrix from Euler angle value, and the matrix size is the product of time and frequency (where sensor’s sampling frequency is 50 Hz). The roll angle (ϕ) data are loaded in the first row, the pitch angle (θ) data are put into the first column, and the yaw angle (ψ) data on the diagonal of the construction matrix. Then, Figures 2B–D are following the SVD processing for dimension reduction and feature extraction on the construction matrix. Carrying out matrix decomposition through SVD computing, the large matrix can be decomposed into a product of three small matrices. The middle Σ matrix of the upper left corner is the most important feature value, which represents the main component of the matrix decomposition. At this point, we keep the upper-left data as a new matrix, and the rest of the positions are regarded as zero for data dimension reduction. It still retains the significant features of the data. After three times SVD computing, Figure 2E shows the use of Hankel computing to compress matrix into 5 × 5 by Eq. 5 (Drmac, 2015). This further specifies that the first column is the first n values of the diagonal on the matrix, and the last row is the last m values of the diagonal on the matrix (n×m = final matrix size). All other elements in the Hankel matrix are equal to the adjacent position of the lower-left corner. Finally, Figure 2F converts the Hankel matrix into a binary pattern by the threshold value, which is significant to distinguish the three activities as different feature matrices.
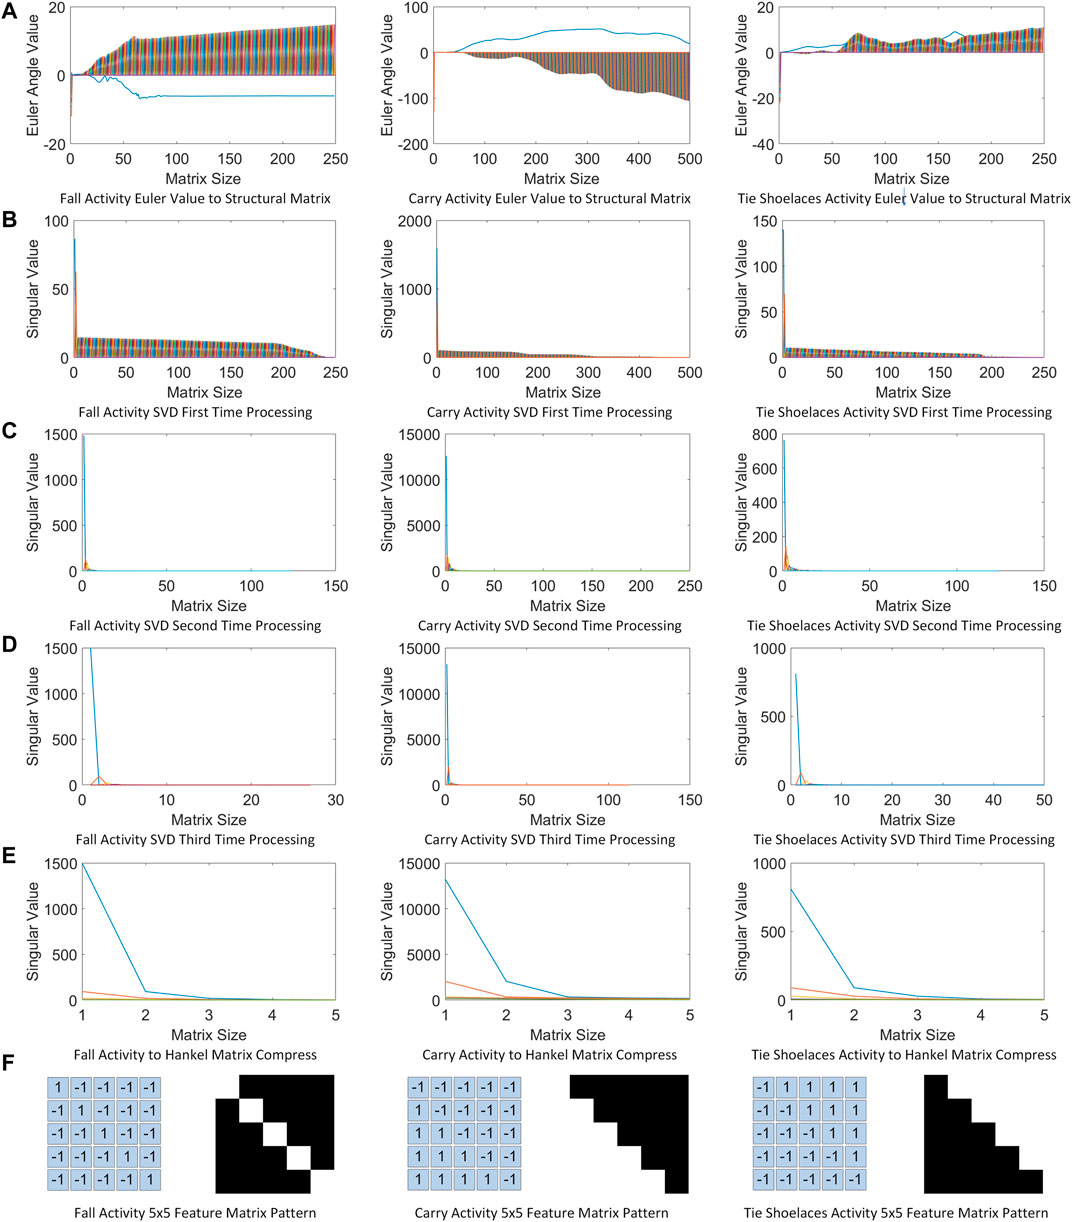
FIGURE 2. Euler angle value calculated by SVD to achieve 5 × 5 feature matrix of activity binary pattern. (A) construction matrix from Euler angle value. (B), (C), (D) following the SVD processing for dimension reduction and feature extraction on the construction matrix. (E) Hankel computing. (F) Hankel matrix into a binary pattern by the threshold value.
The achieved feature matrix of each human activity can improve the accuracy of recognition, construct a faster and less expensive classification model, and give a better understanding and interpretation of the model than Euler angle. Meanwhile, the binarized pattern is convenient for further transmission to the Hopfield neural network to a training classification model.
2.3 Hopfield Neural Network: Binary Pattern
The Hopfield neural network is a recurrent feedback neural network, which is a fully connected structure of network feedback from the input to output to achieve associative memory. The discrete Hopfield neural network (DHNN) (Hopfield, 1982) is one of the binary neural networks. The activation function of each neuron is a step function. The input and output of the neuron are binary values of -1 and 1. Eq. 6 shows discrete values 1 and -1, indicating that the neuron xj is in an activated state or an inhibited state, respectively.
There are N neuron node structures of the DHNN in Figure 3, and it shows the output of each neuron is connected to the input of other neurons, without self-feedback. The green circle means neurons, and the blue circle represents each connection between neurons. However, due to the neurons without self-feedback, each self-connection point will be empty that is shown as a yellow circle. Each node can be in an activated state 1) or an inhibited state (-1), when the activation of the neuron exceeds its threshold. The connect weight of any two neurons is Wij, and there are symmetrical interconnections between each neuron given by Wij = Wji. The output of each neuron is the input to all of the other neurons, which means the input of each neuron comes from other neurons output. Therefore, the neuron output signal eventually is fed back to itself through other neurons.
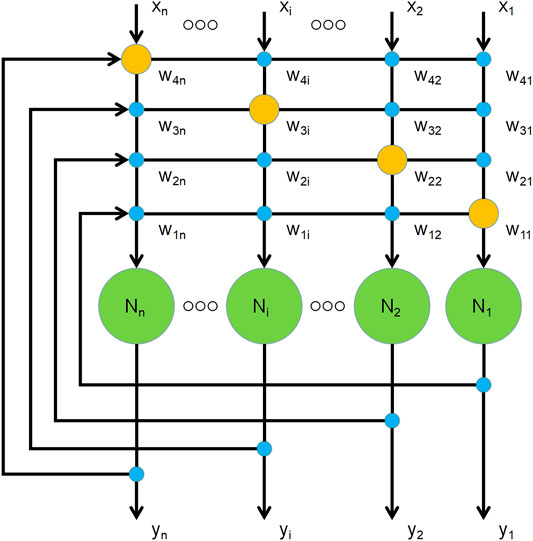
FIGURE 3. Neuron node structure of DHNN.
In this feedback process, the input generates excitation, and then the output corresponds to product continuous state changes. At this point, the neuron computing the object pattern is to be memorized. When the Hopfield neural network converges, the neuron state no longer changes; hence, the feedback and iterative process slows down. Finally, the neuron completes memory learning and establishes an attractor pattern of a final stable state, which is when the energy function of the neural network approaches the minimum. In a dynamic system of the Hopfield neural network, the attractor of a stable state can be represented as the energy function of the system which continuously decreases during operation, and finally approaches the minimum value. The energy function Eq. 7 is given as follows, where Wij is the connect weight of the neuron i and neuron j, Xi,j is the value of the neuron i and neuron j, and θj is the threshold of the neuron j:
The DHNN follows the Hebb learning method, which is a neural network learning rule proposed by Donald Hebb (Hebb, 2005). It is used to describe the behavior of the connection relationship between neurons. Such as two connected neurons where both are activated; it can be considered that the relationship between the two neurons should be relatively close. Hence, the weight of the connection between these two neurons is increased. On the contrary, when one of the two neurons is activated and the other one is inhibited, the weight between the two neurons should decrease. The weight update between neurons can be represented in Eq. 8:
The connection weights of neurons Xi and Xj are determined by their outputs, where α is a constant learning rate for the learning step size. After converting to DHNN, it can be simply expressed as in Eq. 9 (Rojas, 1996):
When the DHNN is used for associating memory to patterns, it is constrained by the memory capacity and the sample difference, which is proportional to the storage capacity. This is the number of neurons required for each sample memory capacity. When the memory capacity exceeds the neuron storage capacity, the system will confuse the stored samples. It appears as errors in the neurons’ signal output. Relative to the steady state of the correct memorized pattern, spurious states will also be generated during the learning process of associative memory in the Hopfield network. When the pattern samples of learning and memory do not meet the orthogonality condition, the dynamic update of the energy function may produce a false minimum. It will cause the neural network to return wrong or incomplete learning results. Therefore, the associative memory will be wrong on the neuron; the result corresponds to the local minimum of energy and is called spurious attractors. The current configuration of the neural network is projected into the subspace spanned by the pattern vector with a learning rule. We ensure that the memory pattern computing meets the maximum pattern memory capacity (Pmax) of a learning rule. It can avoid the Hopfield neural network–generated spurious states of the pattern learning, which means the local minimum value in the energy function can be reduced. Following the principle of neuron training, the storage capacity proportional follows the relationship of neurons N and patterns K by Eq. 10. The storage capacity proportion is approximately 0.14 N, which is the maximum number of memorized patterns.
The Hopfield neural network training phase is illustrated in Figure 4 with the three activities. Figure 4A depicts one Hopfield neural network state–space neuron that processes training. The weight of the DHNN is calculated using a feature matrix (5 × 5 feature pattern of human activity) and the constructed Hebbian learning law, and it indicates that the neuron has reached a stable state after the 5 steps of training. Figure 4B displays the entire DHNN weight output after the algorithm trained the three preprocessed binary patterns of activities. Since the DHNN has the smallest space, it memorizes three patterns: 5 × 5 = 25 (storage capacity equal to 0.14 N) (Ramsauer et al., 2020) neurons; hence, the above data preprocessing stage is used to obtain the 5 × 5 feature matrix as the behavior pattern.
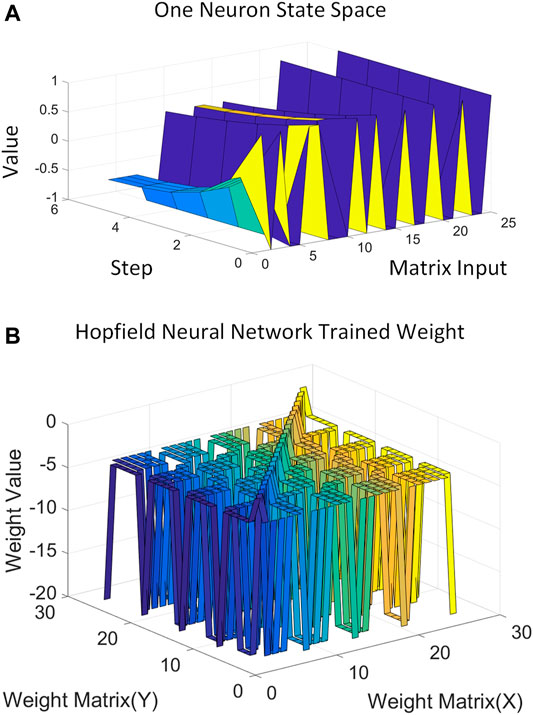
FIGURE 4. Discrete Hopfield neural network neuron and weight trained by three activities. (A) one Hopfield neural network state-space neuron. (B) entire DHNN weight output.
2.4 Cosine Similarity Work for Recognition
When the Hopfield algorithm is used for associative memory, it only needs to give part of the information of the input mode, and then the algorithm can associate itself to the complete output mode. At this point, it is fault-tolerant, which is conducive to the input of the sensor data at different time frames into the algorithm. Finally, we obtain a usable matrix output while reducing the time sensitivity of the algorithm with data. After the output, the matrix is obtained by the Hopfield algorithm; furthermore, the vectors representing each matrix feature can be calculated by the cosine of the angle of the inner product space. This measures the similarity between the matrices and achieves the classification of the data. Cosine similarity (Nguyen and Bai, 2010) is based on cosine distance computing, which is a measure of the difference between two individual matrix data. It uses the cosine of the angle calculation between two vectors in the vector space. When the cosine value is closer to 1, it implies that the angle is closer to 0°, meaning there is a relatively higher level of similarity between the vectors. This calculation method of cosine distance is suitable for n-dimensional vectors. Following Eq. 11, A and B are two n-dimensional vectors, and the cosine of the angle θ between A and B can be calculated as follows.
In this regard, all sensor signals will undergo the previous feature extraction to output different feature patterns. In the subsequent neural network, except for the trained 3 activity models, any other data cannot activate the neurons. Then the output of the Hopfield neural network linked to the cosine similarity achieves human activity recognition. Three trained activities will get a high probability of similarity output, and other data signals will output low cosine similarity since the neurons are not activated. Finally, a classifier based on neuromorphic computing achieves effective human activity recognition as elaborated in the following Results Evaluation Section.
3 Results Evaluation
Figure 5 is the workflow of the algorithm framework, which shows each working step from the sensor’s raw data into the algorithm until the final output of the classification result. According to the profile report of the pie chart in Figure 5, it depicts the relative importance of each function in the entire system and explains how to distribute work and coordinate with one another. The system’s primary focus is on the Hopfield neural network, which explains that the recognition work is the most essential and complex calculation in the system. At this point, the first challenge is how to make a suitable feature map input as a training template on the Hopfield neural network. The system’s second challenging task is SVD processing, which mainly depends on the discrete Hopfield neural network input requirement. Since the neural network uses binary information instead of raw data, the SVD algorithm can perform data preprocessing for feature extraction, resulting in a binary feature map with activities. It requests feature extraction computing to raw sensor data and then converts it into a binary feature matrix controlled by a threshold value. The following are additional details:
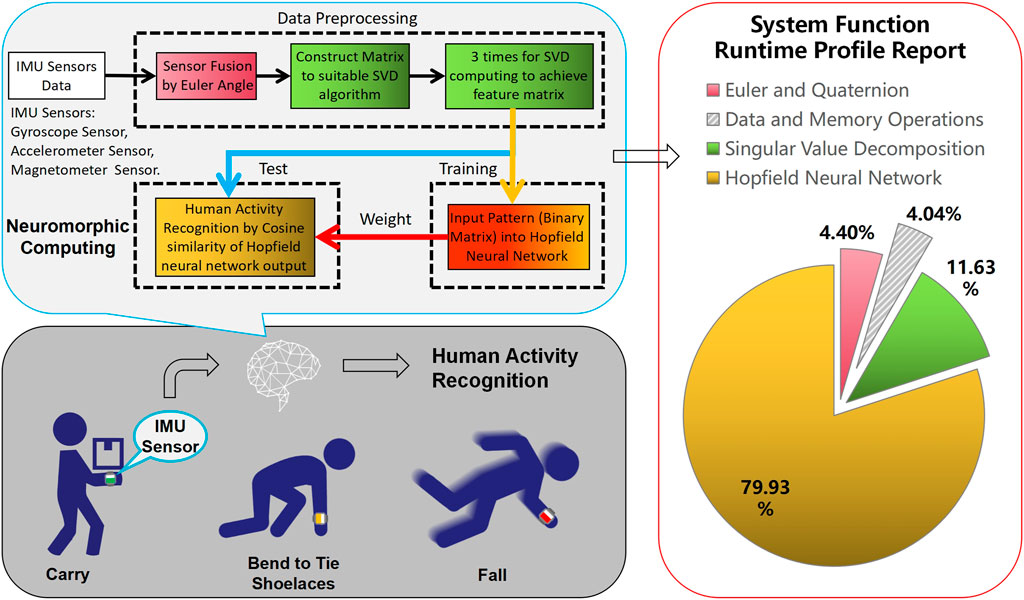
FIGURE 5. Workflow for sensor data to achieve human activity recognition.
Sensor fusion: The purpose of this step is to fuse the raw data of the sensors. Using the Euler angle, we reduce the 9-axis data of the three sensors with increasing data differentiation of activities.
Construction matrix: Based on the Hopfield neural network for memory storage of three activities, the processing on 25 neurons of 5 × 5 binarized matrix input becomes the optimal design. The fused data can then be constructed as a matrix to achieve feature extraction and binarization pattern. The feature matrix is output to the template of different activities to suitable Hopfield neural network processing.
SVD algorithm: Depending on the three times singular value decomposition, it is mainly working for dimension reduction and feature extraction. After computing, there are three activities that can achieve totally different feature matrices on the 5 × 5 size. This can then be efficiently input into the Hopfield neural network training.
Hopfield neural network: This step is to obtain the advantages of neuromorphic computing by loading the designed binarized feature matrix into the Hopfield algorithm. The neural network weight is calculated by standardized activity data without the massive training samples, and the three activities memories are stored in neurons.
Classification function: During the test, all the input signals work with the data preprocessing is fed into the Hopfield algorithm achieving our desired output. At this point, we calculate cosine similarity between the output signal of the neural network and standardized feature matrix. The Hopfield algorithm acts as a filter blocking the data outside the memory and only outputs the activity data that satisfy the memory. Through the threshold of cosine similarity, the accuracy confusion matrix can then be obtained to complete the human activity recognition.
In the algorithm, feature extraction determines the input of the network, which is one of the most critical aspects of the framework. The extracted features must reflect the category differences of the object data. It needs excellent tolerance to the randomness and noise of sensor data. Meanwhile, it should be convenient to add new categories as a flexible framework. Depending on the specific project, it can include steps such as removing unique attributes, processing missing values, attribute encoding, data normalization, feature selection, and principal component analysis. The data for this project are processed using coarse grid feature extraction and binarization, which is suitable for the DHNN algorithm training.
The two confusion matrices representing the algorithm’s classification present the results for the three classes of human activities. The confusion matrix summarizes the results of the dataset in the matrix form by the real category and the predicted category. The columns of the matrix represent the true values, and the rows of the matrix represent the predicted values. Table 2 is the precision results of the algorithm classification, which indicates the percentage of samples that are classified to be positive. That is calculated by True Positive (TP)/(True Positive (TP) + False Positive (FP)). Among the three human activities, the classification of “carry” activity is correct, which indicates the algorithm’s classification has the highest success rate for “carry” activity, and it will not misidentify other activities as “carry.” Table 3 is the recall rate of the classification, which represents the percentage of correctly classified positive samples in the truly positive sample and is calculated by True Positive (TP)/(True Positive (TP) + False Negative (FN)). The result shows that the algorithm is most sensitive to shoelace tie activity. Finally, the algorithm classification accuracy calculated as (True positive (TP) + True negative (TN))/(True positive (TP) + False positive (FP) + True negative (TN) + False negative (FN)), for the three human activities comes to be 96.3%.

TABLE 2. Confusion matrix of classification precision.

TABLE 3. Confusion matrix of classification recall.
Table 4 shows a comparison against traditional machine learning algorithms and proves that better results are achieved through the proposed neuromorphic algorithm under a suitable feature extraction model. As discussed earlier, this depends on the associative memory function of the Hopfield neural network and generates activity weights after learning the one training sample, based on the SVD and computation of the feature matrix. Li et al. (2018a) based on traditional machine learning algorithms worked on the same dataset, which achieved classification result by a support vector machine (SVM) and artificial neural network (ANN). Although existing machine learning has a good recognition effect, there is overwhelming training data collection overhead. Spiros et al. (2020) proposed a method from a change detection algorithm along with deep learning, which is wide generalization by operation upon a raw sensor accelerometer signal and then used it as an activity feature input to the CNN algorithm to achieve fall recognition. Ashry et al. (2020) followed the long short-term memory (Bi-LSTM) algorithm to input autocorrelation, median, entropy, and instantaneous frequency as stream features that achieves IMU sensing human activity recognition. However, as existing machine learning, especially deep learning, a good recognition effect has been obtained, which induces overwhelming training data collection overhead. Taylor et al. (2020) tried some neural network methods on the same activities for recognition. Meanwhile, they used the fast Fourier transform (FFT) method to improve the classification accuracy of limited datasets, which is based on orthogonal frequency division multiplexing (OFDM) for 64 points of FFT producing 64 frequency carriers. However, these use Universal Software Radio Peripheral (USRP) radar signal data, and the method cannot extend to sensor data. Comparing their work, we believe that the recognition findings are preferable, demonstrating that neuromorphic computation is effective in recognizing human behavior. Furthermore, our proposed framework has greater robustness and can adapt to more different types of matrix data. Meanwhile, the Hopfield neural network benefits from only one training sample to achieve good classification accuracy, which addresses the limited dataset problems.
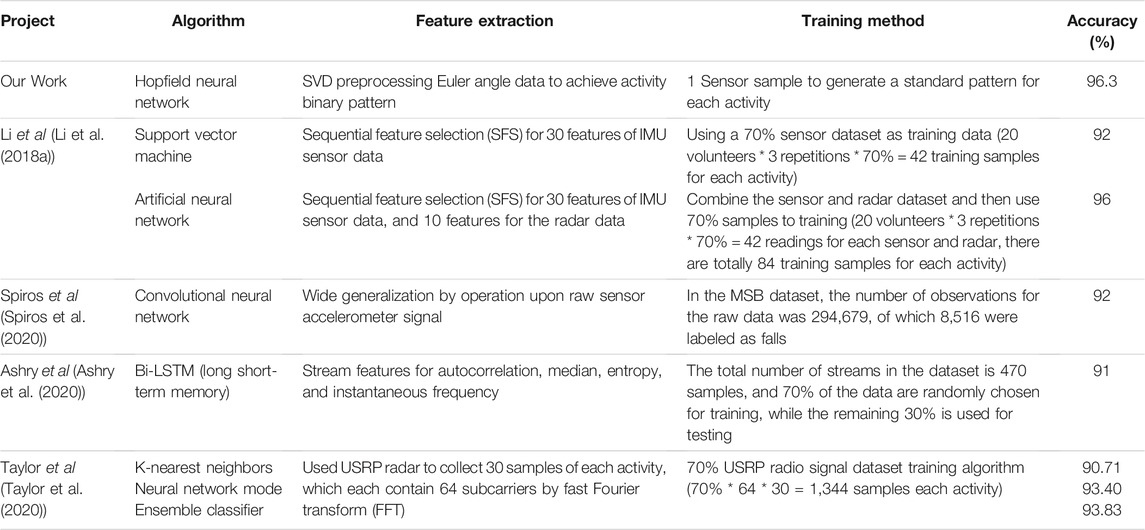
TABLE 4. Comparison table with other machine learning methods.
4 Discussion
Simple feature maps of different classes are realized by feature extraction for sensor data, while a discrete Hopfield neural network is utilized to compensate similar data that achieve robustness in human activity features. For example, some drift in the angle calculations of the IMU sensor sometimes makes it impossible to have error-free data of acquiring activities. Traditional deep learning has weak learning ability and often requires massive data and repeated training to generalize sufficient accuracy. Such deep neural networks are usually good at learning features from high-dimensional data; however, they require training with a large sample dataset.
In contrast, when SVD preprocesses the new input data, the calculated activity features are improved by the associative memory function of the Hopfield neural network, which then disassociates corrupted data and outputs correct activity feature information. This makes it one-shot learning for different activities to achieve prior knowledge and form a knowledge structure and is based on associative memory to expand the data generalization processing. The resulting associative memory helps in generalizing data to quickly match the correct activity feature map and finally accurately classify human activities. One-shot learning was completed to implement HAR for limited datasets, and high-precision results were obtained. Meanwhile, randomly selecting a single training sample that verifies the robustness of the designed algorithm is convenient to promote more datasets.
Based on the neuromorphic computing of the Hopfield neural network to realize one-shot learning, the associative memory of data works somewhat like the human brain; it aims to achieve feature information about the object classes from one training sample and randomly selects one data in the dataset as the training sample for the Hopfield neural network and then the feature matrix obtained after the feature extraction calculation, which can be mapped into the feature template of the corresponding activity. The associative memory function of the Hopfield neural network with the similarity of the distance calculation, that is, composition, learns the required elements once. These constitute one-shot learning elements and are finally achieved HAR by the associative memory function of the Hopfield neural network with the similarity of the distance calculation. Of course, this method also has certain limitations. For instance, the number of learning activities is limited to the neurons. More activity classes require more neurons to remember patterns to avoid spurious patterns in Hopfield neural networks. The feature extraction process (achieves the memory pattern to the Hopfield neural network) also has a significant disadvantage. The SVD algorithm works with massive matrix data and then reduces it to useful feature maps of each activity. It should design an elaborate construction matrix to feature map for adapting the Hopfield neural network memory learning, which then achieves suitable binary patterns for different activities without interference. Nevertheless, as the number of learned activity classes increases, the task becomes more difficult. This is because the associative memory function of the Hopfield neural network has the limitation of the storage capacity proportion. Generally, it can only store 0.14 N data (N is the number of neurons). When a large number of feature templates are needed to be memorized, more neurons need to be added into network to meet the demand.
5 Conclusion
In this study, we first use the quaternion and Euler angles to fuse multiple sensors data, followed by extracting the features against each human activity with the SVD algorithm. Finally, following the designed activity feature matrix to train and test on the Hopfield neural network achieves human activity recognition. The proposed approach shows 96.3% classification accuracy after one training sample of each activity while improving performance and robustness compared with traditional machine learning approaches. Our research suggests that the Hopfield neural network can avoid large training dataset requirements when preprocessing is used for designing the activity feature matrix. The neural network weight specified by the neural dynamics operation follows the Hebbian learning method to train the Hopfield algorithm. After obtaining one feature information, the algorithm starts to associate memory and feedbacks the output matrix information, making it much less dependent on training samples of the dataset. Following the results, it is verified that our proposed framework is suitable for general datasets to reduce the training samples request, which is limited datasets can also build a high-accuracy recognition model.
Data Availability Statement
The data analyzed in this study is subject to the following licenses/restrictions: The dataset belongs to an article: Magnetic and Radar Sensing for Multimodal Remote Health Monitoring. Requests to access these datasets should be directed to Francesco Fioranelli, francesco.fioranelli@glasgow.ac.uk.
Author Contributions
ZY contributed to the conception and design of the study. ZY organized the database. ZY performed the statistical analysis. ZY wrote the first draft of the manuscript. AZ, SA, and HA wrote—review and editing—the manuscript. QA, HH, and MI supervised the study. All authors contributed to manuscript revision, read, and approved the submitted version.
Funding
ZY is funded by a joint industrial scholarship (Ref:308 987) between the University of Glasgow and Transreport London Ltd.
Conflict of Interest
The authors declare that the research was conducted in the absence of any commercial or financial relationships that could be construed as a potential conflict of interest.
Publisher’s Note
All claims expressed in this article are solely those of the authors and do not necessarily represent those of their affiliated organizations, or those of the publisher, the editors, and the reviewers. Any product that may be evaluated in this article, or claim that may be made by its manufacturer, is not guaranteed or endorsed by the publisher.
Acknowledgments
The authors would also like to thank Francesco Fioranelli and Haobo Li for supporting Human Activities Dataset.
References
Ashry, S., Ogawa, T., and Gomaa, W. (2020). Charm-deep: Continuous Human Activity Recognition Model Based on Deep Neural Network Using Imu Sensors of Smartwatch. IEEE Sensors J. 20, 8757–8770. doi:10.1109/jsen.2020.2985374
Ayman, A., Attalah, O., and Shaban, H. “An Efficient Human Activity Recognition Framework Based on Wearable Imu Wrist Sensors,” in Proceedings of the 2019 IEEE International Conference on Imaging Systems and Techniques (IST), Abu Dhabi, United Arab Emirates, December 2019 (Piscataway, New Jersey: IEEE), 1–5.
Banaee, H., Ahmed, M., and Loutfi, A. (2013). Data Mining for Wearable Sensors in Health Monitoring Systems: a Review of Recent Trends and Challenges. Sensors 13, 17472–17500. doi:10.3390/s131217472
Ben-Ari, M. (2014). A Tutorial on Euler Angles and Quaternions. Israel: Weizmann Institute of Science.
Chavarriaga, R., Sagha, H., Calatroni, A., Digumarti, S. T., Tröster, G., Millán, J. d. R., et al. (2013). The Opportunity challenge: A Benchmark Database for On-Body Sensor-Based Activity Recognition. Pattern Recognition Lett. 34, 2033–2042. doi:10.1016/j.patrec.2012.12.014
Drmac, Z. (2015). Svd of Hankel Matrices in Vandermonde-Cauchy Product Form. Electron. Trans. Numer. Anal. 44, 593–623.
Grossi, M. (2019). A Sensor-Centric Survey on the Development of Smartphone Measurement and Sensing Systems. Measurement 135, 572–592. doi:10.1016/j.measurement.2018.12.014
Guiry, J. J., van de Ven, P., Nelson, J., Warmerdam, L., and Riper, H. (2014). Activity Recognition with Smartphone Support. Med. Eng. Phys. 36, 670–675. doi:10.1016/j.medengphy.2014.02.009
Hebb, D. O. (2005). The Organization of Behavior: A Neuropsychological Theory. Hove, East Sussex, United Kingdom: Psychology Press.
Hopfield, J. J. (1982). Neural Networks and Physical Systems with Emergent Collective Computational Abilities. Proc. Natl. Acad. Sci. 79, 2554–2558. doi:10.1073/pnas.79.8.2554
Hussain, Z., Sheng, M., and Zhang, W. E. (2019). “Different Approaches for Human Activity Recognition: A Survey,”. arXiv:1906.05074 (Ithaca, NY: arXiv).
Janota, A., Šimák, V., Nemec, D., and Hrbček, J. (2015). Improving the Precision and Speed of Euler Angles Computation from Low-Cost Rotation Sensor Data. Sensors 15, 7016–7039. doi:10.3390/s150307016
Ke, S.-R., Thuc, H., Lee, Y.-J., Hwang, J.-N., Yoo, J.-H., and Choi, K.-H. (2013). A Review on Video-Based Human Activity Recognition. Computers 2, 88–131. doi:10.3390/computers2020088
Klema, V., and Laub, A. (1980). The Singular Value Decomposition: Its Computation and Some Applications. IEEE Trans. Automat. Contr. 25, 164–176. doi:10.1109/tac.1980.1102314
Kuipers, J. B. (1999). Quaternions and Rotation Sequences: A Primer with Applications to Orbits, Aerospace, and Virtual Reality. Princeton, New Jersey: Princeton university press.
Kumar, P., Verma, J., and Prasad, S. (2012). Hand Data Glove: a Wearable Real-Time Device for Human-Computer Interaction. Int. J. Adv. Sci. Technol. 43, 15–26.
Lambercy, O., Maggioni, S., Lünenburger, L., Gassert, R., and Bolliger, M. (2016). “Robotic and Wearable Sensor Technologies for Measurements/clinical Assessments,” in Neurorehabilitation Technology. Editors V. Dietz, T. Nef, and W. Z. Rymer (Berlin/Heidelberg, Germany: Springer), 183–207. doi:10.1007/978-3-319-28603-7_10
Li, H., Shrestha, A., Fioranelli, F., Le Kernec, J., Heidari, H., Pepa, M., et al. “Multisensor Data Fusion for Human Activities Classification and Fall Detection,” in Proceedings of the 2017 IEEE SENSORS, Glasgow, UK, 29 October-1 November 2017 (Piscataway, New Jersey: IEEE), 1–3.
Li, H., Shrestha, A., Heidari, H., Kernec, J. L., and Fioranelli, F. (2018b). A Multisensory Approach for Remote Health Monitoring of Older People. IEEE J. Electromagn. RF Microw. Med. Biol. 2, 102–108. doi:10.1109/jerm.2018.2827099
Li, H., Shrestha, A., Heidari, H., Le Kernec, J., and Fioranelli, F. (2018a). Magnetic and Radar Sensing for Multimodal Remote Health Monitoring. IEEE Sensors J. 19, 8979–8989.
Liu, L., Shah, S., Zhao, G., and Yang, X. (2018). Respiration Symptoms Monitoring in Body Area Networks. Appl. Sci. 8, 568. doi:10.3390/app8040568
Madgwick, S. (2010). “An Efficient Orientation Filter for Inertial and Inertial/magnetic Sensor Arrays,”. Report x-io and University of Bristol (UK) 25 (Bristol, UK: University of Bristol), 113–118.
Munoz-Organero, M. (2019). Outlier Detection in Wearable Sensor Data for Human Activity Recognition (Har) Based on Drnns. IEEE Access 7, 74422–74436. doi:10.1109/access.2019.2921096
Nguyen, H. V., and Bai, L. “Cosine Similarity Metric Learning for Face Verification,” in Asian conference on computer vision, Queenstown, New Zealand, November 2010 (Berlin/Heidelberg, Germany: Springer), 709–720.
Ojetola, O. (2013). Detection of Human Falls Using Wearable Sensors. Ph.D. thesis (Coventry, England: Coventry University).
O’Mahony, N., Campbell, S., Carvalho, A., Harapanahalli, S., Hernandez, G. V., Krpalkova, L., et al. “Deep Learning vs. Traditional Computer Vision,” in Proceedings of the Science and Information Conference, London, August 2019 (Berlin/Heidelberg, Germany: Springer), 128–144.
Ordóñez, F., and Roggen, D. (2016). Deep Convolutional and Lstm Recurrent Neural Networks for Multimodal Wearable Activity Recognition. Sensors 16, 115. doi:10.3390/s16010115
Ortiz, J. L. R. (2015). Smartphone-based Human Activity Recognition. Berlin/Heidelberg, Germany: Springer.
Ramsauer, H., Schäfl, B., Lehner, J., Seidl, P., Widrich, M., Gruber, L., et al. (2020). Hopfield Networks Is All You Need. arXiv:2008.02217 (Ithaca, NY: arXiv).
Rojas, R. (1996). “The Hopfield Model,” in Neural Networks (Berlin/Heidelberg, Germany: Springer), 335–369. doi:10.1007/978-3-642-61068-4_13
Schmucker, R., Zhou, C., and Veloso, M. (2018). “Multimodal Movement Activity Recognition Using a Robot’s Proprioceptive Sensors,”. Editors D. Holz, K. Genter, M. Saad, and O. von Stryk (Berlin/Heidelberg, Germany: Springer), 299–310.Robot World Cup.
Shah, S. A., Zhao, N., Ren, A., Zhang, Z., Yang, X., Yang, J., et al. (2016). Posture Recognition to Prevent Bedsores for Multiple Patients Using Leaking Coaxial cable. IEEE Access 4, 8065–8072. doi:10.1109/access.2016.2628048
Shelke, S., and Aksanli, B. (2019). Static and Dynamic Activity Detection with Ambient Sensors in Smart Spaces. Sensors 19, 804. doi:10.3390/s19040804
Spiros, G., V., Tasoulis, S. K., Mallis, G. I., Vrahatis, A. G., Plagianakos, V. P., and Maglogiannis, I. G. (2020). Change Detection and Convolution Neural Networks for Fall Recognition. Neural Comput. Appl. 32, 17245–17258.
Sucholutsky, I., and Schonlau, M. (2020). “‘less Than One’-Shot Learning: Learning N Classes from M< N Samples,”. arXiv:2009.08449 (Ithaca, NY: arXiv).
Suzuki, T., Tanaka, H., Minami, S., Yamada, H., and Miyata, T. “Wearable Wireless Vital Monitoring Technology for Smart Health Care,” in Proceedings of the 2013 7th International Symposium on Medical Information and Communication Technology (ISMICT), Tokyo, Japan, March 2013 (Piscataway, New Jersey: IEEE), 1–4.
Taylor, W., Shah, S. A., Dashtipour, K., Zahid, A., Abbasi, Q. H., and Imran, M. A. (2020). An Intelligent Non-invasive Real-Time Human Activity Recognition System for Next-Generation Healthcare. Sensors 20, 2653. doi:10.3390/s20092653
Um, T. T., Babakeshizadeh, V., and Kulić, D. “Exercise Motion Classification from Large-Scale Wearable Sensor Data Using Convolutional Neural Networks,” in Proceedings of the 2017 IEEE/RSJ International Conference on Intelligent Robots and Systems (IROS), Vancouver, BC, Canada, September 2017 (Piscataway, New Jersey: IEEE), 2385–2390.
Yang, X., Shah, S. A., Ren, A., Zhao, N., Zhao, J., Hu, F., et al. (2018). Monitoring of Patients Suffering from Rem Sleep Behavior Disorder. IEEE J. Electromagn. RF Microw. Med. Biol. 2, 138–143. doi:10.1109/jerm.2018.2827705
Yu, Z., Abdulghani, A. M., Zahid, A., Heidari, H., Imran, M. A., and Abbasi, Q. H. (2020a). An Overview of Neuromorphic Computing for Artificial Intelligence Enabled Hardware-Based Hopfield Neural Network. IEEE Access 8, 67085–67099. doi:10.1109/access.2020.2985839
Yu, Z., Zahid, A., Ansari, S., Abbas, H., Abdulghani, A. M., Heidari, H., et al. (2020b). Hardware-based Hopfield Neuromorphic Computing for Fall Detection. Sensors 20, 7226. doi:10.3390/s20247226
Zhang, S., Wei, Z., Nie, J., Huang, L., Wang, S., and Li, Z. (2017). A Review on Human Activity Recognition Using Vision-Based Method. J. Healthc. Eng. 2017, 1–31. doi:10.1155/2017/3090343
Zhu, S., Xu, J., Guo, H., Liu, Q., Wu, S., and Wang, H. “Indoor Human Activity Recognition Based on Ambient Radar with Signal Processing and Machine Learning,” in Proceedings of the 2018 IEEE international conference on communications (ICC, Kansas City, MO, USA, May 2018 (Piscataway, New Jersey: IEEE), 1–6.
Keywords: sensor fusion, neuromorphic computing, Hopfield neural network, singular value decomposition, human activity recognition
Citation: Yu Z, Zahid A, Ansari S, Abbas H, Heidari H, Imran MA and Abbasi QH (2022) IMU Sensing–Based Hopfield Neuromorphic Computing for Human Activity Recognition. Front. Comms. Net 2:820248. doi: 10.3389/frcmn.2021.820248
Received: 22 November 2021; Accepted: 10 December 2021;
Published: 07 January 2022.
Edited by:
Akram Alomainy, Queen Mary University of London, United KingdomReviewed by:
Syed Aziz Shah, Coventry University, United KingdomJawad Ahmad, Edinburgh Napier University, United Kingdom
Copyright © 2022 Yu, Zahid, Ansari, Abbas, Heidari, Imran and Abbasi. This is an open-access article distributed under the terms of the Creative Commons Attribution License (CC BY). The use, distribution or reproduction in other forums is permitted, provided the original author(s) and the copyright owner(s) are credited and that the original publication in this journal is cited, in accordance with accepted academic practice. No use, distribution or reproduction is permitted which does not comply with these terms.
*Correspondence: Qammer H. Abbasi, UWFtbWVyLkFiYmFzaUBnbGFzZ293LmFjLnVr