 Anna M. Jett1,†Venkat Kothandaraman2,†Esther Bobbin3Seth Sheldon3Lisa M. Colosi4
 Matthew J. Meyer5,6*
- 1Office for Sustainability, University of Virginia, Charlottesville, VA, United States
- 2Department of Anesthesiology, Northwestern University, Chicago, IL, United States
- 3Rho Impact, Charlottesville, VA, United States
- 4School of Engineering, University of Virginia, Charlottesville, VA, United States
- 5School of Medicine, University of Virginia, Charlottesville, VA, United States
- 6Medical Director of Sustainability, UVA Health, Charlottesville, VA, United States
Introduction: Hospitals and health systems create pollution as a byproduct of their work improving people's personal health. Pollution can harm human health. As part of a broad effort to comprehensively quantify a health system's pollution, we started with one group of pollutants, greenhouse gases, at a freestanding outpatient orthopedic center (OC).
Methods: OC has clinic rooms, imaging, administrative offices, and a small ambulatory surgery center. It was newly constructed and received LEED Silver certification in 2022. The Greenhouse Gas Protocol was used to categorize emissions into Scope 1 (direct), Scope 2 (indirect from purchased energy), and Scope 3 (supply and value chain) emissions for fiscal year 2023.
Results: OC's total annual emissions were 11,049 metric tons of carbon dioxide equivalent (MTCO2e), with 2% from Scope 1, 17% from Scope 2, and 81% from Scope 3. Most Scope 3 emissions came from just three categories: patient transportation (52% of Scope 3 emissions), purchased goods and services (20%), and employee commuting (12%).
Discussion: This initial study highlights the significant contribution of Scope 3 emissions to an outpatient center's greenhouse gas footprint. It specifically identifies patient travel as a major contributor to emissions; this is particularly important since patient travel is not always included in Greenhouse Gas Protocol healthcare assessments and patient travel can be mitigated in some circumstances by utilizing telemedicine. The emissions distribution across scopes is similar to other international hospitals, indicating generalizability, though the high proportion of patient travel emissions is unique to this outpatient-focused facility.
1 Introduction
Human health is affected by environmental health. People providing products and services for healthcare should be conscientious of their industry's contribution to environmental harm. One method of monitoring healthcare's consumption of resources and contribution to pollution is accounting for greenhouse gas (GHG) emissions.
Globally, the healthcare sector is responsible for 4.4% of total GHG emissions (1). In the United States, it is responsible for 8.5% of national emissions (2). Using the Greenhouse Gas Protocol (3) to categorize emissions from the entire US healthcare sector: 7% were directly emitted by healthcare industry buildings and operations (Scope 1), 11% were associated with purchased energy, such as electricity and steam (Scope 2), and 82% were associated with the services and products produced and consumed (Scope 3) by the healthcare sector (2).
Scope 1 and Scope 2 emissions are more easily quantified as they are either directly controlled by an organization and/or can be monitored through metering or billing. Scope 3 emissions are more complicated and typically require data from a variety of different sources to assess the emissions generated from the production and consumption of products and services. Due to the large contribution of Scope 3 emissions to total emissions in healthcare, it is important that these emissions are well characterized to understand how to most effectively utilize healthcare resources to reduce pollution while maintaining high-quality care.
In the hospital setting, life cycle analyses have been published and aggregated for a variety of different healthcare related items: medications, devices, supplies, clinical procedures and processes, even entire clinical wards (4). However, across the world there have been few published assessments of the GHG emissions of entire hospitals in peer-reviewed journals (5–11). UVA Health is aligned with the University of Virginia, which has a goal of Scope 1 and Scope 2 carbon emission neutrality by 2030. Considering the proportion of Scope 3 emissions in healthcare, we want to assess UVA Health's total GHG emissions, inclusive of Scope 3. To do this, we initiated a process to account for Scope 1, Scope 2 and Scope 3 emissions inside of our health system with a pilot study that identified, calculated, and analyzed emissions at a large, representative clinical building using the Greenhouse Gas Protocol (3).
2 Methods
The building selected for the pilot was a freestanding orthopedic center associated with UVA Health (Charlottesville, VA, USA) called Orthopedic Center Ivy Road (OC). It has discrete physical, supply, and energy boundaries from the larger medical center and health system, while containing many functions of larger hospitals. This building was opened in February 2022 and received LEED (Leadership in Energy and Environmental Design) Silver certification. It has 195,000 square feet (18,116 m2), 90 exam rooms, two operating rooms (with the potential to add more), surgical services, medical imaging, prosthetics manufacturing in a fabrication lab, a retail and institutional pharmacy, and a cafeteria.
A modified operational boundary was applied to OC for the purposes of the GHG inventory. OC is a freestanding center associated with UVA Health's orthopedic clinical care. The GHG inventory included emissions resulting from all operations occurring within the property limits of OC.
One year of data was used for all sources (Fiscal Year 2023: July 1, 2022 to June 30, 2023), and the center had over 300 full-time equivalent employees (FTE) onsite during the data collection. As FTE is a unit of measure that corresponds the collective hours of all full- and part-time employees to the equivalent number of full-time employees who could work those hours, it does not account for the impact of patients or visitors onsite. IRB approval was waived: this analysis was performed as part of a quality initiative project and is independent of specific patient data.
2.1 Greenhouse gas protocol
The Greenhouse Gas Protocol (3), a widely recognized standard for measuring and managing GHG emissions, has established a framework for categorizing emissions into three distinct scopes to comprehensively understand their carbon footprint and identify areas for emissions reduction.
Scope 1 emissions are direct emissions that occur from sources owned or controlled by an institution (3). These emissions typically arise from on-site combustion of fossil fuels in buildings, vehicles, and equipment. At OC, on-site combustion emissions stem from a natural gas boiler and a gasoline-powered vehicle. Natural gas consumption is measured by a utility meter, while mobile fuel consumption is estimated based on the distance traveled by the vehicle, which is tracked through travel logs, and the average miles per gallon for the vehicle's make and model.
Scope 1 emissions also arise from the release of purchased gases, including waste anesthetic gases when they are vented to the atmosphere. The anesthetic gases used in OC's operating rooms are sevoflurane and nitrous oxide (e-cylinders). The volume of each anesthetic gas purchased during fiscal year 2023 was obtained from procurement data.
Scope 2 emissions are indirect emissions associated with the generation of electricity, steam, heating, and cooling purchased by an institution (3). Consumption of purchased energy at OC is measured through utility meters for electricity, hot water and chilled water.
Scope 3 emissions are indirect emissions that occur in the value and supply chain of an institution, but are not directly owned or controlled by the institution (3). There are fifteen categories of Scope 3 emissions, though not all of these categories will be relevant to all organizations (see Supplementary Table S1 for explanation of category relevance or irrelevance to OC; see Supplementary Table S2 for methodology details for the relevant categories' emissions calculations).
While patient travel is not explicitly listed in the Greenhouse Gas protocol, emissions from customer travel can be included in Category 9: Downstream transportation and distribution (3). For this study, patient travel was deemed the equivalent in health care to customer travel for retail facilities, and patient travel emissions were included in Category 9.
2.2 Hybrid approach
This study employed a hybrid approach to measure Scope 3 GHG emissions, utilizing both activity and financial data. Each relevant category of Scope 3 emissions used either financial or activity data (see Table 1). This method is consistent with emerging best practices, which recognize a hybrid approach as a combination of the benefits of activity- and expenditure-based methods (12). Activity data, which refers to a quantitative measure of an activity that results in GHG emissions (3), tends to produce more accurate results, but is often more complex to obtain than financial data. Activity data was collected to measure Scope 1 and 2 emissions. For Scope 3 emissions, activity data was collected when feasible, and where activity data collection was not practical, financial data was utilized (see Table 1).
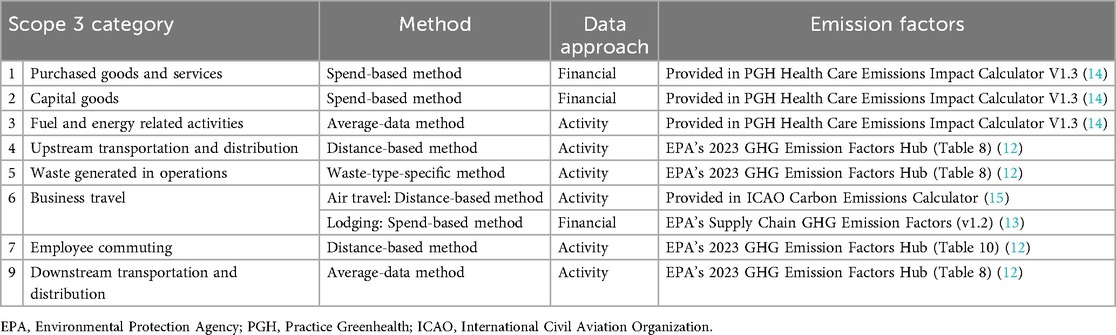
Table 1. Identification of methodologies and emission factors databases for scope 3 categories relevant to the pilot GHG assessment of a freestanding orthopedic center.
2.3 Metric tons of carbon dioxide equivalent
GHG emissions are summarized as metric tons of carbon dioxide equivalent (MTCO2e). Their GHG footprint is a summation of carbon dioxide, nitrous oxide, and methane emissions. These values came from public databases and calculators like the US Environmental Protection Agency's GHG Emission Factors Hub (13), US Environmental Protection Agency's Supply Chain Greenhouse Gas Emission Factors V1.2 (14), Practice Greenhealth's Health Care Emissions Impact Calculator V1.3 (15), and ICAO Carbon Emissions Calculator (16). They are linked to specific Scope 3 categories (see Table 1).
3 Results
Total emissions during fiscal year 2023 from the freestanding orthopedic center were 11,049 MTCO2e: 2% (183 MTCO2e) of these emissions came from Scope 1, 17% (1,929 MTCO2e) from Scope 2, and 81% (8,937 MTCO2e) from Scope 3 (see Figure 1; Table 2). Total emissions per FTE were 33.2 MTCO2e per FTE per year. Total emissions per square meter were 0.6 MTCO2e per square meter per year.
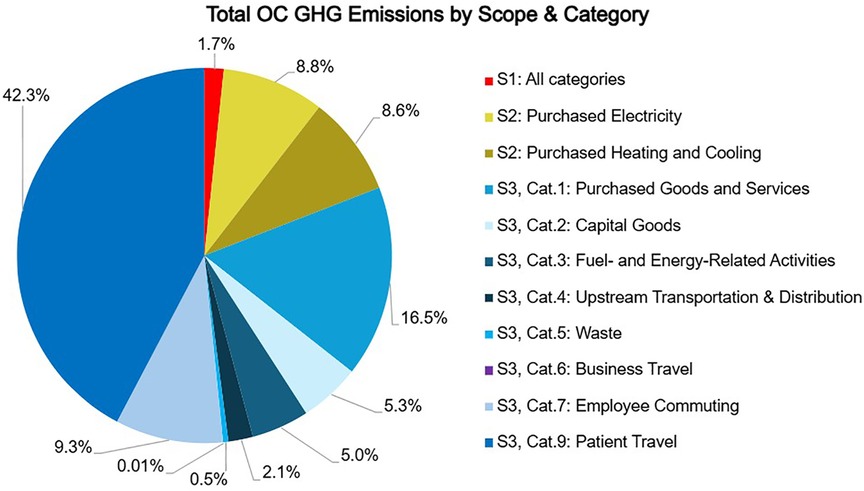
Figure 1. Source of total GHG emissions of a freestanding orthopedic clinic by scope and category. OC: orthopedic center.
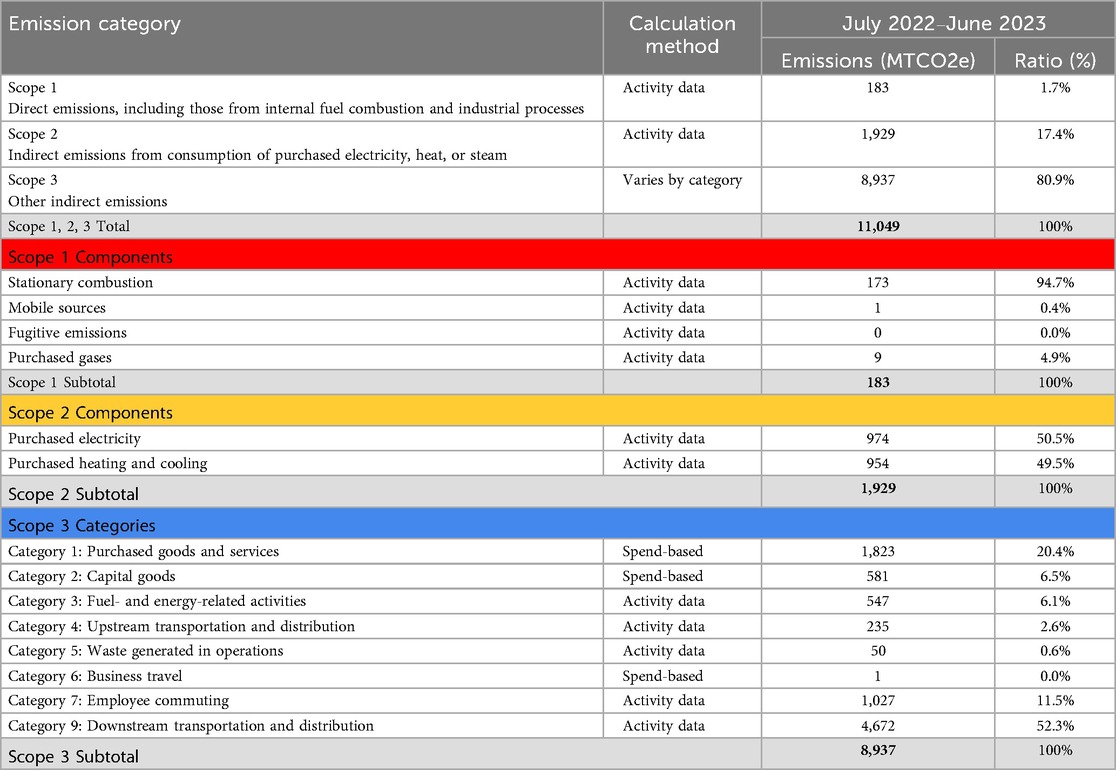
Table 2. Total emissions identified in pilot GHG assessment of a freestanding orthopedic center.
Scope 1 emissions were primarily from a single natural gas boiler (173 MTCO2e; 95%). The remaining emissions stemmed from anesthetic gases and one gasoline-powered vehicle.
Scope 2 emissions came from electricity (974 MTCO2e; 51%), hot water (669 MTCO2e; 35%), and chilled water (285 MTCO2e; 15%). OC does not purchase district steam as steam is produced by the on-site boiler.
Scope 3 emissions are derived from eight of the 15 categories (see Table 1). The other seven were deemed irrelevant to OC operations or contributed a de minimis amount (see Supplementary Table 1).
84% of Scope 3 emissions and 68% of total OC emissions resulted from three categories: Category 9: Downstream transportation and distribution (4,672 MTCO2e; 52%), which consisted solely of emissions from patient transportation to and from OC, Category 1: Purchased goods and services (1,823 MTCO2e; 20%), and Category 7: Employee commuting (1,027 MTCO2e; 12%).
In Category 9, there were approximately 200,000 patient visits to OC in FY23. The median roundtrip distance for patient travel to OC was 63 mi (IQR 32-115 mi). 98% of patients traveled from fewer than 200 mi away. Considering only Category 9 emissions, 79% came from patients living within a 100 mile drive of OC, and 40% came from patients within a 50 mile drive of OC.
In Category 1, 71% of emissions stem from the purchase of medical and surgical supplies (1,294 MTCO2e), 11% from pharmaceutical supplies (192 MTCO2e), 5% from food purchases (86 MTCO2e), and the remaining 14% from miscellaneous goods and services (252 MTCO2e), including electronics and office supplies.
Data for Category 7 came from a survey sent to OC employees with a 44% response rate. The average roundtrip commute was 42 mi with approximately 98% of commutes occurring in a personal vehicle with a combustion engine. Other identified modes of transportation included personal vehicles with an electric motor, carpools, and bicycling.
4 Discussion
Total emissions from OC were 11,049 MTCO2e. This is equivalent to the yearly, average emissions of 2,500 automobiles driving in the United States, and would require over 11,000 acres of mature forest to remove it from the atmosphere (17). OC emissions were allocated as follows: 2% to Scope 1, 17% to Scope 2, and 81% to Scope 3.
The distribution of OC emissions across the scopes aligns with that of a 1,233-bed Dutch hospital (8), a 1,250-bed Singaporean hospital (9), and a 2,500-bed German academic hospital (10) (see Table 3). These similarities suggest emission ratios may be generalizable across clinical centers.
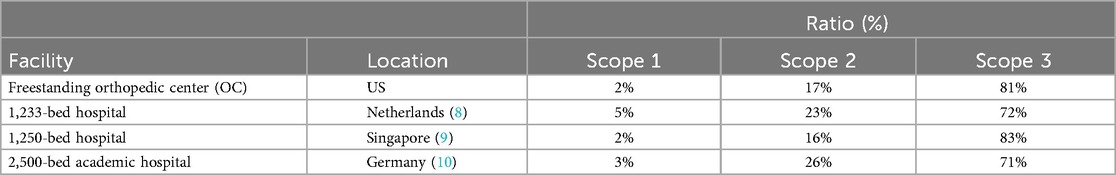
Table 3. Ratio of total GHG emissions by scope for a US freestanding orthopedic center, a Dutch hospital, a Singaporean hospital, and a German academic hospital.
Notably, a novel “easy-to-use approach based on financial data” applied at a 302-bed German academic hospital (11) had a markedly larger Scope 1 allocation of 37%–40%. This institution used fossil fuels directly for heating rather than electricity, which would increase Scope 1 emissions and decrease Scope 2 emissions.
4.1 Scope 1
The absolute value of OC's Scope 1 emissions (183 MTCO2e) are low compared to those from inpatient hospitals which ranged from 4,223 MTCO2e (9) to 9,989 MTCO2e (8). The building has just a single natural gas boiler for steam, which accounts for the majority of Scope 1 emissions (173 MTCO2e). This steam is primarily for sterile processing of procedural instruments.
The remaining Scope 1 emissions come from a single vehicle (1 MTCO2e) and anesthetic gases from the two operating rooms (9 MTCO2e). Anesthetic gases are lower than may be expected for two operating rooms for multiple reasons: (1) sevoflurane is the only volatile anesthetic used at OC and its carbon dioxide equivalent is significantly less than alternative volatile anesthetics (18), (2) many of the surgeries are performed using regional anesthesia as the primary mode of anesthesia, and (3) nitrous oxide is rarely used and only comes from e-cylinders rather than central tanks, which are known to leak (19).
Fugitive emissions from refrigerants were considered de minimis. The appliances in OC were recently installed and there were no records of recharges, maintenance, nor disposal of equipment containing over 50 lbs of refrigerant.
4.2 Scope 2
The 1,929 MTCO2e Scope 2 emissions come from electricity, hot water and chilled water. The central utility plant that services OC does not currently service other buildings, though it has the capacity to support future developments in the surrounding area. Steam is produced by an on-site boiler, rather than purchased from district utilities, so emissions from steam production fall under Scope 1. OC's electricity comes from the local grid and benefits from the renewable energy portfolio of its affiliated university. While the regional (SRVC) eGRID emission factor for OC is 0.2705 kgCO2e/kWh, OC's Scope 2 emissions utilize the university's specific emission factor for electricity (0.2435 kgCO2e/kWh) to account for the university's procurement of renewable energy.
The opportunity to reduce emissions from electricity is through either reduced consumption by emphasizing energy efficiency and conservative applications of technology or by increasing the amount of electricity generated through low-carbon or fossil fuel-free methods. In the past few decades, emission reductions from electricity generation occurred by transitioning from coal to a less carbon-intensive fossil fuel, like natural gas, and increasing fossil fuel-free options, like wind and solar (20). OC was built to accommodate rooftop solar. If a solar array was installed at OC, it could generate between 180 and 240 kWh per year and reduce Scope 2 emissions from electricity by approximately 11%.
OC's hot and chilled water are manufactured in a mostly electric utility plant, which uses a combination of heat recovery chillers, traditional chillers, and gas boilers to provide heating and cooling services. Electric heat recovery chillers efficiently capture and utilize excess heat generated in the cooling process, resulting in hot and chilled water with fewer emissions than a combination of traditional chillers and boilers. While electrification and the use of heat recovery chillers in a utility plant are generally not building-level decisions, a facility can reduce its emissions by minimizing the consumption of chilled water with lighting and temperature setbacks. These setbacks reduce the operation of lighting and temperature control features when the building is unoccupied, decreasing the need for those locations to be cooled, lowering energy consumption, and proportionally reducing energy costs.
4.3 Scope 3
The 8,937 MTCO2e of Scope 3 emissions was 81% of OC's total emissions. 84% of Scope 3 emissions came from three categories: Category 9 (4,672 MTCO2e; Downstream transportation and distribution), Category 1 (1,823 MTCO2e; Purchased goods and services), and Category 7 (1,027 MTCO2e; Employee commuting). Less than 1% of Scope 3 emissions came from Category 6 (1 MTCO2e; Business travel), but this is likely due to the persistence of virtual conferences as a result of travel restrictions during the COVID-19 pandemic.
The majority of Scope 3 emissions (52%) and a substantial portion of OC's total emissions (42%) came from Category 9: Downstream transportation and distribution, which accounts for patient travel to and from the clinic to receive care. Considering the overall contribution of patient travel to total OC emissions (42%), and that patient travel is not always included in hospital assessments (5, 6, 9, 11), we highlight it as an opportunity to reduce healthcare emissions through telemedicine.
4.3.1 Patient travel
Two emission analyses from international hospitals included patient transportation. The Dutch hospital reported patient transportation was 3.2% of total emissions (8), while the German hospital reported patient transportation was 9% of total emissions (10). An important distinction between these hospitals and OC is the hospitals are inpatient and OC is outpatient. An outpatient center can have many different patients for each clinic room each day while an inpatient hospital has only a single patient per hospital room for multiple days. There are simply many more patients transporting themselves to and from an outpatient center than an inpatient hospital. Additionally, more resource-intensive therapies occur at inpatient hospitals (e.g., infusions, dialysis, and surgery) than at an outpatient orthopedic center (e.g., clinic visits, physical therapy, surgical follow-ups), which would proportionally make other Scope 3 categories, like Category 1: Purchased goods and services [which is 59.7% of the entire Dutch hospital's emissions (8)], higher at the inpatient hospitals than at OC.
Patients may also travel further for orthopedic consultations than other specialties as demonstrated by a retrospective review from Stanford Healthcare (21). In an attempt to ensure our Category 9 emissions assessment were not inflated by university students and part-time residents who have their mailing addresses at a location far away from their physical home in central Virginia, we capped miles driven to a 200 mile one-way trip, and assumed all addresses further than 200 mi away were residents of Charlottesville with a 0 mile distance to the clinic. Even with this conservative approach to calculating patient travel, Category 9 is a majority of the Scope 3 emissions and emits more than Scope 1 and 2 combined.
OC can reduce its emissions from patient travel by optimizing the use of telemedicine (21, 22). Orthopedic patients are open to telehealth and view it as an equivalent to in-person visits (23). Applying telemedicine in situations where it optimizes clinician workflow and patient care is an opportunity to improve multiple facets of healthcare while eliminating a large source of GHG emissions and air pollution (6).
In situations where telemedicine is not optimal for clinician workflow or patient care, a reduction in patient travel emissions could come from a reduction in patients' vehicle emissions. The installation of Level 3 electric chargers in the patient parking lot could encourage patients to drive electric vehicles to their visits by addressing range anxiety.
4.3.2 Purchased goods and services
Category 1: Purchased goods and services, which includes all the supplies required to facilitate clinical, operational and administrative functions, accounted for 20.4% of OC's Scope 3 emissions. The top contributor to this category was medical supplies (1,294 MTCO2e). A Canadian study with a different methodology (statistical sampling and inference) also identified medical products as the highest contributor among goods and services (6).
OC's Category 1 emissions were 17% of total OC emissions. In comparison, purchased goods and services contributed to approximately 41% of total emissions in a hospital in Germany (10) and over 40% of total emissions in a hospital in Singapore (9). While our methodology for calculating the purchased goods and services was similar to these two studies, it is likely that different emission factors associated with national supply chains and energy production contributed to this variance. There are also differences between the institutions evaluated (i.e., inpatient vs. outpatient) and larger methodological differences, such as the Singaporean study not including patient travel (9).
Purchased goods and services, specifically medical supplies (6) and potentially pharmaceuticals (9), are significant contributors to GHG emissions. Reducing these emissions will require a more selective application of these items with a focus on reducing unnecessary waste which clinicians have voiced willingness to do (24). Alternatively, hospitals and health systems can work with vendors through contracting and advocacy to encourage reduction in the upstream and downstream energy required to create, use, and dispose of their products.
4.3.3 Employee commuting
Category 7: Employee commuting was 9% of OC's total GHG emissions. Our employee transportation survey had a 44% response rate. The average employee roundtrip was 42 mi with approximately 98% commuting in a single-occupancy vehicle with a combustion engine.
Employee commuting contributed to approximately 3% of total emissions in both the Dutch (8) and German (10) hospitals. This large difference is in part associated with the frequency of fossil fuel-free bike commuting that occurs in the Netherlands (25% of daily commutes) and Germany (9% of daily commutes) compared to the United States (1% of daily commutes) (25). The university affiliated with our hospital incentivizes alternative transportation, rather than a single-occupancy vehicle, but this works best for employees who live in close proximity to OC.
In a semi-rural community with an average roundtrip commute of 42 mi, a reduction on employee transport emissions will need to focus on reducing automobile emissions. Installing Level 1 or 2 electric chargers in the employee garage could encourage employees to purchase plug-in hybrid or fully electric vehicles while providing an incentive of reduced commuting costs. For areas where on-site parking is limited, the implementation of strategic bus routes from well-placed satellite parking lots could reduce emissions from personal vehicles, while also potentially alleviating commuting challenges for employees, such as a lack of public transportation infrastructure or traffic congestion.
4.4 Emissions per full time equivalent
Emissions per FTE are 33.2 MTCO2e per FTE which is much greater than the average of 3.2 (maximum 7.1) MTCO2e per FTE reported in Swiss hospitals (5) or 16–23 MTCO2e per FTE reported by a Canadian hospital (6). However, an important distinction is our study included patient (4,672 MTCO2e) and clinician (1,027 MTCO2e) transportation and neither the Swiss nor the Canadian study did. Eliminating patient transportation and employee commuting from our total emissions results in 19.2 MTCO2e per FTE which is in the range of the Canadian hospital.
Macroeconomically, GHG emissions from the US health sector account for a higher percentage of national emissions at 8.5% (2) than the Swiss health sector at 6.7% (26). There is an even starker difference between national per capita GHG emissions between the two countries with the US at 17.2 MTCO2e and Switzerland at 4.5 MTCO2e (26). This difference in carbon intensity may explain why OC's GHG emissions per FTE are six times greater than hospitals in Switzerland.
4.5 Emissions per square meter
OC's emissions per square meter are 0.6 MTCO2e per year compared to the 0.01–0.07 MTCO2e per square meter per year in public hospitals in Punjab, Pakistan (7). After eliminating patient and clinician transportation, which the Pakistani study did not include, OC generates 0.4 MTCO2e per square meter per year, which is five to 24 times larger. Similar to the comparison with the Swiss hospital and the carbon intensity of the Swiss economy, the US economy creates nearly 8 times more GHG emissions than the Pakistani economy (27).
4.6 Limitations
The data collection for our analysis was completed within 18 months of OC's opening and LEED Silver certification. Total emissions may be lower than an average orthopedic clinic because the building was designed and built for electrification and efficiency. Additionally, no major clinical nor facility infrastructure was replaced during our data monitoring.
Our analysis has the limitations of all carbon footprint analyses that rely upon industry-average emission factors. Our outcomes are not representative of the individual choices of our vendors (e.g., if a vendor has eliminated Scope 1 and 2 emissions, this will not be reflected in our calculations). To obtain vendor-specific emissions data, we recommend institutions add clauses to their vendors' contracts requesting standardized emissions and pollution-related details associated with products and processes.
4.7 Future direction
The principles of sustainability resonate with conventional health system strategies of high-value healthcare, patient-centered care, and evidence-based medicine. A comprehensive understanding of the impact of healthcare pollution upon patient outcomes, including delivery of care and exacerbation of health conditions, is needed. Research into healthcare and pollution must focus upon (1) the identification of the large sources of emissions, (2) categorization of those sources of emissions based upon health system potential to influence the generation of the pollution, and (3) the creation of a generalizable strategy to eliminate healthcare-associated pollution (see Figure 2). Specific to this study, we are interested to see how telemedicine can be applied more broadly in clinical orthopedics.
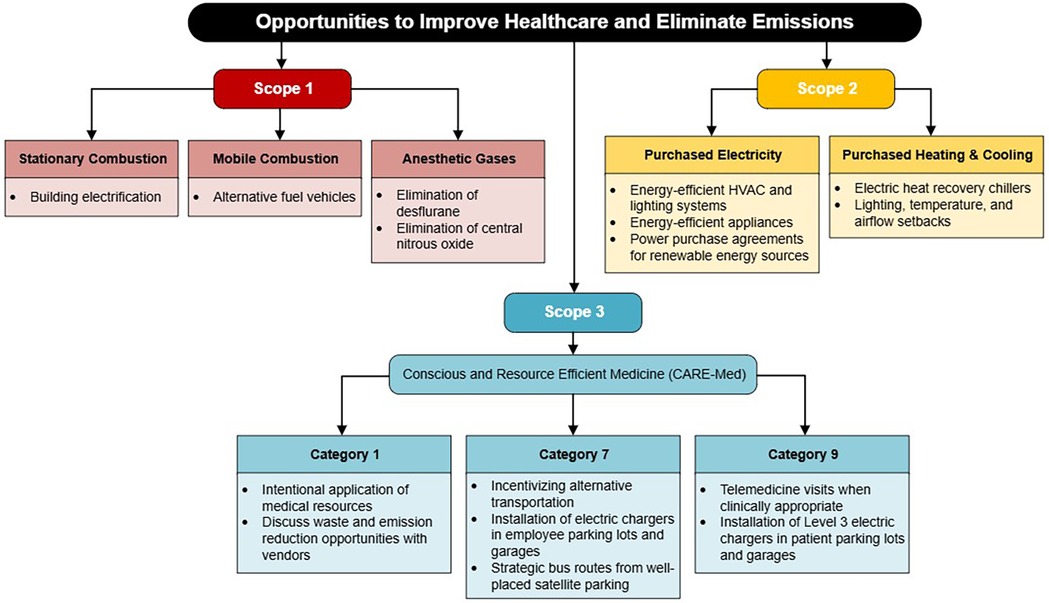
Figure 2. Interventions to reduce emissions from major sources by scope and category.
As one of the first peer-reviewed Scope 3-inclusive GHG inventories of a freestanding outpatient healthcare facility in the US, this study fills a critical data gap. It also offers a replicable model for health systems seeking to identify high-intensity areas to reduce their total emissions in an effort to meet net-zero targets and maintain excellent patient care.
Data availability statement
The datasets presented in this article are not readily available because the data in this study comes from multiple health system and university databases. Some of this data is associated with cost/strategic measurements and considered proprietary/privileged. Requests to access the datasets should be directed tobW1leWVyQHZpcmdpbmlhLmVkdQ==.
Author contributions
AJ: Conceptualization, Data curation, Formal analysis, Funding acquisition, Investigation, Methodology, Project administration, Resources, Software, Supervision, Validation, Visualization, Writing – original draft, Writing – review & editing. VK: Data curation, Formal analysis, Writing – original draft, Writing – review & editing. EB: Project administration, Supervision, Writing – review & editing. SS: Formal analysis, Software, Writing – review & editing. LC: Conceptualization, Methodology, Writing – review & editing. MM: Conceptualization, Data curation, Formal analysis, Funding acquisition, Investigation, Methodology, Project administration, Resources, Software, Supervision, Validation, Visualization, Writing – original draft, Writing – review & editing.
Funding
The author(s) declare that financial support was received for the research and/or publication of this article. The University of Virginia's Environmental Institute provided support for Ms. Jett to assist with research. The University of Virginia's Department of Anesthesiology provided support for Dr. Meyer's time. Rho Impact provided support for data analysis and some of Ms. Bobbin's and Dr. Sheldon's time.
Acknowledgments
Thank you to the University of Virginia Environmental Institute's Decarbonization Corps for supporting the research especially Mr. Jonah Fogel and Professor Karen McGlathery. Thank you to Dr. Bobby Chhabra and Ms. Catherine Cash for their willingness to explore this topic and share data from the orthopedic center they lead with us. Thank you to all the individuals and teams who provided data to us including those at UVA Health, and the University of Virginia (Office for Sustainability, Energy and Utilities, and UVA Recycling). Thank you to Mr. Jesse Warren and Mr. Kevin Fox for continually answering our detailed facility questions about the Orthopedic Center on Ivy Road.
Conflict of interest
EB and SS were employed by Rho Impact.
The remaining authors declare that the research was conducted in the absence of any commercial or financial relationships that could be construed as a potential conflict of interest.
Generative AI statement
The author(s) declare that Generative AI was used in the creation of this manuscript. Generative AI was used to create the initial draft of the abstract. The abstract has been thoroughly revised following GenAI's initial attempt.
Any alternative text (alt text) provided alongside figures in this article has been generated by Frontiers with the support of artificial intelligence and reasonable efforts have been made to ensure accuracy, including review by the authors wherever possible. If you identify any issues, please contact us.
Publisher's note
All claims expressed in this article are solely those of the authors and do not necessarily represent those of their affiliated organizations, or those of the publisher, the editors and the reviewers. Any product that may be evaluated in this article, or claim that may be made by its manufacturer, is not guaranteed or endorsed by the publisher.
Supplementary material
The Supplementary Material for this article can be found online at: https://www.frontiersin.org/articles/10.3389/frhs.2025.1675827/full#supplementary-material
References
1. Health Care Without Harm. Health care’s climate footprint: how the health sector contributes to the global climate crisis and opportunities for action. In: Climate-smart Health Care Series, Green Paper Number One. Reston (VA): Health Care Without Harm (2019). p. 1–48. Available online at: https://global.noharm.org/sites/default/files/documents-files/5961/HealthCaresClimateFootprint_092319.pdf
2. Eckelman MJ, Huang K, Lagasse R, Senay E, Dubrow R, Sherman JD. Health care pollution and public health damage in the United States: an update. Health Aff (Millwood). (2020) 39(12):2071–9. doi: 10.1377/hlthaff.2020.01247
3. World Resources Institute. The Greenhouse Gas Protocol: A Corporate Accounting and Reporting Standard [Internet]. Rev. ed. Washington (DC): World Resources Institute (2004). Available online at: https://ghgprotocol.org/sites/default/files/standards/ghg-protocol-revised.pdf (Accessed May 30, 2025)
4. Drew J, Christie SD, Rainham D, Rizan C. HealthcareLCA: an open-access living database of health-care environmental impact assessments. Lancet Planet Health. (2022) 6(12):e1000–12. doi: 10.1016/S2542-5196(22)00257-1
5. Keller RL, Muir K, Roth F, Jattke M, Stucki M. From bandages to buildings: identifying the environmental hotspots of hospitals. J Clean Prod. (2021) 319:128479. doi: 10.1016/j.jclepro.2021.128479
6. Cimprich A, Young SB. Environmental footprinting of hospitals: organizational life cycle assessment of a Canadian hospital. J Ind Ecol. (2023) 27(5):1335–53. doi: 10.1111/jiec.13425
7. Ullah Z, Nasir AR, Alqahtani FK, Ullah F, Thaheem MJ, Maqsoom A. Life cycle sustainability assessment of healthcare buildings: a policy framework. Buildings. (2023) 13(9):2143. doi: 10.3390/buildings13092143
8. Lau I, Burdorf A, Hesseling S, Wijk L, Tauber M, Hunfeld N. The carbon footprint of a Dutch academic hospital-using a hybrid assessment method to identify driving activities and departments. Front Public Health. (2024) 12:1380400. doi: 10.3389/fpubh.2024.1380400
9. Lum BX, Tay HM, Phang RX, Tan SB, Liu EH. Evaluating a hospital’s carbon footprint–a method using energy, materials and financial data. J Hosp Adm. (2022) 11(2):33. doi: 10.5430/jha.v11n2p33
10. Quitmann C, Terres L, Maun A, Sauerborn R, Reynolds E, Bärnighausen T, et al. Assessing greenhouse gas emissions in hospitals: the development of an open-access calculator and its application to a German case-study. Cleaner Environ Syst. (2025) 16:100262. doi: 10.1016/j.cesys.2025.100262
11. Keil M. The greenhouse gas emissions of a German hospital: a case study of an easy-to-use approach based on financial data. Cleaner Environ Syst. (2023) 11:100140. doi: 10.1016/j.cesys.2023.100140
12. Parker Z, Ashby B, Tuddenham A, Brady S. Designing a net Zero Roadmap for Healthcare: Technical Methodology and Guidance [Internet]. Brussels (BE): Health Care Without Harm Europe (2022). Available online at: https://europe.noharm.org/sites/default/files/documents-files/7186/2022-08-HCWH-Europe-Designing-a-net-zero-roadmap-for-healthcare-web.pdf (Accessed July 24, 2025)
13. U.S. Environmental Protection Agency. GHG Emission Factors Hub [Internet]. Washington (DC): U.S. Environmental Protection Agency (2023). Available online at: https://www.epa.gov/climateleadership/ghg-emission-factors-hub (Accessed June 3, 2025)
14. U.S. Environmental Protection Agency. Supply Chain Greenhouse gas Emission Factors v1.2 by NAICS-6 [Internet]. Washington (DC): U.S. Environmental Protection Agency (2023). Available online at: https://catalog.data.gov/dataset/supply-chain-greenhouse-gas-emission-factors-v1-2-by-naics-6 (Accessed June 3, 2025)
15. Practice Greenhealth. Health Care Emissions Impact Calculator V1.3 [Internet]. Washington (DC): Practice Greenhealth (2023). Available online at: https://practicegreenhealth.org/tools-and-resources/health-care-emissions-impact-calculator (Accessed June 3, 2025)
16. ICAO. ICAO Carbon Emissions Calculator. Available online at: https://www.icao.int/environmental-protection/Carbonoffset/Pages/default.aspx (Accessed March 1, 2025)
17. U.S. Environmental Protection Agency. Greenhouse Gas Equivalencies Calculator [Internet]. Washington (DC): U.S. Environmental Protection Agency (2025). Available online at: https://www.epa.gov/energy/greenhouse-gas-equivalencies-calculator (Accessed June 3, 2025)
18. Ryan SM, Nielsen CJ. Global warming potential of inhaled anesthetics: application to clinical use. Anesth Analg. (2010) 111(1):92–8. doi: 10.1213/ANE.0b013e3181e058d7
19. Seglenieks R, Wong A, Pearson F, McGain F. Discrepancy between procurement and clinical use of nitrous oxide: waste not, want not. Br J Anaesth. (2022) 128(1):e32–4. doi: 10.1016/j.bja.2021.10.021
20. Statista. Total U.S. Electricity net Generation by Fuel [Internet]. Hamburg: Germany: Statista (2025). Available online at: https://www.statista.com/statistics/220174/total-us-electricity-net-generation-by-fuel/ (Accessed June 28, 2025)
21. Thiel CL, Mehta N, Sejo CS, Qureshi L, Moyer M, Valentino V, et al. Telemedicine and the environment: life cycle environmental emissions from in-person and virtual clinic visits. NPJ Digit Med. (2023) 6:87. doi: 10.1038/s41746-023-00818-7
22. Grabski DF, Meyer MJ, Gander JW. Pediatric telemedicine visits reduce greenhouse gas emissions. J Clim Change Health. (2024) 17:100309. doi: 10.1016/j.joclim.2024.100309
23. Tilmon JC, Farooq H, Metzger CM, Schlecht SH, Klitzman RG. Telehealth in orthopedic sports medicine: a survey study on patient satisfaction and experience. Telemed J E Health. (2023) 29(6):943–6. doi: 10.1089/tmj.2022.0193
24. Meyer MJ, Chafitz T, Wang K, Alamgir N, Malapati P, Gander JW, et al. Surgeons’ perspectives on operating room waste: multicenter survey. Surgery. (2022) 171(5):1142–7. doi: 10.1016/j.surg.2021.12.032
25. Goel R, Goodman A, Aldred R, Nakamura R, Tatah L, Garcia LMT, et al. Cycling behaviour in 17 countries across 6 continents: levels of cycling, who cycles, for what purpose, and how far? Transp Rev. (2021) 42(1):58–81. doi: 10.1080/01441647.2021.1915898
26. Mermillod B, Tornare R, Jochum B, Ray N, Flahault A. Estimating the carbon footprint of healthcare in the canton of Geneva and reduction scenarios for 2030 and 2040. Int J Environ Res Public Health. (2024) 21(6):690. doi: 10.3390/ijerph21060690
27. Ritchie H, Rosado P, Roser M. CO₂ and Greenhouse Gas Emissions [Internet]. Oxford (UK): Our World in Data (2024). Available online at: https://ourworldindata.org/co2-and-greenhouse-gas-emissions (Accessed June 11, 2025)
Keywords: pollution, waste, healthcare, orthopedics, greenhouse gas, emissions, quality improvement, community health
Citation: Jett AM, Kothandaraman V, Bobbin E, Sheldon S, Colosi LM and Meyer MJ (2025) Greenhouse gas emissions of a large, academic outpatient orthopedic center in the United States. Front. Health Serv. 5:1675827. doi: 10.3389/frhs.2025.1675827
Received: 12 August 2025; Accepted: 25 September 2025;
Published: 20 October 2025.
Edited by:
Beatriz S Lima, Research Institute for Medicines (iMed.ULisboa), PortugalReviewed by:
Jehan Al Fannah, The Royal Hospital, OmanAnnette Eidmann, Orthopadische Klinik Konig-Ludwig-Haus, Germany
Copyright: © 2025 Jett, Kothandaraman, Bobbin, Sheldon, Colosi and Meyer. This is an open-access article distributed under the terms of the Creative Commons Attribution License (CC BY). The use, distribution or reproduction in other forums is permitted, provided the original author(s) and the copyright owner(s) are credited and that the original publication in this journal is cited, in accordance with accepted academic practice. No use, distribution or reproduction is permitted which does not comply with these terms.
*Correspondence: Matthew J. Meyer, bW1leWVyQHZpcmdpbmlhLmVkdQ==
†These authors have contributed equally to this work and share first authorship