 Heather Lent1
 Gustave Hahn-Powell
 Eric Lyons
- 1School of Plant Sciences, BIO5 Institute, University of Arizona, Tucson, AZ, United States
- 2CLU Lab, Department of Computer Science, University of Arizona, Tucson, AZ, United States
The importance of academic publications is often evaluated by the number of and impact of its subsequent citing works. These citing works build upon the referenced material, representing both further intellectual insights and additional derived uses. As such, reading peer-reviewed articles which cite one's work can serve as a way for authors to understand how their research is being adopted and extended by the greater scientific community, further develop the broader impacts of their research, and even find new collaborators. Unfortunately, in today's rapidly growing and shifting scientific landscape, it is unlikely that a researcher has enough time to read through all articles citing their works, especially in the case of highly-cited broad-impact studies. To address this challenge, we developed the Science Citation Knowledge Extractor (SCKE), a web tool to provide biological and biomedical researchers with an overview of how their work is being utilized by the broader scientific community. SCKE is a web-based tool which utilizes natural language processing and machine learning to retrieve key information from scientific publications citing a given work, analyze the citing material, and present users with interactive data visualizations which illustrate how their works are contributing to greater scientific pursuits. Results are generally grouped into two categories, aimed at (1) understanding the broad scientific areas which one's work is impacting and (2) assessing the breadth and impact of one's work within these areas. As a web application, SCKE is easy to use, with a single input of PubMed ID(s) to analyze. SCKE is available for immediate use by the scientific community as a hosted web application at https://geco.iplantcollaborative.org/scke/. SCKE can also be self-hosted by taking advantage of a fully-integrated VM Image (https://tinyurl.com/y7ggpvaa), Docker container (https://tinyurl.com/y95u9dhw), or open-source code (GPL license) available on GitHub (https://tinyurl.com/yaesue5e).
Introduction
At the core, scientific research is an iterative process where future lines of inquiry are guided by prior findings. As such, researchers and scientists can actively refine and improve their efforts by developing a thorough understanding how their past work is being applied by the broader scientific community in order to advance discoveries. Because scientific advancements are generally communicated through the medium of the peer reviewed publication, one way for individuals or teams to develop this understanding is by reading those publications that cite their work. Understanding derivative works (i.e., those scientific publications which cite a given work) has many benefits, including guiding discoveries in new areas, assess the broader impacts of one's work, and identify new collaborators for future projects.
Unfortunately, in today's fast-paced and highly competitive scientific environment, reading, analyzing, and extracting salient ideas in all publications referencing one's work is often too time intensive to be a viable option, a challenge further exacerbated by the fact that scientific literature is becoming increasingly complex (Ball, 2017). Furthermore, even though the field of natural language processing (NLP) offers many tools and techniques which can help ease this burden (e.g., such as the ability to rapidly “read” publications and summarize key topics), these techniques are often complex and difficult to apply without a thorough understanding of the field and underlying concepts (Hermann et al., 2015). In addition, the results of NLP often require additional analyses to visualize salient and emerging themes across multiple sources of publications. Although it would be largely beneficial for the scientific community as a whole to have an easy-to-use tool for reading and analyzing scientific papers referencing key publications, such a tool is currently lacking.
To address this gap in analyzing citing works of biomedical publications, we developed Science Citation Knowledge Extractor (SCKE). SCKE is a web-accessible application that uses natural language processing (NLP) and machine learning (ML) techniques to analyze the content of citing publications and convey important information such as topics and concepts in informative and interactive data visualizations. SCKE represents a significant step forward in the area of scientific publication analysis, with methodological improvements and new features over existing comparable software (Table 1). SCKE is easy to use, only requiring users to provide one or more PubMed IDs. Analysis steps are pipelined into a reproducible workflow that requires no manual input, and summary results are presented as interactive visualizations. By using SCKE, anyone can easily obtain a high-level understanding of how scientific work(s) are being applied throughout the broad scientific community to advance our understandings and fuel new discoveries.
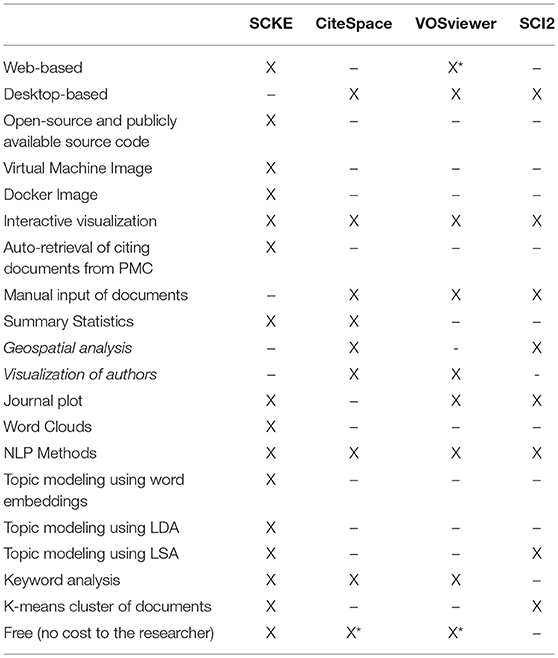
Table 1. SCKE vs. Similar Software. A feature comparison between SCKE and three similar software packages; CiteSpace (Chen, 2006), VOSviewer (van Eck and Waltman, 2009), and SCI2 (Xiaohua et al., 2013). *VOSViewer is primarily intended to be downloaded, but can also be run as a web-based application if the user has Java installed. *The manual for CiteSpace is not free. *VOSViewer advertises a range of additional paid products.
Implementation
SCKE is a web-based application that provides an illustrative overview of how peer-reviewed publications are impacting broader scientific pursuits. Insights are derived from the SCKE pipeline, which uses natural language processing (NLP) and machine learning (ML) techniques to analyze the text and metadata of scientific publications which cite an input work(s) (Figure 1). Results are presented to users through easy-to-understand, interactive visualizations.
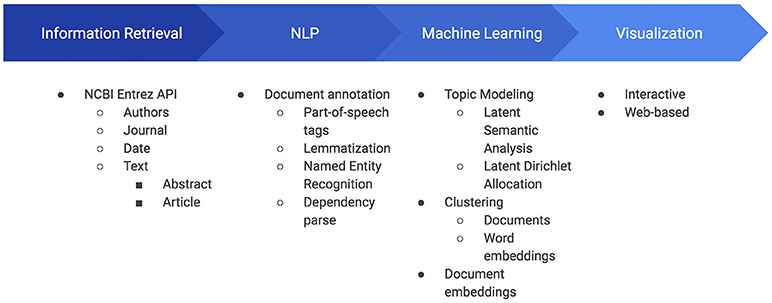
Figure 1. Overview of SCKE's four central building blocks and their components. Information retrieval is used to retrieve all documents and relevant metadata. Once retrieved, the documents are annotated and elements of the annotation are cached. These cached data are then used as input to several machine learning algorithms, which are finally visualized for researchers to interact with. Caching of processed documents and annotations permit SCKE to perform faster on subsequent invocations yielding the same documents.
Pipeline Overview
The SCKE analysis pipeline consists of 4 main components (Figure 1). After a user submits one or more PubMed IDs (a type of unique identifier for a scientific publication), the pipeline begins analysis with an information retrieval step. The information retrieval component connects to NCBI's Entrez API to retrieve a list of all works which cite the input article, and then obtains relevant information for each of those derivative publications (Sayers and Wheeler, 2004).
The information obtained from the Entrez API is relevant to both the content and impact of the work, and includes authors, the journal of publication, the publication date, and the text of the publication. When a new input PubMed ID is entered into SCKE, the database is first populated with the general bibliographic information associated with that input PMID, such as the authors, date of publication, title, journal, and number of citations. If the input PubMed ID is available on PubMed Central, then SCKE also retrieves the full text and/or abstract of the input document. Next, information for each citing document is obtained. PubMed catalogs citations through PubMed Central, so all citing documents are entered into SCKE's database by their PMCID. For each PMCID, we retrieve bibliographic information, abstracts, and (when available) full text. Once retrieved, the collection of full text citations are annotated with a BioNLP Processor, which outputs information such as part-of-speech tags, lemmas, biomedical named entities, and the syntactic dependency parses (Valenzuela-Escárcega et al., 2017). Along with the text, these key elements of the annotation are critical for downstream computational analysis. For additional information on the data extraction and processing, see Supplementary Material 1 (Data Extraction Supplement).
The results of the NLP annotation feed into the third component, the machine learning step of the SCKE pipeline. SCKE leverages a number of machine learning and NLP libraries to perform both topic modeling and document clustering (Rehurek and Sojka, 2010; Pedregosa et al., 2011). Lemmas are used as input to two topic modeling algorithms (i.e., Latent Semantic Analysis and Latent Dirichlet Allocation), as well as input for k-means clustering of documents (Landauer et al., 1998; Blei et al., 2003). In a third topic model, lemmas and part of speech tags are used to choose the most common noun phrases, and then the averaged word embeddings for the noun phrases are clustered. SCKE's word embeddings were generated with FastText and trained on our corpus of PubMed documents (Bojanowski et al., 2016). Lemmas are also used as the input for generating simplified document embeddings for SCKE's TextCompare analysis.
After the machine learning analysis, the results are processed by the visualization component, which generates and presents users with interactive data visualizations that illustrate the impact of their work. A variety of intuitive visualizations are designed to illustrate both the relevant content of citing works and the breadth and impact of those citing works. For a brief description of each summary visualization, see the “Results” section.
System Architecture
The core of SCKE is written in Python and runs on an Apache web server (OS Linux/Ubuntu), with the uWSGI gateway interface (Figure 2). Python code is used to access SCKE's cache and MySQL database, and to communicate with the NCBI Entrez API and a local Natural Language Processing (NLP) Server. When a PubMed ID is entered into SCKE by a user, the system checks the database to see whether or not this publication was processed previously. If the PubMed ID does not exist, SCKE makes calls to the Entrez API in order to retrieve the citation's publication as well as information about each citation's authors, journal, and date of publication. The text of the publication is cached as a.txt file, while all other metadata are stored in the relational database (MySQL). If the PubMed ID entered into SCKE does exist in the database, then the system connects to the Entrez API to see if any additional citations and publications were added since the last time the analysis was run. Once all of the citations and the citations' publications have been obtained, SCKE communicates with a locally running JVM-based server using a RESTful API for Natural Language Processing in order to create json annotations of the documents. Citing documents are annotated in parallel and asynchronously to speed up this process. The resulting annotated documents are cached on the server as json files, and contain information about tokens, part-of-speech tags, named entities, lemmas (i.e., simplified versions of the words), and syntactic dependencies. SCKE does not need all of this information to run the workflow, thus SCKE caches the lemmas, part-of-speech tags, and named entities in separate Python pickle files. Finally, for every PubMed ID, SCKE creates a Python pickle file containing only the lemmas and part-of- speech tags for all of the citing documents in that collection (i.e., one input PubMed ID will have a single pickle file containing this information). This file is updated if new, un-annotated citing documents were identified in the initial Entrez API check for previously seen PubMed ID's. If a user's input consists of multiple PubMed ID's, SCKE creates an additional Python pickle file, with the lemmas and part-of-speech tags for each query documents. These Python pickle files are cached and serve as the input for most of the downstream analyses (i.e., Keywords, Topics, Clustering, and TextCompare tabs of the web interface). The journal analysis (i.e., Journals tab) is created from the information stored in the database for each citation journal and publication date. If an input PubMed ID has already been seen and has no new citations, SCKE simply loads the cached pickle files for the other analyses to process. For all analyses, SCKE caches a json file for the data visualization when possible, which speeds up loading time for when a user reruns the same set of queries. Results are presented to users through a Flask application which serves a series of interactive visualizations, generated using common JavaScript libraries (Bostock, 2015; Sievert et al., 2016).
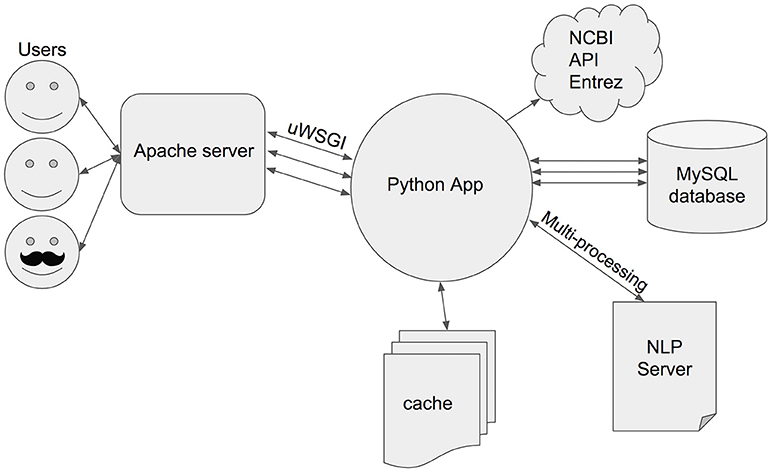
Figure 2. SCKE's system architecture. SCKE is a Python application run on an Apache web server. The Python app communicates with NCBI's Entrez API in order to retrieve documents and relevant metadata. Documents annotated with the NLP server are cached, while the metadata is stored in our MySQL database. Multiprocessing is used when possible to speed up run time.
Performance
SCKE was designed to be scalable to handle analysis of highly-cited works. Wherever possible, SCKE analysis steps have been parallelized to reduce overall run time. Although SCKE can run in parallel during for document annotation, the final results depend on analyzing all annotated documents and scales quadratically to the number of words across all documents (Figure 3). This is because individual documents are annotated with the BioNLP Processor, which utilizes an unlexicalized probabilistic context-free grammar for parsing (Klein and Manning, 2003). Thus, annotations are limited by the amount of RAM and processor speed, and the time to process generally scales cubically with the number of words in a document (Figure 4). The hosted version of SCKE is hosted on a 32-core DELL R910 with Intel Xeon X7560 @ 2.27GHz and 1TB of RAM, and is able to handle most analysis requests by users. However, due to the limitations addressed above, it may be necessary for researchers to self-host their own instance of SCKE for extremely large analyses (see “Availability” for details on self-hosting).
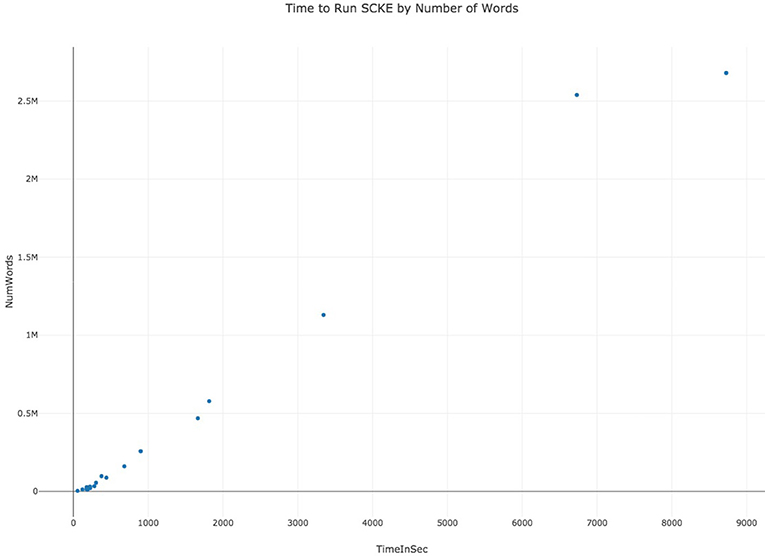
Figure 3. Benchmarking data displaying the time it takes to run SCKE by the total number of words in the collection of documents.
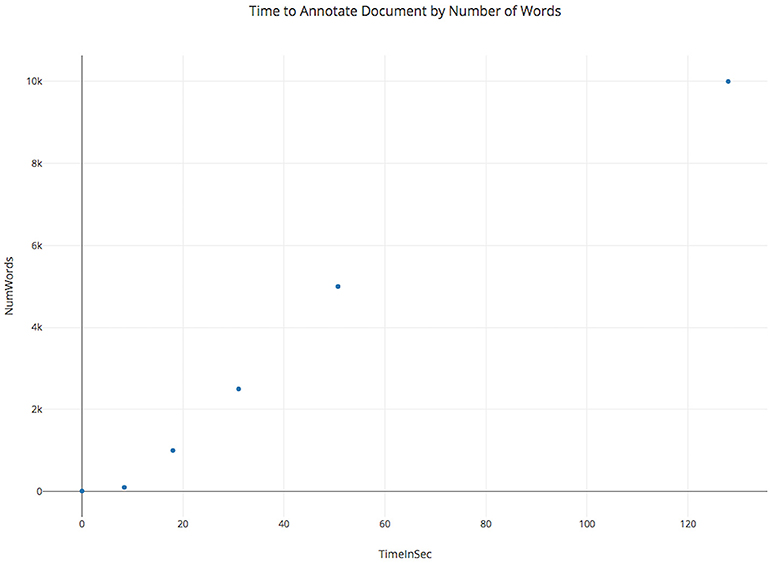
Figure 4. Benchmarking results showing how annotation time scales for a single document as the number of words increases. Annotation with the BioNLP processor scales cubically by number of words, as it uses an unlexicalized probabilistic context-free grammar.
Results (Interactive Visualizations)
SCKE presents analysis results to users through easy-to-understand, interactive visualizations. These visualizations are grouped into two major categories. The first category of visualizations is designed to illustrate the breadth and impact of the work being analyzed. These visualizations include “Overview Statistics” and “Journal by Year,” both of which are intended to give a broad illustration of the types and impact of work which is citing a peer-reviewed article. The second set of visualizations is directed toward understanding the general topics of research which are citing them. These visualizations include “keywords,” “topics,” “article clusters,” and “text similarities.” These visualizations provide a variety of insights into the areas of science an article is directly impacting. In SCKE, visualizations are arranged into a variety of tabs for easy navigation. Each visualization will be briefly discussed in the following sections.
Overview Statistics
The “Statistics” tab contains data and visualizations that present a broad overview of information related to the user-selected publication(s) and their citing works (Figure 5). Two major visualizations are included which (1) illustrate the number of works citing an input paper and, when multiple input papers are specified, the unique vs. overlapping citations; (2) present a general timeline of citations by year to help understand when work was most impactful. Other useful information related to the analysis is also presented on the statistics page, including the number of citations which have retrievable content (e.g., whole articles, abstracts), the total amount of content obtained by the information retrieval component (e.g. number of words, number of sentences), and the full citation(s) for user-specified PubMed IDs. This information can be helpful for assessing confidence in the downstream analysis, both by informing on the volume of related information processed and by ensuring the correct articles were requested.
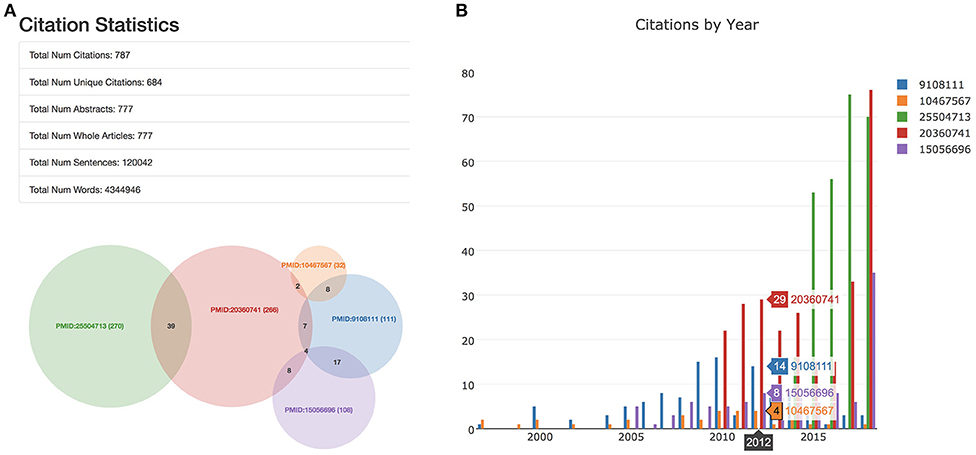
Figure 5. The statistics “tab” includes a table and two visualizations. Here, we highlight this tab for an analysis of five well-cited papers. (A) If multiple papers were entered as input into SCKE, the table and the venn diagram show how many citing papers overlap between them. Details are also provided about the number of abstracts vs. whole articles were used for the analysis, as well as the number of sentences and words. (B) Citations by year are visualized as an interactive histogram. To regenerate this analysis, visit https://tinyurl.com/ybv5e6wo.
Journal by Year
While the overview statistics page provides a simple timeline of citation history, the “Journal by Year” visualization provides a much more in-depth overview of this timeline (Figure 6). Here, citing works are presented in a timeline-styled format also broken down by journal in which they were published. This journal breakdown serves a twofold purpose; it helps inform on the overall impact of work (since specific journals are generally associated with high-impact work), while simultaneously illustrating the broad scientific topics impacted (since different journals are often associated with different research domains/fields). The Journal by Year also includes an interesting and informative number: the total number of different journals in which one's work has been cited, which may demonstrate breadth of impact.
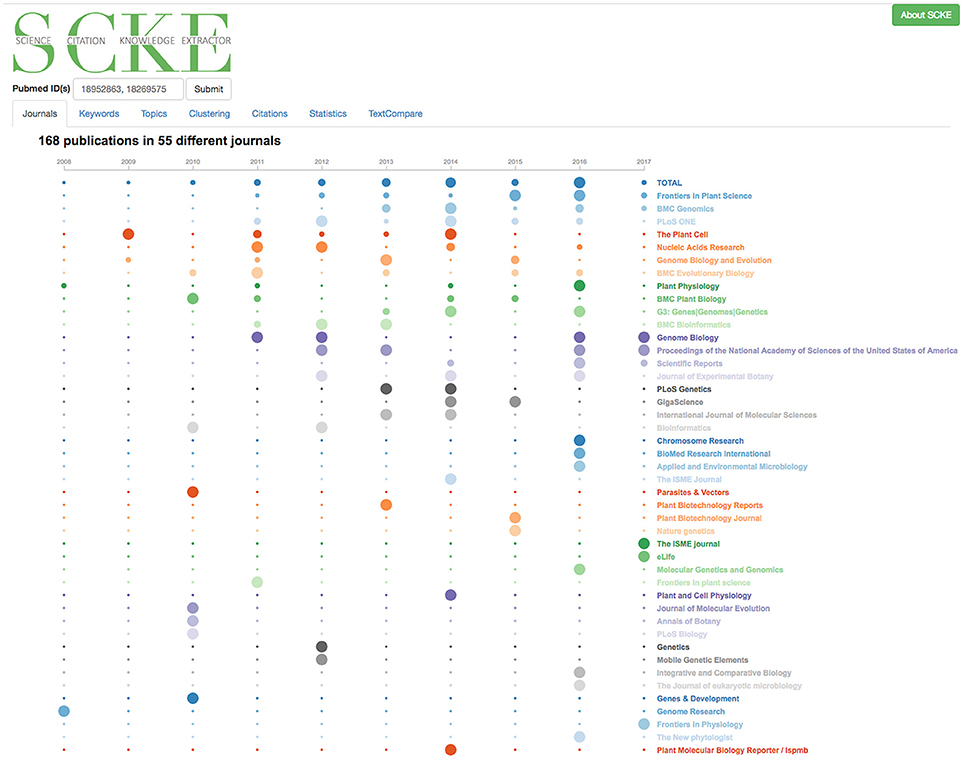
Figure 6. Visualizing Citations by Journal of Publication and by year. This interactive data visualization displays the counts for the number of citations per year when users use the mouse to hover over the journal name. To regenerate this analysis, visit https://tinyurl.com/ydh4u4j4.
Key Words
One of the more intuitive ways identify commonalities within a set of works is by identifying enriched key words. The collection of enriched key words can provide insights into both general and specific topics of interest, and can thus aid in the broad understanding of large bodies of content. SCKE uses two common keyword visualizations, the word-cloud (Figure 7A) and heatmap (Figure 7B), to present users with keyword insights. To provide scientifically-relevant context and enable deeper understandings from keywords, users can select one or more categories of keywords (extracted from our BioNLP Processor's Named Entity Recognition. i.e., Bioprocess, Cell-lines, Cellular components, Family, Gene or Gene products, Organs, Simple chemicals, Sites, Species, and Tissue-Types) to visualize. This allows researchers to identify key topics within specific areas of interest in an intuitive, interactive way, while ensuring that findings are scientifically relevant.
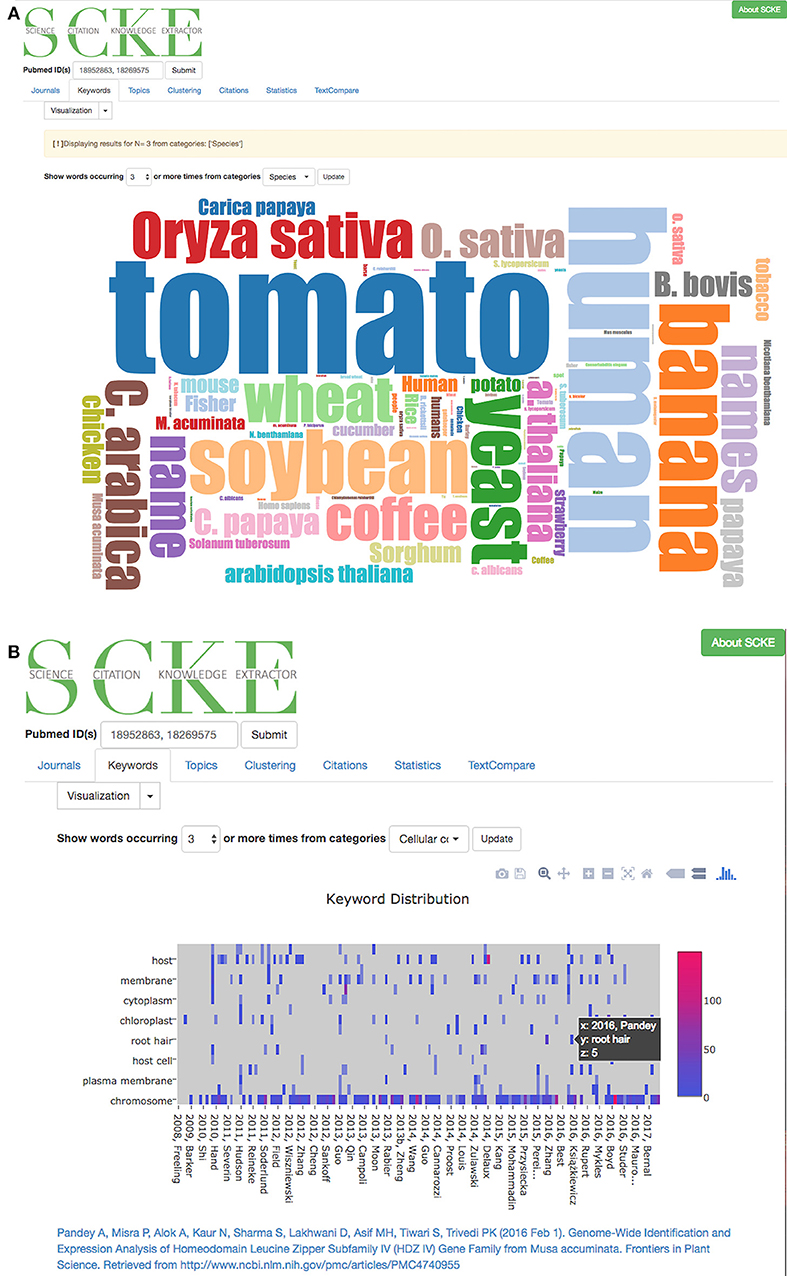
Figure 7. (A) A word cloud has been generated to show all named entities classified as a species during the document annotation phase. Users can filter their word clouds to include more or fewer words by specifying that visualized words should appear at least N times. (B) An interactive heatmap that visualizes named entities across all citing documents. Users can zoom in or out of the heatmap to look closely at certain documents. By clicking on a column in the heatmap, a link to the original document is provided as well.
Topics
While key words can provide valuable insights, a more advanced method is also employed to identify related topics (e.g., clusters of related words) contained within the citing works (Figure 8). This is especially relevant, as it can identify multiple different reoccurring themes which extend beyond simple keyword analyses. These topics are identified using k-means clustering of averaged word embeddings of common phrases from the set of citing works. Scientific-literature specific word embeddings were trained specifically for SCKE from a corpus of PubMed Central documents using FastText, an unsupervised learning algorithm which transforms words into meaningful vector representations (Bojanowski et al., 2016). The identified topics and their clustering patterns are visualized as a force directed graph, where topics are presented as nodes and those which appear together are linked into clusters via edges. Topic clustering allows users to observe multiple different uses of their work which appear throughout a number of citations.
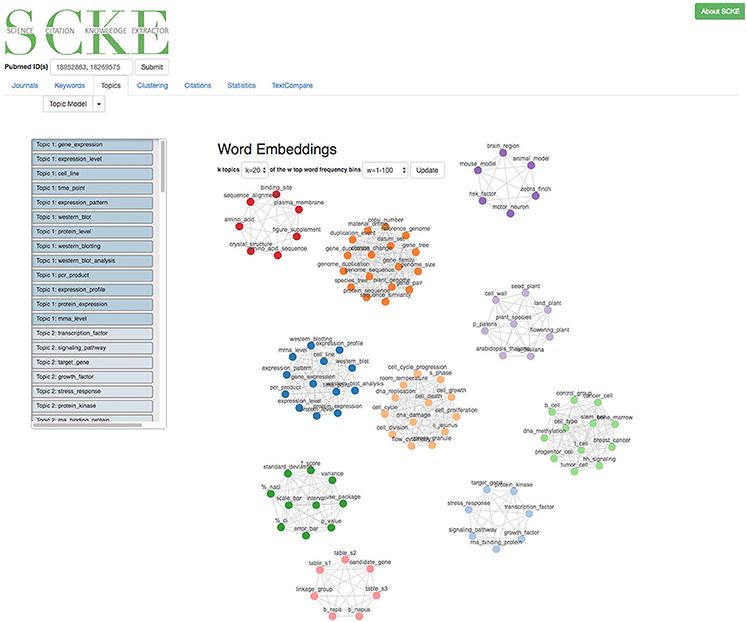
Figure 8. An example of a visualized topic model that a user would see. Words pertaining to a topic are visualized as cluster. A list of topic words is also provided on the left. Users can generate new topic models with a varying number of topics and with different word frequency restraints.
Article Clusters
The article clustering analysis is helpful for further identifying broad patterns of influence (Figure 9). It is not uncommon for a scientific product (e.g., discovery, development, publication) to influence multiple distinct scientific pursuits. For example, a new next-generation sequencing data assembly tool could help plant researchers working on complex genomes, but could also serve as a valuable contribution to studies working on rapidly evolving cancer genomes. To help identify multiple distinct areas of influence, SCKE employs an article clustering approach to group similar publications with one other. To achieve this, a PCA and k-means clustering approach is used, which places similar documents close together and different documents further apart in a 3D plotting space. Grouping similar documents together allows common themes to emerge, and allows researchers to broadly understand the areas where they are making a difference. The resulting plot is presented in an interactive form, which allows researchers to explore the different clusters and locate specific articles which fall into each of the clusters.
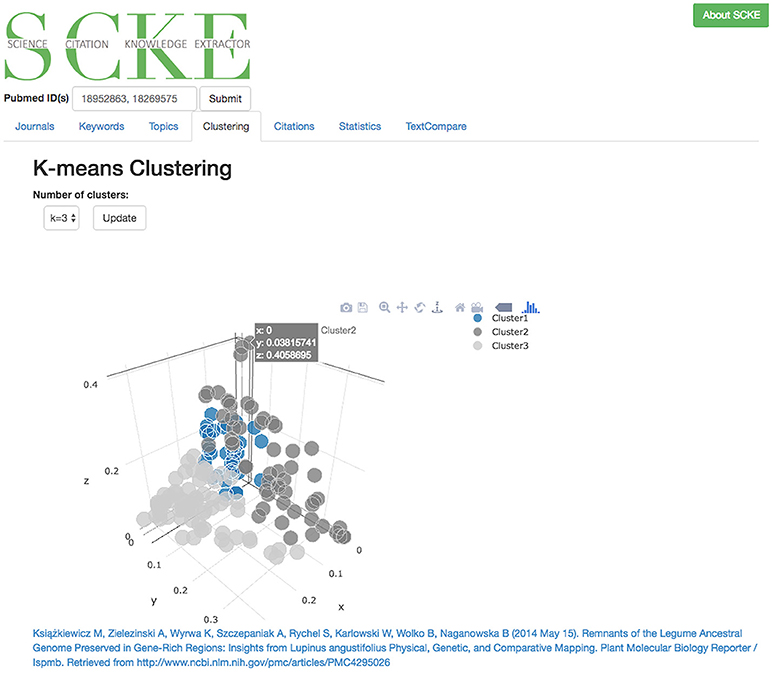
Figure 9. Interactive 3D plot of clustered documents. Users can navigate the space to see which documents are more or less similar. Clicking on the points in the graph will display a link back to the original document.
Text Compare
The final analysis visualization offered by SCKE is the “text similarity” feature under the “TextCompare” tab, where the work of interest (e.g., the input PubMed ID) and it's citing works are compared against historically important texts and the level of similarity is reported (Figure 10). For example, one could compare their work into evolutionary biology against Darwin's “On the Origin of Species.” This visualization is, for the most part, “just for fun,” yet it does still provide interesting insights and can serve certain use cases (e.g., Supplementary Material 2 “Use Case Example 3”). Similarity is assessed using a naive implementation of Doc2Vec (Le and Mikolov, 2014) and calculating the cosine similarity of the vector for “On the Origin of Species” and the vector all the scientific articles processed by SCKE for a given set of query PubMed IDs. TextCompare's results are presented through a sorted bar chart, with each publication indicated categorically on the x-axis and similarity to the historical text along the y-axis. Selecting any article will link the user directly to that work for further reading. The documents used as the query in SCKE are highlighted in yellow.

Figure 10. Results of TextCompare are displayed in an interactive bar chart, where the height of the bar corresponds with the percent similarity of that document to the text its being compared to (here, “On the Origin of the Species”). If the text for the query documents used by SCKE were available, they will be shown in yellow. In this bar chart, we see that computational genetics paper are much less similar to “On the Origin of the Species” than other wet lab genetics papers that cited the input papers.
Discussion
SCKE represents an end-to-end solution for helping scientific researchers understand how their works are being used and extended throughout the broader scientific community. By using NLP and ML techniques, SCKE enables rapid analysis of large bodies of work citing a set of articles, and presents researchers with an overview of those works without requiring extensive time for manual reading and studying of the topics. Although SCKE was specifically designed to assist authors and contributors to large-impact studies understand how their works are affecting the scientific landscape as a whole, the easy-to-use application can help researchers of all levels better understand the audience of their scientific articles. To help highlight this general applicability, a few real-world use cases of SCKE are detailed in Supplementary Material 2 “Use Cases”.
SCKE is well-differentiated from other existing similar offerings (e.g., CiteSpace, VOSviewer, SCI2), especially with regards to its ease of use, it's up-to-date analysis methods, and its diverse and informative presentation of findings (Table 1). SCKE is incredibly easy to use; the fully web-based software involves no downloads or dependencies (other than a modern web browser) and requires only a single PubMed ID(s) to begin an analysis. By integrating with the NCBI Entrez API, SCKE is able to automatically collect many of the citing works, saving users from the effort of having to manually collect documents and input data for analysis. In terms of methods, SCKE uses a combination of simple analyses (e.g., counting of citations by journal) and powerful NLP methods (e.g., FastText) to provide users with informative and useful reports. These reports cover a wide range of measures which are together indicative of impact and reach of studies.
It is worth noting a few of the limitations of SCKE. First, although any publication with a PubMed ID can be submitted for analysis, SCKE fetches the citing works from PubMed Central (PMC). Since PMC only represents a subset of the scientific literature, some citing articles will be excluded from the textual analyses. Unfortunately, such exclusions are necessary as not all publications are freely and openly available. From our experience, relying on PMC produces good results for well-cited publications despite this limitation. Secondly, SCKE does not have the option to manually input documents. Although this feature could enable additional analyses, it would present a significant liability for the hosted service and would make providing the tool in a free, online manner beyond our capabilities. Finally, it is worth noting that SCKE uses full metadata from citing works (e.g., whole article text) rather than filtering to only the citing context (e.g., sentences which directly cite the input article) and is thus more applicable for broad trends than very specific analyses. Despite these limitations, the readily-available hosted service and full open source code make SCKE a valuable contribution to the scientific community.
Availability
SCKE is fully open-source and free for use. Interested researchers can get started immediately by using the hosted web application provided by CyVerse and CoGe at https://geco.iplantcollaborative.org/scke/ (Lyons and Freeling, 2008; Merchant et al., 2016). For users with more complex requirements, very large analyses, or those interested in developing new visualizations, SCKE can also be self-hosted. To simplify the process of self-hosting and ensure broad reproducibility, both a fully-integrated VM Image (https://tinyurl.com/y7ggpvaa) and a Docker container (https://tinyurl.com/y95u9dhw) are offered in addition to the open-source code (GPL license) available on Github (https://tinyurl.com/yaesue5e). Supplementary resources, such as our trained word embeddings and a copy of the NLP Server are available through the CyVerse Data Commons (https://tinyurl.com/y7ywrco4).
Author Contributions
HL and EL conceived of the project. GH-P and MS provided expertise in NLP applications. HL did frontend web development work. AH-B did virtualization. HL and AH-B did interactive visualization work. HL and SD did backend development work. HL and AH-B wrote the first draft of the manuscript. All authors contributed to manuscript revision, read, and approved the submitted version.
Funding
This work was supported by the National Science Foundation (grant numbers IOS – 1339156, IOS – 1444490), and Defense Advanced Research Projects Agency (DARPA) Big Mechanism program (ARO W911NF-14-1-0395).
Conflict of Interest Statement
GH-P and MS disclose a financial interest in lum.ai. This interest has been disclosed to the University of Arizona Institutional Review Committee.
The remaining authors declare that the research was conducted in the absence of any commercial or financial relationships that could be construed as a potential conflict of interest
Acknowledgments
We would like to thank CyVerse (DBI – 1265383, DBI-1743442) for technical assistance with Docker Containers and OpenStack Virtualization.
Supplementary Material
The Supplementary Material for this article can be found online at: https://www.frontiersin.org/articles/10.3389/frma.2018.00035/full#supplementary-material
References
Ball, P. (2017). It's not just you: science papers are getting harder to read. Nat. News doi: 10.1038/nature.2017.21751.
Blei, D. M., Ng, A. Y., and Jordan, M. I. (2003). Latent dirichlet allocation. J. Machine Learn. Res. 3, 993–1022.
Bojanowski, P., Grave, E., Joulin, A., and Mikolov, T. (2016). Enriching word vectors with subword information. ArXiv Preprint ArXiv:1607.04606.
Chen, C. (2006). CiteSpace II: Detecting and visualizing emerging trends and transient patterns in scientific literature. J. Am. Soc. Inform. Sci. Technol. 57, 359–377. doi: 10.1002/asi.20317
Hermann, K. M., Kocisky, T., Grefenstette, E., Espeholt, L., Kay, W., Suleyman, M., et al. (2015). “Teaching machines to read and comprehend,” in Advances in Neural Information Processing Systems, (Montreal, QC), 1693–1701.
Klein, D., and Manning, C. D. (2003). “Accurate unlexicalized parsing,” in Proceedings of the 41st Annual Meeting on Association for Computational Linguistics-Vol. 1 (Sapporo: Association for Computational Linguistics), Sapporo 423–430. doi: 10.3115/1075096.1075150
Landauer, T. K., Foltz, P. W., and Laham, D. (1998). An introduction to latent semantic analysis. Discourse Processes 25, 259–284. doi: 10.1080/01638539809545028
Le, Q., and Mikolov, T. (2014). “Distributed representations of sentences and documents,” in International Conference on Machine Learning, Beijing.
Lyons, E., and Freeling, M. (2008). How to usefully compare homologous plant genes and chromosomes as DNA sequences. Plant J. 53, 661–673. doi: 10.1111/j.1365-313X.2007.03326.x
Merchant, N., Lyons, E., Goff, S., Vaughn, M., Ware, D., Micklos, D., et al. (2016). The iPlant collaborative: cyberinfrastructure for enabling data to discovery for the life sciences. PLOS Biol. 14:e1002342. doi: 10.1371/journal.pbio.1002342
Pedregosa, F., Varoquaux, G., Gramfort, A., Michel, V., Thirion, B., Grisel, O., et al. (2011). Scikit-learn: machine learning in python. J. Machine Learn. Res. 12, 2825–2830.
Rehurek, R., and Sojka, P. (2010). “Software framework for topic modelling with large corpora,” in Proceedings of the LREC 2010 Workshop on New Challenges for NLP Frameworks (Valletta: Citeseer).
Sayers, E., and Wheeler, D. (2004). Building Customized Data Pipelines Using the Entrez Programming Utilities (eUtils) (NCBI).
Sievert, C., Parmer, C., Hocking, T., Chamberlain, S., Ram, K., Corvellec, M., et al. (2016). Plotly: Create Interactive Web Graphics via Plotly's JavaScript Graphing Library [Software].
Valenzuela-Escárcega, M. A., Babur, O., Hahn-Powell, G., Bell, D., Hicks, T., Noriega-Atala, E., et al. (2017). Large-scale automated reading with reach discovers new cancer driving mechanisms. Database 2018:bay098. doi: 10.1093/database/bay098
van Eck, N., and Waltman, L. (2009). Software survey: VOSviewer, a computer program for bibliometric mapping. Scientometrics 84, 523–538. doi: 10.1007/s11192-009-0146-3
Keywords: citations, machine learning, natural language processing, scientific publications, visualizations
Citation: Lent H, Hahn-Powell G, Haug-Baltzell A, Davey S, Surdeanu M and Lyons E (2018) Science Citation Knowledge Extractor. Front. Res. Metr. Anal. 3:35. doi: 10.3389/frma.2018.00035
Received: 24 September 2018; Accepted: 26 November 2018;
Published: 18 December 2018.
Edited by:
Neil R. Smalheiser, University of Illinois at Chicago, United StatesReviewed by:
Erjia Yan, Drexel University, United StatesKevin Boyack, SciTech Strategies, Inc., United States
Copyright © 2018 Lent, Hahn-Powell, Haug-Baltzell, Davey, Surdeanu and Lyons. This is an open-access article distributed under the terms of the Creative Commons Attribution License (CC BY). The use, distribution or reproduction in other forums is permitted, provided the original author(s) and the copyright owner(s) are credited and that the original publication in this journal is cited, in accordance with accepted academic practice. No use, distribution or reproduction is permitted which does not comply with these terms.
*Correspondence: Eric Lyons, ZXJpY2x5b25zQGVtYWlsLmFyaXpvbmEuZWR1