 Caio Torres1*
 Lucas Sobreira1
 Manoel Castro-Neto1
 Flávio Cunto1
 Andrés Vecino-Ortiz2
 Katharine Allen2Adnan Hyder3Abdulgafoor Bachani2
- 1Department of Transportation Engineering, Universidade Federal Do Ceara, Fortaleza, Brazil
- 2Johns Hopkins International Injury Research Unit, Department of International Health, Johns Hopkins Bloomberg School of Public Health, Baltimore, MD, United States
- 3Department of Global Health, The Milken Institute School of Public Health, George Washington University, Washington, DC, United States
In urban streets, pedestrians compete with vehicles for right-of-way. In some situations, it may be very challenging for pedestrians to deal with complex, sometimes hostile, traffic conflicts, especially in urban areas. This paper provides an exploratory analysis of pedestrian behavior on four types of mid-blocks crossing facilities in the city of Fortaleza, Brazil. The analysis was based on descriptive statistics and logistic regression models of variables related to signal control, facilities, and pedestrian characteristics and behavior. The models considered the following binary variables: (i) crossing vs. no crossing during pedestrian red phase; (ii) driver yielded vs. did not yield while pedestrian crossing; (iii) normal vs. aggressive/risked pedestrian behavior while crossing. A total of 2,400 crossings were considered in this study. The results show that, in general, the increase of traffic demand was related to easier crossings. Moreover, the presence of raised crosswalks increased in about 20 times the chances of a driver yielding to pedestrians in comparison to the marked-only crosswalk. In addition, the presence of mechanisms that facilitate pedestrian crossings such as raised crosswalks or traffic signals reduced the number of aggressive/risked crossings considerably.
Introduction
Urban road infrastructure planners have traditionally maximized mobility and economic efficiency at the expense of safety, particularly for non-motorized road users. As motorization increases worldwide, walking has become more dangerous in many countries. Pedestrians accounts for 23% of all road traffic deaths, most of them in developing countries (World Health Organization, 2018). In many countries, mixed traffic makes pedestrians share the road with motor vehicles, forcing them to negotiate dangerous situations in fast-moving traffic. According to Elvik et al. (2009), ~70% of the pedestrian crashes happen during crossing. Therefore, a key strategy for achieving a safe traffic system for pedestrians is to minimize the pedestrian-vehicle conflicts.
Crosswalks are the most essential and frequently used pedestrian facility to reduce the number of pedestrian-vehicles conflicts and therefore help reducing possible pedestrian fatalities in urban areas. There are different types of crosswalks that influence the pedestrian crossing process, which depend also on the available vehicle headways and on the pedestrian and driver behavior (Kadali and Vedagiri, 2016).
The literature shows that pedestrian crossing behavior is affected by demographic factors (e.g., age, gender), traffic characteristics (e.g., speed and flow), road environment (e.g., crossing walking distance, presence of traffic/pedestrian control devices and signals, road functional classification, vehicle volumes, weather, presence of crossing facilities), and subjective factors (e.g., perceptions and attitudes) (Bennett et al., 2002; Holland and Hill, 2007; Yannis et al., 2007; Harvad and Willis, 2012).
Econometric models, including discrete choice approaches founded on random utility theory, have been used to describe pedestrian behavior in urban streets (Cantillo et al., 2015). Earlier studies have proposed hierarchical logit models and multiple linear regressions to model pedestrian crossing behavior along an urban trip. A set of geometric and traffic characteristics as explanatory variables, such as walking and crossing distances, traffic volume, and the presence of crossing control devices have been used (Yannis et al., 2007; Zhou and Horrey, 2010). Li et al. (2013) pointed out that almost all pedestrians would speed up crossing the road at a crosswalk and adjust walking speed based on traffic gap.
The road infrastructure (i.e., number and width of lanes, the presence of pedestrian signals, marked areas, overpass, and medians) and trip purpose are two important factors affecting pedestrian crossing behavior (de Lavalette et al., 2009). Other factors are the traffic heterogeneity and signal programming, in the case of signalized intersections (Das et al., 2005).
Some studies suggest that pedestrian crossing behavior can vary according to age, gender, and whether the person is a driver (Cantillo et al., 2015). Usually, unobservable factors such as individual perceptions and attitudes are not considered in pedestrians crossing studies. Even though discrete choice models present good results, some of their assumptions are quite strong (Ortúzar and Willumsen, 2011). The inclusion of intangibles elements associated with pedestrians' perceptions and attitudes, expressed through latent variables, in discrete choice models could help to better understand how individuals behave. The main objective of this paper is to perform an analysis based on logistic regression models to analyze the pedestrian crossing behavior on four types of mid-block crossing facilities in the city of Fortaleza—Brazil.
Methods
This section is divided in two parts to explain the data collection and analysis, respectively.
Data Collection
This study considered four pedestrian crossing types: (1) marked-only, (2) raised, (3) signalized, and (4) signalized with enforcement camera. The sites were selected considering the metropolitan area of Fortaleza City, Brazil (2.5 million inhabitants) from a list of sites based on the safety of the observers, type of control, traffic calming device, enforcement, and spatial coverage in the city.
After the evaluation of the potential sites, the selected locations are shown in Table 1 and Figure 1. These sites are widely spread over the city of Fortaleza and traffic demand varies among the sites. It is important to note that this variability may mediate the results by representing different pedestrian and driver behaviors linked to a given site beyond the type of crosswalk. Considering the volume-capacity indicator as an explanatory variable was an approach to control for vehicular demands along the sites.
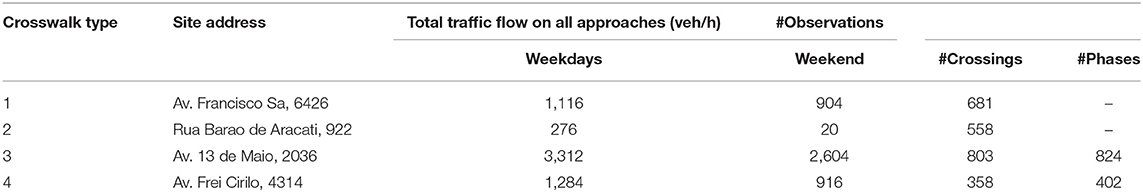
Table 1. Selected sites—traffic volume and number of observations.
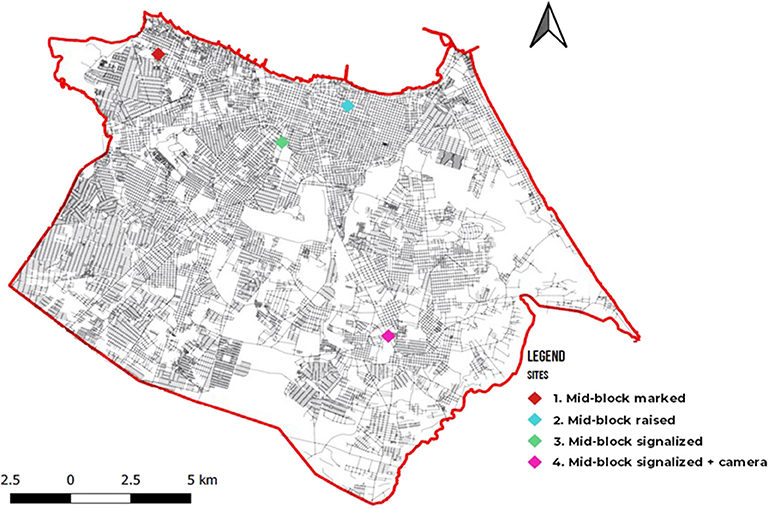
Figure 1. Geographical location of the selected observational sites.
The data collection was conducted through direct field observations from June 12 to June 19, 2017. Each site was surveyed for 3 days (2 weekdays and 1 weekend day), from 7:30 a.m. to 12:30 p.m. and from 1:30 p.m. to 6:00 p.m. The observations were conducted by two observers: one observed the interaction between pedestrians and drivers and the other recorded the observations. In the beginning and in the end of each shift, the traffic volume was counted for a 15-min period to assess the vehicle demand level.
Each observation refers to the first pedestrian that arrived at the crosswalk, regardless if he/she will be joined by other pedestrians. For each observed crossing, the signal phase (if existed) was recorded. The characteristics of the pedestrian (sex and approximate age) and its behavior during the crossing (speed: walk/run; distraction: none/cell phone/headset/talking/other; and group size: alone/2 or more) were also recorded. The crossing behavior was classified into the following types:
1. Did not occur;
2. Normal crossing (when there is no conflict between pedestrian and vehicles);
3. Aggressive crossing (when the pedestrian behavior forces the vehicle to stop);
4. Risked crossing (when there is a conflict between the pedestrian the vehicle so that the vehicle needs to reduce its speed and/or the pedestrian needs to run).
The survey for sites 1 and 2 focused on the interaction between pedestrians and drivers during crossing. From the moment the pedestrian reached the crosswalk edge, the number of vehicles (by type: motorcycle, car/SUV, bus/minibus, and truck) that did not yield to him/her was observed. In cases that a driver yielded to the pedestrian, the vehicle type was noted.
The survey for sites 3 and 4 focused on the behavior of drivers and pedestrians during each signal phase, so the influence of signal phase on the crossing could be evaluated. During the pedestrian green, the number of vehicles that did not yield to pedestrians was recorded. During the pedestrian red, only the type of vehicle that stopped for the pedestrian (if any) was noted.
Data Analysis
The data analysis is divided into two sections: (i) descriptive statistics and (ii) exploratory analysis. In the first section the data are represented in tables, so a general overview of the evaluated variables could be performed in the presented types of crosswalks. In the exploratory analysis, logistic regression models (LRM) were developed to explain the following binary response variables: (i) crossing vs. no crossing while pedestrian red phase in sites 3 and 4; (ii) driver yielded vs. did not yield while pedestrian crossing in sites 1 and 2; (iii) normal vs. aggressive/risked pedestrian behavior while crossing in sites 1 and 2 and sites 3 and 4 during pedestrian red.
The type of crosswalk and the pedestrian/crossings characteristics were used as explanatory variables. A stepwise technique was employed to obtain the most significant factors (p < 0.05). Some statistics were implemented to interpret the results: (i) pseudo-R2 based on the McFadden's R2; (ii) Hosmer–Lemeshow test was used as the goodness-of-fit test, in which the predicted probabilities are divided into groups (commonly 10) and compared with the observed values applying the Pearson chi-square test; and (iii) odds ratio (OR) to estimate the influence of a variable in the response outcome value compared to a reference value.
Since the pedestrian crossing behavior may be influenced by vehicle demand and available gaps, it was decided to include the volume to capacity ratio (v/c) for each data interval. The vehicle capacity of each location was estimated by using VISSIM, one of the most widely used traffic simulation software packages. Some features that might impact the road capacity were inserted: number of lanes, signals cycle length and coordination, nearby bus stops, unsignalized intersections, and desired speed. The driver behavior parameters were kept at their default values.
Results
This section is divided into two parts. The first part presents a descriptive analysis of the data. The second part brings the results for the LRM.
Descriptive Statistics
Table 2 presents the descriptive statistics of the collected variables. The weather was recorded as light rain only in one of the survey shifts, so the influence of this variable cannot be measured.
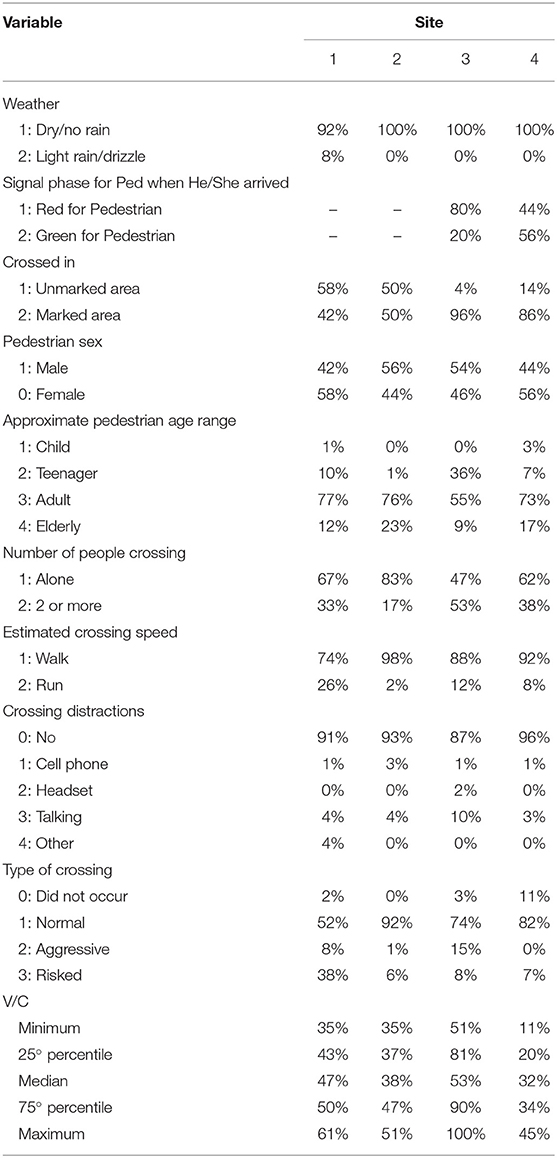
Table 2. Collected variables—descriptive statistics.
In site 3, the percentage of teenagers was considerably higher than in the other crosswalks, as this crossing is located near an Educational Center, thus the incidence of running or distraction may be affected, if younger pedestrians are more likely to exhibit these types of behavior. Table 2 also shows that v/c varies considerably among the sites, and since the behavior of pedestrians might be influenced by this variable, it was decided to account for it by including it as an explanatory variable.
Exploratory Analysis
In this section the results for the three LRM are presented. For models 1 and 3, which evaluate the pedestrian behavior, each observation relates to a pedestrian. For model 2, which focus on driver behavior, each observation consists of a driver yielding decision. Table 3 presents the statistically significant variables and the results for each LRM developed.
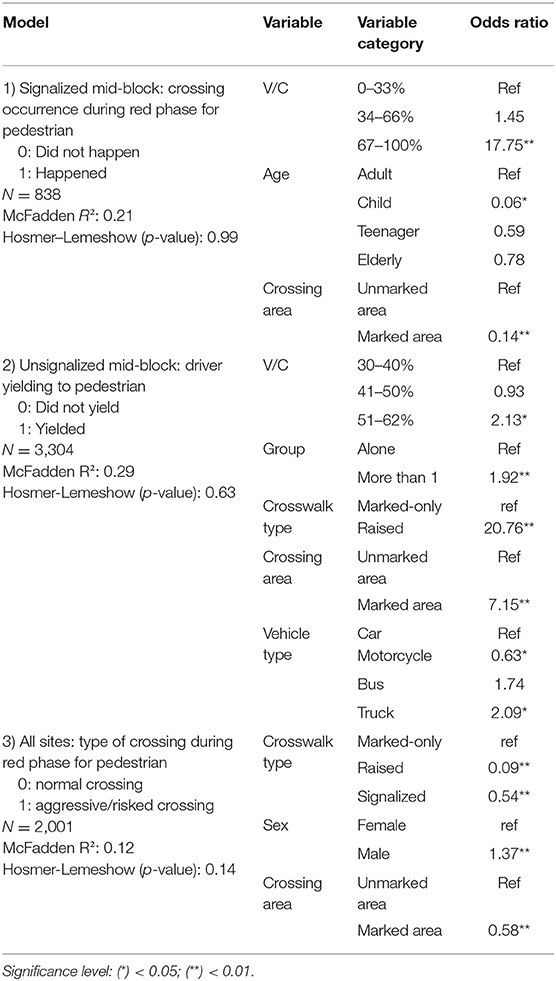
Table 3. Logistic regression models results.
The model assumption of little multicollinearity was verified. The variance inflation factor (VIF) was lower than 1.5 for all variables in all models. Regarding the Hosmer–Lemeshow test, there is no evidence of poor fit in any of the models (p > 0.05 for all of the models).
The OR should be interpreted based on the comparison with the reference value. In model 1, for instance, the OR of 17.75 for the third category of v/c indicated that—holding other variables constant—the odds that Y = 1 (meaning crossing happened) is on average 17.75 times higher when the v/c is between 67 and 100% than when v/c is around 0–33%.
Discussion
Model 1 evaluates the crossing occurrence during red phase for pedestrian in the signalized sites. The presence of the camera enforcement in site 4 was not a significant variable. Regarding the v/c, it can be noticed that during conditions with increased vehicular demand crossings were more likely to happen (OR = 17.75). This finding might be associated with the saturated traffic flow conditions specially where the signalized crossing is relatively close to other signalized intersections. In such conditions, vehicles may be subjected to frequent stops, allowing pedestrians to cross easier during the pedestrian red to save time and for convenience, according to pedestrian perception (Ren et al., 2011). Concerning the pedestrian age, the results from Model 1 show that children were more inclined to wait for the green for pedestrian than the other age categories (OR = 0.06). In respect to the crossing area, the pedestrians that attempted to perform the crossing in the marked area were also more likely to wait for the green for pedestrian that those who crossed in the unmarked area (OR = 0.14). This is probably related to the occurrence of large gaps in the traffic flow that motivates the pedestrian to cross before he/she reaches the crosswalk, without the need of the signal control to stop the vehicles.
Model 2 assesses the driver yielding to pedestrians in sites 1 and 2 based on characteristics of the pedestrians, the vehicle type and the crosswalk facility. Surprisingly, drivers tended to yield more for pedestrians when the v/c was higher (OR = 2.13). One may expect that in situations that there are fewer vehicles, drivers are more confident to yield to pedestrians, mainly because it would be less likely the occurrence of read-end crashes. One hypothesis for that result, however, is that in conditions with more traffic, the vehicular speed is usually lower, therefore drivers may be inclined to respect more the pedestrians. Referring to pedestrian group size, drivers tended to yield more when there were more than one person aiming to cross (OR = 1.92). This finding was also seen in Dommes et al. (2015).
With regards to the crossing facility, the presence of the raised crosswalk increased significantly the rate of driver yielding (OR = 20.76). This result is consistent with the work of Huang and Cynecki (2001), who observed an increase of ~50% in the rate of yielding with the installation of both raised crosswalk and overhead flasher. This may be explained by fact that drivers must reduce the speed to pass through the raised facility and that the traffic environment around local 2 is quieter than in local 1.
Regarding the crossing area, the results demonstrate that drivers were more inclined to yield to pedestrians that were at the marked area than to ones that were at the unmarked area (OR = 7.15). Lastly, as for the vehicle type, motorcycles yielded less to pedestrians than cars did (OR = 0.63). This was somehow expected, since in the city of Fortaleza the motorcyclists usually drive more aggressively and faster than the other types of drivers do (Torres et al., 2018).
Model 3 evaluates the type of crossing (normal or aggressive/risked) around all locations. As the presence of camera enforcement was not significant for the model, sites 3 and 4 were grouped into one category: signalized sites. The v/c was not statistically significant. Concerning the crosswalk type, the raised site presented the fewest level of aggressive/risked crossing (OR = 0.09), followed by the signalized sites, which were safer than the marked-only site (OR = 0.54). Relative to pedestrian gender, it can be noted that males tended to perform more aggressive/risked crossings than females did (OR = 1.37). Finally, the crossings performed in the marked area were less risky than the ones in the unmarked area (OR = 0.58). This finding was also seen in Rosenbloom (2009) and Zhuang and Wu (2011), but it is not consolidated in the literature (Ren et al., 2011).
Conclusion
This research evaluated the behavior of pedestrians when crossing four types of mid-block crosswalks in the city of Fortaleza-Brazil. Exploratory analyses were done by logistic regression models. The types of control (with or without camera enforcement), facilities (marked-only, raised or signalized), pedestrian age, gender and its behavior while crossing (speed, distraction, run/walk, and group size) and driver yielding to pedestrians were evaluated. The analyses focused on three aspects: (i) crossing vs. no crossing while pedestrian red phase in sites 3 and 4; (ii) driver yielded vs. did not yield while pedestrian crossing in sites 1 and 2; (iii) normal vs. aggressive/risked pedestrian behavior while crossing in sites 1 and 2, and sites 3 and 4 during pedestrian red.
In general, it was concluded that crossings during the pedestrian red phase in the signalized sites tended to happen more when the traffic demand high. Also, drivers yielded more to pedestrians in the unsignalized sites in medium to high traffic flow demand. Still regarding the driver yielding, it could be noted that the presence of the raised facility increased in about 20 times the number of drivers that yielded to pedestrians in comparison to the marked-only crosswalk. In relation to aggressive/risked crossings, it was shown that the existence of mechanisms that help pedestrian crossing, such as raised crosswalk or traffic signals, reduced considerably those types of undesirable crossings.
As limitations of the study, it is important to note that although the v/c was controlled, there may be differences in traffic volumes, as well as in demographic and socioeconomic characteristics surrounding the sites that may affect the results and create a confounding effect when comparing different types of crosswalks. In order to improve the comparison among sites, more observations and analyses controlling for these variables should be conducted. Finally, it is important to highlight that this study was conducted in only one city, so the results may not be generalized for other places.
Data Availability Statement
The datasets generated for this study are available on request to the corresponding author.
Author Contributions
CT, LS, MC-N, and FC: study conception and design. CT, LS, MC-N, FC, AV-O, KA, AH, and AB: analysis and interpretation of results and draft manuscript preparation. All authors reviewed the results and approved the final version of the manuscript.
Funding
This study was financed in part by the Coordenação de Aperfeiçoamento de Pessoal de Nível Superior—Brasil (CAPES)—Finance Code 001 by the National Council for Scientific and Technological Development (CNPq)—Grant id #307131/2017-3 and by the Johns Hopkins Bloomberg School of Public Health and Support Foundation for Technical Services, Teaching and Research Promotion (FASTEF).
Conflict of Interest
The authors declare that the research was conducted in the absence of any commercial or financial relationships that could be construed as a potential conflict of interest.
Acknowledgments
The authors acknowledge the financial support provided by CAPES, CNPq, and Johns Hopkins Bloomberg School of Public Health.
References
Bennett, S., Felton, A., and Akcelik, R. (2002). “Pedestrian movement characteristics at signalised intersections,” in 23rd Conference of Australian Institutes of Transport Research (CAITR 2001). Melbourne, VIC. Available online at: https://www.semanticscholar.org/paper/Pedestrian-movement-characteristics-at-signalised-Bennett-Felton/576a7430110e31966a3f1d3b4c633ac46d2b87b3 (accessed October 30, 2019).
Cantillo, V., Arellana, J., and Rolong, M. (2015). Modelling pedestrian crossing behaviour in urban roads: a latent variable approach. Transport. Res. F Traffic Psychol. Behav. 32, 56–67. doi: 10.1016/j.trf.2015.04.008
Das, S., Manski, C. F., and Manuszak, M. D. (2005). Walk or wait? An empirical analysis of street crossing decisions. J. Appl. Econom. 20, 529–548. doi: 10.1002/jae.791
de Lavalette, B. C., Tijus, C., Poitrenaud, S., Leproux, C., Bergeron, J., and Thouez, J. P. (2009). Pedestrian crossing decision-making: a situational and behavioral approach. Saf. Sci. 47, 1248–1253. doi: 10.1016/j.ssci.2009.03.016
Dommes, A., Granié, M. A., Cloutier, M. S., Coquelet, C., and Huguenin-Richard, F. (2015). Red light violations by adult pedestrians and other safety-related behaviors at signalized crosswalks. Accid. Anal. Prev. 80, 67–75. doi: 10.1016/j.aap.2015.04.002
Elvik, R., Høye, A., Vaa, T., and Sørensen, M. (2009). The Handbook of Road Safety Measures. Bingley: Emerald Group Publishing Limited.
Harvad, C., and Willis, A. (2012). Effects of installing a marked crosswalk on road crossing behaviour and perceptions of the environment. Transport. Res. F Traffic Psychol. Behav. 15, 249–260. doi: 10.1016/j.trf.2011.12.007
Holland, C., and Hill, R. (2007). The effect of age, gender and driver status on pedestrians' intentions to cross the road in risky situations. Accid. Anal. Prev. 39, 224–277. doi: 10.1016/j.aap.2006.07.003
Huang, H. F., and Cynecki, M. (2001). Effects of Traffic Calming Measures on Pedestrian and Motorist Behavior. Thousand Oaks, CA. doi: 10.1037/e666582007-001
Kadali, B. R., and Vedagiri, P. (2016). Proactive pedestrian safety evaluation at unprotected mid-block crosswalk locations under mixed traffic conditions. Saf. Sci. 89, 94–105. doi: 10.1016/j.ssci.2016.05.014
Li, P., Bian, Y., Rong, J., Zhao, L., and Shu, S. (2013). Pedestrian crossing behavior at unsignalized mid-block crosswalks around the primary school. Proc. Soc. Behav. Sci. 96, 442–50. doi: 10.1016/j.sbspro.2013.08.052
Ortúzar, J. D., and Willumsen, L. G. (2011). Modeling Transport, 4th Edn. New York, NY: John Wiley and Sons. doi: 10.1002/9781119993308.ch7
Ren, G., Zhou, Z., Wang, W., Zhang, Y., and Wang, W. (2011). Crossing behaviors of pedestrians at signalized intersections. Transport. Res. Rec J. Transport. Res. Board 2264, 65–73. doi: 10.3141/2264-08
Rosenbloom, T. (2009). Crossing at a Red light: behaviour of individuals and groups. Transport. Res. F Traffic Psychol. Behav. 12, 389–394. doi: 10.1016/j.trf.2009.05.002
Torres, C. A., Sobreira, L. T. P., Castro-Neto, M. M., Cunto, F. J. C., Vecino-Ortiz, A. I., and Hyder, A. A. (2018). “Monitoramento de Fatores de Risco Durante a Prática de Estratégias para Promoção da Segurança Viéria,” in 32nd Conference of Associação Nacional de Pesquisa e Ensino em Transportes (ANPET). Gramado. Available online at: http://146.164.5.73:30080/tempsite/anais/documentos/2018/Trafego%20Urbano%20e%20Rodoviario/CT/5_695_CT.pdf (accessed October 14, 2019).
World Health Organization (2018). Global Status Report on Road Safety 2018. WHO. Available online at: https://www.who.int/violence_injury_prevention/road_safety_status/2018/en/ (accessed July 7, 2019).
Yannis, Y., Golias, J., and Papadimitriou, E. (2007). Modeling crossing behavior and accident risk of pedestrians. J. Transport. Eng. 133, 634–644. doi: 10.1061/(ASCE)0733-947X(2007)133:11(634)
Zhou, R., and Horrey, W. J. (2010). Predicting adolescent pedestrians' behavioral intentions to follow the masses in risky crossing situations. Transport. Res. F Traffic Psychol. Behav. 13, 153–163. doi: 10.1016/j.trf.2009.12.001
Keywords: pedestrian crossing, pedestrian facilities, pedestrian behavior, mid-block crosswalks, logistic regression models
Citation: Torres C, Sobreira L, Castro-Neto M, Cunto F, Vecino-Ortiz A, Allen K, Hyder A and Bachani A (2020) Evaluation of Pedestrian Behavior on Mid-block Crosswalks: A Case Study in Fortaleza—Brazil. Front. Sustain. Cities 2:3. doi: 10.3389/frsc.2020.00003
Received: 21 November 2019; Accepted: 10 January 2020;
Published: 31 January 2020.
Edited by:
Dorota Lasota, Medical University of Warsaw, PolandReviewed by:
Katarzyna Anna Naylor, Medical University of Lublin, PolandRadovan Madlenák, University of Žilina, Slovakia
Copyright © 2020 Torres, Sobreira, Castro-Neto, Cunto, Vecino-Ortiz, Allen, Hyder and Bachani. This is an open-access article distributed under the terms of the Creative Commons Attribution License (CC BY). The use, distribution or reproduction in other forums is permitted, provided the original author(s) and the copyright owner(s) are credited and that the original publication in this journal is cited, in accordance with accepted academic practice. No use, distribution or reproduction is permitted which does not comply with these terms.
*Correspondence: Caio Torres, Y2Fpb0BkZXQudWZjLmJy