 Mihir Prakash
 Marco Kamiya
 Robert Ndugwa
 Mengfan Cheng1
- 1AidData, College of William & Mary, Williamsburg, VA, United States
- 2Global Fund to End Modern Slavery (GFEMS), Washington, DC, United States
- 3UN-Habitat, Nairobi, Kenya
As we enter the decade of action on the SDGs, it is necessary to have quantifiable information on the relevant costs of achieving the Sustainable Development Goals (SDGs). Without this information, it will be difficult for decision-makers and stakeholders to effectively allocate existing and scarce resources as well as identify the resource gap that would need to be bridged through exploration and implementation of feasible alternate financing mechanisms. Several studies have estimated the global resource needs to achieve the SDGs, but none identify a clear way to estimate these costs for cities, which are expected to deliver on the SDG agenda for the anticipated 70% of the world's population by 2050. This is perhaps because resource needs vary significantly with city context. Acknowledging this need and to stimulate the dialogue on local costs of sustainability, this study proposes a novel method to determine the cost of achieving housing, transportation, public spaces and solid waste management dimensions (or hard costs) of Sustainable Development Goal 11 (SDG 11) as well as the cost of municipal governance and planning (soft costs) for cities in developing countries. The study also demonstrates the value proposition of using a systematic approach to model the costs of achieving SDG 11 by applying this method to four countries. Apart from sharing the proposed method, the study shares four key findings: (1) despite the inherent difficulty of quantifying and standardizing what comprehensive urban sustainability means for all cities, urban experts do agree on objective criteria of what a baseline level of urban performance should be for some of its dimensions; (2) pursuit of sustainable cities implies different things depending on the development status of the country; (3) cities of different sizes have differing needs and costing methods need to account for transitions from small- to medium-size and medium- to large-size over time; and (4) better understanding needs to be built of what achievement might look like in practice for the subjective targets of SDG 11 such as those pertaining to “heritage and conservation” and “disaster risk and resilience.”
Introduction
In 2015, member states of the United Nations acknowledged the importance of cities in the efforts to become sustainable by the year 2030, through the creation and adoption of Sustainable Development Goal 11 (SDG 11) that seeks to “Make cities and human settlements inclusive, safe, resilient, and sustainable” (United Nations, 2015a). Soon after, member states reconvened to agree upon the New Urban Agenda (NUA) and set forth the principles of sustainable urban development that would guide cities on their pursuit of sustainability over the next 20 years (UN Habitat, 2016). The SDGs and the NUA are both ambitious in scope, and with only 10 years remaining to achieve the SDGs, much work still needs to be done.
Creating socially and environmentally sustainable cities is critical to achieving the SDGs (Daniel, 2015). The task requires coordinated and strategic efforts to fulfill these commitments at all levels of government, from local to national. Central to this is the execution of policies and budgets that mobilize the required resources to support necessary projects and programs over the next decade. The 2015 Addis Ababa Action Agenda established a strong foundation to support the implementation of the 2030 Agenda for Sustainable Development including setting forth a comprehensive set of policy actions and a framework for financing the SDGs (United Nations, 2015b) that member states agreed to implement, including empowering municipalities and local authorities to generate their own revenues and finance the SDGs. Yet, in the absence of quantifiable information on the costs to implement SDGs and realize the NUA, it is difficult to accurately assess what resources are needed or identify shortfalls.
Several previous studies have attempted to quantify the costs to achieve the SDGs (Schmidt-Traub, 2015; Hutton and Varughese, 2016; McKinsey Global Institute, 2016; Global Infrastructure Outlook, 2017; Stenberg et al., 2017), but none comprehensively and specifically capture the cost of achieving urban sustainability or SDG 11 or the NUA. The variation in the size, cultural context, economy and location that can be observed in cities perhaps makes the task of defining what it means to be sustainable quite difficult (Barnett and Parnell, 2016; Koch and Krellenberg, 2018). Nonetheless, these studies offer a starting point upon which this study builds to gauge the financial requirements posed by urban sustainability.
When it comes to infrastructure spending, two previous studies provide a good starting point for costing the hardware of infrastructure. The McKinsey Global Institute's Bridging Global Infrastructure Gaps report estimates that the world must spend US$3.3 trillion annually to close the infrastructure gap by 2030—a shortfall of US$0.8 trillion considering current spending of US$2.5 trillion per year. The McKinsey estimate includes the costs for basic and local infrastructure in high, middle, and low-income countries. Meanwhile, the Global Infrastructure Hub's Global Infrastructure Outlook (GIO) study estimates a similar shortfall of US$0.6 trillion per year, but places current spending at US$3.3 trillion and total need at US$3.9 trillion per year.
One important difference between the two estimates is that the GIO report maps infrastructure-related costs to various SDGs, including SDG 6 (Water) and SDG 7 (Energy), while the McKinsey effort does not. Both methods provide a good starting point for costing the hardware of infrastructure, but fall short in three respects: (i) they do not consider the cost of the governance, also defined as urban management (e.g., institutions to support sustainable urbanization); (ii) they do not take into account the cost of implementing social policies; and (iii) the macroeconomic nature of the approach increases the uncertainty of the estimates and provides only a fuzzy picture, at best, of the true costs to achieve SDG11.
Moving from infrastructure to other facets of the SDGs, the Sustainable Development Solutions Network (SDSN) benchmarked the costs to achieve the SDGs using costing studies done for the Millennium Development Goals (MDG) in their Investment Needs to Achieve the Sustainable Development Goals report. While limited to mostly issues that overlap between the MDGs and the SDGs—Health, Education, Environment, Food, Water & Sanitation, Telecommunication, SDG Data, and Emergency Response/Humanitarian—the underlying research offers references to various MDG costing studies that are relevant to costing SDG 11 achievement by 2030.
Two sector-specific costing studies offer additional lessons learned to inform our research. The World Bank's Costs of Meeting the 2030 Sustainable Development Goal Targets on Drinking Water, Sanitation, and Hygiene estimates that it will take US$13.8 to $46.7 billion per year (0.1% of global GDP) to achieve only two SDG targets: 6.1 (safe and affordable drinking water) and 6.2 (sanitation and hygiene for all). The authors estimated the amount of population to be served in rural and urban areas by 2030, accounting for population growth and internal migration, in 140 countries (covering roughly 85% of the world population), and captured the costs of capital investments, program delivery, operations, and capital maintenance for WASH-related investments in most low and middle-income countries, as well as high-income countries with low WASH coverage. Meanwhile, the World Health Organization (WHO) estimates a cost of US$58 per person/year to achieve health-related SDG targets (34 indicators, across 17 targets and 4 goals) by 2030 for low and middle-income countries. Their study, Financing Transformative Health Systems Toward Achievement of the Health SDGs: A Model for Projected Resource Needs, analyzes 67 countries representing varied levels of existing health systems capacity and uses the local cost of inputs or interventions as the basis for the costing exercise. Costs are also modeled using different approaches (1) where countries' advancement toward global targets was constrained by their health systems' absorptive capacity (progress scenario) and (2) where countries' health systems are not a constraint (ambitious scenario) These estimates are likely in need of review and modification based on lessons learned from the ongoing COVID-19 pandemic.
Beyond the five costing studies profiled above, there are additional studies that have estimated SDG related costs, such as: UNCTAD's World Investment Report 2014 (United Nations, 2014): Investing in the SDGs—An Action Plan the African Development Bank's Africa Infrastructure Development Index (Letsara and Saidi, 2013); OECD's Measuring Distance to the SDGs Targets; and Ojo et al. (2018). The Development of an Infrastructure Quality Index for Nigerian Metropolitan Areas Using Multivariate Geo-Statistical Data Fusion.
Upon review of these global and sector-specific assessments, three key limitations emerge. First is that the estimates are less actionable at the country and local level since they aggregate infrastructure needs to the global level. Disaggregating these cost estimates to countries is not possible since the methods used are more appropriate for global analysis of resource needs. Second, sectoral assessments do not differentiate between urban and rural resource requirements and evaluate resource needs at the country level for the entire sector. This makes it difficult to distinguish between the rural and urban resource needs. Third, none of these studies account for the “soft costs” associated with achieving sustainable development. Soft costs are the costs incurred in the provision of essential urban management systems that are not directly linked to physical infrastructure, such as the cost of having various city agencies with trained professionals that create the institutional infrastructure necessary to support sustainable urban development. In contrast, “hard costs” are the costs of developing physical infrastructure and other construction (see: Figure 1).
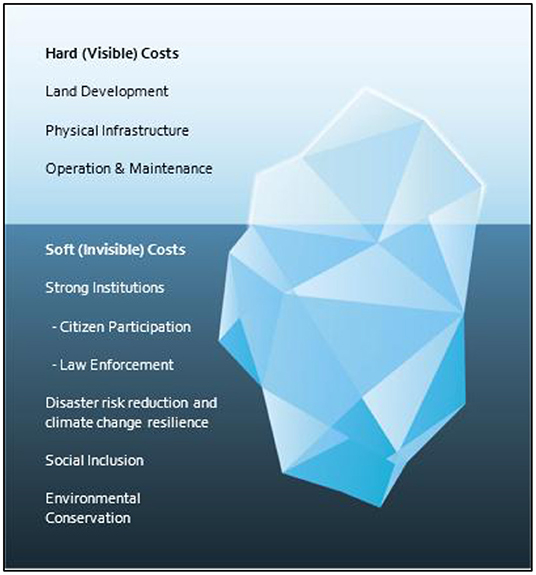
Figure 1. Illustration representing visible and invisible costs of sustainable urban development. Source: (Prakash et al., 2020).
Nonetheless, these studies provide necessary insights on how one might approach answering the question of “how much would it cost to achieve SDG 11?” To this end, this study aimed to develop a systematic, replicable, and scalable approach to capture both the hard and soft costs to support achieving SDG 11 in the lead-up to 2030. This paper presents the costing method that was developed.
Research Method
It is well-understood that the needs of cities, as well as their approach to sustainability, are not standard, starting with the definitional differences on what legally constitutes a city. This is perhaps why the NUA is broader in its scope and provides guiding principles for sustainable urban development that local governments should follow. Meanwhile, SDG 11 contains 10 distinct targets to be achieved at the aggregate or national level. For any costing exercise, a clear and quantifiable endpoint must exist. For this reason, SDG 11 provided a somewhat objective lens for this research to establish a baseline cost to achieve “sustainable cities and communities” by 2030.
Based upon the review of previous costing studies and the envisioned objective of this research, AidData and UN-Habitat initially identified three possible approaches to cost SDG 11 (top-down, bottom-up and hybrid), each with their own trade-offs. The top down approach would evaluate urban costs at the national level, whereas the bottom up approach would cost SDG 11 targets at the city level with very high granular data requirement. Although the latter would allow for the consideration of contextual subjectivity of various urban measures, this approach would be highly resource intensive. Therefore, an approach that was a hybrid of the two was identified as most suitable to cost SDG 11.
Many of the soft costs related to SDG 11 are difficult to contextualize and quantify. This is especially the case for expenditures related to governance and planning and various public programs. However, for other dimensions, such as housing and transportation, many standards for sustainability exist. The hybrid approach incorporates elements of both the top-down and bottom-up approaches to costing SDG 11 achievement wherein, primary data on cities to calculate gaps using these standards would be used and results would be supplemented with top-down costs derived from historical budgetary information of a city that is widely recognized as a best-practice.
Progress on the 10 targets contained within the SDG 11 framework are to be monitored using 15 indicators. However, for many of the indicators it is unclear what value a city that has achieved goal 11 might report. To gain further clarity on what achieving SDG 11 would mean in practice, a group of 20 technical experts from across the UN system, academia, civil society, and city governments were consulted through a series of key-informant interviews, and their inputs were gathered on:
a. Breakdown of SDG 11 targets into key dimensions that need to be achieved by thematic area;
b. Benchmarks associated with achievement of these key dimensions;
c. Potential approaches to estimating costs; and
d. Setting expectations and understanding the limitations of this study, including the identification of dimensions that are difficult to quantify and cost.
Following these consultations, desk research identified: (1) common definitions, parameters, and types of investment activities that scholars or practitioners associate with SDG 11 and urban sustainability; and (2) the general availability and quality of data on existing infrastructure and urban management capacity (hard and soft elements).
A draft method was then developed that synthesized expert inputs and desk research findings on how best to quantify expenditures needed to achieve the quantifiable dimensions of SDG 11. This synthesis also led to the emergence of seven abstract thematic areas within the objectives of SDG 11 (see: Table 1).
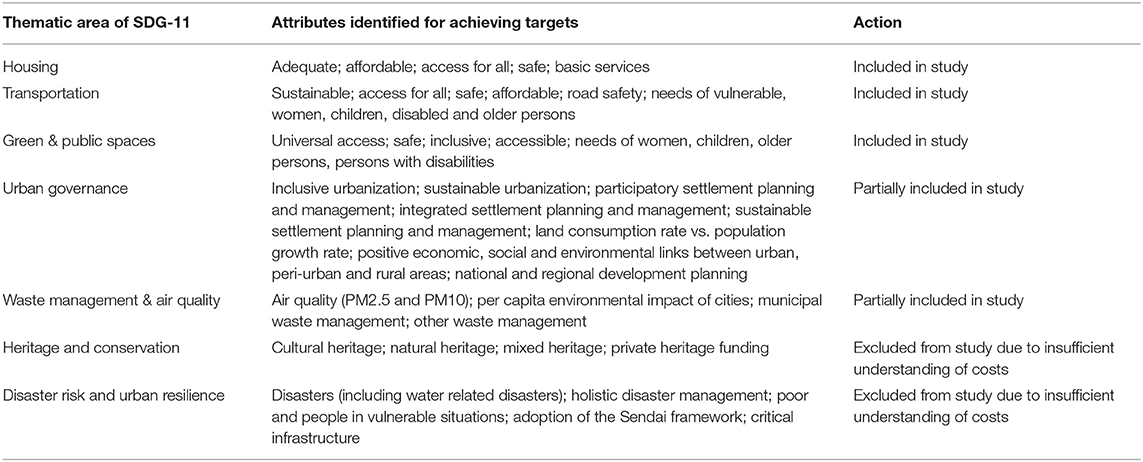
Table 1. Breakdown of SDG-11 targets into attributes that need to be achieved by 2030 and inclusion status in study.
The next section presents the finalized method that this study produced.
Costing Method
Expert consultations and a review of literature on the criteria for achieving the various SDG 11 targets, which were mapped to seven distinct thematic areas, revealed a consensus among urban practitioners and scholars on certain minimum standard of performance across five out of the seven thematic areas (see: Table 1). This study, therefore, proposes methods to determine the cost of providing this baseline level of services in cities that would imply achieving only specific aspects of SDG 11 that fall within the five thematic areas. Where possible, this baseline method requires input prices that are specific to the city, thereby providing cost estimates that are customized to each city.
It is also recognized that SDG 11 targets are cross-linked with other SDGs and, therefore, measuring performance on the SDGs are multivariable. For the purposes of this research multivariable analysis of costs is not done and the analysis is limited to SDG 11, and any cross-links among SDG 11 targets only. For example, the affordability and spatial distribution of housing, which is monitored under SDG 11.1.1, is strongly linked to many other SDG goals and targets including Goal 1 on poverty, Goal 5 on Women empowerment, and Goal 10 on inequalities. Any investments into SDG 11.1.1 at the city level, or SDGs 1, 5, and 10 at the national level will have cost overlaps. Future policy research could explore the cost overlaps across SDGs. A detailed mapping between SDG 11 targets and targets of other goals is provided by UN Habitat (2018) in their “Tracking Progress Toward Inclusive, Safe, Resilient and Sustainable Cities and Human Settlements” report.
Within the boundaries set by these limitations, this section provides detailed explanations of the method that was developed to determine the cost of achieving the baseline levels of service for the five well-understood thematic areas of SDG 11, the associated concepts and definitions, the assumptions that were made in order to model the costs and interlinkages of costs with other thematic areas within SDG 11.
Housing
Housing is perhaps one of the most important priorities that cities need to address in order to achieve Goal 11 of the SDGs. Evaluating SDG 11 revealed five key dimensions of housing that need addressing:
1. Adequate;
2. Affordable;
3. Accessible;
4. Safe; and
5. Includes basic service access.
or this research, UN-Habitat Global Strategy's definition of adequate housing was used, that suggests that a house should have adequate privacy, adequate space, adequate security, adequate lighting and ventilation, adequate basic infrastructure, and an adequate location with regard to the location of work and basic facilities—all at a reasonable cost. To achieve “housing for all” by 2030, sufficient housing units need to either be upgraded or constructed such that the number of adequate housing units in each city is equal to or greater than the number of households in that city.
However, the existence of housing units does not imply that households in need of adequate housing are able to occupy those units due to market prices. This is a demand-side problem (Potts, 2020). To account for this affordability gap, the number of households in the lowest quintile by income were used as the households who would be in need of a rent subsidy.
During the expert consultations, interviewees emphasized the sustainability failures of policies that relocate households from inadequate units they currently occupy to new adequate units on urban outskirts. This is partially because: relocation often has negative effects on the livelihood and inclusivity of the vulnerable urban poor; and it also encourages sprawl in large cities. To account for these challenges in costing for sustainable housing, the cost of redevelopment and in-situ upgrades for all households living in inadequate conditions was used (for the base year 2019) and then the market price of an adequate housing unit was used for growth in the number of households (for subsequent years).
Logical Explanations and Formulas
Using population growth rates and the average household size, the annual need for adequate housing stock additions were projected. To determine the cost of providing adequate housing for all households by 2030, the study divided the task into two distinct pieces:
1. Housing units that need to be built to provide an adequate home to every household by 2030; and
2. The amount of subsidy that would need to be provided so that the lowest quintile (20%) of population by income can afford to live in such units.
The first cost is defined as the sum of costs to upgrade existing inadequate homes and the cost to develop new housing stock to accommodate yearly household growth.
Where,
And,
For costing the affordability subsidy, the following formula was used:
Where,
is the total number of new households in the year i.
The cost of upgrading an inadequate housing unit was derived from upgrade projects that experts consider a success in the country or a comparable case from another country. Expert opinion suggested that households should spend no more than 30% of their income on housing costs. This guideline was used to determine how much subsidy would be required for the lowest quintile of households.
It is important to note the difference between the total cost of housing and the total public cost of housing. To determine how much of this cost is likely a public expense, the one-time cost of upgrading slums, informal settlements, and other inadequate homes, as well as the recurring cost of housing subsidies was used.
Assumptions Made
The first assumption—inherent in considering the market price of a minimum viable adequate housing unit as the basis for determining total resources required for mobilization—is that there would be enough supply of adequate units by the market. Using the market price as a benchmark accounts for aggregate cost of land, construction labor and materials and any other project-related costs such as design, management and operations, as well as the developers' incentives and profits.
The second assumption is that households typically should spend a maximum of 30% of their income on housing. This is not a recognized standard, but it is a good policy guideline that is widely accepted in the social sciences community. The OECD benchmarks the “housing cost overburden rate” at 40% of net income (OECD, 2019a,b).
The third assumption is that any costs that are associated with ensuring structural safety of adequate housing units are captured by using the market price of an adequate housing unit. Other dimensions of safety, such as those associated with crime, are not included in our costing as they are implicit in other municipal expenditures, such as urban policing, that are beyond the scope of this SDG 11 specific study.
The fourth assumption is that the market rent for an adequate home is equal to the monthly mortgage payment a household would pay if they were to purchase the housing unit.
Our last assumption is that only existing inadequate homes would require upgrades and that, with a sufficient housing subsidy program and a market-based supply of adequate housing, no new inadequate housing structures would emerge. This is likely not the case, because there exists degrading housing stock for which we have no data, as well as the probability of further degraded or destroyed housing in the face of external shocks, such as natural disasters and economic downturns.
Interlinkages With Other Thematic Areas
A critical dimension to sustainable housing is ensuring that the spatial distribution of housing is equitable. In other words, housing stock has accessibility to other land uses within the city. This cannot explicitly be costed. Local urban planning authorities need to ensure the accessibility and inclusivity of housing through proper city planning and reflect it in a city's master plan. Arguably, by accounting for the operating cost of a city's planning department and the one-time cost of developing an urban master plan, the cost of accessible and inclusive dimensions of sustainable urban housing would be incorporated. This cost is further discussed in the Urban Governance and Planning Costing method section.
Transportation
Sustainable transportation is a crucial dimension of urban sustainability and economic growth due to its crosscutting nature. A good transportation system in a city is a prerequisite for urban mobility, economic growth, social inclusion and a clean urban environment.
SDG 11 breaks down a transportation system to include the dimensions of sustainability, access for all, safety, affordability, and the needs of the vulnerable, women, children, and disabled and older persons. Based on expert consultations on these dimensions, and their significance in implementation, the following quantifiable baseline needs were identified:
1. There should be enough hybrid or electric buses providing connectivity to all urban dwellers;
2. These buses should be equipped with features such as CCTV cameras and wheelchair accessibility to cater to the needs of women, children, disabled and elderly persons;
3. There should be enough road infrastructure for supporting bus and private vehicle trips, following a well-designed road hierarchy;
4. To ensure public transport access for all, there should be an articulated bus stop, with sufficient safety and accessibility features like lighting, seats and wheelchair ramps, within walking distance of all urbanized areas;
5. There should be adequate spending on road safety, such as road signs, functioning traffic lights, and pedestrian crossing infrastructure, as well as soft inputs, such as driver training programs and citizen awareness campaigns; and
6. The system should be affordable to use for all socio-economic groups.
There are a substantial number of moving parts in a city's transportation system, some of which are listed above. To ensure that these variables operate in harmony and as part of one transportation system, there needs to be a sustainable urban mobility plan (SUMP). Transportation experts echoed the fact that such a plan is essential in creating a contextually relevant holistic system that accounts for individual preferences in choice of transportation mode (walking, bicycling, taking buses, or using private vehicles) and ensures that the system is inclusive and safe. Such a plan would also address the growing concerns over carbon emissions generated by inefficient transportation systems in cities, by using the avoid, shift and improve (ASI) approach (GIZ, 2019). Therefore, the cost of developing such a plan for every city is included in the study.
Logical Explanations and Formulas
Below are the functions that were used for costing each dimension of transportation for a city:
Road Infrastructure
The length of new roads that need to be constructed was determined based on standards of typical road length per 1,000 persons in a well-functioning city. This cost was further broken down by road type (i.e., Arterial/Sub-Arterial, Collector and Local) for more accurate costs. For this, the typical road length distribution of a transportation system by road type was used: 5% Arterial, 10% Sub-Arterial, 10% Collector and 75% Local roads (FHWA, 2013). By doing so, costs associated with building sidewalks, stormwater drains and other integrated road features that are critical for sustainability were accounted for. For existing roads, local data to determine what length of existing roads need repaving by type of road was used.
Where,
is the length of new road to be built in year i;
is the length of road to be paved in year i; and
is the total length of roads in year i
Besides construction and repaving costs, an annual road maintenance cost based on the total length of roads in the city was also added.
Buses
For buses, the World Bank's standard of between 0.5 to 1.2 buses per 1,000 persons, based on city type, was used (The World Bank, 2006). This was 0.5 for smaller cities, 0.8 for medium cities and 1.2 buses per 1,000 persons for large cities. To ensure a cleaner urban environment and an inclusive and safe transit system, the cost of modern hybrid buses with accessibility and safety features was used to determine fleet capital cost. Where data was available on the existing number of buses operating in a city, costs were discounted accordingly.
Bus Stops and Terminals
The number of stops that would be required in a city such that access to the transit system was within walkable distance was obtained by dividing the total urbanized area by the area of a circle with 0.5 km radius. City areas were also modeled to grow over time and constructing additional bus stops were costed accordingly. Spatial growth rates were borrowed from the Atlas of Urban Expansion (2016).
For bus terminals, the standard of one terminal per 120 buses borrowed from the Transit Capacity and Quality of Service Manual (Transport Research Board, 2017) was used.
Operation, Maintenance and Administration (OMA)
OMA budgets of several cities that have a well-functioning bus system were evaluated to derive the average operation and maintenance cost per bus, as well as the average administration cost of the transit authority per bus. This helped to effectively rescale OMA costs to cities with different population sizes.
Planning and Road Safety
Expert consultations suggested that the typical cost of development of a Sustainable Urban Mobility Plan (SUMP) for small to medium cities is USD 100,000 and for large cities is USD 350,000.
A 10% blanket cost buffer to the total cost (per similar expert guidance) was also added to account for additional spending on road safety infrastructure and soft inputs, such as driver training programs and citizen awareness campaigns.
Affordability
Lastly, subsidies that may be required for the lowest quintile of the population by income level were added to the cost. The general principle that the transportation cost burden should not exceed more than 20% of monthly household income, as suggested by experts, was used.
The average cost of a public transit trip in each city was compiled using targeted web searches.
Assumptions Made
While each city has different characteristics (based on terrain, layout, and other factors), the following assumptions were made in order to arrive at transportation cost estimates:
First, on average, the composition of the length of arterial/sub-arterial, collector and local roads for all cities is assumed to be the same, along with no variation in the design of these roads based on city type. For instance, cities that experience low to no rainfall do not require their roads to include storm-water drainage features, which may lower the costs of construction.
Second, any repaving of roads would be done in the first year and the road system would not require repaving until 2030. Repair and upkeep would be covered in the yearly road maintenance costs.
Third, by providing adequate buses in a public transport system people would switch their preferences from other modes of transport. Additionally, standard operating buses were considered as baseline for public transport of a city. Advanced transit systems like a Bus Rapid Transit (BRT) or Mass Rapid Transit Systems (MRTS) are likely necessary for larger cities. However, the design of such systems is highly variable, and it was difficult to determine the cost of these advanced systems and where they need to be built.
Fourth, having a municipal transit authority would ensure a fair and equitable distribution of transit stops in order to maximize public transportation coverage. Additionally, cities are assumed to be uniformly dense and that all urbanized areas require public transport access. In order to derive standard Operation, Maintenance and Administration costs, functioning transit authorities in other developing cities, such as Mumbai's BEST company, were used to benchmark average costs to population size. There may be some variation in this cost based on country context, which includes technical capacity, institutional efficiencies, and other variables.
Fifth, a flat 10% of the total transportation cost was assumed as a sufficient cost for road safety. This may also vary based on several local factors, such as literacy levels and citizen respect for local laws. Additionally, the cost of developing a SUMP may vary based on the complexity of the planning and design processes that would be required for a city.
Lastly, for affordability calculations, only the bottom quintile of the population was considered. It is possible that more households than just the bottom 20% by income require a subsidy, depending on the level of inequality in the city.
Interlinkages With Other Thematic Areas
An externality of a sustainable urban transportation system, which the study does not explicitly capture in any of the costing methods, is urban ambient air quality (PM2.5/PM10). The cost of improving air quality in cities is made implicit by costing better public transport infrastructure (e.g., hybrid and electric buses) and promoting trip shifts to public transport over time.
Solid Waste Management
Solid waste management is an essential requirement and service for achieving environmental sustainability in urban communities, especially due to rapid population growth and the increase in waste generated per person associated with economic growth and structural transformation. Most landfill sites in developing countries—if they have not already reached full capacity, which is the case for many—are not constructed or operated as sanitary landfills where waste decomposes to biologically and chemically inert materials while being isolated. Inadequately disposed waste results in problems such as ground water contamination and the deterioration of air quality, which also create public health risks. Collection coverage is another major challenge, as uncollected waste usually ends up blocking urban drainage systems and may exacerbate flooding and other urban environmental and public health challenges.
For the purpose of this study, solid waste was defined as municipal solid waste, including industrial/construction and medical waste. SDG 11 specifies the components for solid waste management as ‘the collection of urban (municipal) solid waste and adequate final discharge’. Following SDG 11, the study benchmarked a baseline that a solid waste management system in urban areas should:
a Have the capacity to provide 100% coverage for waste collection;
b Dispose of collected waste using adequate methods and tools minimizing environmental damage and health risks.
Logical Explanations and Formulas
Projecting Waste Generated Per Capita for Future Years
While the current waste generated per capita is typically known, it is crucial to project waste per capita in the future, as research shows that waste per capita increases significantly with economic growth. Following the waste generation projection method published by the World Bank in their “What A Waste 2.0” report (World Bank, 2018), the projected waste per capita over the years was calculated as:
Where,
Proxy waste generated per capita in year i, denoted by Proxy Waste Generation Per Capitai, is calculated as:
Although cities should pursue efforts to reduce, reuse and recycle, waste experts advise that a baseline scenario for urban solid waste management requires sanitary landfills and safe disposal. Therefore, the cost of recycling and incineration as alternate methods of waste disposal were excluded in the costing method.
Baseline Cost estimation for Waste Management
Sanitary landfill Sanitary landfills, different from dumpsites, are modern engineering sites where waste is isolated from the environment until it decomposes into harmless materials. According to the Decision-maker's Guide to Solid Waste Landfills (Thurgood et al., 2010), a sanitary landfill should at minimum meet the following conditions:
a. Full or partial hydrogeological isolation: If a site cannot be located on land, which naturally contains leachate security, additional lining materials should be brought to the site to reduce leakage from the base of the site (leachate) and help reduce contamination of groundwater and surrounding soil. If a liner (soil or synthetic) is provided without a system of leachate collection, all leachate will eventually reach the surrounding environment. Leachate collection and treatment must be stressed as a basic requirement;
b. Formal engineering preparations: Designs should be developed from local geological and hydrogeological investigations. A waste disposal plan and a final restoration plan should also be developed.
c. Permanent control: Trained staff should be based at the landfill to supervise site preparation and construction, the depositing of waste and the regular operation and maintenance.
d. Planned waste emplacement and covering: Waste should be spread in layers and compacted. A small working area which is covered daily helps make the waste less accessible to pests and vermin.
Research and expert opinion indicate that many existing landfills either do not meet the above conditions or have reached their full capacity. Therefore, the construction of new sanitary landfill was prescribed for all cities and the costs for the same were included in the method.
The cost of a sanitary landfill included both the fixed cost of site construction, denoted by CInfra, and operation cost in year i, denoted by . The fixed cost component was estimated as the amount of additional sanitary landfill capacity in tons that cities would need to build, based on the projected waste generation from 2019 to 2030.
Area for landfill development was not calculated by city. Rather, the waste generated by all cities was pooled to determine the total landfill capacity required. This is because cities often share landfills for waste disposal, which is particularly common with small and medium-sized cities. Megacities, on the other hand, may have several landfill sites dedicated to one city.
The operating cost of landfills was calculated using an operating cost per ton estimate from other similar sanitary landfill projects within the country.
Collection and Transportation
The cost of safe collection and transportation of waste from source to disposal site was calculated using the following formula:
Assumptions Made
For the purpose of this study, the following assumptions were made in calculating the estimated cost of solid waste management:
First, while some cities have alternative waste disposal methods (e.g., incineration, recycling, or composting), which can be more environmentally friendly or energy efficient, this method aimed to establish a baseline cost, as many countries either cannot afford advanced technology or do not have adequate implementation capacity. Therefore, sanitary landfills were assumed to be sufficient to help cities sustainably dispose all of their solid waste in the most affordable way.
Second, adjustments by Purchasing Power Parity (PPP) and Consumer Price Indices (CPI) were assumed to be reasonable for translating costs between cities and countries.
Interlinkages With Other Thematic Areas
SDG 11 also specifies air quality as one of the indicators for urban waste management, which is not specifically included in this study. However, by switching from regular dumpsites to sanitary landfills, hazardous gases released from landfills will be contained to a minimal level, which will help advance urban air quality objectives.
Green and Public Spaces
Universal access to safe, inclusive, and accessible public spaces is crucial for maintaining a high quality of life and social cohesion in cities. These are also the key elements of urban public space that SDG 11 emphasizes cities need to ensure in their planning.
The approach adopted for this study to determine the cost of providing the baseline for public open space uses the public space per capita design standard from the US National Institute of Health (National Institute of Health, 2019) to determine how much space should be available in a city based on its population. For cities with open spaces less than the design standard, the cost of vacant land and the unit cost of development of a safe, inclusive and accessible public space from a best practice project were used to determine the total resource requirement.
Logical Explanations and Formulas
Annual need for public spaces was projected using population growth rates.
Then, the cost of providing public spaces was calculated using the following formula:
The cost of operating and maintaining these open spaces, along with any administrative costs were derived through benchmarking to similar costs recorded in a comparable city's budget document.
Assumptions Made
The first assumption is that the NIH standard for public space is valid in other countries, since basic human needs for green public space should not change across borders. Cost estimates of developing vacant land into safe, inclusive, and accessible green public spaces was also assumed to be transferable to other countries using PPP conversions.
Second assumption is that an equitable distribution of public spaces throughout the city will occur if a city has a planning department and a well-designed master plan. Therefore, by accounting for costs of an operational planning department and a master plan, public spaces would be distributed in a way that is accessible for all.
Interlinkages With Other Thematic Areas
Developing enough green open spaces would support cities in reducing their carbon footprint and improving ambient air quality. Green spaces provide much needed carbon sinks as well-acting as air purification systems. Therefore, part of the cost of improving urban air quality is implicit in the cost of creating sufficient and well-distributed green public spaces in cities.
Urban Governance and Planning
Targets 11A and 11B of SDG 11 emphasize the need to support positive economic, social, and environmental links between urban, peri-urban, and rural areas by strengthening national and regional development planning. They also require that cities implement urban and regional development plans that set forward integrated policies for inclusion, resource efficiency, mitigation and adaptation to climate change, and resilience to disasters.
A city's planning department typically undertakes long-term planning process through a series of consultations with technical experts, policy professionals, non-governmental organizations, civil society actors, and other relevant stakeholders. This process culminates in a 10- or 20-year plan for the city's sustainable growth and management. Without such planning, it would be increasingly difficult to guide urban development to be oriented toward ecological sustainability and equitable (Næss, 2001; Ahmadi and Toghyani, 2011; Slaev and Nedovic-Budic, 2016). This method mandates that every city should have a planning department and a master plan that ensures that development is integrated, comprehensive in its vision, sustainable, resource efficient, socio-economically inclusive, and just.
This requirement was included in the costing method based on recommendations gathered from a series of consultations with technical experts, chief planners, and urban managers. Without such administrative institutions, it would be difficult to achieve the implicit objectives of many dimensions of sustainable urban development. For instance, a city that has a large open space in its center may meet its adequate open space requirements, but this space may not be accessible to all its residents. A range of small, medium and large open spaces that are distributed uniformly throughout all neighborhoods is a better way to achieve both adequacy and accessibility attributes. This is something a planning department would ensure through better, inclusive urban design, planning and enforcement.
Standards on what an effective planning and urban governance institution for cities should look like are unclear. Therefore, a global best practice of urban planning was identified through expert consultations and research. For this study, the City of Medellin, Colombia was chosen as the city to benchmark planning and governance costs. Medellin is a well-managed city in Colombia, a fairly stable middle-income country. The city, part of the department of Antioquia, manages utilities, by EPS (Empresas Públicas de Medellin) providing revenues to finance social policies and local infrastructure, which offers the city's operations protection from political cycles. Soft and hard infrastructure are properly supplied, which makes Medellin an important benchmark as an intermediary city. The former Chief Town Planner of the City of Medellín, Colombia was interviewed to learn about their operating expenses and understand the city's baseline costs for planning and governance, which could be translated to other countries using cost transfer methods such as the use of Purchasing Power Parity (PPP). Medellín is widely considered a success story of proper governance and planning through strong local institutions transforming a city toward a sustainable future (Malandrino, 2017).
Nonetheless, in customization of this method to fit different country contexts in future work, this benchmark could be adjusted.
Logical Explanations and Formulas
The cost for governance and planning for cities was calculated as:
Where,
is the cost adjustment factor to translate costs in Medellin to different cities.
Assumptions Made
A planning department and a master plan do not guarantee successful implementation—other factors like corruption could pose additional challenges. These challenges were assumed to have no effect on the cost of achieving goal 11. The study also assumed that by benchmarking costs to the Medellin budget, cities would be able to recruit enough skilled technical personnel locally or attract skilled professionals from elsewhere that can run urban planning and governance activities effectively.
Interlinkages With Other Thematic Areas
Governance and planning are linked to all thematic areas.
Modeling Costs Across Four Countries: An Application of This Method
This method is a first attempt at identifying a pathway to systematically estimate the costs of achieving sustainable urban development. Such an approach is necessary to gain insights on critical questions facing countries such as: what are the key drivers of costs, what are the trade-offs among the key priority areas, and where to allocate resources such that development is inclusive, forward looking and feasible within budget constraints. A systematic approach to costing is also relevant to the international urban development community that can benefit from cross-country comparisons not only to track needs but also to support resource and technical assistance sharing.
As an early application, this method was used to model costs of achieving SDG 11 in four countries: Bolivia, India, Malaysia and Colombia. These countries were selected based on their different development statuses (i.e., Bolivia—low income; India, Malaysia, and Colombia—middle income) and region (i.e., Bolivia and Colombia—Latin America; India, and Malaysia—Asia). From a long list of low- and middle-income countries, a final selection criterion of data availability and ease of access was applied. The four selected countries had sufficient data availability in the form of official statistics, documented field projects and urban policy studies that enabled this costing estimation.
Among the four countries, data on key variables was compiled from a variety of domestic and global sources. All datasets on the 129 cities that were compiled and used for this preliminary analysis, their associated methodological notes, as well as the necessary metadata, are available on AidData's website. The results that emerged from this early application on average annual costs of a sustainable city are presented below (see: Table 2).
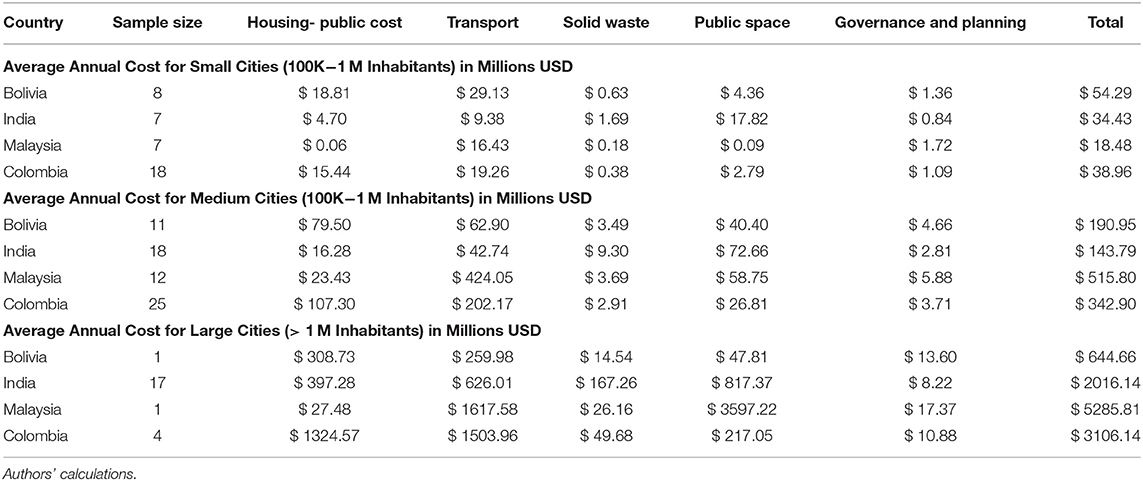
Table 2. Average yearly cost estimates by city size and SDG 11 category.
The first section of Table 2 presents the average annual cost for small cities, consisting of cities with <100,000 inhabitants. The total number of cities in this stratum were 40. In the second section of Table 2, results for the sampled medium sized cities, containing between 100,000 and 1,000,000 inhabitants, are presented. In this stratum, the total number of cities were 66. Finally, in the third section of Table 2, results for the large cities, containing over 1,000,000 inhabitants, are presented. For the third stratum, the total number of cities were 23. An important note about these strata is that we move cities from one stratum to another as their populations grow in the model between 2019 and the 2030 target year. For example, the data on El Alto's population growth rate in Bolivia informs our model of the city's growth from being medium-sized to a large city in 2024 (population > 1 million), thus impacting the estimation of average annual costs for large Bolivian cities from 2024 onward.
Comparing the data across these four countries allows us to make three initial observations. First, different countries will have different investment needs depending on their individual characteristics. Second, resource needs in different sectors vary significantly. Achieving SDG 11 objectives related to transportation and housing are typically the most resource intensive while solid waste management appears to pose a much lower cost barrier. And third, cost of land as an input is one of the greatest drivers of overall costs. For example, Kuala Lumpur stands out as a significant outlier among all sampled large cities at an estimated price tag of $5.29 billion per year. This is largely driven by the high cost of land required for the development of necessary amenities such as transportation networks and public spaces within the city.
But, comparing total costs across countries offers only a partial view. To be able to understand and compare costs across countries more comprehensively, these total costs need to be standardized to costs per capita.
Evaluating the preliminary results from the cost model on a per capita basis reveals two findings. First, average total costs per capita are similar for small cities, regardless of the country. As cities grow, these costs tend to become more dissimilar or grow farther apart. Figure 2 plots the average total cost per capita for all small, medium and large cities that were included in the study sample, and highlights the average total cost per capita for each country by city size. Future analyses might be able to offer better evidence on countries that are at greater risk of incurring higher development costs over time due to contextual factors and at what stages of urban growth are investments most critical to keep long-term costs low. Second, in three out of the four countries, the difference in this per capita cost is greater between small- and medium-sized cities than the difference between medium- and large-sized cities (see Table 3). This suggests that the benefits of scale on lowering costs are greater in cities that have more than 100,000 inhabitants.
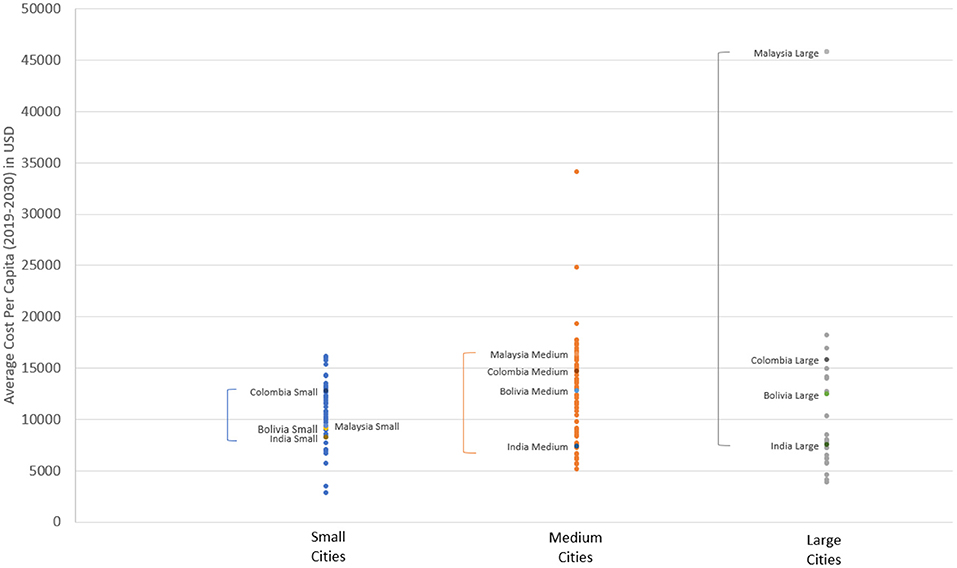
Figure 2. Distribution of the average total cost estimates per capita by city size. Big brackets visualize how similar or farther apart the average per capita costs are across countries. Source: Authors' calculations.

Table 3. Average total cost estimates per capita by city size.
While these observations are shared as an illustration of the potential insights such a systematic approach to costing could provide, it should be noted that this method has thus far only been applied on a limited sample, and the model's results are yet to undergo further statistical testing. Rather, this is a demonstration of how such a method can be useful for larger studies that would enable cross-country comparisons and support better understanding of development costs and enable efficient financial decision making. A future paper is underway that will present a more in-depth analysis of the gathered data and its implications for funding and policy, including insights from evaluating per capita costs by thematic area.
Conclusions
Recognizing the limits of current understanding of costs associated with achieving “sustainable cities and communities,” this research set forth an objective to propose a method that would provide a starting point for dialogues on the critical question of “how much is needed to achieve SDG 11 by 2030?” This method was created through a series of consultations with experts that are active in the sustainable urban development space, which also helped better define the scope and limitations of such a method. Applying the method on a small sample of four countries also illustrated the value proposition of such a systematic approach to modeling the cost of achieving SDG 11 by 2030.
Sustainability is a concept that is inherently difficult to quantify and standardize. However, by attempting to overcome this difficulty through this research, four key takeaways emerged. First, SDG 11 provides a framework with 10 targets. These targets, however, are neither comprehensive in capturing all aspects of urban sustainability, nor are they specific in what achievement might entail. Nonetheless, some of its dimensions are well-understood and have clear criteria of what a baseline level of urban performance should be. Safe, affordable and adequate housing for all is one such example where experts agree on a city's baseline performance.
Therefore, any costing exercise that takes the lens of SDG 11 and quantifies only those dimensions where a baseline can be established, such as the one discussed in this paper, will likely provide an underestimation of the true costs of cities pursuing sustainable development.
Even for such dimensions, the pathways to achievement are numerous. This study uses a combination of market-driven approach to housing supply and demand-side support to the poor via public subsidy in its proposed costing method as it was found most reasonable by consulted experts. But other models of housing provision exist, which might be better fits in different contexts. Future iterations of this method and its implementation may require substitutions using best proven models of development based on context.
Second, the baselines for least developed, developing and developed countries are very different. Desk research revealed that expenditures in developed countries such as Sweden were geared toward advanced sustainability objectives, such as bike lanes and digital infrastructure for smart cities. Meanwhile, least developed countries such as Cote d'Ivoire had no data to even begin to determine how big the gap in infrastructure, housing and services is that needs to be bridged by 2030. Therefore, different benchmarks for achievement would need to be established for developed countries who might already be sustainable if held to the baseline benchmarks applicable to developing countries.
Third, as this method is applied for determining costs, it is important to account for varying needs of cities of different sizes. This is not only due to different price levels of service delivery and infrastructure development, but also due to the varying rates of growth experienced by small, medium and large cities. Many cities will transition in size from small to medium or medium to large over the next decade. To maximize the benefits of “economies of scale” that sustainable urbanization offers in terms of dollars needed per capita to provide basic services, housing, transport etc., making strategic investments now in transitioning cities (those moving from small to medium and from medium to large) is essential.
Lastly, better understanding needs to be built around what achieving SDG 11's targets on “heritage and conservation” and “disaster risk resilience” might look like in reality. These concepts are crucial to consider when designing our cities to be sustainable and need to be adequately costed and included in budgeting and planning. However, without expert consensus on what benchmarks constitute achieving these targets, little can be done to mobilize enough resources in their pursuit.
Estimating the costs of achieving urban sustainability is not an exact science. SDG 11 targets are only a part of broader urban systems strengthening that are necessary, which includes investments into many other areas such as technology development, new partnerships, policy, legal and institutional reforms, and citizen empowerment. Further complexity to estimation is introduced by the “virtuous cycle” of timely investments in these broader areas as they increase the efficiency of services and stimulate the market, thereby offering future cost savings or the “vicious cycle” of untimely investments that increase future costs. Nonetheless, in this era of increased demand for smart, sustainable, resilient and efficient cities, understanding costs for achieving SDG 11 is a crucial exercise for informing and achieving the broader sustainability agenda, given that nearly 60% of our global population will be living in urban settings by 2030.
Data Availability Statement
The datasets presented in this study can be found in online repositories. The names of the repository/repositories and accession number(s) can be found below: https://www.aiddata.org/data/counting-the-costs-city-data.
Author Contributions
MP led the execution of project which included the development of the methodology, consultation with experts and creation of publication materials. MC supported the overall project, led the development of the solid waste component of the methodology, and managed the interns supporting data collection. MK conceived the project, established the need for a costing methodology, and secured seed funding from SIDA. RN provided general technical guidance and supported data efforts during project execution. All authors contributed to the article and approved the submitted version.
Funding
Swedish International Development Agency (SIDA) via UN-Habitat.
Conflict of Interest
The authors declare that the research was conducted in the absence of any commercial or financial relationships that could be construed as a potential conflict of interest.
Acknowledgments
Throughout the study, helpful feedback and guidance was received from Samantha Custer (AidData), for which the authors are extremely grateful. The authors also thank experts from the urban community who helped refine the thinking on how to develop this costing method and what constitutes a baseline scenario for SDG 11, including: Edgardo Bilski (UCLG), Maruxa Cardama (SLoCaT), Michael Sutcliffe (former municipal manager of eThekwini, South Africa), Steven Kenyon (National Treasury of Republic of South Africa), Billy Cobbett (Cities Alliance), Guenther Wehenpohl (GIZ), and Jorge Perez J. Aramillo (former Chief Town Planner of Medellin, Colombia). The authors are also grateful for inputs and technical support received from various experts at UN-Habitat, including: Graham Alabaster, Francesca Calisesi, Nao Takeuchi, Shipra Narang Suri, Stefanie Holzwarth, Jesus Salcedo, Andrew Rudd, Laura Petrella, Yele-Williams Oyekola, Roberto Herrera, Dennis Mwaniki, Daniella Di Filipo, Donatien Beguy and Hannes Berggren. Lastly, this study would not have been possible without the help of the following AidData research assistants: Suzanne Schadel, Moses Farley, Kaia Johnson, and Elizabeth Mitchell.
Supplementary Material
The Supplementary Material for this article can be found online at: https://www.frontiersin.org/articles/10.3389/frsc.2020.554728/full#supplementary-material
References
Ahmadi, F., and Toghyani, S. (2011). The role of urban planning in achieving sustainable urban development. OIDA Int. J. Sustainable Dev. 2, 23–26. Retrieved from: https://bit.ly/3onzpfV
Atlas of Urban Expansion (2016). Retrieved from: https://bit.ly/2lGAPa8 (accessed December 15, 2019).
Barnett, C., and Parnell, S. (2016) Ideas, implementation indicators: epistemologies of the post-2015 urban agenda. Environ. Urban. 28, 87–98. 10.1177/0956247815621473
Daniel, K. (2015). Goal 11-Cities Will Plan an Important Role in Achieving the SDGs. Vol. LI No. 4 2015. UN Chronicle.
FHWA (2013). Status of the Nation's Highways, Bridges, and Transit: Conditions and Performance. Chapter 2: System Characteristics. FHWA. Retrieved from: https://bit.ly/2YNf8Du
GIZ (2019). Sustainable Urban Transport: Avoid-Shift-Improve (A-S-I). Deutsche Gesellschaft fur Internationale Zusammenarbeit. Eschborn: GIZ. Retrieved from: https://bit.ly/2Vk1I48
Global Infrastructure Outlook (2017) Infrastructure Investment Needs 50 Countries 7 Sectors to 2040. Oxford Economics, Global Infrastructure Outlook.
Hutton, G., and Varughese, M. (2016). The Costs of Meeting the 2030 Sustainable Development Goal Targets on Drinking Water, Sanitation, and Hygiene. Washington, DC: World Bank Group.
Koch, F., and Krellenberg, K. (2018). How to Contextualize SDG 11? Looking at Indicators for Sustainable Urban Development in Germany. ISPRS Int. J. Geo-Inf. 7:464. doi: 10.3390/ijgi7120464
Letsara, N., and Saidi, S. (2013). The African Infrastructure Development Index. The Infrastructure Consortium for Africa.
Malandrino, C. (2017). On the ‘Medellin Miracle’ and the ‘Social Urbanism’ Model. Retrieved from: https://bit.ly/3iGHo50
McKinsey Global Institute (2016). Bridging Global Infrastructure Gaps. New York, NY: McKinsey & Company.
Næss, P. (2001). Urban planning and sustainable development. Eur. Plan. Stud. 9, 503–524. doi: 10.1080/09654310120049871
National Institute of Health (2019). Design Requirements Manual. Bethesda, MD: National Institute of Health. Retrieved from: https://bit.ly/2JZfsdd
OECD (2019a). Housing Costs Over Time. OECD Social Policy Division. Paris: OECD. Retrieved from: https://www.oecd.org/els/family/HC1-2-Housing-costs-over-income.pdf
OECD (2019b). Measuring Distance to the SDG Targets 2019: An Assessment of Where OECD Countries Stand. Paris: OECD Publishing
Ojo, A., Papachristodoulou, N., and Ibeh, S. (2018) The development of an infrastructure quality index for nigerian metropolitan areas using multivariate geo-statistical data fusion. Urban Science 2:59. 10.3390/urbansci2030059
Prakash, M., Cheng, M., Kamiya, M., and Schadel, S. (2020). Counting the Costs. Williamsburg, VA: College of William and Mary.
Schmidt-Traub, G. (2015). Investment Needs to Achieve the Sustainable Development Goals: Understanding the Billions and Trillions. Sustainable Development Solutions Network Working Paper Version 2, New York, NY.
Slaev, A., and Nedovic-Budic, Z. (2016) The challenges of implementing sustainable development: the case of Sofia's Master Plan. Sustainability 9:15. 10.3390/su9010015
Stenberg, K., Hanssen, O., Tan-Torres Edejer, T., Bertram, M., Brindley, C., and Meshreky, A. (2017) Financing transformative health systems towards achievement of the health sustainable development goals: a model for projected resource needs in 67 low-income middle-income countries. Lancet Global Health. 5, E875–E887. 10.1016/S2214-109X(17)30263-2
The World Bank (2006). Urban Bus Toolkit. Washington, DC: The World Bank. Retrieved from: https://bit.ly/33nnogW
Thurgood, M., Rushbrook, P., and Pugh, M. (2010). Decision-Maker's Guide to Solid Waste Landfills. Washington, DC: The World Bank Group. Retrieved from: https://bit.ly/2XwFtsf
Transport Research Board (2017). Transit Capacity and Quality of Service Manual, Third Edition. Washington, DC: Transport Research Board. Retrieved from: https://bit.ly/2GPtlJx
UN Habitat (2016). The Conference: The United Nations Conference on Housing and Sustainable Urban Development (Habitat III). New York, NY: United Nations Press.
UN Habitat (2018). DG 11 Synthesis Report 2018: Tracking progress towards Inclusive, Safe, Resilient and Sustainable Cities and Human Settlements. Nairobi: UN Habitat.
United Nations (2014). World Investment Report: Investing in the SDGs: An Action Plan. UNCTAD, New York and Geneva.
United Nations (2015a). 17 Goals to Transform Our World: United Nations Sustainable Development 2015; United Nations Press: New York, NY, USA.
United Nations (2015b). Addis Ababa Action Agenda of the Third International Conference on Financing for Development. New York, NY: United Nations Press. Retrieved from: https://bit.ly/2wAeQaU
Keywords: agenda 2030, goal 11, new urban agenda, costing, infrastructure, soft costs, hard costs, sustainable development goals–SDG
Citation: Prakash M, Kamiya M, Ndugwa R and Cheng M (2020) Counting the Costs: A Method for Evaluating the Cost of Achieving SDG 11. Front. Sustain. Cities 2:554728. doi: 10.3389/frsc.2020.554728
Received: 22 April 2020; Accepted: 25 November 2020;
Published: 23 December 2020.
Edited by:
James Evans, The University of Manchester, United KingdomReviewed by:
Robert Cowley, King's College London, United KingdomTathagata Chatterji, Xavier University, India
Copyright © 2020 Prakash, Kamiya, Ndugwa and Cheng. This is an open-access article distributed under the terms of the Creative Commons Attribution License (CC BY). The use, distribution or reproduction in other forums is permitted, provided the original author(s) and the copyright owner(s) are credited and that the original publication in this journal is cited, in accordance with accepted academic practice. No use, distribution or reproduction is permitted which does not comply with these terms.
*Correspondence: Mihir Prakash, bWloaXIucHJha2FzaEBnbWFpbC5jb20=; Marco Kamiya, bWFyY28ua2FtaXlhQHVuLm9yZw==