 Angel Hsu1,2*
 Tirthankar Chakraborty3
 Ryan Thomas4
 Diego Manya5
 Amy Weinfurter1Nicholas Jian Wei Chin1
 Nihit Goyal1
 Andrew Feierman6
- 1Department of Social Sciences, Yale-NUS College, Singapore, Singapore
- 2Department of Public Policy and Energy, Environment and Ecology (E3P), University of North Carolina at Chapel Hill, Chapel Hill, NC, United States
- 3School of Environment, Yale University, New Haven, CT, United States
- 4Department of Urban and Regional Planning, Cornell University, Ithaca, NY, United States
- 5Data-Driven EnviroLab, Singapore, Singapore
- 6Stockholm Environment Institute, Stockholm, Sweden
The Urban Environment and Social Inclusion Index (UESI) creates a new spatial framework to measure progress toward Sustainable Development Goal 11 (SDG-11). SDG-11 aims for cities to be both sustainable and inclusive by 2030 and conceptualizes this goal in spatially-explicit ways. Few data sources or indices, however, measure its progress in both a comprehensive (global coverage) and detailed (intra-city) manner. To address this gap, we use publicly-available datasets including detailed census data, satellite remote sensing, and crowdsourced data that provide global coverage and regular temporal resolution to develop spatially-explicit indicators to measure neighborhood-level environmental performance in 164 global cities. The UESI framework includes 10 indicators that assess air pollution, urban tree cover, public transit access, and urban heat at the neighborhood scale, and water stress and carbon dioxide emissions from fossil fuels at the city-level. We also present a new method for quantifying distributional equity to measure how evenly or unevenly cities are distributing environmental benefits and burdens across neighborhoods. We find that the majority of the UESI cities disproportionately burden lower-income communities with higher shares of environmental burdens and lower shares of environmental benefits. This finding holds true even in cities that perform highly on environmental indicators. In light of the challenging, rapidly evolving urban contexts, the UESI framework serves as a way of addressing some of the central challenges—data standardization, data gathering, and data localization—around the SDGs.
Introduction
Although the United Nations adopted the Sustainable Development Goals (SDGs) in 2015 and the New Urban Agenda (NUA) in 2016, little progress has been made in achieving targets for sustainable and inclusive urbanization. Part of the current failure to meet these goals is due to the challenge of measuring progress toward them. While around 234 SDG indicators impact cities or directly link to urban policies (United Nations Human Settlement Programme, 2018), scarce data exists for cities to track progress toward them. Few existing indicators and indices are well-matched for cities to adapt as tools or benchmarks, with even fewer addressing SDG-11's requirement for cities to be equitable and inclusive (Thomas et al., in press). These gaps reflect what Klopp and Petretta (2017) identify as the three main challenges of measuring progress toward SDG-11, including: (1) the poor availability of standardized, open, and comparable data; (2) the lack of strong data collection institutions to support monitoring at the city scale; and (3) “localization,” or the uptake and context-specific applications of the SDGs by diverse actors in widely different cities.
In many ways, these challenges are interlinked. The lack of standardized, open, and comparable data often stems from a lack of strong data institutions at the city scale. This challenge is particularly true in fast-growing, under-resourced cities in developing and emerging economies, where data is especially crucial in guiding planning and service provision decisions. Data gaps frequently reflect the mismatch between the costs of monitoring progress toward the SDGs and the “generally overstretched and under-resourced local authorities in most parts of the world,” even in wealthy, developed economies (Wong, 2006; Simon and Arfvidsson, 2015; Arfvidsson et al., 2017). Traditional data collection has often been driven by national statistical agencies, rather than from city-scale institutions, through household surveys that are frequently expensive to conduct, of uneven quality, prone to political manipulation, and overlook especially vulnerable and difficult-to-reach populations (Wong, 2006; United Nations Economic and Social Council, 2019). Where cities do collect data, the process of translating it into standardized metrics or indicators is often complicated by the need for coordination among different city agencies. Measuring progress toward SDG target 11.6, which aims to reduce urban waste, for instance, could require collaboration between one agency responsible for the collection and transportation of solid waste, and a separate agency responsible for treating it (Valencia et al., 2019).
This lack of local capacity makes it challenging to produce the new forms of data needed to measure progress toward the SDGs. At least 10 out of the 15 SDG-11 indicators require new monitoring approaches and tools for collecting, analyzing and using information (United Nations Human Settlement Programme, 2018), exacerbating these difficulties. For instance, Indicator 11.7.1 seeks to measure the “average share of the built-up area of cities that is open space for public use for all, by sex, age, and persons with disabilities,” requiring a combination of spatial data (to measure the extent of a cities' built-up area and its share of open space) and detailed data measuring public use of and access to open space. Since these indicators often require spatial or territorial analysis, new systems for reporting, and the collection and computation of data at the local level, they are challenging for even the most advanced countries to monitor (United Nations Human Settlement Programme, 2018). There is a risk that the capacity needed to develop monitoring frameworks, build technical and institutional capacity, and foster an enabling environment to generate reliable data could further limit and bias urban data collection toward better-resourced countries, creating data gaps in the lower-income cities where urban populations are expected to grow most rapidly (United Nations Human Settlement Programme, 2018). A reliance on proxies (United Nations Human Settlement Programme, 2018) or on global-scale data may fail to capture local conditions and intra-city differences, limiting these indicators' value to urban policymakers (Simon et al., 2016; Watson, 2016; Robin and Acuto, 2018; Valencia et al., 2019).
The challenges of localizing data can also inhibit efforts to measure global progress toward SDG-11. Cities often prioritize information most useful for local politics and administration, which can vary significantly from the data that is most useful for better understanding and characterizing urban sustainability. Cities often select and modify SDG indicators, or incorporate the SDG indicators into their existing monitoring programs according to their needs (Simon and Arfvidsson, 2015). This self-selection can create a tension between the indicators that are most useful and relevant to a city, and the data consistency needed to compare and aggregate progress toward global goals. One study piloting the proposed SDG-11 indicators across the cities of Bangalore, Cape Town, Gothenburg, Greater Manchester, and Kisumu found that each city struggled to access sufficient data to track the indicators, and all proposed changes to make the indicators more locally relevant (Simon and Arfvidsson, 2015), sacrificing comparability between cities' efforts to track progress toward SDG-11.
Variation in cities' data and data collection methods further inhibits city-to-city comparability in assessing SDG-11. For instance, while information about Vehicle Miles Traveled and public transit access is readily available for Atlanta, it is not readily accessible in Delhi (Boyer et al., 2015). Cities navigate the process of adapting indicators and data sources to local contexts not just with the SDGs, but also in their approaches to utilizing a complex array of urban indicators and smart city and data information (Hezri and Hasan, 2004; Hollands, 2008; Klopp and Petretta, 2017). Thomas et al. (in press) assessed 40 urban sustainability indices and 484 indicators, finding 37 separate indicators monitoring urban waste management and very few spatially-explicit measures that would allow for cities to assess SDG-11's equity-related indicators (e.g., ensuring equal access to green space). Despite a proliferation of indices and data sources, comparable measures of cities' progress toward sustainable development milestones remain elusive. Even the definition of what defines “urban” areas or the “city” vary considerably across different municipalities, countries, indices, and analyses, adding uncertainty to the comparison of indicators (United Nations Human Settlement Programme, 2018).
To address the shortcomings in existing urban environmental sustainability indexes and indicators, we introduce the Urban Environment and Social Inclusion Index (UESI), a new spatial framework that measures more than 160 cities' progress toward SDG-11's goal to “make cities and human settlements inclusive, safe, resilient, and sustainable.” The Index defines social inclusion according to SDG-11's charge for urban areas to be “sustainable and inclusive,” ensuring equal access to sustainable transit, green space, and reducing impacts of pollution for all citizens. It measures the distributional equity of the environmental indicators as an enabling condition for efforts to facilitate greater social inclusion across global cities.
The UESI includes spatially-explicit indicators to measure neighborhood-level environmental performance in the following issue categories: air pollution, urban tree cover, public transit access, and Urban Heat Island. At the city-level, we include indicators for water stress and climate mitigation. We also present a new method for quantifying distributional equity to determine how evenly or unevenly environmental benefits and burdens are distributed across urban neighborhoods. We use publicly-available spatial datasets that provide global coverage and regular temporal resolution to allow for consistent measurement and comparability between cities. While these data are not without their own uncertainties, they provide a first step in addressing some of the challenges—data collection, standardization and localization—toward tracking progress toward the SDGs.
This paper is organized as follows: a methods and materials section describes the methodology informing the UESI; a results section describes the UESI's key findings; and the discussion section describes the UESI's applicability to the challenges around urban sustainability data collection and monitoring.
Materials and Methods
This section describes the methods that inform the UESI, including: (1) defining social inclusion through a lens of distribution equity; (2) boundary definitions; (3) city selection; (4) indicator selection; (5) indicator computation; and (6) measuring distributional equity through an Environmental Concentration Index.
Developing a Spatially-Explicit Measure of Distributional Equity
While SDG-11 aims to establish a goal for cities to be “inclusive” as well as “sustainable,” it- as well as other SDGs that reference inclusivity- does not articulate a concrete definition for what inclusivity means. Many SDG-11 targets, however, highlight the importance of measuring performance across demographic groups (see Table 2). Targets 11.1, 11.2, and 11.7 aim to “ensure” or “provide” access to housing, public transport, and urban green spaces, across demographic categories “with special attention to the needs of those in vulnerable situations,” (Target 11.2) such as “women and children, older persons and persons with disabilities” (Target 11.7). Target 11.B connects urban climate action and inclusion. Inclusion, in other words, is often measured through the lens of equity, and focus in particular on distributional or outcome-based equity, which Reckien et al. (2017) define as “the consequences of a policy, action or developmental trend [e.g., equity in the distribution of costs and benefits or in privileges and burdens between women and men, between households, between urban districts (including peri-urban districts), or between generations of urban residents].” Gellers and Cheatham (2018), in a review of all 169 SDG targets found that one-third resonate with distributive justice.
We adopt this framework of distributional equity to quantify the “inclusivity” dimension of cities' progress toward SDG-11's environmental targets. While this approach to assess distributional equity has its roots in the United States' environmental justice movement (Schlosberg, 2004; Walker, 2009), we made an intentional decision to use the term “social inclusion,” as opposed to “environmental justice,” for several reasons. Because “environmental justice” originated in the U.S. and the Global North, the term has specific connotations and interpretations, particularly with regards to race and ethnicity. When we initially scoped our indicator framework with several dozen experts, practitioners, and stakeholders, the feedback we received, particularly from colleagues outside of a North American context, was to avoid the explicit use of “environmental justice” because of its potential colonialist (see Agyeman and Evans, 2004; Álvarez and Coolsaet, 2020) interpretation, where scholars have been criticized for inappropriately transposing Western ideas and interpretations of “environmental justice” in the global South. Because we aimed for the index to be as inclusive and accepted as broadly as possible, particularly outside of Western contexts, we intentionally avoided this term to prevent alienating global audiences that may view “environmental justice” as a U.S.-specific issue without relevance or meaning for them. Adapting SDG-11's use of “inclusion,” therefore, which has been adopted by the UN SDGs and national governments, we were seeking to be inclusive ourselves.
Because social inclusion entails many dimensions (e.g., representation in decision-making processes, identified in SDG-11 Target 11.3), several of which we are unable to adequately quantify at this point of time, we acknowledge that the UESI is still narrowly limited in its primary interpretation of social inclusion as one of distributional equity. However, sacrificing depth for breadth and global comparability, our approach allows for tracking global progress toward SDG-11's environmental targets with an explicit distributional equity component. We do not claim to be comprehensive in being able to measure all of SDG-11's targets and multiple dimensions of “inclusivity;” rather, we aim to provide a starting point for cities to benchmark and track performance over time using globally consistent, available data that are comparable between contexts.
Boundary Definitions
To develop a consistent indicator framework and indicators that compare cities' performance on SDG-11, a common definition of what constitutes the physical boundaries of a “city” or “urban area” is necessary. A few common definitions of urban boundaries exist in the literature (Seto et al., 2014, p. 930): (1) administrative boundaries, which are generally political or territorial boundaries defined by governments; (2) functional boundaries, defined as “connections or interactions between areas, such as economic activity, per capita income or commuting zone”; and (3) morphological boundaries delineated from the structure or form of the built environment, land use, or land cover.
Because the UESI's primary audience is policymakers, we use administrative boundaries for neighborhoods and the urban boundary defined by the governments themselves (see Supplementary Figure 5 for a comparison of political/administrative boundaries as used in the UESI vs. morphological boundaries, which are primarily used in remote sensing analyses). How governments define neighborhoods themselves also varies and has implications for comparing environmental performance between and across neighborhoods. Neighborhood sizes vary considerably between cities (see Supplementary Figure 6). Beijing, along with other Asian cities for example, has much larger than average-sized neighborhoods (1024.76 ± 76 km2 compared to 28.26 ± 21 km2 average neighborhood size for other cities; See Supplementary Figure 7). We acknowledge that there are differences in how cities define a “neighborhood” and that the multitude of definitions have implications for spatial analysis (Spielman and Logan, 2012). In the UESI, we define “neighborhood” to mean a sub-urban administratively defined unit within a city containing roughly similar populations (see Supplementary Figure 1) and similar areas. Shapefiles of the metropolitan area are used to disaggregate data at the neighborhood level. These shapefiles may come from the cities themselves or from other online data repositories. In some cases, data that are more granular than the neighborhood scale (e.g., block-level) are available, but to be as consistent as possible across cities, we selected for similar levels of neighborhood aggregation.
We filtered out neighborhoods from our analysis that are primarily “non-urban” and could skew the comparison and interpretation of the results. In some cities, administratively-defined urban boundaries do not exclusively include urban areas (e.g., built environments with a density of population) but include sparsely populated rural sections or conservation areas. A city like Beijing, for example, which includes peri-urban areas in its city boundary, may have lower public transit scores and higher tree cover scores than a city that has municipal boundaries that are closer to a city's central districts. The filtering process was conducted based on a combination of land-cover (e.g., urban vs. non-urban cover as determined through satellite land cover classification), population and income to identify primarily non-urban neighborhoods. In total we filtered 23 neighborhoods from UESI cities that included Las Vegas, Oslo, Panama City, and Salt Lake City.
City Selection
We evaluate 164 cities from all continents (excluding Antarctica) that contain over 11,278 neighborhoods. We include a range of cities located in developing and developed countries, levels of development (see Supplementary Figure 2) a mix of capital and non-capital cities, and cities representing a range of different population sizes. We also include a range of “global cities” (Sassen, 2010) and second-tier cities (i.e., non-state capital or major cities in the United States) to represent a diversity of cities around the world. For some countries, particularly in Latin America, the Middle East, and Sub-Saharan Africa, data availability poses the largest limiting factor for city inclusion. Figure 1 summarizes the location and population size of the cities included in the UESI.
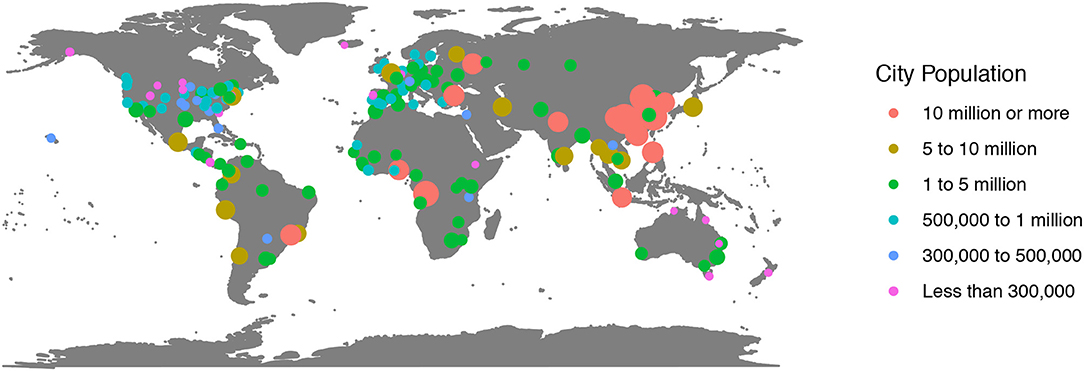
Figure 1. UESI cities by population size.
To be included in the UESI, the following data are needed: (1) georeferenced shapefile of the city's neighborhoods; (2) recent neighborhood-level population data for the city; and (3) recent income per capita data in local currency (and/or US dollar) at the neighborhood level. This data was collected for as many cities as possible through desk research of publicly available data sources (e.g., census or city open data portals) and expert consultation. In some cities, neighborhood-level income data was not available. If census or statistical data for income is unavailable, we use a globally generated dataset of Gross Domestic Product (GDP) data (Kummu et al., 2018) as a proxy for neighborhood-level income. While not equivalent, both measures—income and productivity—reflect an aspect of the wealth that is distributed across cities. We classify cities as Tier 1 (neighborhood-level income per capita data is available) and Tier II (GDP per capita data from Kummu et al. (2018) is used as a proxy for neighborhood-level income per capita data). Cities' categorization is listed in the data available for download at datadrivenlab.org/urban.
A comparison of the Tier I and Tier II data sources for income (see Supplementary Figures 3, 4) suggests that there is no consistent relationship between cities' census-derived income per capita and GDP per capita data from Kummu et al. (2018). While we find no systematic bias between the census- and satellite-derived proxies for income, the lack of consistent association suggests that the results for the Tier II cities have higher uncertainty, which can be reduced when census data become available.
Indicator Selection
Several principles guided the selection of indicators for the UESI. Since the Index's goal was to enable policymakers to assess progress toward SDG-11, the indicators and framework align with the targets and indicators articulated by SDG-11, as well as other relevant SDGs, to the extent possible given existing data sources. Table 1 maps the linkages between the SDG targets and indicators and the UESI indicators. In addition to these environmental indicators, the UESI also includes indicators that measure distributional equity (the Environmental Concentration Index and Gini Coefficient, described in greater detail in the Developing a spatially-explicit measure of distributional equity section), for spatially-explicit indicators with data available at the neighborhood scale.
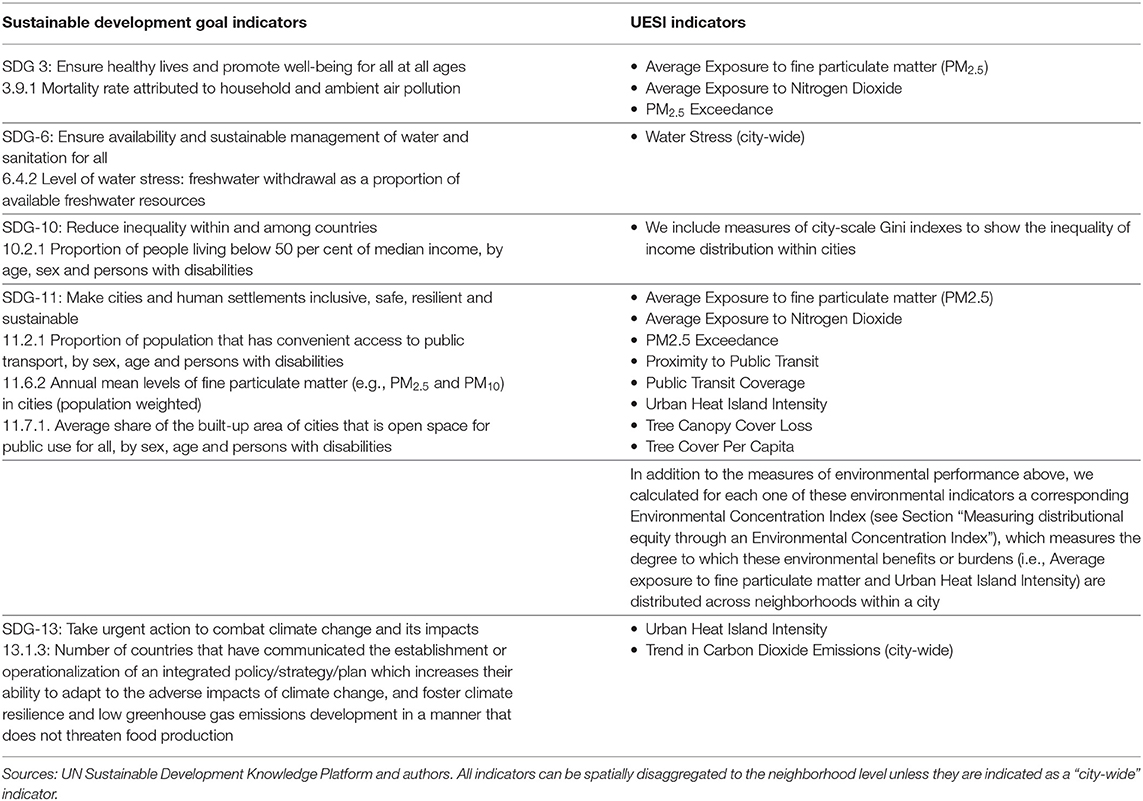
Table 1. Mapping the UESI's indicators according to related Sustainable Development Goal targets and indicators.
Indicator selection also aimed to complement existing urban environmental sustainability indicators (Thomas et al., in press) Based on this review, we adopted the following principles to guide our selection of data and indicators to include in the UESI:
1) Fill the gaps in existing tools and indicators to measure progress toward SDG-11 and the other SDGs.
2) Because people do not experience cities uni-dimensionally, incorporate spatially explicit data as much as possible, to examine patterns, trends, and differences in environmental performance within and between urban areas.
3) Spatially explicit data also enables the UESI's analysis and focus on the socioeconomic drivers and distribution of environmental performance.
4) The UESI measures outcomes, rather than process, where possible, to enable urban stakeholders to identify and address how environmental performance varies across different urban locations.
5) Select transparent and reproducible datasets, methodologies, frameworks, and indicators, in order to ensure transparency and enable individuals and institutions to access or adapt the UESI's approach to their own research or policy questions.
These principles guided the creation of a preliminary list of UESI issue areas and indicators. We conducted an expert peer review process with stakeholders including academic researchers, urban planners, practitioners, and city representatives, to identify the most salient urban environmental issues that city planners and managers aim to track. Based on their feedback, these issue areas and indicators were further iterated, and included in the UESI based on data coverage and availability. Table 2 summarizes the indicators, definitions, and targets. More detailed descriptions of the data sources and methodology underlying each indicator are available in the Supplementary Materials and online at datadrivenlab.org/urban.
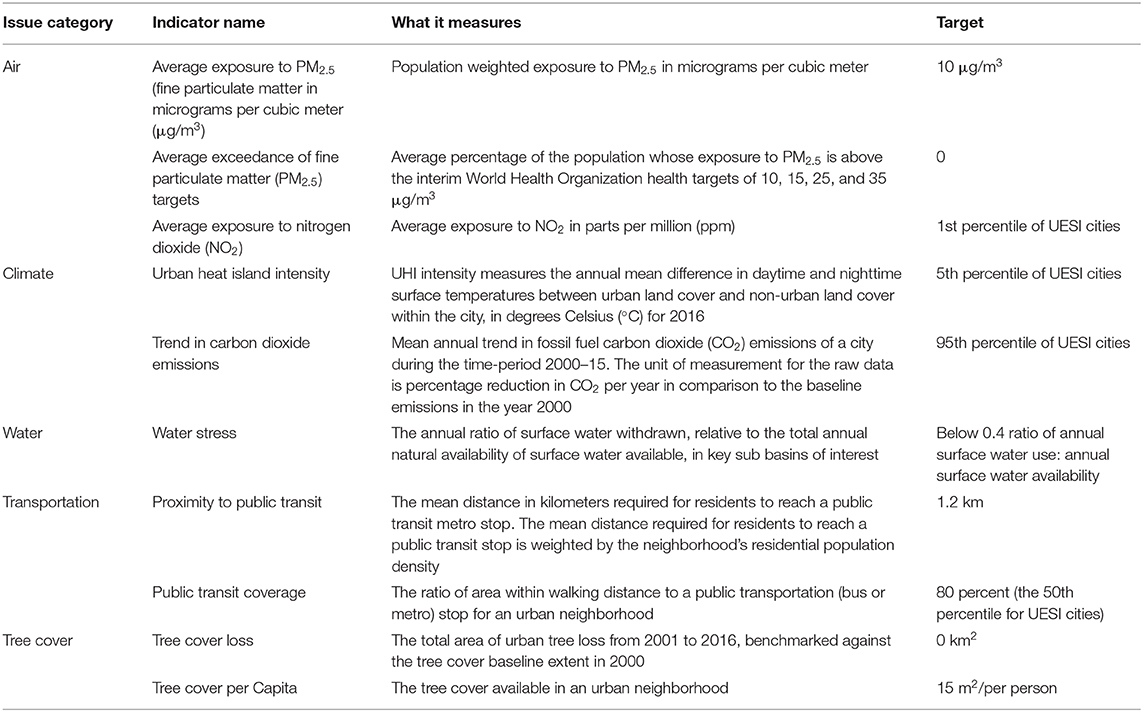
Table 2. Summary of UESI environmental indicators, definitions, and targets.
Indicator Computation
The spatially-explicit indicators were calculated using Google Earth Engine, a cloud-computing platform for global scale geospatial analysis (Gorelick et al., 2017). This platform enabled us to leverage Google's computational capacity to process global data, and create a replicable workflow for incorporating additional cities in the future.
Indicators are shown in multiple formats on the UESI's online platform (datadrivenlab.org/urban). The platform shares both raw values in native units to provide a detailed view of each neighborhood's and city's performance, and values that are normalized using a “proximity-to-target” method where 0 indicates the low performance benchmark and 100 indicates achievement of the target. The proximity-to-target method measures how close or far neighborhoods and cities are to achieving an identified target, such as high performance benchmarks set by national or international policy goals or established scientific thresholds. In cases where a clear policy benchmark is absent, a high-performance benchmark is determined through an analysis of the best-performing neighborhoods or cities (e.g., the 95th percentile of the range of data). For more details about the targets for each indicator, see the UESI's online platform (datadrivenlab.org/urban) or the Supplementary Materials.
The proximity-to-target values are intended to facilitate the comparison of city and neighborhoods' performance across different indicators. They are not intended to rank or score cities, which often define their administrative boundaries in dramatically different ways, face different kinds of challenges (e.g., population expansion vs. population reduction; the challenges of infrastructure creation vs. the challenges of the high-emitting modes locked-in by pre-existing infrastructure), and have access to varying financial and technical resources.
Measuring Distributional Equity Through an Environmental Concentration Index
The UESI measures how environmental burdens vary across neighborhoods of different income and population levels within cities to capture if and how environmental performance varies according to where residents live and how much income they earn. While many factors, including age, gender, employment, education level, and minority/ethnicity status, can also contribute to social vulnerability and affect distributional equity, scarce data is available to comprehensively measure, across global cities, and granularly, at the neighborhood level (Data-Driven EnviroLab, 2020). To assess distributional equity, we draw on the existing literature and tools analyzing the distribution of environmental and socioeconomic outcomes (Padilla and Serrano, 2006; Cantore and Padilla, 2007; Groot, 2010; Maguire and Sheriff, 2011a,b; Sheriff and Maguire, 2013), and develop both numeric and graphical representations of the distribution of income and environmental outcomes.
Based on this environmental inequality literature (Maguire and Sheriff, 2011a,b; Sheriff and Maguire, 2013), our primary methodological innovation is the estimation of distributional equity in urban environmental burdens and benefits through what we refer to as an Environmental Concentration Index or ECI. The ECI is a summary measure of the distribution of environmental benefits (i.e., sustainable transit access or tree cover) or burdens (i.e., air pollution or urban heat island intensity) across neighborhoods within a city. Like a Gini coefficient, which measures income inequality within a population (Springer-Verlag, 2008), we calculate the ECI as a summary measure of the inequality in the distribution of the positive/negative environmental incomes across neighborhoods within each city for each of our five spatially-explicit indicators. For example, we not only measure UHI intensity by neighborhood, we also measure its distribution across neighborhoods according to income to develop a UHI Environmental Concentration Index. The determination of income distribution within cities through a Gini coefficient then allows us to compare how environmental indicators may be more or less equally distributed compared to income within each city.
Specifically, the ECI and Gini coefficients are determined by calculating the area under Lorenz curves (Lorenz, 1905) for income distribution or concentration curves (Wagstaff et al., 1991) for environmental outcomes, as ordered by per capita income in each neighborhood. The curves display the cumulative proportion of a variable of interest (either income or an environmental outcome), accruing to a cumulative population percentile ranked from worst off (lowest per capita income) to best off (highest per capita income). A 45 degree “line of perfect equity” represents a completely equal distribution between the variable of interest (e.g., income or environmental burden) and the cumulative population. A greater distance from this 45 degree line represents a more unequal distribution of the variable in question. Concentration curves above this 45-degree line indicate that the environmental variable is more heavily allocated to those lower income, while curves below this line indicate that the variable is more heavily allocated to those with a higher income (see Figure 2).
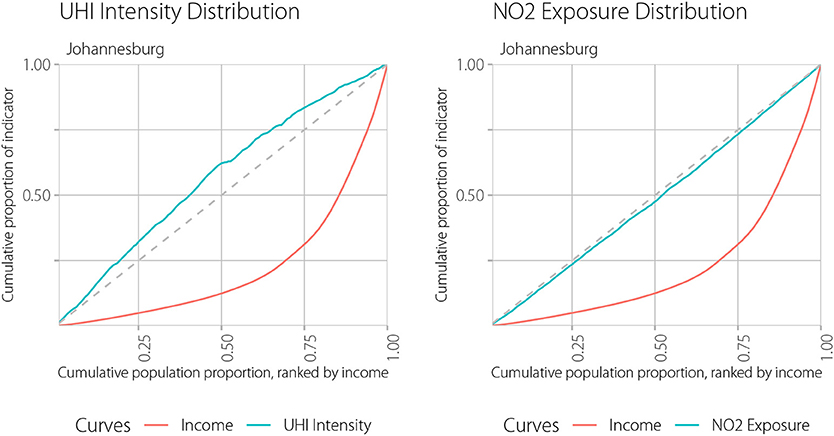
Figure 2. Example of the distribution of the Lorenz Curve (Red), measuring income, and the UHI Intensity and NO2 Exposure Concentration Curves (Blue) for the city of Johannesburg. The UHI Exposure Concentration Curve's position above the 45° line of perfect equity indicates that UHI Intensity is concentrated in the low-income populations in the city. By contrast, the NO2 Concentration Curve suggests that NO2 exposure is only slightly more concentrated in high-income populations, since it is still within a marginal distance from the line of perfect equity. The Lorenz Curve indicates that there is an important inequality in the distribution of income, due to the distance of the curve from the 45° line of perfect equity.
The ECI and Gini coefficients are then determined by measuring the area between the 45-degree line of perfect equity and the Lorenz and concentration curves, respectively:
1) ECI = 1- 2*AUCenv
2) Gini = 1- 2*AUCinc
The concentration index value can range from−1 (i.e, the environmental burden is allocated to the poorest) to 1 (i.e., the environmental burden is allocated to the wealthiest) (Maguire and Sheriff, 2011b). The Gini coefficient, which is calculated by applying the same formula to the Lorenz curve (Equation 2), ranges from zero to 1, with a higher value indicating a less equal distribution.
Since concentration curves require positive values of the environmental variables, we normalize environmental indicators to have a minimum value of zero. We also distinguish between “positive” and “negative” environmental outcomes to indicate whether the indicator is a benefit or burden. For example, if the concentration curve for Tree Cover is below the line of equity, we interpret it to mean that wealthier populations within the city have greater access to tree cover. For the other indicators that are negative environmental outcomes, such as air quality, UHI, or distance to public transit, the interpretation of the environmental concentration curve below the line of equity would mean wealthier populations are burdened by the indicator. The specific interpretations of the concentration curves for different indicators follow below:
• PM2.5 Equity: Cumulative proportion of total exposure to fine particulate matter (PM2.5) concentration for the entire population (Negative Environmental Outcome)
• NO2 Equity: Cumulative proportion of total exposure to nitrogen dioxide (NO2) concentration for the entire population (Negative Environmental Outcome)
• UHI Equity: Cumulative proportion of total exposure to urban heat island (UHI) Intensity for the entire population (Negative Environmental Outcome)
• Tree Cover Equity: Cumulative proportion of the total Tree Cover per capita for the entire population (Positive Environmental Outcome)
• Distance to Public Transit Equity: Cumulative proportion of total distance to nearest public transportation station for the entire population (Negative Environmental Outcome).
Together, these measures assess how equally income and an environmental outcome are distributed within a city. We developed this approach to quantifying equity because existing examples of quantitative metrics assessing environmental outcomes, including Padilla and Serrano's (2006) use of the Kakwani Index, and the Atkinson and Kolm-Pollack inequality indices (Maguire and Sheriff, 2011a), are more challenging in their interpretation and can be challenging for decision-makers to make sense of. Concentration indices calculated from the “area under the curve” is more straightforward and an accepted strategy for measuring inequality, particularly around health-related outcomes (Kakwani et al., 1997; Elgar et al., 2016; Oakes and Kaufman, 2017; Costa-Font et al., 2018).
Results
Overall Findings
We find that cities are not distributing environmental burdens and benefits equally among urban residents. In the majority of UESI cities−95 out of 164 or 58 percent—lower-income neighborhoods bear a disproportionate share of environmental burdens: poor air quality, greater exposure to urban heat, and a lack of access to tree cover and public transit. Figure 3 illustrates this relationship between environmental performance on the UESI's five spatially-explicit indicators and their equity counterparts. Cities toward the top of Figure 3 perform better on environmental issues, while cities toward the bottom of the chart perform more poorly. Along the horizontal axis, the farther away cities are from the center of the figure, the more unequally environmental burdens are distributed. In cities toward the right-hand side of the figure, wealthier neighborhoods are more heavily burdened, while in cities toward the left-hand side of the figure, poorer neighborhoods are more heavily burdened. Most cities (95 or 58 percent) fall into the two left-hand quadrants of the figure, which indicate cities whose environmental burdens are concentrated in less wealthy neighborhoods. This is the case even for the 66 cities in the upper left-hand quadrant of the figure, including Seattle, WA, Melbourne, and Copenhagen: they score above average on the environmental indicators, but their position in the upper left-hand quadrant indicates that a disproportionate share of environmental benefits flow to wealthier communities. This result suggests that strong environmental performance and equity are not necessarily connected: better environmental performance does not necessarily lead to a more equitable environment.
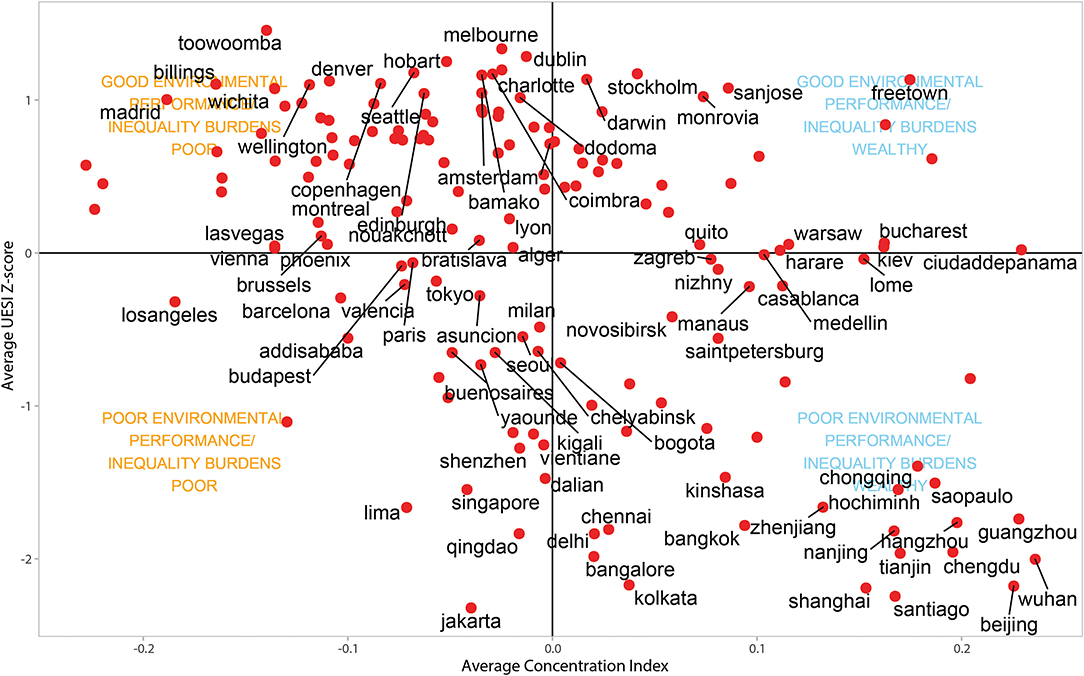
Figure 3. A four-quadrant plot examining the relationship between environmental performance (measured by average z-score of a city's performance on the five spatially-explicit indicators) and equity (measured by average environmental concentration index values on the five spatially-explicit indicators).
In some cities, particularly those in major emerging economies like China and India, wealthier populations are burdened with environmental pollution, as indicated by their position in the bottom right-hand quadrant. For these 39 cities, mostly located in rapidly developing and urbanizing countries, wealthier populations are often concentrated in denser or more centrally located neighborhoods, as opposed to poorer populations that tend to be located in more rural areas on the outskirts of cities. For instance, a cluster of Chinese cities in the lower right-hand quadrant may reflect wealthy residents' preference to reside in or near central business districts, which often have higher levels of air pollution in addition to greater access to employment and education opportunities and other urban amenities. These cities all score poorly on PM2.5 and NO2 indicators, receiving proximity-to-target scores <20, and in some cases, at or near zero, despite stronger scores on other metrics.
The upper right-hand quadrant, which captures cities that both perform well on environmental indicators and do not burden lower-income neighborhoods with environmental pollution, includes just 12 percent (24 cities) of all cities. These cities span a range of different geographies: European and African cities (seven cities in each region) are most common in this quadrant, followed by North American cities (four cities), South American cities (three cities), and cities located in Oceania (two cities), and Asia (one city). They also include a wide range of different population sizes and densities, although these results reflect a range of different approaches to defining municipal administrative boundaries. The cities in this quadrant include Darwin, Australia, with a population of just over 100,000, as well as London, with 8.8 million people. No megacities (defined as urban areas with over 10 million people) are included in this quadrant. The mean and median population (1.7 million; 1.2 million) and population density (4,977 people/km2; 4,833 people/km2) for the 24 cities in this quadrant do not vary widely from the mean and median population (3.4 million; 1.4 million) and population density (4,818 people/km2; 3,637 people/km2) values for all 164 UESI cities. Seventeen of the cities in this quadrant are Tier II cities, whose neighborhood-level income data was extracted from spatial GDP per capita data (Kummu et al., 2018), rather than from census-level data.
Trends Across Indicators
Cities' average performance on individual environmental indicators varies widely (see Figure 4). The PM2.5 air quality indicator reveals that 86 percent of people living in UESI cities breathe air that does not meet the World Health Organization's (WHO) guidelines for safe exposure to fine particulate pollution, indicating low overall performance. However, 57 cities, including Oslo, Vancouver, Wellington, Anchorage, and Portland, achieve the WHO thresholds across all of the neighborhoods within their administrative boundaries. In terms of Proximity to Public Transit, Athens, Barcelona, Lisbon, San Francisco, and Paris have neighborhoods with an average walking distance of <200 meters, while cities such as Chongqing, Dalian, Maputo, or Houston require residents to walk an average distance of 5 kilometers (just over three miles) to reach a public transit station. The Water Stress indicator also encompasses a wide range of scores; while the majority of cities rely on sources that are not stressed (and therefore score 100 on the proximity to target calculations), many rely on water supplies that are overextended. Cities' performance on Urban Heat Island Intensity and Tree Cover show less range in terms of cities' performance, and cities score particularly well on the Tree Cover per Capita indicator, with many exceeding the UN Habitat's goal of 15 square meters per capita goal (United Nations Human Settlement Programme, 2016).
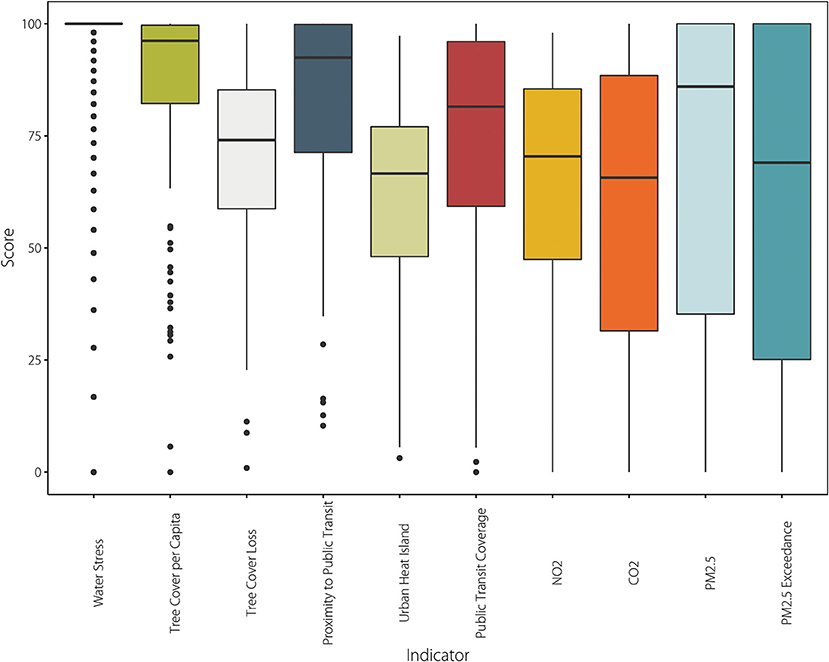
Figure 4. Summary proximity-to-target scores for environmental metrics captured by the UESI.
The trends in fossil fuel CO2 emissions show wide variation at the city-level. The cities with highest mean annual percentage reduction in CO2 emissions during 2000–15 in comparison to the baseline emissions in the 2000 are Athens (2.8%), Paris (2.2%), Reykjavik (1.6%), Porto (2.0%), and London (1.3%). These cities, therefore, score close to 100 on this indicator. At the other end of the spectrum, cities such as Kabul (47%), Luanda (46.7%), Chengdu (21.4%), Shanghai (20.7%), and Phnom Penh (19.6%) witnessed the highest mean annual percentage increase in CO2 emissions during this period and score close to 0 on this indicator. Cities that had approximately the same absolute emissions in 2015 as in 2000—such as Houston, Phoenix, Tokyo, and Kiev—scored about 75 on this indicator.
Regional trends also appear across several issue areas. On public transport, for instance, Tokyo, Porto, and Paris emerge as leaders, while U.S. and Chinese cities account for a large share of the 10 bottom-scoring cities. In terms of air quality, several cities in the South Pacific (Hobart, Toowoomba, and Cairns in Australia, and Wellington in New Zealand) are top performers; while developing country cities such as New Delhi and several cities in China (Tianjin, Zhenjiang, and Shanghai) dominate the bottom rung. North American cities tend to perform well on tree cover, particularly the Canadian cities of Toronto and Vancouver and the US cities of Milwaukee and Portland. In the case of CO2 emissions, European cities had the highest reduction in emissions during 2000–15, while Asian cities, especially in China and India, had the highest increase in emissions during this period.
Overall, however, the picture of environmental performance is sobering. Less than half of UESI cities (72 cities) have average access to public transit within walking distance (1.2 kilometers or 0.75 miles, the distance an average city resident is willing to walk to a metro stop). In just 35 cities, residents are within walking distance of a public transit station no matter what neighborhood they find themselves in. For most other cities, access to public transit varies dramatically across different parts of the city. Nearly a quarter of UESI cities are water stressed, relying on overextended water supplies. The UESI cities with the greatest level of demand on their water supply include the U.S. city of Charlotte; the Indian cities of Kolkata and Chennai; Fortaleza, Brazil; Santiago, Chile; and Tel Aviv, Israel, each of which relies on water sources where almost the entire available water supply is withdrawn each year for urban, agricultural, and industry use. Similarly, 106 of the 169 UESI cities witnessed an increase in carbon dioxide emissions during 2000–15. UESI cities also lost over 3,340 square kilometers of urban tree cover from 2001 to 2016—an area more than four times the size of New York City. Cities in developing countries, such as Tunis, Phnom Penh, Vientiane, and Casablanca, have some of the lowest scores, which may reflect their rapid growth, as vegetated areas are converted into new developments and infrastructure.
Comparing Income and Environmental Performance
Across all of the indicators, we find that wealthier cities receive higher-than-average scores on environmental indicators, compared to lower-income cities. Figure 5 compares cities' z-scores of neighborhood income with their z-scores of average performance on UESI indicators. We find that most of the cities in the upper right-hand quadrant—representing above-average income and above-average scores on environmental indicators—are located in North America or Europe, with just one exception: Tel Aviv. Higher-than-average income, however, does not automatically translate into stronger environmental performance: North American and European cities also make up the majority of cities scoring below-average in terms of their environmental performance, despite higher-than-average income (represented in Figure 5's lower right-hand quadrant). Cities in developing countries, including Kinshasa, Lima, Beijing, Bangkok, Jakarta, and Buenos Aires, dominate the lower left-hand quadrant, where both UESI scores and income levels are on average lower, with a particularly strong representation of Asian cities. While these findings align with others (Hsu et al., 2016; European Environmental Agency, 2018) that track a positive relationship between income levels and environmental performance, some outliers—such as the African cities of Freetown and Bamako—perform higher than their economic development levels would suggest.
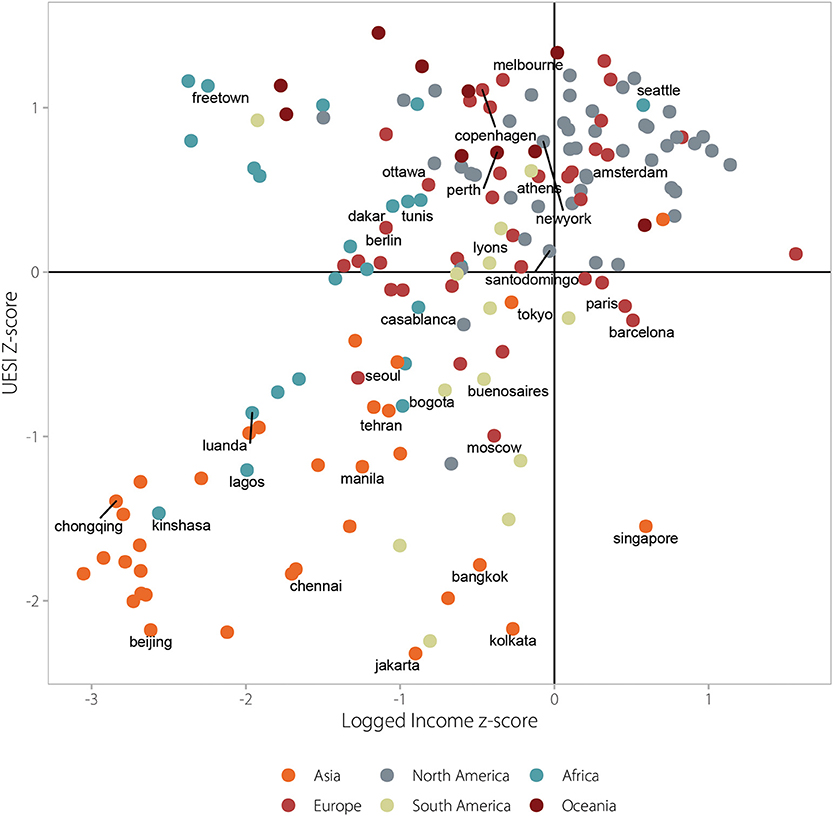
Figure 5. A four-quadrant plot examining the relationship between environmental performance (measured by average z-score of cities' performance on all UESI indicators) and a z-score of logged income across all city neighborhoods.
Typologies of Performance
To better understand similarities and differences between cities' performance on SDG-11's environmental indicators, we conducted a cluster analysis using k-means unsupervised classification (Hartigan and Wong, 1979), which determines how close different elements in a dataset are based on a user-defined set of k clusters. We determined four optimal performance clusters based on the cities' scores on the UESI indicators that maximized similarities and differences between performance and avoided overlapping clusters compared to 3, 5, and 6 cluster classifications. Figure 6 depicts these city clusters and summary distributions through boxplot visualizations of how the clusters compare according to morphological characteristics such as population density, built-up index (or ΔNormalized Difference Built-up Index, representing an urban-rural differential where higher values indicate more built-up surfaces compared to rural areas and greenness (or ΔNormalized Difference Vegetation Index representing an urban-rural differential where positive values indicate urban areas are greener than surrounding rural areas) as well as GDP per capita. For more detailed explanation of the calculation of ΔNBDI and ΔNDVI, see Chakraborty et al. (2019).
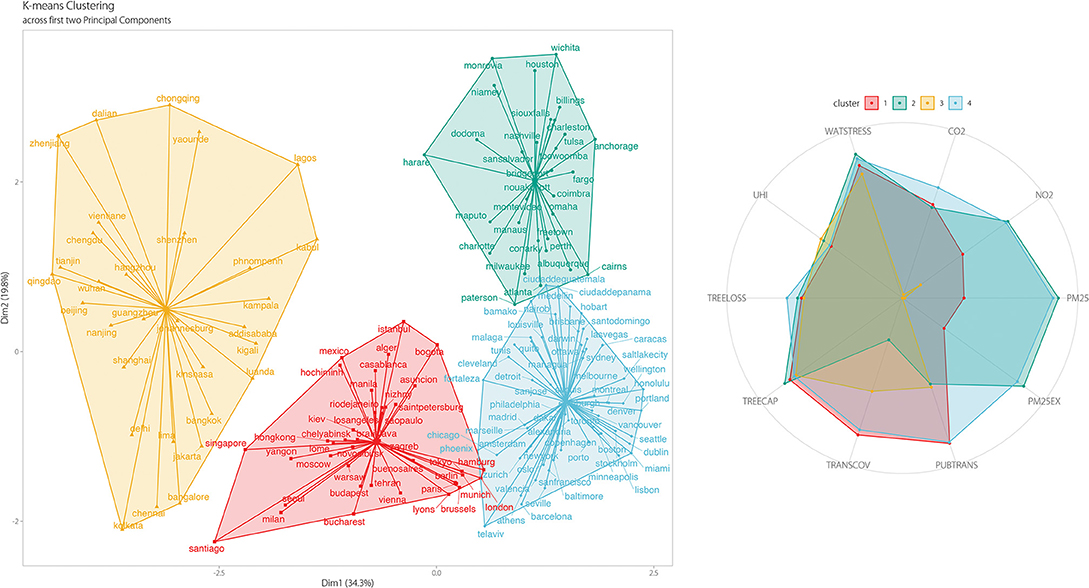
Figure 6. Typologies of urban environmental performance for the cities evaluated in the UESI.
The cluster analysis reveals a distinct typology of urban environmental performance (see Supplementary Table 1 for full list of the city cluster identifications). Cluster 1 (shaded in red in Figures 6, 7) consists of cities that perform well on indicators like water stress, tree cover per capita, and the transportation indicators but perform poorly on air quality and climate change. It includes a diverse range of cities, from cities in Latin America, such as Mexico City and São Paulo, but also European cities like Paris and London. They demonstrate a range of GDP per capita, including wealthy cities Brussels and Singapore, and tend to be less green (as measured by NDVI) and have higher population density than other city clusters. Cluster 3 (shaded in yellow) is comprised of cities primarily from major emerging economies and countries in the Global South, including Shanghai, Bangalore, Johannesburg, and Lagos. They tend to be the lowest performing cities, particularly on the CO2 and air pollution indicators. They have the lowest range of GDP per capita, and include some of the least dense cities, such as Addis Adaba, and the most dense, including Kolkata. The highest performing cluster overall are those in Cluster 4 (shaded in blue), which includes cities such as Stockholm, Oslo, Copenhagen, and Zurich. These cities fare well on water stress, climate change, tree loss, and sustainable transit, although they perform less well on average than cities in Cluster 2 on air quality indicators. They tend to be the wealthiest cities by GDP per capita. Cluster 2 (in green) cities tend to perform well on most of the UESI indicators except the sustainable transit indicators, and include car-centric cities in North America like Houston, Charleston, and Bridgeport. They have the greatest range of greenness and are the least population dense among the city clusters.
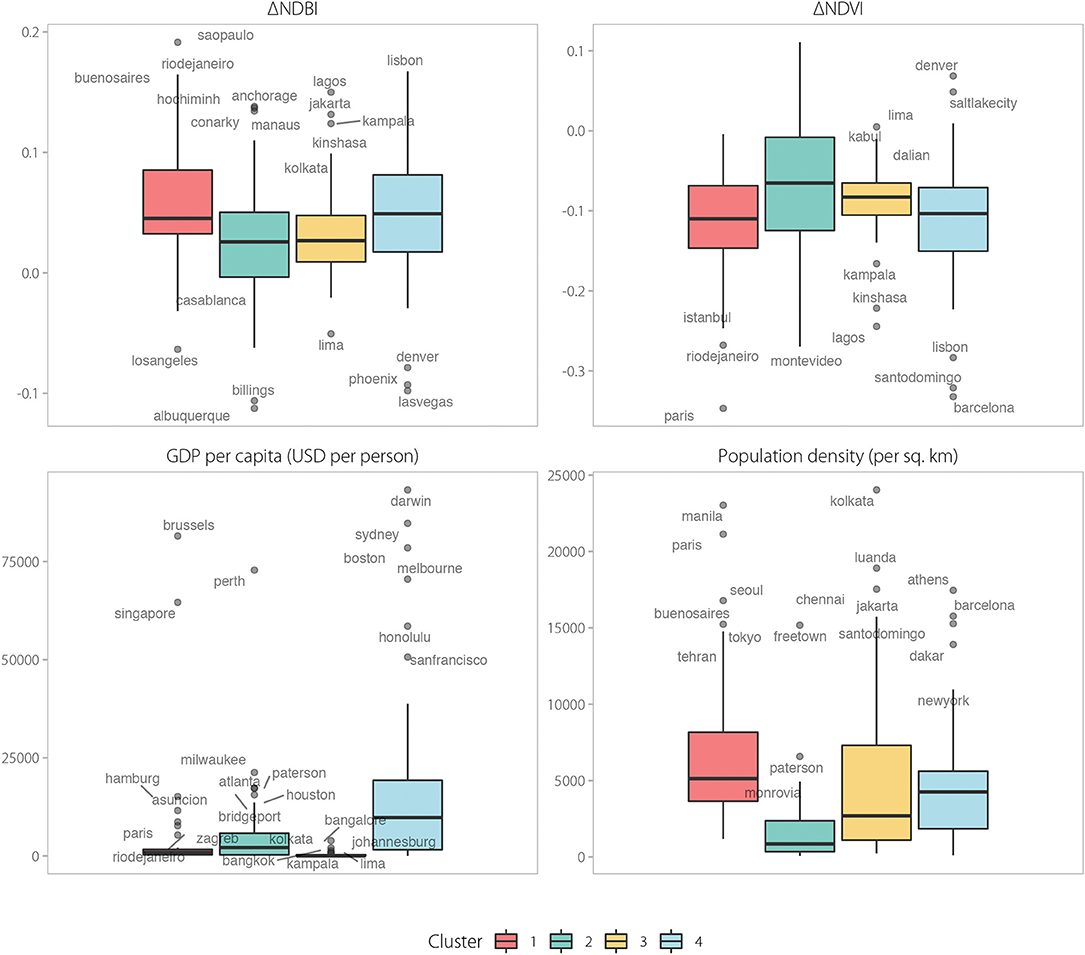
Figure 7. Boxplot showing the distribution of mean GDP per capita and morphological characteristics such as ΔNDBI (built-up index), ΔNDVI (greenness index), and population density per sq. km.
Discussion
These findings presented in this paper represent the most comprehensive quantitative assessment, to the authors' knowledge, of the distribution of urban environmental performance at the neighborhood level. The UESI's results indicate that very few cities are on track to meeting SDG-11's goal of fostering both sustainable and inclusive communities for all of their residents. On each of the UESI's environmental targets, there is room to improve cities' performance. Even cities with strong environmental performances often fail to be equitable and share environmental benefits inclusively. These results correspond with other studies that have found that residents with lower incomes or social status, living in cities including Cairo, Alexandria (Hereher, 2010), Rio de Janeiro (de Sherbinin and Hogan, 2011), and Dhaka (Fuchs, 2010; Khan et al., 2011) face greater climate risks; and research indicating that low-income residents face risks related to high population densities (Reckien et al., 2018), low-quality buildings (United Nations Office for Disaster Risk Reduction, 2009) and the lack of risk-reducing infrastructure and services (Revi et al., 2014; Reckien et al., 2017). The UESI's broad coverage of over 160 cities demonstrates that these trends are widespread and apply across a range of cities in different geographic and economic circumstances, from small cities to megacities.
The UESI also demonstrates that disaggregated, spatially explicit data is critical to measuring progress toward SDG-11. Aggregated city-level data, in other words, can mask and obscure differences in the lived experience of residents in different neighborhoods. The UESI results highlight the need for cities and local governments to actively address issues of distributional equity as part of their environmental and development interventions (Wachsmuth et al., 2016), to ensure benefits and burdens are not disproportionately burdening low-income residents. The Index identifies several outliers: a small handful of cities that achieve high environmental performance and a distribution of environmental benefits and burdens that does not unduly burden low-income populations. While this list includes cities like Stockholm, which frequently appears in lists of high-performing or “liveable” cities, it also includes Darwin, Quito, Freetown, and other less-frequently profiled cities. The inclusion of cities across a wide range of geographies, with varying population sizes and population densities, suggests strong and equitable environmental performance is possible across many different urban forms and stages of development. Notably, no megacities both perform well on environmental indicators and avoid burdening lower-income neighborhoods with environmental pollution, which may reflect the inherent challenges of managing rapid growth with limited resources. Future research could closely examine the drivers behind these cities' success and identify strategies that could also aid other urban areas in similar contexts. The UESI's reliance on spatial data also creates a baseline to track how cities' environmental performance and the equity of its distribution across neighborhoods with different income levels evolve over time. In addition, cities could use the equity measure as a tool to evaluate potential urban development scenarios, to find those that are more capable of closing the gap between wealthier and less affluent citizens.
The UESI's model could address some of the central challenges—open, comparable data; institutional capacity to support data gathering; and data localization—to monitoring progress toward the SDGs. Satellite data's extensive spatial coverage makes it possible to apply a consistent methodology to collect data across many cities (Seto and Christensen, 2013; Creutzig et al., 2019), helping meet the need for comparative analyses across different cities (Seitzinger et al., 2012) to inform decision-making (via Webb et al., 2018). Spatial data is also well-suited to incorporating different urban characteristics—such as the scale and rate of urbanization, and urban location, form, function and processes (Seto et al., 2010)—into these analyses. For instance, a close examination of the UESI's Urban Heat Island Intensity data indicates that urban heat island exposure is associated with a city's development pattern, and the socioeconomic drivers that affect the distribution of residents (Chakraborty et al., 2019). The creation of a spatial dataset creates a common reference point between the urban, regional and national actors that all shape municipal policy, and could also enable analyses that explore the linkages between cities, their surrounding regions, and their more far-reaching impacts, a key and understudied area of research (Seitzinger et al., 2012; Seto et al., 2012; Wachsmuth et al., 2016; Webb et al., 2018). Translating that data into an accessible forum, like the UESI, also has the potential to inform and engage urban residents, researchers, community organizations, and other stakeholders. Introducing new tools into the public domain can reduce transaction costs for collaboration and spur “new innovative forms of collective action aimed at solving complex public policy issues, contributing to public knowledge, or replacing traditional forms of public service provision” (Meijer et al., 2019).
Given the rapid rate of urban change underway in many parts of the world, spatial data's potential for frequent, consistent, timely data collection could fill a vital need in tracking and understanding different forms of urban development. While utilizing and analyzing spatial data for urban decision-making still requires local institutional capacity, a shared, global dataset could reduce some data collection needs. A spatial framework could also be tailored or localized to specific contexts. For example, a city could download the UESI's data and use it as a template and starting point for additional datasets, to create an approach that includes both shared global metrics and more locally-relevant data on urban environmental performance and city services.
Some uncertainties and data gaps may limit the UESI's application. The UESI defines cities according to their administrative boundaries, which often vary significantly (Valencia et al., 2019). São Paulo and Beijing have broad boundaries that include sparsely populated rural neighborhoods, for instance, while Tokyo and Bangkok's administrative boundaries only include their central districts. These differences can affect how cities score on the UESI indicators and may add uncertainty to efforts to compare cities' approaches and performance. As urbanization is increasingly taking place beyond the administrative boundaries of individual municipalities, particularly in the Global South (Seto et al., 2010; Allen et al., 2015; Valencia, 2016; Valencia et al., 2019), accounting for urban performance outside official boundaries, and incorporating socioeconomic data to this analysis, will be crucial to creating a complete assessment of urban performance.
Additionally, there are some inherent gaps and uncertainties in the UESI's underlying data sources. Census data providing population and income information is often infrequently collected, and, particularly in rapidly growing cities, may not capture recent growth or changes or fully encompass informal settlements. The high number of Tier II cities in Figure 3's top-performing quadrant−17 out of the total 24 cities—bear further investigation into the effects of using GDP data as a proxy for income data. These results, along with the comparative analysis of the Tier I and II income approaches, suggest that these two variables represent different aspects of wealth within a city, each with its own implications in terms of distributive justice. Data sources for several critical indicators highlighted in the SDGs, such as measuring access to improved water and sanitation and waste management, do not exist at a global scale or at levels granular enough to facilitate neighborhood-by-neighborhood comparison. This challenge is particularly true for drivers, other than income, that can contribute to social vulnerability, such as gender, age, education level, and race (Data-Driven EnviroLab, 2020). While these factors are vital to better understanding local vulnerability, data tracking them remains scarce and heterogeneous across different contexts. Some indicators may also overlook informal processes and dynamics: for instance, the public transit indicators focus on bus and metro stops, and may not fully capture informal and unmapped transportation systems prevalent in many Asian and African cities (Klopp et al., 2015). Additionally, while the UESI focuses on the city itself, the footprint of urban areas often extends far beyond city boundaries (Wachsmuth et al., 2016; Frank et al., 2017). These limitations also offer promising areas for future research, which could explore approaches to further localizing this template, or connecting and comparing environmental performance within cities with an assessment of their broader resource consumption and environmental footprint.
Conclusion
Less than a decade remains left to achieve the 2030 Agenda for Sustainable Development, and initial assessments indicate that the global community still needs to dramatically accelerate progress toward all 17 goals, including SDG-11 (United Nations Economic and Social Council, 2019). In many cities, where understanding progress toward SDG-11 depends, in large part, on understanding the distribution of environmental performance across different demographic groups, scarce data enables policymakers and other stakeholders to identify their performance, target hotspots of poor performance for intervention, and benchmark their progress against other actors. The UESI leverages high-resolution, large-scale data to create a comprehensive, spatially-explicit assessment of urban environmental performance at the neighborhood scale. By combining this data with neighborhood-level income information, we quantify cities' distributional in/equality, finding that the majority of cities disproportionately burden lower-income communities with higher shares of environmental burdens and lower shares of environmental benefits. This approach to leveraging spatial data could overcome widespread data standardization, data gathering, and data localization challenges around the SDGs, and enable more detailed and targeted comparisons and drivers of cities performance on SDG-11.
Data Availability Statement
The datasets presented in this study can be accessed, explored, and downloaded at: datadrivenlab.org/urban.
Author Contributions
AH is the project's Principal Investigator, led the creation, and development of the UESI. RT led the process of scoping and selecting the UESI's indicators. AH, RT, TC, DM, AW, and NG developed approaches for assessing and analyzing specific environmental indicators. AH, RT, and DM, formulated the approach to assessing equity. AH, TC, AF, DM, and NC coordinated on building the data pipelines, analyzing the dataset, and applying Google Earth Engine to automate the calculation of spatial environmental indicators. AH and NC created the figures shown in the paper. AH and AW led drafting the manuscript, with inputs from all other contributing authors. All authors contributed to the article and approved the submitted version.
Funding
This work was supported by the Samuel Centre for Social Connectedness, through grant AWDR14157, and a National University of Singapore Early Career Award to A. Hsu (grant R-607-000-379-133).
Conflict of Interest
The authors declare that the research was conducted in the absence of any commercial or financial relationships that could be construed as a potential conflict of interest.
Acknowledgments
Many thanks to all of the contributors of the 2018 and 2019 releases of the Urban Environment and Social Inclusions Index, and to all of the expert contributors who provided feedback on the UESI's approach and indicator selection [listed in full in Hsu et al. (2018)]. Thank you to Claire Inciong Krummenacher, Claire Suh, James Sun, Jacob Jarabejo, Xiyao Fu, and Damon Lim for supporting the collection of city shapefile and census population and income data. Particular thanks to Glenn Sheriff, Assistant Professor of Economics at Arizona State University, for his guidance while formulating the Environmental Concentration Index.
Supplementary Material
The Supplementary Material for this article can be found online at: https://www.frontiersin.org/articles/10.3389/frsc.2020.556484/full#supplementary-material
References
Agyeman, J., and Evans, B. (2004). “Just Sustainability:” the emerging discourse of environmental justice in Britain? Geogr. J. 170, 155–164. doi: 10.1111/j.0016-7398.2004.00117.x
Allen, A., Lampis, A., and Swilling, M. (2015). Untamed Urbanisms. (Abingdon: Routledge). doi: 10.4324/9781315746692
Álvarez, L., and Coolsaet, B. (2020). Decolonizing environmental justice studies: a Latin American perspective. Capital. Nat. Social. 31, 50–69. doi: 10.1080/10455752.2018.1558272
Arfvidsson, H., Simon, D., Oloko, M., and Moodley, N. (2017). Engaging with and measuring informality in the proposed Urban sustainable development goal. Afr. Geograph. Rev. 36, 100–114. doi: 10.1080/19376812.2015.1130636
Boyer, D., Brodie, S., Sperling, J., Stokes, E., and Zomer, A. (2015). UGEC viewpoints. Implementing the urban sustainable development goal in Atlanta and Delhi. Availale online at: https://ugecviewpoints.wordpress.com/2015/06/18/implementing-the-urban-sustainable-development-goal-in-atlanta-and-delhi/ (accessed November 19, 2020).
Cantore, N., and Padilla, E. (2007). Equity and CO2 emissions distribution in climate change integrated assessment modelling (No. 7001). Alma Mater Studiorum University of Bologna, Department of Agricultural Economics and Engineering, Bologna.
Chakraborty, T., Hsu, A., Manya, D., and Sheriff, G. (2019). Disproportionately higher exposure to urban heat in lower-income neighborhoods: a multi-city perspective. Environ. Res. Lett. 14:105003. doi: 10.1088/1748-9326/ab3b99
Costa-Font, J., Hernandez-Quevedo, C., and Sato, A. (2018). A health “Kuznets' Curve?” cross-sectional and longitudinal evidence on concentration indices. Soc. Indicat. Res. 136, 439–452. doi: 10.1007/s11205-017-1558-8
Creutzig, F., Lohrey, S., Bai, X., Baklanov, A., Dawson, R., Dhakal, S., et al. (2019). Upscaling urban data science for global climate solutions. Glob. Sustain. 2:e2. doi: 10.1017/sus.2018.16
Data-Driven EnviroLab (2020). Equity and Social Inclusion Issue Profile. The Urban Environment and Social Inclusion Index. Singapore: Yale-NUS College. Available online at: http://datadrivenlab.org/urban/issue-profiles/equity/ (accessed November 19, 2020).
de Sherbinin, A., and Hogan, D. (2011). “Box 3.1-climate proofing rio de janeiro, Brazil”, in Climate Change and Cities: First Assessment Report of the Urban Climate Change Research Network, eds C. Rosenzweig, W. D. Solecki, S. Mehrotra, and S. A. Hammer (Cambridge, UK: Cambridge University Press), 51–52.
Elgar, F. J., McKinnon, B., Torsheim, T., Schnohr, C. W., Mazur, J., Cavallo, F., et al. (2016). Patterns of socioeconomic inequality in adolescent health differ according to the measure of socioeconomic position. Soc. Indic. Res. 127, 1169–1180. doi: 10.1007/s11205-015-0994-6
European Environmental Agency (2018). Unequal Exposure and Unequal Impacts: Social Vulnerability to Air Pollution, Noise and Extreme Temperatures in Europe. EEA Report No 22/2018. Available online at: https://www.eea.europa.eu/publications/unequal-exposure-and-unequal-impacts (accessed November 19, 2020).
Frank, B., Delano, D., and Caniglia, B. S. (2017). Urban systems: a socio-ecological system perspective. Sociol. Int. J. 1, 1–8. doi: 10.15406/sij.2017.01.00001
Fuchs, R. J. (2010). Cities at Risk: Asia's Coastal Cities in an Age of Climate Change. Honolulu, HI: East-West Center.
Gellers, J. C., and Cheatham, T. J. (2018). Sustainable development goals and environmental justice: realization through disaggregation. Wis. Int'l L J. 36:276. doi: 10.2139/ssrn.3487056
Gorelick, N., Hancher, M., Dixon, M., Ilyushchenko, S., Thau, D., and Moore, R. (2017). Google earth engine: planetary-scale geospatial analysis for everyone. Remote Sens. Environ. 202, 18–27. doi: 10.1016/j.rse.2017.06.031
Groot, L. (2010). Carbon Lorenz curves. Resour. Energy Econ. 32, 45–64. doi: 10.1016/j.reseneeco.2009.07.001
Hartigan, J. A., and Wong, M. A. (1979). Algorithm AS 136: a k-means clustering algorithm. J. R. Stat. Soc. C 28, 100–108. doi: 10.2307/2346830
Hereher, M. E. (2010). Vulnerability of the Nile Delta to sea level rise: an assessment using remote sensing. Geomat. Nat. Haz. Risk 1, 315–321. doi: 10.1080/19475705.2010.516912
Hezri, A. A., and Hasan, M. N. (2004). Management framework for sustainable development indicators in the State of Selangor, Malaysia. Ecol. Indic. 4, 287–304. doi: 10.1016/j.ecolind.2004.08.002
Hollands, R. G. (2008). Will the real smart city please stand up? intelligent, progressive or entrepreneurial? City 12, 303–320. doi: 10.1080/13604810802479126
Hsu, A., Alexandre, N., Brandt, J., Chakraborty, T., Comess, S., Feierman, A., et al. (2018). The Urban Environment and Social Inclusion Index. (New Haven, CT: Yale University). Available online at: datadrivenyale.edu/urban (accessed November 19, 2020).
Hsu, A., Esty, D., Levy, M., and de Sherbinin, A. (2016). 2016 Environmental Performance Index. (New Haven, CT: Yale University). Available online at: https://issuu.com/2016yaleepi/docs/epi2016_final/ (accessed November 19, 2020).
Kakwani, N., Wagstaff, A., and Van Doorslaer, E. (1997). Socioeconomic inequalities in health: measurement, computation, and statistical inference. J. Econom. 87–103. doi: 10.1016/S0304-4076(96)01807-6
Khan, A. E., Ireson, A., Kovats, S., Mojumder, S. K., Khusru, A., Rahman, A., et al. (2011). Drinking water salinity and maternal health in coastal Bangladesh: implications of climate change. Environ. Health Perspect. 119, 1328–1332. doi: 10.1289/ehp.1002804
Klopp, J., Williams, S., Waiganjo, P., Orwa, D., and White, A. (2015). “Leveraging cellphones for wayfinding and journey planning in semi-formal bus systems: lessons from digital matatus in Nairobi,” in Planning Support Systems and Smart Cities, eds S. Geertman, J. Ferreira Jr., R. Goodspeed, and J. Stillwell (Cham: Springer), 227–241. doi: 10.1007/978-3-319-18368-8_12
Klopp, J. M., and Petretta, D. L. (2017). The urban sustainable development goal: Indicators, complexity and the politics of measuring cities. Cities 63, 92–97. doi: 10.1016/j.cities.2016.12.019
Kummu, M., Taka, M., and Guillaume, J. H. (2018). Gridded global datasets for gross domestic product and human development index over 1990–2015. Sci. Data 5:180004. doi: 10.1038/sdata.2018.4
Lorenz, M. O. (1905). Methods of measuring the concentration of wealth. Public. Am. Stat. Assoc. 9, 209–219. doi: 10.2307/2276207
Maguire, K., and Sheriff, G. (2011a). Comparing distributions of environmental outcomes for regulatory environmental justice analysis. Int. J. Environ. Res. Public Health 8, 1707–1726. doi: 10.3390/ijerph8051707
Maguire, K., and Sheriff, G. (2011b). Quantifying the Distribution of Environmental Outcomes for Regulatory Environmental Justice Analysis (No. 201102). Washington, DC: National Center for Environmental Economics, US Environmental Protection Agency.
Meijer, A. J., Lips, M., and Chen, K. (2019). Open governance of cities: a new paradigm for understanding urban collaboration. Front. Sust. Cities 1:3. doi: 10.3389/frsc.2019.00003
Oakes, J. M., and Kaufman, J. S. (2017). Methods in Social Epidemiology. San Francisco, CA: John Wiley & Sons.
Padilla, E., and Serrano, A. (2006). Inequality in CO2 emissions across countries and its relationship with income inequality: a distributive approach. Energy Policy 34, 1762–1772. doi: 10.1016/j.enpol.2004.12.014
Reckien, D., Creutzig, F., Fernandez, B., Lwasa, S., Tovar-Restrepo, M., Mcevoy, D., et al. (2017). Climate change, equity and the sustainable development goals: an urban perspective. Environ. Urban 29, 159–182. doi: 10.1177/0956247816677778
Reckien, D., Lwasa, S., Satterthwaite, D., McEvoy, D., Creutzig, F., Montgomery, M., et al. (2018). “Equity, environmental justice, and urban climate change,” in Climate Change and Cities: Second Assessment Report of The Urban Climate Change Research Network, eds C. Rosenzweig, W. D. Solecki, P. Romero-Lankao, S. Mehrotra, S. Dhakal, and S. A. Ibrahim (Cambridge: Cambridge University Press), 173–224.
Revi, A., Satterthwaite, D., Aragón-Durand, F., Corfee-Morlot, J., Kiunsi, R. B. R., Pelling, M., et al. (2014). “Urban Areas”, in Climate Change 2014: Impacts, Adaptation, and Vulnerability. Part A: Global and Sectoral Aspects, Contribution of Working Group II to the Fifth Assessment Report of the Intergovernmental Panel on Climate Change, eds Field, C.B., Barros,V.R., Dokken, D.J., Mach, K.J., Mastrandrea, M.D., Bilir, T E., Chatterjee, M., Ebi, K.L., Estrada, V., Genova, R.C., Girma, B., Kissel, E.S., Levy, A.N., MacCracken, S., Mastrandrea, P.R., White L.L. (London; New York: Cambridge University Press), 535–612.
Robin, E., and Acuto, M. (2018). Global urban policy and the geopolitics of urban data. Polit. Geogr. 66, 76–87. doi: 10.1016/j.polgeo.2018.08.013
Sassen, S. (2010). Global inter-city networks and commodity chains: any intersections? Glob. Netw. 10, 150–163. doi: 10.1002/9781444328264.ch9
Schlosberg, D. (2004). Reconceiving environmental justice: global movements and political theories. Env. Polit. 13, 517–540. doi: 10.1080/0964401042000229025
Seitzinger, S. P., Svedin, U., Crumley, C. L., Steffen, W., Abdullah, S. A., Alfsen, C., et al. (2012). Planetary stewardship in an urbanizing world: beyond city limits. Ambio 41, 787–794. doi: 10.1007/s13280-012-0353-7
Seto, K. C., and Christensen, P. (2013). Remote sensing science to inform urban climate change mitigation strategies. Urban Clim. 3, 1–6. doi: 10.1016/j.uclim.2013.03.001
Seto, K. C., Dhakal, S., Bigio, A., Blanco, H., Delgado, G. C., Dewar, D., et al. (2014). “Human settlements, infrastructure and spatial planning,” in Climate Change 2014: Mitigation of Climate Change. Contribution of Working Group III to the Fifth Assessment Report of the Intergovernmental Panel on Climate Change, eds O. Edenhofer, R. Pichs-Madruga, Y. Sokona, E. Farahani, S. Kadner, K. Seyboth, A. Adler, I. Baum, S. Brunner, P. Eickemeier, B. Kriemann, J. Savolainen, S. Schl?mer, C. von Stechow, T. Zwickel, and J. C. Minx (Cambridge; New York, NY: Cambridge University Press), 923–978.
Seto, K. C., Reenberg, A., Boone, C. G., Fragkias, M., Haase, D., Langanke, T., et al. (2012). Urban land teleconnections and sustainability. Proc. Natl. Acad. Sci. U. S. A. 109, 7687–7692. doi: 10.1073/pnas.1117622109
Seto, K. C., Sánchez-Rodríguez, R., and Fragkias, M. (2010). The new geography of contemporary urbanization and the environment. Annu. Rev. Environ. Resour. 35, 167–194. doi: 10.1146/annurev-environ-100809-125336
Sheriff, G., and Maguire, K. (2013). Ranking Distributions of Environmental Outcomes Across Population Groups (No. 2168-2018-8148). Washington, DC: National Center for Environmental Economics, U.S. Environmental Protection Agency.
Simon, D., and Arfvidsson, H. (2015). Pilot Project to Test Potential Targets and Indicators for the Urban Sustainable Development Goal 11: Final Report. Gothenburg: Mistra Urban Futures.
Simon, D., Arfvidsson, H., Anand, G., Bazaz, A., Fenna, G., Foster, K., et al. (2016). Developing and testing the urban sustainable development goal's targets and indicators–a five-city study. Environ. Urban 28, 49–63. doi: 10.1177/0956247815619865
Spielman, S. E., and Logan, J. R. (2012). Using high-resolution population data to identify neighborhoods and establish their boundaries. Ann. Assoc. Am. Geograph. 103, 67–84. doi: 10.1080/00045608.2012.685049
Springer-Verlag (2008). “Gini index,” in The Concise Encyclopedia of Statistics. (New York, NY: Springer). doi: 10.1007/978-0-387-32833-1_169
Thomas, R., Hsu, A., and Weinfurter, A. (in press). Sustainable Inclusive – do existing urban sustainability indicators help measure progress towards SDG-11? Environ. Plann. B Urban Analy. City Sci.
United Nations Economic Social Council (2019). Special Edition: Progress towards the Sustainable Development Goals. Available online at: https://undocs.org/E/2019/68 (accessed November 19, 2020).
United Nations Human Settlement Programme (2016). City Prosperity Index Metadata. Available online at: http://cpi.unhabitat.org/cpi-information (accessed November 19, 2020).
United Nations Human Settlement Programme (2018). Accelerating SDG-11 Achievement: Policy Brief in Support of the First SDG-11 Review at the UN High-Level Political Forum 2018. Available online at: https://sustainabledevelopment.un.org/content/documents/194452018_HLPF_Thematic_Review_of_SDG_11_UNHabitat_12_June_2018_original.pdf (accessed November 19, 2020).
United Nations Office for Disaster Risk Reduction (2009). Global Assessment Report on Disaster Risk Reduction 2009: Risk and Poverty in a Changing Climate. Geneva: United Nations.
Valencia, S. (2016). Caught between spaces: socio-environmental vulnerability in formal and informal peri-urban Bogotá and Soacha, Colombia (No. 13). Colombia: Lund University.
Valencia, S. C., Simon, D., Croese, S., Nordqvist, J., Oloko, M., Sharma, T., et al. (2019). Adapting the Sustainable Development Goals and the New Urban Agenda to the city level: initial reflections from a comparative research project. Int. J. Urban Sustain. Dev. 11, 4–23. doi: 10.1080/19463138.2019.1573172
Wachsmuth, D., Cohen, D. A., and Angelo, H. (2016). Expand the frontiers of urban sustainability. Nature 536, 391–393. doi: 10.1038/536391a
Wagstaff, A., Paci, P., and Van Doorslaer, E. (1991). On the measurement of inequalities in health. Soc. Sci. Med. 33, 545–557. doi: 10.1016/0277-9536(91)90212-U
Walker, G. (2009). Beyond distribution and proximity: exploring the multiple spatialities of environmental justice. Antipode 41, 614–636. doi: 10.1111/j.1467-8330.2009.00691.x
Watson, V. (2016). Locating planning in the New Urban Agenda of the urban sustainable development goal. Plann. Theory 15, 435–448. doi: 10.1177/1473095216660786
Webb, R., Bai, X., Smith, M. S., Costanza, R., Griggs, D., Moglia, M., et al. (2018). Sustainable urban systems: co-design and framing for transformation. Ambio 47, 57–77. doi: 10.1007/s13280-017-0934-6
Keywords: sustainable development goals, new urban agenda, equity, cities, indices, spatial data, social inclusion
Citation: Hsu A, Chakraborty T, Thomas R, Manya D, Weinfurter A, Chin NJW, Goyal N and Feierman A (2020) Measuring What Matters, Where It Matters: A Spatially Explicit Urban Environment and Social Inclusion Index for the Sustainable Development Goals. Front. Sustain. Cities 2:556484. doi: 10.3389/frsc.2020.556484
Received: 28 April 2020; Accepted: 12 November 2020;
Published: 14 December 2020.
Edited by:
Tathagata Chatterji, Xavier University, IndiaReviewed by:
Elzbieta Wojnicka-Sycz, University of Gdansk, PolandJoshua Gellers, University of North Florida, United States
Copyright © 2020 Hsu, Chakraborty, Thomas, Manya, Weinfurter, Chin, Goyal and Feierman. This is an open-access article distributed under the terms of the Creative Commons Attribution License (CC BY). The use, distribution or reproduction in other forums is permitted, provided the original author(s) and the copyright owner(s) are credited and that the original publication in this journal is cited, in accordance with accepted academic practice. No use, distribution or reproduction is permitted which does not comply with these terms.
*Correspondence: Angel Hsu, YW5nZWwuaHN1QHVuYy5lZHU=