 Amy Tian
 Daniel Zünd
 Luís M. A. Bettencourt
- 1Mansueto Institute for Urban Innovation, The University of Chicago, Chicago, IL, United States
- 2Department of Ecology & Evolution, The University of Chicago, Chicago, IL, United States
- 3Santa Fe Institute, Santa Fe, NM, United States
Presently, many island communities are largely dependent on fossil fuel resources for energy, leaving the abundance of renewable energy resources largely untapped. Although various solar energy potential modeling tools have been developed, most require high-resolution data, which do not presently exist for many developing countries or remote areas. Here, we calculate the potential of rooftop solar systems using low-cost, readily obtainable data and methods. This approach can be replicated by local communities and decision-makers to obtain an estimate of solar potential before investing in more detailed analysis. We illustrate the use of these methods on the two major urban centers on the Galápagos Islands (Ecuador), Puerto Baquerizo Moreno and Puerto Ayora. Our results show that a minimum of 21% and 27% of the total rooftop area must be covered with today's solar energy production technology to meet the current electricity demand of Puerto Baquerizo Moreno and Puerto Ayora, respectively. Additionally, the results demonstrate that Puerto Baquerizo Moreno has a higher production potential than Puerto Ayora, making it an attractive option for solar development that does not compete with the scarce land resources, most of which must be preserved as natural protected areas.
1. Introduction
Small island communities are highly vulnerable to major energy supply disruptions as a result of their remoteness, size, and susceptibility to natural disasters (Briguglio, 1995). As expanding tourism (Izurieta, 2017) has brought rapid urbanization to many of these communities, reliable green energy supply has come to play a more central concern for the socioeconomic growth of island systems (Wolf et al., 2016). For the majority of island nations, the energy grid heavily relies on imported diesel for electricity generation, which leaves local economies vulnerable to supply disruptions, price volatility in global oil markets and the consequences of oil spills (Phuangpornpitak and Kumar, 2011). However, there is increasing consensus that island nations can champion livelihood resilience and more sustainable adaptation by taking the lead in developing their own energy independence from fossil fuels (Notton, 2015).
Despite abundant resources and rapidly dropping costs, only a small fraction of electricity is still produced from solar energy globally (Lewis and Nocera, 2006). A significant barrier to adoption for many governments of developing nations is the upfront cost of conducting a detailed evaluation of technical and economic potential (Castellanos et al., 2017). Previous studies have demonstrated that preliminary technical knowledge of specialized modeling methods, which use expensive data such as Light Detection and Ranging (LiDAR), can deter further investments in renewable energy (Mirza et al., 2009; Karatayev et al., 2016; Yaqoot et al., 2016). While several photovoltaic (PV) modeling tools have been recently developed, many use 3D mapping technologies including LiDAR and high-quality satellite imagery that are expensive to obtain and complex to utilize. Moreover, despite increasing accuracy of remote and aerial sensing, data and modeling tools still lag for locations outside major cities and densely-populated areas (Carl, 2014).
In Ecuador, solar energy has represented only a small portion of its electric energy source despite abundant solar resources available. Previous studies assessing solar potential in the country have found that the Galápagos Islands are one of the most suitable areas for development because they receive one of highest solar radiation in the country (Cevallos-Sierra and Ramos-Martin, 2018; Garćıa et al., 2019). Most of the limited number of solar studies in Ecuador are focused on the mainland and highly urbanized areas (Albarracin, 2017; Icaza et al., 2021). To our knowledge, there is no study specifically evaluating the solar potential of the Galápagos Islands, which is a region that has the potential to greatly benefit tapping their from plentiful solar resources.
In order to mitigate these challenges, this study quantifies the potential of rooftop PV systems using inexpensive and readily available data. We adopt the Galapagos Islands as a case study because it is an iconic ecosystem experiencing rapid urbanization from exploding tourism and economic development.
Isolated 1,000 km off the coast of Ecuador, the Galápagos Islands have no native sources of fossil fuel energy and depend heavily on imported diesel fuel from the mainland as the basis for their electricity generation (Jacome, 2007; Apolo et al., 2019). With a residential population of 30,000 and over 200,000 annual tourists providing a vital source of income to local populations and the nation, rapid urbanization has made electric energy demand a pressing concern for the long-term sustainability of the islands (Apolo et al., 2019; Kvan and Karakiewicz, 2019). The current electric consumption of the entire archipelago is 52,792 MWh per year with a majority of production from fossil fuels comprised of virtually all diesel at 84.2%, followed by 11.3% wind and 4.5% solar power (Figure 1) (Granda, 2019).
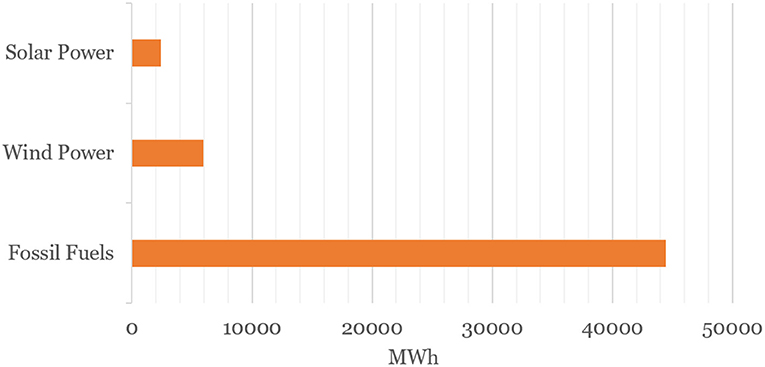
Figure 1. Existing energy sources used for electricity generation on the Galápagos Islands in 2018. Fossil fuels comprise the majority of electricity generation on the islands at around 44,450 MWh out of the 52,792 MWh produced total (84.2%) (Granda, 2019).
Historically, the Ecuadorian government has subsidized diesel fuel to ensure a minimum standard of living and to compensate Galápagos residents for the isolation and restrictions associated with living in a remote protected area (Jacome, 2007). Yet, these subsidies result in high public costs, economic inefficiencies, hide externalities, and distort markets that result in unregulated growth (Watkins and Cruz, 2007). Between 2003 and 2015, the electricity consumption on San Cristóbal Island alone increased by 275% and is projected to rapidly increase into 2024 (Vintimilla et al., 2016).
As diesel must be transported to the Galápagos by sea, fossil fuels have proven to be an unreliable energy source that compromise the ecological integrity and economic resiliency of the islands. For instance, in 2001, the Jessica oil tanker hit a reef and spilled three million liters of oil into the pristine marine reserve while delivering fuel from the mainland (Edgar et al., 2002). The spill was considered one of the worst marine disasters the Galápagos history, triggering an international initiative to transition the Galápagos away from fossil fuels.
In 2007, the Ecuadorian and Galápagos governments put forward the “Zero Fossil Fuel Galápagos Initiative”, which aims to eradicate the use of petroleum-derived fuels. The original goals set out to produce 100% renewable energy by 2020 using mostly biofuels and wind (Carvajal, 2012). Since then, several renewable energy projects were initiated with investment from the United Nations Development Programme, and the Ecuadorian, German, and South Korean governments. Despite these efforts, the archipelago still struggles to meet their energy goals as fossil fuels continue to generate 84% of the current electricity consumed (Granda, 2019).
A major renewable energy generation project is the San Cristóbal Wind Project, which erected three diesel-wind hybrid turbines. Its development illustrates some of the real world challenges to green energy production in the Islands. Although wind power has yielded some production capacity, the site was placed at a less than optimal location to avoid bird collisions with the endangered Galápagos Petrel nesting in the area. In addition to an expensive 12 km transmission line required to transport the generated energy to the utility grid, investment costs remain disproportionately high (Lahmeyer International GmbH, 2006). Overall, and despite good environmental conditions, onshore wind systems remain a costly and unreliable option for expanding renewable energy production in harmony with the Island's fragile ecosystems. Further, the expansion plan for electricity generation does not indicate wind projects to be undertaken in the future (Chumo et al., 2018). Several recent papers point to a diesel/PV/wind/battery hybrid system as the most economical and environmentally friendly solution (Benalcazar et al., 2020; Eras-Almeida et al., 2020). In the Galápagos, solar and wind resources are also complementary and negatively correlated in time such that a hybrid system can help overcome fluctuations in different energy resources (Eras-Almeida et al., 2020). Thus, PV is the most feasible renewable energy alternative to satisfy additional demand (Eras-Almeida et al., 2020).
While major projects include the construction of 1 MW solar fields on Santa Cruz and Isabela Islands, there is a conflict between protected areas and land available for renewable energy generation (Eras-Almeida et al., 2020). Land open to human development is extremely constrained by design in the Islands, with over 97% of the total land area being strictly protected as Galápagos National Park. The large land area required may result in land use changes with undesirable impacts to biodiversity and ecological health (Hernandez et al., 2014). Thus, to protect their treasured ecosystems, the Galápagos must find alternative sources of renewable energy that maintain their environmental integrity.
The Galápagos Provincial Government's “Galápagos Development and Land Use Plan” highlights expanding renewable energy and clean transportation as its major development goals (Granda, 2019). Given strict land protection policies, we evaluate here the alternative of using the rooftop solar potential of the existing built environment in the Islands, which is a largely untapped source for renewable energy generation (Granda, 2019). By making use of existing urban space on rooftops, further land uses are avoided, also helping reduce the costs of expensive transmission infrastructure required by wind turbines (Gagnon et al., 2016) or solar farms. In addition to residential consumption, we estimate the solar energy potential required to meet the current transportation demand in the islands, assuming that all registered vehicles are replaced with electric motorcycles and cars. This is a desirable scenario outlined by the local government. Policies are already underway to strictly control imports of new vehicles in favor of replacing gasoline with electric vehicles (Granda, 2019).
Rooftop PV modeling tools vary widely in their data inputs and capabilities, making some better suited for analysis at certain locations than others (Freitas et al., 2015). For a robust evaluation, typical inputs include the amount of solar radiation at the location, area, shading, slope, and aspect of the building which are laborious to measure manually (Carl, 2014). To automate this process on urban scales, LiDAR is an aerial mapping technology which uses airborne laser sensors to extract the 3D surface structure of buildings.
While this approach has become the preferred method currently for PV potential estimations, LiDAR data collection still requires expensive airborne procedures and technology. Consequently, most tools are based on existing data generated for the US or Europe, leaving large parts of the world without coverage (Lee et al., 2019). For instance, Mapdwell (Mapdwell LLC, 2020) and Google's Project Sunroof (Google, 2020) tools both use LiDAR data but estimates are mostly limited to the US and to populous cities.
There are a few existing tools with greater international capabilities. However, the lack of ground-based measurement remains a challenge for less developed countries (Psomopoulos et al., 2015; Olomiyesan and Oyedum, 2016). The Global Solar Atlas (Solargis and World Bank Group, 2020) notes that while its data are the most accurate currently available, they are not yet fully validated due to limited measurement stations. For similar reasons, the Photovoltaic Geographical Information System (PVGIS) (Joint Research Centre, 2020) can calculate PV potential around the globe but is not currently available for large parts of South America, Eurasia, Australia, and Polynesia. The US National Renewable Energy Laboratory (NREL) developed PVWatts (NREL, 2018) which calculates PV potential at any location globally but its strength is mainly confined within US borders. As a recent comparative study demonstrated, PVGIS has relatively greater accuracy at the international locations with greater data availability (Psomopoulos et al., 2015).
As a remote and isolated archipelago, the Galápagos Islands are characterized by a lack of accurate data coverage and measuring ability. Here, we show how to use open-source, inexpensive, and readily obtainable data, including real world benchmarks from existing installations, in combination with a generalized calculation method to estimate the PV potential for the archipelago.
2. Materials and Methods
Only four of the 13 larger islands in the Galápagos archipelago are inhabited. We chose the two largest settlements for our case studies, Puerto Baquerizo Moreno on San Cristóbal Island and Puerto Ayora on Santa Cruz Island, with a permanent population of almost seven thousand and 15 thousand in 2015, respectively (Andrade and Ferri, 2019). Both settlements have a fast growing population (Epler, 2007; Kvan and Karakiewicz, 2019) and projected increasing electric energy demands (Vintimilla et al., 2016). In this study, energy demand refers to the electricity demand used annually to meet the power needed by all customers, including both residents and tourists. The climate of the Islands is characterized as tropical and semi-arid with temperatures ranging 18–27° Celsius throughout the dry and wet seasons. Due to its location near the equator, the archipelago receives high annual solar radiation and has therefore substantial potential for harnessing solar energy (Garćıa et al., 2019) for its local uses, though some variability due to weather is also typical.
The majority of buildings in both settlements have flat roofs built as a concrete slab, in a way that is typical of warmer climates where there is less rainfall and no freezing temperatures (Kvan and Karakiewicz, 2019; Mapillary, 2020). Figure 2 is street level imagery from the open source software Mapillary that demonstrates the prevalence of the flat roof design across the Galápagos Islands. In contrast to sloped roofs, a flat roof is nearly level and has a low pitch of approximately 10°. Flat roofs are particularly attractive for solar PV installation in equatorial regions because the optimal tilt of panels is approximately 0° and a tilt mount is not required (Jacobson and Jadhav, 2018). As a result of low building heights, and the flat roof design, there is also minimal shading of the roofs as displayed in Figure 3.
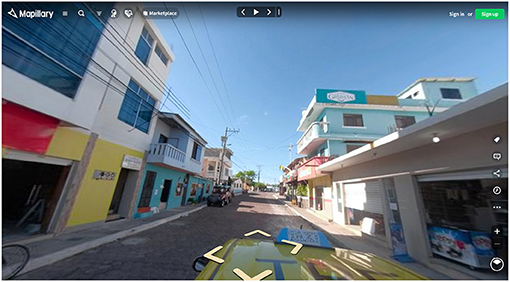
Figure 2. Street level imagery of building topography from Mapillary open source software. The images on the software demonstrate the flat roof design that is highly prevalent on the Galápagos. (Mapillary, 2020).
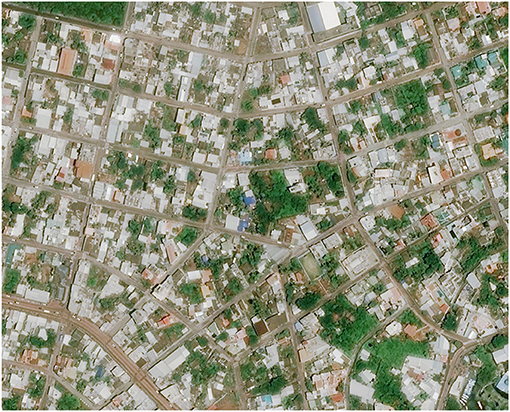
Figure 3. Aerial view imagery of Puerto Ayora on the Galápagos Islands. The image demonstrates the building topography of the prevalent flat roof design and low buildings that have minimal shading effects. (Microsoft Bing, 2021).
Therefore, we use recently generated area data for the full set of building footprints in each island as a proxy for total area available for solar development with the assumption that installed solar panels will lay flat. We will express solar requirements for powering present and future energy consumption in the Islands as a fraction of this area.
PV potential requirements can be estimated using several different methods that take into consideration local parameters such as panel tilt, efficiency, losses during conversion, solar radiation, and rooftop area (Carl, 2014). We use a simple equation 1, developed by the US National Renewable Energy Laboratory (NREL), to incorporate these various factors and calculate the annual PV system output for both Puerto Baquerizo Moreno and Puerto Ayora (Environmental Protection Agency, 2017; NREL, 2018, 2020). Equation 1 uses conservative estimates when it is combined with NREL's Annual Technology Baseline tool (NREL, 2020) to determine the relevant factors.
The annual energy produced by a photovoltaic systems, Eyr, is then given by
where A is the total rooftop area, r is the solar panel efficiency (a dimensionless number), H is the annual average solar radiation on tilted panels, and Pr is performance ratio of the panels (another dimensionless number).
Typical poly-crystalline or mono-crystalline silicon modules have a (fast improving) solar panel efficiency, r of about 15%. This number accounts for the portion of incident sunlight that is converted into electric energy (Dobos, 2014; Environmental Protection Agency, 2017; NREL, 2020). Similarly, we use a typical performance ratio, Pr, of 86% for a current typical PV system. This describes energy losses of the operational systems due to inverter and transformer efficiency limitations, mismatch losses, diodes and connections, DC and AC wiring, soiling and system availability (Environmental Protection Agency, 2017; NREL, 2020). Since the performance ratio is location and climate dependent, a value of 0.86 was used after taking the median of the monthly performance ratios from solar panels in five different Peruvian cities (Camarena-Gamarra et al., 2020). Since Ecuador and Peru are located next to each other in South America and near the equator, the study provides location specific support for the chosen Pr. To account for differences in weather, we further supported this parameter choice with a wind-corrected performance ratio study because the Galápagos Islands are in a windy location with average monthly wind speeds of 4.4 m/s from January to April and 6.7 m/s for the other months of the year (Dierauf et al., 2013; Hu et al., 2015). In the study, the Pr for locations with a higher annual wind speed of > 3 m/s was 0.86, which additionally provided climate specific support for our chosen performance ratio (Dierauf et al., 2013). To account for variation in performance ratio, we additionally include estimates in Tables 1, 2 for the upper and lower boundary (0.9 and 0.7, respectively) of annual performance ratios, as found in a study for 100 PV systems in Germany and five in Peru (Reich et al., 2012; Camarena-Gamarra et al., 2020).
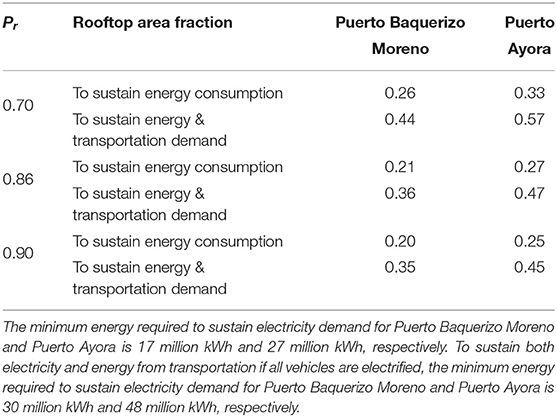
Table 1. PV potential estimates for 2018.
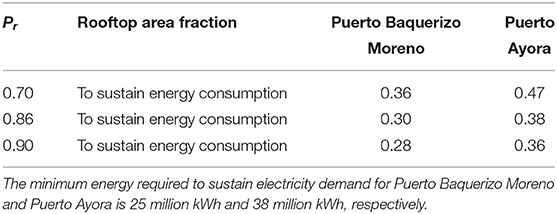
Table 2. Projections of PV potential estimates for 2024.
To obtain an estimate of the Galápagos average annual solar radiation, H, we use the Global Solar Atlas (Solargis and World Bank Group, 2020). This parameter accounts for the solar electromagnetic energy reaching the Earth's surface. Incident solar radiation energy is heavily dependent on location, as its intensity depends on the tilt of the sun, the season, and time of day. For our case study, the average annual solar radiation is estimated to be 2045 kWh/m2 at a spatial resolution of nominally 1 km (Solargis and World Bank Group, 2020), but see Figure 4 for disaggregated daily traces and their variability. While the Ecuadorian government produces a Solar Atlas called CONELEC, it does not cover solar radiation data that includes the Galápagos Islands (Consejo Nacional de Electricidad, 2017). Comparing the values of Global Solar Atlas with CONELEC, we find that these two different data sources are generally in good agreement. Taking Quito as an example, the solar radiation cited is 5.4 kWh/m2/day in Global Solar Atlas compared to 5.5 kWh/m2/day in CONELEC (Consejo Nacional de Electricidad, 2017; Solargis and World Bank Group, 2020). Having checked the compatibility of values with government data, we chose the Global Solar Atlas to obtain radiation values for the Galápagos Islands.
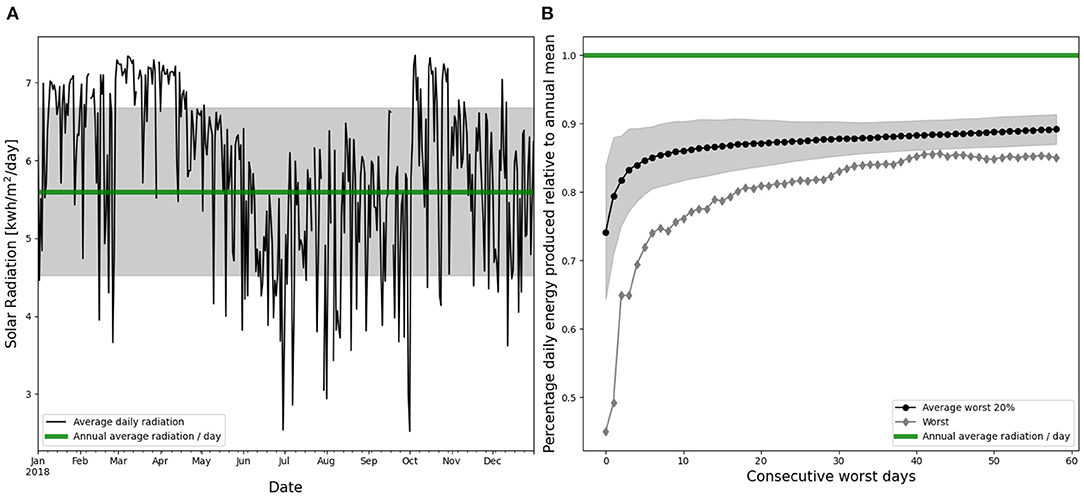
Figure 4. Average incident daily solar radiation (green) on the Galápagos Islands for 2018 compared to the average annual solar radiation used in our baseline solar panel calculations. The shaded area shows the one standard deviation around the average annual solar radiation value of 5.6 kWh/m2/day (A). Worst case scenarios of lowest average daily solar radiation per number of consecutive days over 2018 (gray) and average of lowest 20% for each period. The shaded area shows the standard deviation around the mean for the worst 20% (B). (NASA, 2020).
To estimate the total rooftop area, A, we use building footprints provided by the Galápagos Provincial Government. Figure 5 depicts the map of these footprints for both case studies, in Puerto Baquerizo Moreno, the political capital of the archipelago, and in Puerto Ayora, its largest urban settlement.
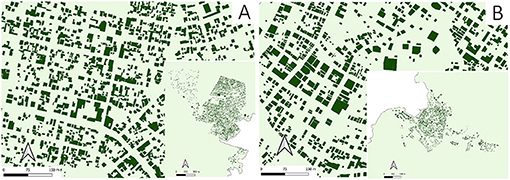
Figure 5. Building footprints (dark green polygons) of Puerto Ayora (A) and Puerto Baquerizo Moreno (B). Puerto Ayora is a larger settlement with more urban sprawl but smaller buildings compared with Puerto Baquerizo Moreno.
In both settlements, a few local small-scale PV systems already exist providing us with ground truth performance metrics. One system is operated by the Universidad San Francisco de Quito (USFQ) on San Cristóbal Island and another by the Charles Darwin Research Station (CDRS) in Puerto Ayora. We use the data for system performance from both installations for comparison and validation of our estimates. The solar panels at USFQ provide an especially good baseline, since we have access to performance reports for all months in 2018 with daily, monthly, and annual data timeseries.
In order to estimate the solar energy potential required to electrify the current transportation demand, we use data from the Galápagos Provincial Government (Granda, 2019) on the total number of registered motorcycles and cars (see Table 3). Puerto Baquerizo Moreno had 501 registered motorcycles and 444 registered cars in 2019. The larger urban settlement of Puerto Ayora has 611 registered motorcycles and 715 cars. In order to calculate the energy demand for a complete electrification of the archipelago, including transportation, we use selected electric vehicles that correspond to the local speed requirements for the uneven roads and distance requirements for taxi drivers that typically make longer travel than average residents (Clairand et al., 2018). The selected models are the Z Electric Vehicle (ZEV) model S-4100 for motorcycles and Kia Soul EV for cars based on previous literature (Clairand et al., 2018).
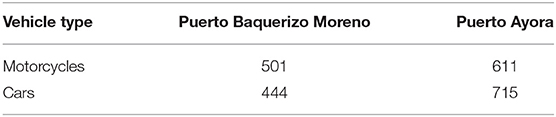
Table 3. Number of registered motor vehicles in 2018 (Granda, 2019).
3. Results
Comparing the estimated result of the theoretical panels using the best parameter choices described in Materials and Methods we find that the estimated PV generation per square meter in kWh/m2 is slightly higher than the actual PV installed systems on both islands. Specifically, we estimate a potential output per unit area of 264 kWh/m2 compared to the USFQ Galápagos Campus panels that yielded 218 kWh/m2 and the Charles Darwin Research Station which yielded 240 kWh/m2. These differences are likely due to the age of the installed panel systems, and their initial lower efficiency relative to newer technology.
While the two case study areas vary greatly in population size, they have comparable total rooftop surface areas of 324 thousand m2 and 393 thousand m2 for Puerto Baquerizo Moreno and Puerto Ayora, respectively (see Table 4). This similarity can be explained by the different functions of the two settlements in the archipelago, and is expressed in the building statistics. Puerto Ayora has a far greater number of buildings: 4677 compared to 2710 in Puerto Baquerizo Moreno. However, Puerto Baquerizo Moreno has a higher mean and median surface area per building than Puerto Ayora. The standard deviation of the rooftop surface area per building is far greater in Puerto Baquerizo Moreno with 146 m2 compared to Puerto Ayora (101 m2). Puerto Baquerizo Moreno is the local capital and home to the largest hospital, a naval military base and other government services, and thus some larger buildings with larger roof space, which are natural targets for solar installations. Puerto Ayora, however, is the main entry point for tourists and has many more residential buildings and small hotels.
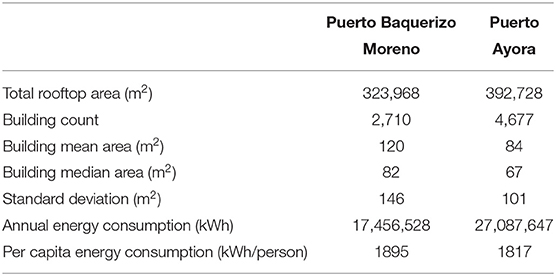
Table 4. Building statistics.
The annual energy demand for Puerto Baquerizo Moreno in 2018 is an estimated 17 million kWh. As all parameters, except for the area of solar panel coverage, A, in equation 1, are known or measured, we can solve for the required area of PV required to meet this total energy demand. The minimum proportion of rooftop surface area coverage needed for solar energy production to meet demand is about 21% of all buildings with calculated performance ratio boundaries of [0.20, 0.26] (see Table 1). In Puerto Ayora, the energy demand in 2018 was estimated to be 25 million kWh. The minimum proportion of surface rooftop area coverage needed for solar energy production to meet demand is about 27% [0.25, 0.33] of all buildings, due to a larger population and smaller rooftop surface area per capita.
We further calculated the PV requirements for 2024 in Puerto Baquerizo Moreno, based on a projection of about 25 million kWh (Vintimilla et al., 2016). To meet this energy demand expansion, about 30% [0.28, 0.36] of the current total rooftop area would be required to be covered by solar panels (Table 2). Additionally, Puerto Ayora had a projected future energy demand of about 39 million kWh in 2024. In order to meet this future demand, 38% [0.36, 0.47] of the current total rooftop area would be required for solar panel coverage.
One of the main sustainability goals in the Galápagos Islands in the context of its urbanization is to fully electrify local transportation. Currently, an average combustion engine vehicle in the Galápagos Islands travels about 20,000 km/year, using an average of 17.21 liters of gasoline per 100 km (Granda, 2019). To compensate this energy demand with solar energy production of the selected car and motorcycle models, we estimate that the proportion of minimum rooftop area coverage increases to 36% [0.35, 0.44] for Puerto Baquerizo Moreno and 47% [0.45, 0.57] for Puerto Ayora (Table 2). This leads to an estimated energy production potential for each urban center of about 30 million kWh and 48 million kWh, respectively.
Finally, it is important to estimate the reliability of solar radiation, and the need to plan sufficient energy production overcapacity and/or storage for achieving uninterrupted service. A certain amount of energy storage is always necessary when relying on local solar production to supply consumption during the night. However, we would like to estimate how much additional storage or additional capacity should be planned to deal with weather events that reduce production over longer periods of time, especially on the time scale of a few days.
Figure 4A shows the daily variation of incident solar energy available for rooftop production during the entire year of 2018. This figure displays solar radiation data for the Galápagos Islands from the NASA POWER database (NASA, 2020). Despite the absence of seasonality, equatorial regions such as the Galápagos experience extended rainy periods with greater cloud cover, which typically occurs between June and October. We also see substantial short-term variation in incident radiation on the time scale of hours to days.
To appreciate these facts, the annual mean incident solar energy assumed in our calculations above is shown as the green line in Figure 4A, where the shaded area shows one standard deviation (67% confidence interval). We see that there is a relatively large daily variation, on top of a seasonal drop during the summer months. We also show the daily solar radiation for the worst period of one, two, etc., days (Figure 4B), which accounts for the worst possible case with a given time duration. This shows that the worst day corresponds to as little as 50% of the annual average, but that the worst daily average over a few days quickly rises to approach about 80% of the annual mean for about a 10 day period or longer. These time periods with very low radiation are rare events as the average and the standard deviation of the worst 20% actual consecutive days shows.
These temporary drops in production will require additional production capacity or, more conventionally, back up from other sources or storage. This could take the form of other energy generating sources, including wind and existing diesel, and/or storage, such as batteries, including possibly those in vehicles.
Consideration of these hedging factors toward uninterrupted renewable energy supply are not likely to be essential during the initial expansion of solar energy production, where existing fossil fuel and wind can be managed to compensate for periods of lower solar generation. They will however become critical to make these communities resilient if and when total energy consumption becomes dependent on (nearly) 100% solar generation.
4. Discussion and Conclusions
To reach the goal of clean, fossil fuel free, and self-sustained energy production in the Galápagos Islands, solar energy production is a natural and viable choice due to the location of the Islands close to the equator. However, space for land development is very limited in the archipelago, as only about 3% of the total area is available for urban uses due to land regulation laws linked to natural preservation. This land scarcity limits the development of large-scale ground mounted PV systems with sufficient capacity to meet the current or future energy demands of the archipelago's population. Other sources of renewable energy production, such as onshore wind, also pose substantial challenges to the ecology, infrastructure and financial development of these remote communities. We quantified here the energy potential of rooftop PV installations on the recently mapped, existing urban fabric of the Galápagos Islands and found that it can be used in principle to satisfy most human energy consumption in the archipelago.
To overcome the knowledge and financial burden of conducting detailed assessments for remote areas, we provide a simple, streamlined method to estimate solar panel coverage and potential that is comparable to actual solar panel data existing on the islands. As more capacity is installed, model parameters can be updated to reflect ground truth in performance, as we started to do here.
Specifically, we found that the two major urban centers of the Galápagos, Puerto Baquerizo Moreno on San Cristóbal Island and Puerto Ayora on Santa Cruz Island, have estimated total solar energy production potentials of about 4.8 and 3.7 times their current local energy demand, respectively. To satisfy present energy demand, 21% (Puerto Baquerizo Moreno) and 27% (Puerto Ayora) of rooftop area would suffice for each urban settlements, using only rooftop PV installations (Table 1). Land transportation accounts for more than 40% of the total energy use on the islands. Thus, for a complete electrification of transportation on the islands, an additional 15% and 20% of rooftop area would be necessary to meet those additional energy demands based on 2018 energy consumption (Table 1). A complete self-sustained, emission free energy production with solar roof installations is therefore possible using less than half the existing roof surface, specifically 36% and 47% of total rooftop area with current panel technology in Puerto Baquerizo Moreno and Puerto Ayoro, respectively (Table 1).
The notable differences between the two islands arise for two reasons. The first is the difference in population sizes. Puerto Ayora has a significantly larger population than Puerto Baquerizo Moreno, 15.4 thousand and 7 thousand in 2015 (Andrade and Ferri, 2019). However, the former has only a marginally higher total rooftop area than the latter (see Table 4). Our results demonstrated that Puerto Baquerizo Moreno has a higher mean, median, and standard deviation for area per building. These statistics reveal that the buildings have a relatively larger surface area in Puerto Baquerizo Moreno than in Puerto Ayora. Since energy production is dependent on area (see Equation 1), this suggests that Puerto Baquerizo Moreno has a higher production potential. Notably, the per capita production is significantly higher in Puerto Baquerizo Moreno because it has nearly half the population of Puerto Ayora and rooftop area is larger on average per building. The main contribution to the PV potential in buildings is the available roof area (Izquierdo et al., 2008), even when shading effects are taken into consideration (Karteris et al., 2013). Given that most of the large roofed buildings are government or non-privately owned buildings, this gives Puerto Baquerizo Moreno a possible head start for the implementation of a publicly-led, self-sustaining, emission free energy production.
As for most remote archipelagos, data availability is limited on the Galápagos Islands. To our knowledge, there exists no tool that provides consistent estimates for solar energy potentials in these circumstances. Additionally, no comprehensive data exists on the 3D structures of the built environment which would otherwise be extremely costly to obtain.
Thus, we made specific assumptions in order to generate our estimates of PV potential. One important assumption is that the proportion of rooftop area required to be covered by PV systems can feasibly install solar panels. In reality, some of the rooftops may lack the structural integrity to support panels. For instance, corrugated metal roofs observed on both urban centers may be unable to bear the additional load of solar panels. Another barrier is the presence of steel reinforcement bars that local builders often leave exposed in order to continue construction in later years. While a large portion of buildings seem to be strong enough for solar installation (Mapillary, 2020), case-by-case assessments are needed before actual implementation.
An additional challenge to rooftop solar implementation on the Galápagos is public perception. In order to install solar panels on privately owned buildings, owners must agree to host them on their roofs. Ecuador is an oil producing country that has low oil prices relative to other countries. Presently, the Ecuadorian government contributes significantly to the supply of fossil fuels and energy generation on the Galápagos through an estimated $15.3 million USD in subsidies annually (Jacome, 2007). The incentive for residents not to change building practices, technologies or energy sources may be high due in part to these subsidies. Informal discussions with local residents made us aware of common current misunderstandings of what solar energy is, how it works, and how much it costs. In the Galápagos, passive social acceptance by residential and commercial consumers may hinder the adoption of rooftop PV without further financial incentives and trust building (Eras-Almeida et al., 2020).
The implementation of our presented results has several relevant policy implications regarding solar energy incentives, local support, and coordination with local governments. Identifying and collaborating with relevant partners to build community support and participation, including among the informal builders who construct most houses, is essential to help inform what potential implementation barriers exist and how to increase the rapid adoption of rooftop solar (Santos et al., 2014). Firstly, because the Galápagos Zero Fossil Fuel Initiative currently has a less robust plan for solar development, our results recommend that the initiative should develop a rooftop PV solar implementation plan that works toward the minimum panel coverage in Tables 1, 2 to achieve full energy independence. A potential deployment approach could be to first develop rooftop PV on San Cristóbal Island given its higher production potential and larger average rooftop surface area. Secondly, fiscal incentives could be provided at the residential and commercial levels to encourage adoption of solar PV. For instance, electricity subsidies could be redirected from diesel to solar energy for funding the upfront costs of installation. These subsidies could be adjusted in conversation with the Ecuadorian government and the local energy provider, ELECGalápagos, to maintain the same or lower average electricity cost of US $0.10/kWh to incentivize residents to adopt rooftop PV systems (Llerena-Pizarro et al., 2019). A net metering scheme has been an effective policy choice to motivate residents to adopt solar in countries such as Chile that has socioeconomic and geographic similarities with Ecuador (Watts et al., 2015). Additionally, the flourishing tourist economies of the archipelago and other island communities can create other fiscal incentives and catalyze innovative solutions that harness current frameworks to fund a sustainable transition for the Islands. In the Galápagos, a “green tourist tax” model could be applied on airfares to the islands or entrance tickets to the Galápagos National Park, which can raise funds that finance renewable energy projects and sustainable tourism. Tourists are more likely to pay an additional tax when improvements in their experiences are indicated and visible (Cetin et al., 2017). Current tourism taxes range from $3 USD for Ecuadorians to $100 USD for international travelers. In a study of the Galápagos Islands, visitors were willing to pay an additional $50 USD fee per visit to support carbon emissions reduction initiatives (Powell and Ham, 2008). Other means of financing solar projects include collaboration with international partners. Clean energy investment in low and middle-income nations increased 6% to USD 61.6 billion in 2019, a record high (REN21, 2019). In the Galápagos, past investments in clean energy have already involved a number of private and public partnerships with foreign countries, detailed in the Introduction, but have not explored the rooftop potential of the already existing built environment as we propose could be done here. Lastly, joint educational programming from the Ecuador Ministry of the Environment and electric power sector about how rooftop solar energy works could be thoroughly discussed with residents. While there is some engagement and education through the Center of Information on Renewable Energy's museum on Santa Cruz Island and regular government media surrounding sustainability, interventions that are perceived to have an impact on daily living have been historically controversial (Heylings and Cruz, 1998). For instance, new marine protection plans have actively been resisted and protested by local fishers despite the environmental protections offered (Burbano and Meredith, 2020). Because rooftop solar at the scale proposed here would necessarily impact residential buildings, greater solar energy information and education may help build trust between market or state providers and local customers or adopters (Hasnain et al., 1998).
Along with increased investment in more analysis, careful case studies from new installations and collaboration between governments, builders and residents, this study makes the quantitative recommendation that rooftop solar is an extremely promising and appropriate pathway for a sustainable Galápagos archipelago over the very short term. Small island communities like the Galápagos face a mosaic of growing challenges in a rapidly changing world. These places are global treasures of biodiversity, support vibrant economies, provide memorable experiences for tourism, and nurture heritage and rich cultures for a combined population of 65 million residents (SID, 2015). With growing tourism and urbanization comes a critical need for these communities to transition away from heavy reliance on fossil fuels and mitigate pollution and biodiversity loss. While our study yields promising findings for practical implementation, it is designed as a launching point to estimate rooftop PV potential in an area that has not yet conducted a systemic analysis of this kind. We presented a streamlined and inexpensive methodology to estimate PV potential that can provide valuable information to decision makers and urban planners, especially in areas where the costs of an initial assessment may be a barrier due to their remoteness and a lack of 3D data coverage. These replicable methods can serve as the catalyst for other small island communities to achieve self-sufficiency and build more resilient futures via the development of scalable sustainable urban infrastructure.
Data Availability Statement
Publicly available datasets were analyzed in this study. This data can be found here GitHub (https://github.com/mansueto-institute/solarGalapagos).
Author Contributions
AT and DZ wrote the manuscript and performed analysis. LB wrote the manuscript and designed the study. All authors contributed to the article and approved the submitted version.
Funding
Grant funding was received from the University of Chicago Center for Research & Fellowships which provided student research grants. The Program on the Global Environment and the Collegiate Social Sciences Division also contributed funding to the research program.
Conflict of Interest
The authors declare that the research was conducted in the absence of any commercial or financial relationships that could be construed as a potential conflict of interest.
Acknowledgments
We thank the Galapagos International Architecture Studio and especially Jaime López and John Dunn for hosting our team and encouraging this study. We thank Patricia Romero-Lankao and Joshua Sperling at the National Renewable Energy Laboratory's Transportation and Hydrogen Systems Center for discussions and technical guidance. We also thank the Diana Petty at the Mansueto Institute for Urban Innovation and Sabina Shaikh and Alison Anastasio at the Program on the Global Environment at the University of Chicago for their support. This study would not have been possible without the help of Luis Tasipanta from the USFQ Galápagos Science Center, who provided us with data from the local PV installation.
References
(2015). Small Island Developing States in Numbers: Climate Change Edition 2015. Technical report, Office of the High Representative for the Least Developed Countries, Landlocked Developing Countries and Small Island Developing States (UN-OHRLLS).
Albarracin, G. (2017). Urban form and ecological footprint: Urban form and ecological footprint: a morphological analysis for harnessing solar energy in the suburbs of cuenca, ecuador. Energy Procedia 115, 332–343. doi: 10.1016/j.egypro.2017.05.030
Andrade, J. E. L., and Ferri, D. Q. (2019). “The galapagos urban context,” in Urban Galapagos (New York, NY: Springer), 9–22.
Apolo, H., Arcentales, D., and Escobar Segovia, K. (2019). “Galapagos electricity sector towards a zero fossil fuel island,” in 17th LACCEI International Multi-Conference for Engineering, Education, and Technology: “Industry, Innovation, And Infrastructure for Sustainable Cities and Communities” (Jamaica).
Benalcazar, P., Suski, A., and Kamiński, J. (2020). Optimal sizing and scheduling of hybrid energy systems: The cases of morona santiago and the galapagos islands. Energies 13:3933. doi: 10.3390/en13153933
Briguglio, L. (1995). Small island developing states and their economic vulnerabilities. World Dev. 23, 1615–1632. doi: 10.1016/0305-750X(95)00065-K
Burbano, D. V., and Meredith, T. C. (2020). Conservation strategies through the lens of small-scale fishers in the galapagos islands, ecuador: perceptions underlying local resistance to marine planning. Soc. Natural Resour. 33, 1194–1212. doi: 10.1080/08941920.2020.1765058
Camarena-Gamarra, C., Calle-Maravi, J., and Nahui-Ortiz, J. (2020). Benchmarking of solar pv performance ratio among different regions in peru: sample of five small-scale systems. Diesel Engine 208, 1–09. doi: 10.18687/LACCEI2020.1.1.245
Carl, C. (2014). Calculating Solar Photovoltaic Potential on Residential Rooftops in Kailua Kona, Hawaii. Master's thesis, University of Southern California.
Carvajal, P. (2012). Galapagos Islands Zero Fossil Fuels Initiative. Available online at: https://www.irena.org/-/media/Files/IRENA/Agency/Events/2012/Sep/6/Pablo_Carvajal.pdf?la=en&hash=C5DFD9860EB3EB3C4DD9BFD9EA3DB19A0C9ABB0E
Castellanos, S., Sunter, D. A., and Kammen, D. M. (2017). Rooftop solar photovoltaic potential in cities: how scalable are assessment approaches? Environ. Res. Lett. 12:125005. doi: 10.1088/1748-9326/aa7857
Cetin, G., Alrawadieh, Z., Dincer, M. Z., Istanbullu Dincer, F., and Ioannides, D. (2017). Willingness to pay for tourist tax in destinations: empirical evidence from istanbul. Economies 5:21. doi: 10.3390/economies5020021
Cevallos-Sierra, J., and Ramos-Martin, J. (2018). Spatial assessment of the potential of renewable energy: the case of ecuador. Renew. Sustain. Energy Rev. 81, 1154–1165. doi: 10.1016/j.rser.2017.08.015
Chumo, E. A. M., Vélez, N. R. B., and Mera, G. E. P. (2018). Eficiencia energética en función del desarrollo del plan maestro de electrificación (pme) en ecuador. Rev. Invest. Energía, Medio Ambiente Tecnol. 3, 1–12. doi: 10.33936/riemat.v3i2.1624
Clairand, J.-M., Rodriguez-García, J., and Alvarez, C. (2018). Electric vehicle charging strategy for isolated systems with high penetration of renewable generation. Energies 11:3188. doi: 10.3390/en11113188
Consejo Nacional de Electricidad (2017). Estadística Del Sector Electrico Ecuatoriano. Consejo Nacional de Electricidad.
Dierauf, T., Growitz, A., Kurtz, S., Cruz, J. L. B., Riley, E., and Hansen, C. (2013). Weather-Corrected Performance Ratio. Technical report, National Renewable Energy Lab. (NREL), Golden, CO (United States).
Dobos, A. P. (2014). Pvwatts Version 5 Manual. Technical report, National Renewable Energy Lab. (NREL), Golden, CO (United States).
Edgar, G., Snell, H., and Lougheed, L. (2002). Introduction-Biological Impacts of the Jessica Oil Spill on the Galapagos Environment. Puerto Ayora: Charles Darwin Foundation. 1–2.
Environmental Protection Agency (2017). Green Power Equivalency Calculator. Available online at: https://www.epa.gov/greenpower/green-power-equivalency-calculator (accessed March, 2020).
Epler, B. (2007). Tourism, the economy, population growth, and conservation in Galapagos. Charles Darwin Foundat. 10.
Eras-Almeida, A. A., Egido-Aguilera, M. A., Blechinger, P., Berendes, S., Caamaño, E., and García-Alcalde, E. (2020). Decarbonizing the galapagos islands: techno-economic perspectives for the hybrid renewable mini-grid baltra–santa cruz. Sustainability 12:2282. doi: 10.3390/su12062282
Freitas, S., Catita, C., Redweik, P., and Brito, M. C. (2015). Modelling solar potential in the urban environment: state-of-the-art review. Renew. Sustain. Energy Rev. 41, 915–931. doi: 10.1016/j.rser.2014.08.060
Gagnon, P., Margolis, R., Melius, J., Phillips, C., and Elmore, R. (2016). Rooftop Solar Photovoltaic Technical Potential in the United States. A Detailed Assessment. Technical report, National Renewable Energy Lab. (NREL), Golden, CO (United States).
García, J. L., Jurado, F., and Larco, V. (2019). “Review and resource assessment, solar energy in different region in Ecuador,” in E3S Web of Conferences, vol. 80, (Les Ulis: EDP Sciences), 01003.
Google (2020). Project Sunroof. Retrieved from: https://www.google.com/get/sunroof (accessed March, 2020).
Granda, M. (2019). Galapagos plan: Plan of Sustainable Development and Territorial Ordering of the Special Regime of GALAPAGOS 2015-2020. San Cristobal.
Hasnain, S. M., Alawaji, S. H., and Elani, U. (1998). Solar energy education-a viable pathway for sustainable development. Renew. Energy 14, 387–392. doi: 10.1016/S0960-1481(98)00094-9
Hernandez, R. R., Easter, S., Murphy-Mariscal, M. L., Maestre, F. T., Tavassoli, M., Allen, E. B., et al. (2014). Environmental impacts of utility-scale solar energy. Renew. Sustain. Energy Rev. 29, 766–779. doi: 10.1016/j.rser.2013.08.041
Heylings, P., and Cruz, F. (1998). “Common property, conflict and participatory management in the galapagos islands,” in Proceedings of Crossing Boundaries, the Seventh Annual Conference of the International Association for the Study of Common Property, Vancouver, BC, Canada, June, 10–14.
Hu, Y., Martín, M. G., Sánchez, M. J., and Solana, P. (2015). “Operational issues for the hybrid wind-diesel systems: lessons learnt from the san cristobal wind project,” in Enhancing Synergies in a Collaborative Environment, (New York, NY: Springer), 291–298.
Icaza, D., Borge-Diez, D., and Galindo, S. P. (2021). Proposal of 100% renewable energy production for the city of cuenca-ecuador by 2050. Renew. Energy 170, 1324–1341. doi: 10.1016/j.renene.2021.02.067
Izquierdo, S., Rodrigues, M., and Fueyo, N. (2008). A method for estimating the geographical distribution of the available roof surface area for large-scale photovoltaic energy-potential evaluations. Solar Energy 82, 929–939. doi: 10.1016/j.solener.2008.03.007
Izurieta, J. C. (2017). Behavior and Trends in Tourism in Galapagos Between 2007 and 2015. Galapagos Report 2015-2016, 83–89.
Jacobson, M. Z., and Jadhav, V. (2018). World estimates of PV optimal tilt angles and ratios of sunlight incident upon tilted and tracked PV panels relative to horizontal panels. Solar Energy 169, 55–66. doi: 10.1016/j.solener.2018.04.030
Jacome, C. (2007). Galapagos Report 2006-2007: Energy Subsidies in Galapagos. Technical report, Galapagos Conservancy.
Joint Research Centre (2020). Photovoltaic Geographical Information System. Available online at: http://re.jrc.ec.europa.eu/pvgis (accessed March, 2020).
Karatayev, M., Hall, S., Kalyuzhnova, Y., and Clarke, M. L. (2016). Renewable energy technology uptake in kazakhstan: policy drivers and barriers in a transitional economy. Renew. Sustain. Energy Rev. 66, 120–136. doi: 10.1016/j.rser.2016.07.057
Karteris, M., Slini, T., and Papadopoulos, A. (2013). Urban solar energy potential in Greece: a statistical calculation model of suitable built roof areas for photovoltaics. Energy Build. 62, 459–468. doi: 10.1016/j.enbuild.2013.03.033
Kvan, T., and Karakiewicz, J. (2019). Urban Galápagos: Transition to Sustainability in Complex Adaptive Systems, 1 edn, New York, NY: Springer International Publishing.
Lahmeyer International GmbH (2006). Project Design Document (PDD): e7 Galapagos/San Cristobal Wind Power Project Galapagos Islands/Ecuador. 384 Technical Report. United Nations Clean Development Mechanism (CDM). Available online at: https://webapps.sgs.com/quality-network/full/e7%20Galapagos%20and%20San%20Cristobal%20Wind%20Power%20Project.pdf (accessed March, 2020).
Lee, S., Iyengar, S., Feng, M., Shenoy, P., and Maji, S. (2019). “Deeproof: a data-driven approach for solar potential estimation using rooftop imagery,” in Proceedings of the 25th ACM SIGKDD International Conference on Knowledge Discovery & Data Mining, KDD'19, (New York, NY: Association for Computing Machinery), 2105–2113.
Lewis, N. S., and Nocera, D. G. (2006). Powering the planet: chemical challenges in solar energy utilization. Proc. Natl. Acad. Sci. U.S.A. 103, 15729–15735. doi: 10.1073/pnas.0603395103
Llerena-Pizarro, O. R., Micena, R. P., Tuna, C. E., and Silveira, J. L. (2019). Electricity sector in the galapagos islands: current status, renewable sources, and hybrid power generation system proposal. Renew. Sustain. Energy Rev. 108, 65–75. doi: 10.1016/j.rser.2019.03.043
Mapdwell LLC (2020). Retrieved from: https://mapdwell.com/en (accessed March, 2020).
Mapillary (2020). Retrieved from: https://www.mapillary.com/app/ (accessed March, 2020).
Microsoft Bing (2021). Retrieved from: https://www.bing.com/maps/aerial (accessed March, 2020).
Mirza, U. K., Ahmad, N., Harijan, K., and Majeed, T. (2009). Identifying and addressing barriers to renewable energy development in pakistan. Renew. Sustain. Energy Rev. 13, 927–931. doi: 10.1016/j.rser.2007.11.006
NASA (2020). Retrieved from: https://power.larc.nasa.gov/ (accessed March, 2020).
Notton, G. (2015). Importance of islands in renewable energy production and storage: the situation of the French islands. Renew. Sustain. Energy Rev. 47, 260–269. doi: 10.1016/j.rser.2015.03.053
NREL (2018). PVWatts calculator. Retrieved from: https://pvwatts.nrel.gov/ (accessed March, 2020).
NREL (2020). Annual Technology Baseline Calculator. Retrieved from: https://atb.nrel.gov/electricity/2020/index.php (accessed March, 2020).
Olomiyesan, B. M., and Oyedum, O. D. (2016). Comparative study of ground measured, satellite-derived, and estimated global solar radiation data in Nigeria. J. Solar Energy 2016:8197389. doi: 10.1155/2016/8197389
Phuangpornpitak, N., and Kumar, S. (2011). User acceptance of diesel/PV hybrid system in an island community. Renew. Energy 36, 125–131. doi: 10.1016/j.renene.2010.06.007
Powell, R. B., and Ham, S. H. (2008). Can ecotourism interpretation really lead to pro-conservation knowledge, attitudes and behaviour? evidence from the galapagos islands. J. sustain. Tour. 16, 467–489. doi: 10.1080/09669580802154223
Psomopoulos, C. S., Ioannidis, G. C., Kaminaris, S. D., Mardikis, K. D., and Katsikas, N. G. (2015). A comparative evaluation of photovoltaic electricity production assessment software (PVGIS, PVWatts and RETScreen). Environ. Proc. 2, 175–189. doi: 10.1007/s40710-015-0092-4
Reich, N. H., Mueller, B., Armbruster, A., Van Sark, W. G., Kiefer, K., and Reise, C. (2012). Performance ratio revisited: is pr> 90% realistic? Progr. Photovolt. Res. Appl. 20, 717–726. doi: 10.1002/pip.1219
REN21 (2019). Renewables 2019 Global Status Report. Available online at: https://www.ren21.net/wp-content/uploads/2019/05/gsr_2019_full_report_en.pdf (accessed March, 2020).
Santos, T., Gomes, N., Freire, S., Silveira Santos, L., and Tenedório, J. (2014). Applications of solar mapping in the urban environment. Appl. Geogr. 51, 48–57. doi: 10.1016/j.apgeog.2014.03.008
Solargis World Bank Group (2020). Global Solar Atlas. Retrieved from: https://globalsolaratlas.info/download/ecuador (accessed March, 2020).
Vintimilla, L., Loeffelman, P., Engelhard, P., and Bonemazzi, F. (2016). Galápagos San Cristóbal Island Wind Project 2003-2016. Technical report, Global Sustainable Electricity Partnership (GSEP).
Watkins, G., and Cruz, F. (2007). Galapagos at Risk: A Socioeconomic Analysis. Technical report, Charles Darwin Foundation, Available online at; https://www.galapagos.org/wp-content/uploads/2012/01/Galapagos-at-Risk.pdf.
Watts, D., Valdés, M. F., Jara, D., and Watson, A. (2015). Potential residential pv development in chile: the effect of net metering and net billing schemes for grid-connected pv systems. Renew. Sustain. Energy Rev. 41, 1037–1051. doi: 10.1016/j.rser.2014.07.201
Wolf, F., Surroop, D., Singh, A., and Leal, W. (2016). Energy access and security strategies in small island developing states. Energy Policy 98, 663–673. doi: 10.1016/j.enpol.2016.04.020
Keywords: built environment, infrastructure electrification, sustainable development, islands, transportation
Citation: Tian A, Zünd D and Bettencourt LMA (2021) Estimating Rooftop Solar Potential in Urban Environments: A Generalized Approach and Assessment of the Galápagos Islands. Front. Sustain. Cities 3:632109. doi: 10.3389/frsc.2021.632109
Received: 22 November 2020; Accepted: 24 May 2021;
Published: 22 June 2021.
Edited by:
Jin Yang, China University of Geosciences, ChinaReviewed by:
Shauhrat S. Chopra, City University of Hong Kong, ChinaJesus Ramos-Martin, Universitat Autònoma de Barcelona, Spain
Copyright © 2021 Tian, Zünd and Bettencourt. This is an open-access article distributed under the terms of the Creative Commons Attribution License (CC BY). The use, distribution or reproduction in other forums is permitted, provided the original author(s) and the copyright owner(s) are credited and that the original publication in this journal is cited, in accordance with accepted academic practice. No use, distribution or reproduction is permitted which does not comply with these terms.
*Correspondence: Luís M. A. Bettencourt, YmV0dGVuY291cnRAdWNoaWNhZ28uZWR1