 João Pedro Gouveia
 Júlia Seixas
 Pedro Palma
 Henrique Duarte
 Henrique Luz2
 Giovan Battista Cavadini
- 1CENSE—Center for Environmental and Sustainability Research, NOVA School of Science and Technology, NOVA University Lisbon, Caparica, Portugal
- 2NOVA School of Science and Technology, NOVA University Lisbon, Caparica, Portugal
The Positive Energy District (PED) concept has been pointed out as key for cities' energy system transformation toward carbon neutrality. The PED may be defined as an energy-efficient and flexible urban area with net-zero energy import and greenhouse gas emissions, aiming toward annual local surplus of renewable energy. Most of the studies and practical experiences about PEDs are based on newly built districts, where the planning and integration of innovative solutions are less complex and more cost-effective. However, to achieve Europe Union's 2050 carbon-neutral ambition, we argue that the transformation of the settled districts is essential, including historic districts, which present common challenges across European cities, such as degraded dwellings, low-income families, and gentrification processes due to massive tourism flows. This paper aims to discuss how the PED model can be an opportunity for historic districts to reduce their emissions and mitigate energy poverty. The historic district of Alfama, in the city of Lisbon (Portugal), is used as a case study to show the potential of energy renovation measures and solar PV production in households, cornerstones of a PED. The annual energy needs potential reduction due to building retrofit is 84 and 19% for space heating and cooling, respectively, while the integration of building-integrated PV technologies in rooftops and windows potentially generates up to 60 GWh/year. At the district scale, these two components of the PED concept could require an investment of 60M€ to 81M€ depending on the PV technologies in the rooftops, a sensitive aspect in historical districts. Unlike other mechanisms to tackle energy poverty, like the social tariffs, the adoption of structural measures like building energy efficiency retrofit and renewable energy integration will contribute to solve the energy poverty problem, which is significant in Alfama, in both the winter and summer. The highlighted investments require an innovative financial scheme to support not only buildings' owners but also tenants, as these are among the most vulnerable to energy poverty. However, the social benefits of that investment, on the health system, air quality, climate resilience, labor productivity, and social integration, would be invaluable.
Introduction
It is estimated that 55.3% of the world population lives in urban settlements, and projections state that by 2030 one third of the global population will live in cities with at least half a million inhabitants (UNDESA, 2019). Cities have a relevant environmental impact and are estimated to be responsible for 2/3 of the global energy consumption and 70% of the global carbon dioxide (CO2) emissions (Satterthwaite, 2008). On the other hand, they have a large potential to drive global action against climate change and develop innovative solutions to reach the Paris Agreement Goals (UNFCCC, 2016) of limiting global warming. Moreover, cities are a fundamental player to reach the Sustainable Development Goals (SDG). SDG 11 explicitly states that cities should become inclusive, safe, resilient, and sustainable by 2030 (UN SDGs, 2015), and its sustainable development is critical for other SDGs and target achievement (Frischmann et al., 2020).
In the last decade, efforts to develop solutions to reduce the environmental impacts of cities have multiplied, with the smart city concept being a promising one to cut greenhouse gas (GHG) emissions. Smart city solutions are a set of integrated and holistic cutting-edge urban development strategies, often based on ICT (information and communication technologies) applications, which contribute to urban sustainability and citizen welfare (Mosannenzadeh et al., 2017). Embedded in this concept, the smart energy city strategy focuses on site-specific transition toward sustainability, self-sufficiency, and resilience of energy systems, which should ensure accessibility, affordability, and adequacy, through optimized integration of energy conservation and energy efficiency (EE) measures, local renewable energy sources (RES), and promotion of energy flexibility (Mosannenzadeh et al., 2017).
To accelerate the decarbonization of urban areas and foster the scalability potential across cities, the Positive Energy District (PED) concept was developed as part of the smart energy city strategy. JPI Urban Europe (2021), the hub for urban transitions in Europe, defines the PED as an energy-efficient and flexible urban area that has net-zero GHG emissions and actively manages to generate an annual local surplus of renewable energy. It also specifies that the PED requires the integration of different systems (e.g., buildings, energy, mobility, ICT) and interactions between different stakeholders while optimizing the liveability of the urban environment (Bossi et al., 2020). Besides technical aspects, it is widely recognized that social aspects play an essential role in successfully implementing the PED. These districts are innovative frameworks for the development of cities toward clean energy consumption and increased energy security while contributing to improve the quality of life of the population within the city. They are a fundamental part of creating a comprehensive approach toward sustainable urbanization; dealing with the technological, spatial, regulatory, financial, legal, social, and economic perspectives (Alpagut et al., 2019); and paving the way toward the goal of 100 climate neutral cities in Europe (European Commission, 2020a). The PED concept plays a relevant role in the vision of climate-neutral cities, which are an essential step on the way to the Green Deal goal of a climate-neutral Europe by 2050 (European Commission, 2019).
In the last years, many feasibility studies and pilot projects about PED implementation have been conducted in many cities across Europe. The action 3.2 of the EU's Strategic Energy Technology Plan (European Union, 2018) supports the planning, deployment, and replication of 100 positive energy districts by 2025 (Bossi et al., 2020). Most studies and practical experiences about PED are based on projects in newly built districts, where the planning and integration of innovative solutions are less complex and the ambition is usually higher (Bossi et al., 2020). However, to achieve Europe's 2050 decarbonization challenge, a transformation of the urban systems is required, including the already settled districts. Therefore, as part of the urban transformation, a renovation wave of the existing building stock is pursued in the next years (European Commission, 2020b), aiming to improve the energy efficiency of the current European building stock, estimated to be around 75% energy inefficient (European Commission, 2020b). According to Mckinsey (2020), the European Union (EU) buildings' emissions must be reduced by 29% by 2030 and the sector should achieve climate neutrality (i.e., net-zero (GHG) emissions) by 2050 (C40 cities, 2020). The bulk of this reduction could be achieved by retrofitting and replacing the heating systems in existing buildings, which will still account for 75–90% of EU building stock in 2050 (Mckinsey, 2020).
Within the existing building stock, buildings in historic districts present particularly challenging characteristics to ambitious energy refurbishment and therefore are usually not considered in PED projects (Bossi et al., 2020). The combination of characteristics of many historic districts, like those located in southern Europe (e.g., narrow streets with few green public spaces, ancient and degraded heritage buildings, elderly population, high tourism dependency), negatively impacts the quality of life of its inhabitants and exacerbates problems such as reduced climate resilience; low energy performance and poor thermal comfort of buildings (Gouveia and Palma, 2019), energy poverty vulnerability (Gouveia et al., 2018, 2019), and congested streets with negative effects on air quality and noise. These environmental and well-being problems, coupled with severe regulatory limitations to implement EE measures and to integrate RES in historical buildings, represent serious restrictions to unlock the potential interventions (Gregório and Seixas, 2017) aimed at implementing the PED concept, which has the potential to improve the inhabitants' quality of life. Nevertheless, historic districts could profoundly benefit from the integration of PED solutions being a promoter of dynamics of change (Eurocities, 2020).
One of the critical socioeconomic issues in historic districts, especially in Southern and Eastern Europe, is energy poverty. Energy poverty generally refers to a situation in which households are not able to adequately heat their homes or meet other necessary energy services at an affordable cost (Pye et al., 2015). This phenomenon is mainly due to high energy prices, low incomes, and poor energy efficiency in buildings (Dobbins et al., 2019). The negative impacts on the affected households are health problems, enhanced poverty risk, increased inequalities, inadequate participation in society due to stigma, reduced climate action ambitions, and lower quality of life (e.g., Bouzarovski and Petrova, 2015). Some of the key measures previously identified to achieve a PED could potentially address energy poverty, such as an increase of decentralized RES generation and a larger integration of EE measures (European Commission, 2020c).
The connection between energy poverty and PED is still scarce in most studies and EU projects, with only a few (e.g., MAKING-CITY, 2018, launched in 2018, and POCITYF, 2019, started in 2019) including in the project KPIs the reduction of energy poverty during the project. However, it is considered as a consequence of the PED implementation and no direct relationship is described. Therefore, in the integration assessment of PED solutions, it is important to include energy poverty reduction targets and extensive citizen engagement for better identification and support of the most vulnerable households, while certifying that PED solutions do not amplify inequalities and increase vulnerabilities. Thus, there are no studies the authors are aware of in the current published literature linking the PED potential to a solution model to reduce energy poverty in historic districts.
This study aims to cover two key questions of the PED concept implementation, applied in historic districts in southern Europe Mediterranean cities: (i) what is the potential of building energy efficiency retrofit measures and solar energy generation and (ii) how these solutions could potentially drive the reduction at scale of energy poverty. The analysis is performed within the framework of the Sustainable Historic Districts project (2018–2020), co funded by EIT Climate-KIC, which addressed the challenges of historic districts in five Mediterranean European cities for a holistic and sustainable transformation pathway (Lisbon, Savona, Sassari, Ptuj, Nicosia) (SUSHI, 2020). In this paper, the historical district of Alfama will be used as a case study. This assessment advances the state of the art by presenting valuable knowledge on critical components of PED development within a historic district, through a high spatial scale analysis of building retrofit and solar energy integration potential (i.e., for over 120 statistical subsections of the district). It also brings together an integrative discussion between PED implementation and energy poverty mitigation. The case study application improves the understanding of the energy retrofit and solar photovoltaic (PV) specificities for a European Mediterranean city with a deep need for both building stock renovation and solar integration at a large scale, aiming to identify where efforts to mitigate energy poverty should focus.
The paper is structured into four sections. The next section presents the case study of the historical district of Alfama (Lisbon) and describes the methodologies used to estimate the techno-economic potential of both EE and RES generation at district scale. The results are described in section Results, whereas section General Discussion unfolds a critical discussion and conclusions on the role of PEDs in historic districts and its potential for energy poverty mitigation.
Methods
In an effort to deliver key defining aspects of the PED framework as an embedment of an urban energy system, driven by a high level of EE and RES, the methodological approach of this study was divided into three major steps: (i) a case study analysis and identification of the energy poverty vulnerability, setting the scene for further detailed assessment; (ii) a spatially explicit analysis for 121 statistical subsection levels for buildings' renovations (windows, walls, roofs), and (iii) building-integrated photovoltaic (BIPV) electricity generation, considering the best measures and technologies to be integrated within a historical district context.
Case Study Location and Characteristics
Portugal receives some of the highest levels of solar irradiation in Europe and also boasts a high number of solar hours, with values between 2,200 and 3,000 h of sunlight per annum, and as such makes it an excellent candidate for solar energy projects (Cavaco et al., 2016).
The case study location is the Alfama historic district, in the city center of Lisbon. It is a traditional district with an important role in the cultural heritage and identification of the city of Lisbon. It is one of the oldest districts, with unique history and characteristics; it spreads between São Jorge Castle and the Tagus riverfront (in the civil parishes of Santa Maria Maior and São Vicente). Resembling a typical Arab medieval city, Alfama is known for its morphology due to its maze-like narrow streets, being one of the few areas of the city that has survived the 1755 earthquake. For these reasons, it is one of the main touristic locations of the city.
Historically, its population came from an important rural exodus during the middle of the last century. This rural origin is embodied in a way of life, characterized by strong neighbor relations and a sense of solidarity, reproducing the practices of the population origins. Still today, Alfama has an aging population that remains in the neighborhood, maintaining active commercial establishments. The Alfama population has been shrinking over the years. Despite its decrease in population, however, its population density is still very high (13,854 persons/km2) when compared to Lisbon's average population density (5,477 persons/km2). The high-density areas occur since the streets are very narrow and thus the buildings are very tight with each other (INE, 2011).
Due to their social culture and habits, the traditional inhabitants of Alfama are an important asset of Lisbon intangible heritage. However, gentrification and mass tourism are putting Alfama and its inhabitants under pressure, due to real estate needs, which tends to replace traditional low-income inhabitants with local accommodation schemes (e.g., Airbnb) and hotels. Currently, tourist accommodations represent 26% of the total available households (Gago and Cocola-Gant, 2019). If all the tourist accommodation houses are at full capacity, they can accommodate almost the same number of tourists/visitors as local inhabitants.
The cultural profile of the district and the tourism play a major role in the selection of building renovation measures and renewable energy technologies in the district, with public opinion having a considerable weight in what technologies should be integrated, e.g., reluctance to change the building façade or to install solar panels and/or small wind turbines on roofing. These aspects are regulated in specific guidelines that limit the rollout of building retrofit interventions and renewable technologies in the district.
Energy Poverty in Alfama
In connection with the building stock thermal performance and energy use in homes, energy poverty stands out as a serious issue affecting the Portuguese population. According to the EU SILC indicators, the estimated energy-poor population ranges approximately between 2.0 and 3.7 million inhabitants, which is between 18.8 and 35.7% of the total Portuguese population (Eurostat, 2021a,b). This issue is particularly serious in historic districts such as Alfama, due to the socioeconomic profile of the inhabitants and the underperforming building stock. Figure 1 depicts the Energy Poverty Vulnerability Index (EPVI) developed by Gouveia et al. (2019), zoomed in on the Lisbon municipality region and highlighting the Alfama district, for the purpose of this paper. The EPVI is an aggregated assessment of the dwelling stock's energy performance, households' energy consumption (DGEG, 2021), and the ability of the population to implement alleviation measures, defined by a set of socioeconomic indicators from INE (2011).
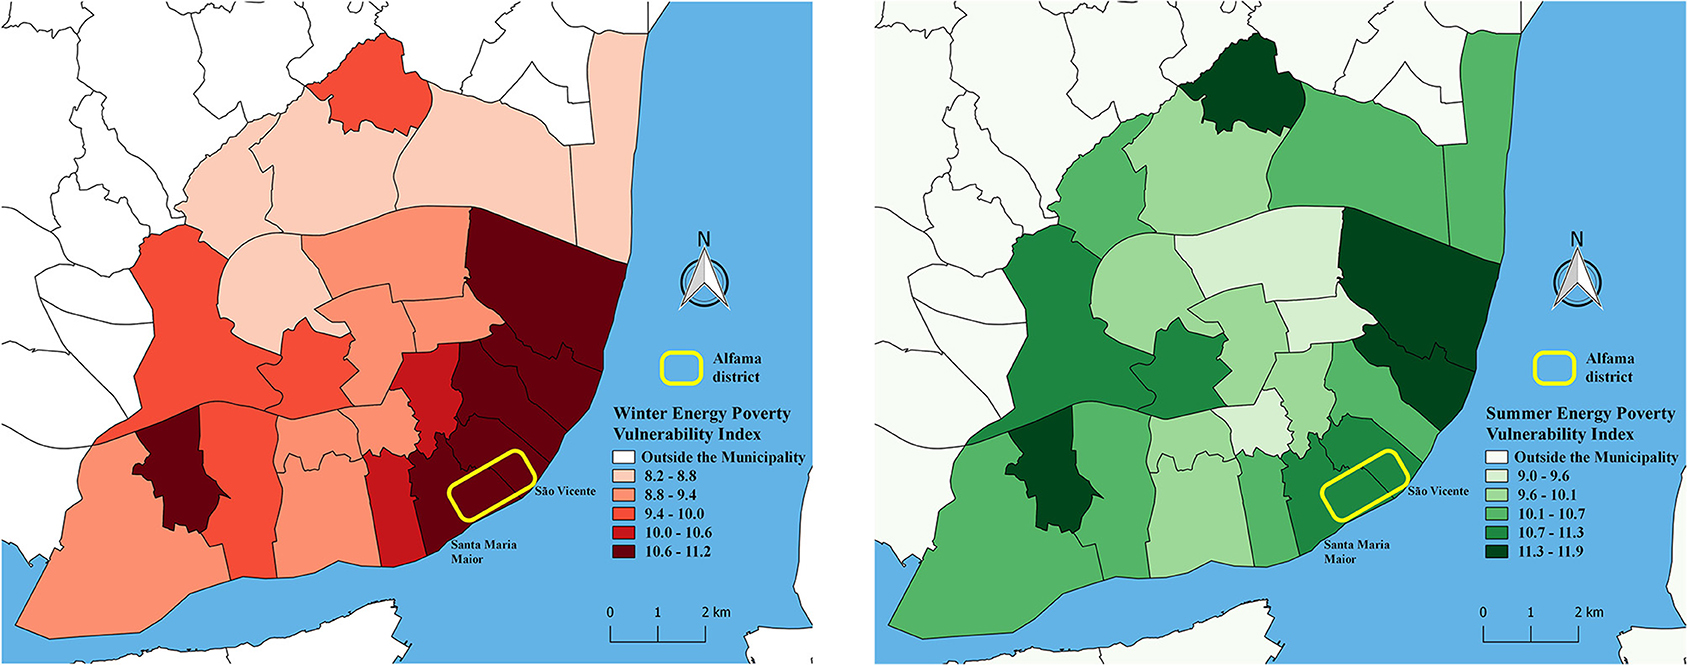
Figure 1. Winter (left) and Summer (right) Energy Poverty Vulnerability index in Lisbon's civil parishes [adapted from Gouveia et al. (2019) and CML (2020)].
The Lisbon Municipality is one of the least vulnerable municipalities of the country, due to high levels of alleviation measure implementations, determined by a favorable combination of socioeconomic indicators, such as average monthly income and share of the population with a University degree, as well as its location in milder climatic zones, particular for winter. Nevertheless, the energy poverty vulnerability index levels of the municipality still point to a significant energy poverty issue among the population. Within the municipality, the most vulnerable civil parishes in winter are located in the southeastern region, including Santa Maria Maior and São Vicente, where the Alfama district is located. These are the civil parishes with the oldest building stock, as well as a higher concentration of elderly people, with lower incomes and education level. In the summer, although not being in the highest interval of vulnerability, Alfama's civil parishes still present significantly high indexes of vulnerability.
An important cause of the high index levels is the existent energy performance gap, described by Palma et al. (2019), which consists in the difference between the real energy consumption for space heating and cooling, and the energy that should be consumed to guarantee the thermal comfort inside the dwellings. These gaps (expressed in percentages) are high across the whole country, and Lisbon's civil parishes are not the exception, presenting space heating and cooling energy performance gaps above 80%. These gaps stem from the combination of the low energy performance of buildings, which leads to high building energy needs (common in older buildings) and the low real energy consumptions for climatization, related to the energy affordability issue. For instance, in the first semester of 2020, Portugal had the highest price of natural gas for households in the EU, considering the purchasing power standard (PPS) (Eurostat, 2021c), while the electricity price was ranked fourth highest (Eurostat, 2021d). Furthermore, while ownership rates of cooling systems are historically low (18.7% in the metropolitan area of Lisbon), the ownership of decentralized low-efficiency heating systems is generalized (INE, 2017), including a significant share of electric oil heaters (ADENE, 2017). Coupled with low incomes, these indicators point to potential difficulty in affording adequate energy services. In a survey conducted by the national energy agency (ADENE, 2017), the participants claimed to spend on average 87€/month, which can represent a considerable burden for certain groups, such as elderly people who receive low pensions. The majority of the interviewed claimed to be worried about energy efficiency, in the perspective of reducing burdening energy bills. Additionally, cultural conditioning is also partially responsible for low consumption as people resist to heat or cool their homes, not only due to energy prices but also because thermal comfort is not a priority compared to other basic needs; it can be considered as a waste of money, particularly among elderly people, as evidenced by Horta et al. (2019).
From the policy perspective, the social tariff for electricity and natural gas use is the only measure that directly addresses the energy vulnerability of the population. Moreover, there are several policy instruments and schemes providing support for building renovation, in the form of soft loans and non-refundable grants. However, these options are not viable for low-income families. Nevertheless, the annual energy renovation rate of buildings in Portugal is ~0.01% (INE, 2019), well below the EU average, which is around 1% (European Commission, 2020b). This difference raises questions about the effectiveness of these schemes, strengthened by the persistently high results of the energy poverty proxy indicators each year.
Representative Building Typologies
The first step of the methodology was the identification of representative building typologies of the residential building stock in the Alfama district, based on the predominant building characteristics obtained with the CENSUS 2011 (INE, 2011). The analysis focuses on the characteristics that are potentially relevant for the purpose of this study, such as construction period, building form, number of floors, and roof type (as developed in Gouveia et al., 2018). The census data (INE, 2011) portrays details for 1 863 buildings in the district. The majority of the buildings are multi-apartment buildings (62%) followed by terraced houses (24%), semidetached (5%), detached (5%), and other types (4%). For this category, all types of houses were combined since their differences and impact on energy needs would not considerably differ in such an urban-dense area. The year of construction is used as a proxy for material types and construction techniques. About 48% of the buildings were built before 1919 and 30% between 1919 and 1945. Overall, around 89% of buildings were built before 1960, before the application of energy efficiency and thermal performance regulations (i.e., 1990), evidenced by the energy inefficiency levels of all typologies. The number of floors and roof type influence the overall height of the building, and together with the height of surrounding buildings, these characteristics are important to compute the space heating and cooling energy needs. As almost all roof types (97%) are sloped roofs with ceramic or concrete tiles, this criterion was not considered relevant for further distinguishing building typologies. However, the number of floors has a wider variety, with the bulk of the buildings having up to 2 floors (42%) or 3 to 4 (42%); therefore, three classes were kept for characterizing the building typologies, i.e., “1 or 2,” “3 or 4,” and “equal or >5” floors. These criteria, combined with the analysis of the available data, enabled to identify six building typologies (TP), as illustrated in Table 1, accounting for 1 585 buildings in the Alfama district, which represents 85% of the total buildings in the area. The remaining 15% of the buildings have very distinct features, are not significantly widespread, and therefore are not considered in the analysis. A relevant criterion for the selection of typologies was the frequency of more than 7% representation in each civil parish of Alfama and the availability of data for its characterization.
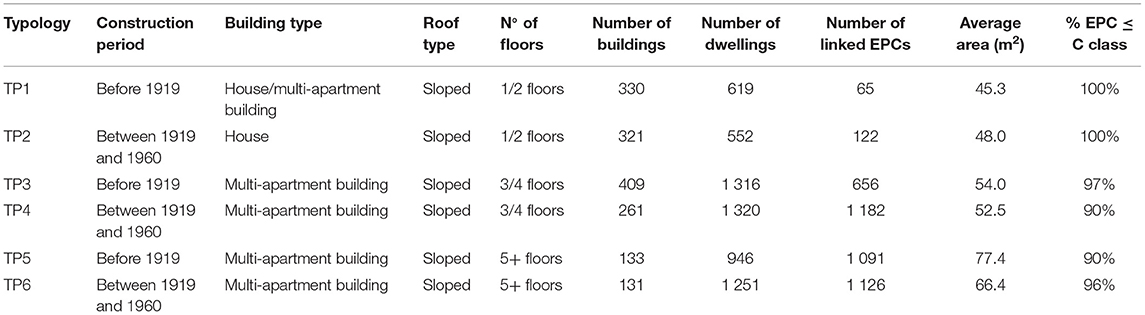
Table 1. Main characteristics of the representative residential building typologies for Alfama District.
Energy Efficiency Retrofit Potential of Residential Buildings
Several authors, such as Lazzeroni et al. (2017), Liang et al. (2018), and Asdrubali et al. (2019), have assessed the effects of retrofit in the energy needs or consumption of buildings, spanning various geographical contexts and spatial scales, as well as considering different types of buildings and measures.
Herein, detailed information from 4,142 energy performance certificates (EPCs) available for the district (ADENE, 2019) was used to characterize the energy performance of each residential building typology. Based on the main characteristics of each typology (Table 1), each energy certificate was associated with a specific building typology and the housing envelope elements (windows, walls, and roofs) corresponding to each EPC were analyzed. The parameters of interest were recorded, such as the total area of each component, the type of element, and the coefficient of thermal transmittance (U-value). After analyzing all the certificates associated with each typology for each building component, the average thermal transmission coefficients and the average total area of each component were used to estimate the nominal space heating and cooling energy needs. These were estimated before and after potential retrofitting interventions were estimated as well as the investment costs of the renovation measures applied to the building envelope. The energy needs were estimated following the methodology defined in the current National Energy Performance Regulation (Ordinance, N°349-B/2013), which derives from the EN ISO 13790 approach. The requirements set in the regulation were adopted, namely, the nominal conditions regarding the maintenance of an optimal indoor temperature of respectively 18°C in the heating season and 25°C during the cooling season, for the whole useful area of the dwelling and during the total duration of the respective season. The equations for calculating the space heating (Nic) and cooling (Nvc) useful energy needs, both in [kWh/m2 .year], are the following:
Qtr,i is the heat transfer through conduction between the building and the surroundings in [kWh]; Qυe,i is the heat transfer through ventilation [kWh]; Qgu,i represents the total useful heat gain in the heating season in [kWh]; Ap is the building's indoor pavement useful area in [m2]. ηυ is the utilization factor of the heat gains [-]; and Qg, υ represents the heat gains in the cooling season [kWh]. This process was carried out for the dwellings of all the subsections of Alfama. A subsection represents urban blocks within a civil parish to help identify distinct areas within.
Subsequently, a database with renovation measures was created using a market-based budget generation tool (CYPE, 2013), taking into account the type of materials that are traditionally used in the construction sector, as well as its suitability for the Portuguese buildings. For each measure, information on the physical and thermal properties, as well as its investment costs, including material and estimated man-hours for implementation was collected. Six measures were identified for windows (e.g., aluminum and PVC framing with/without a thermal cut, low emissivity, and standard double glazing), 29 for walls (internal and external), and nine for roofs (e.g., ETIC systems, engineered polyurethane, agglomerated cork, expanded polystyrene). For more information about the considered technologies, see Duarte (2020).
The energy efficiency potential in the district was then assessed through a building fabric improvement scenario for each of the construction components (windows, walls, roofs). This scenario includes a selection for each component of the retrofitting measures that complies with the thermal performance requirements set in the regulation while involving the lowest investment costs. The following suitable options were identified: insulation of expanded polystyrene (EPS) and mineral wool (MW). EPS has a good insulating capacity and is permeable to water vapor. Mineral wool is an incombustible material and completely permeable to air and water vapor but does not absorb water. To estimate the impact of retrofitting measures in the district, the following options were selected as most adequate for being applied: mineral wool 10 mm thick (MW10) for the roof, PVC window frames with standard double glazing (CX PVC STD) for the windows, and expanded polystyrene 6 millimeters thick (EPS6) for the walls, through internal insulation. Historic listed buildings and buildings within historic districts often have façades worthy of preservation (e.g., with tiles or other important visual features) (Build Up, 2020). In Lisbon historical districts, it is very common to have stonework on the door and windows which do not allow the use for example of ETICs (in external insulation) which would be more prominent than these visual details. With ETICs, buildings are more uniform on the outside with impacts on the existing aesthetic beauty in such districts being lost. For these reasons, the internal insulation of walls was selected, despite reducing thermal inertia and the internal floor area.
For walls and roof, insulation material is added to the existing structure; thus, for each building typology the two thermal resistances were summed, and the resulting value represents the final thermal resistance after the retrofit. For windows, the retrofit is a replacement of solutions; therefore, the resulting thermal resistance is equal to the one of the newly implemented solution. Table 2 shows the selected measures for each building component and its associated costs, where lambda (λ) is the thermal conductivity of the material and the R-value is a measure of resistance to heat transfer of the material, for the given thickness. A detailed description of the full methodology can be found in Duarte (2020).
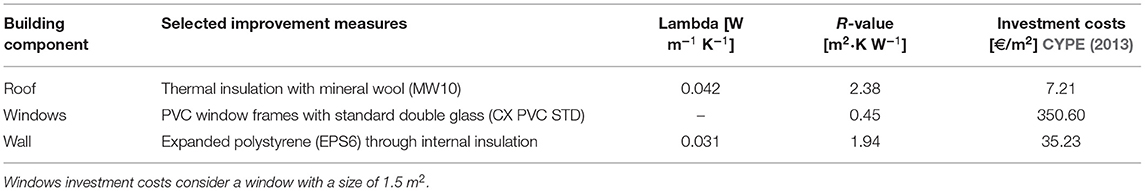
Table 2. Selected measures for buildings retrofit.
Distributed Solar PV Potential
One of the key measures identified in PED projects is solar power integration in buildings (Derkenbaeva et al., 2020). This technology can provide a carbon-free energy source while increasing socioeconomic development by generating new investment opportunities. The goal herein is to evaluate the techno-economic potential of solar photovoltaic technologies, in terms of total electricity production and associated costs, to determine the feasibility of the Alfama district transformation, coupled with an opportunity to mitigate energy poverty through reduction of energy costs and larger use of sustainable energy in vulnerable households.
For the estimation of the electricity generation potential for PV projects, there are three approaches: sample, multivariate sampling, and complete census (Byrne et al., 2015). On the Sample-based, three simple steps are taken: (a) a survey is conducted to obtain data on the available roof area; (b) average annual solar irradiation on inclined surfaces is determined; and (c) yearly PV production is calculated. It is a fast methodology to implement; however, the lack of variables makes this approach more attractive when calculating estimates rather than accurate and precise electricity production values (Byrne et al., 2015). Multivariate sampling-based has a higher difficulty level and consists of five steps: (a) geographical division of the region; (b) rooftop sampling; (c) extrapolation through the use of rooftop area and population relationships; (d) calculations of constraints and detriments (shading, orientation, etc.), and (e) conversion of data into power and energy outputs. Although this method is generally seen as having a lower cost of implementation, the calculation of some variables such as the shading is extremely difficult to conduct, meaning this method is extremely time-consuming and less accurate (Byrne et al., 2015). Complete census relies on the computing of the entire available rooftop area, usually performed through the use of innovative cartographic data sets that offer a digital model of the study region, or through the use of existing statistical data sets containing building information. One technique often used to measure solar radiation levels is Light Detection and Ranging (LiDAR) software (Huang et al., 2015). This approach produces extremely accurate results. However, the increased amount of data makes this method the most time-consuming. A few examples of such application of methods are presented, e.g., by the National Renewable Energies Laboratory (NREL) which provides a PV estimation tool PVWatts (NREL, 2020), using hourly meteorological data per year from the National Solar Radiation Database. The work by Hong et al. (2017) using a sampling method calculated the rooftop solar PV potential for the city of Seoul. Phap et al. (2020) assessed the rooftop solar power technical potential of the city of Hanoi by using high-resolution remote sensing images technology. Eslami et al. (2021), utilizing a rich spatial dataset of solar irradiation augmented with electricity bills at the building level, estimated the cost and benefit of installing rooftop PV systems for each building of the city of Beirut (Lebanon).
The methodology used in this part of the work to assess the solar power integration potential follows a multivariate sampling-based approach, bringing together different tools and methods (PV GIS, energy performance certificates, Google Earth, CENSUS data) for achieving a spatially detailed ballpark figure of production and investment needs for the district scale PV integration, and it can be broken down in several parts: investigation and characterization of the buildings; solar irradiation assessment; available areas and orientation; and calculation of electricity production and costs for PV technologies.
The methodology considers the same six-building typologies used for EE assessment (see Table 1), with roof type, number of floors, and year of construction being the key characteristics of interest. Year of construction is an important characteristic since BIPVs need stable structures and building envelope to have a secure installation. BIPV includes the replacement of the traditional construction elements with multifunctional elements that generate electricity. This enables the dual function of producing renewable electricity through the use of PV and to provide a construction element for the finished building (Ritzen et al., 2016). The installation of certain PV technologies as façade PV may cause structural problems on older buildings that have not been renovated but are an important structure for solar PV potential of Mediterranean cities as described in Brito et al. (2017). The number of floors influences the overall height of the building, thus being a critical factor to determine levels of shading from surrounding buildings. The slope of the roof is also a major feature in determining if a mounting system is needed, or if solar tiles can be used. Closely related, available roofing surface and orientation are the most important factors in determining solar energy generation capacity. To ensure the maximum potential, the available roof surface should have access to sunlight and face the optimal direction to secure the optimal irradiation angle.
Solar Exposure
The software Photovoltaic Geographical Information System (PVGIS) (JRC, 2021) was used to calculate the average monthly solar irradiation estimates for Lisbon (latitude 38.712° north, longitude−9.131 east) for direct normal irradiation, irradiation at an optimal angle, and diffuse solar radiation. The satellite CMSAF data for the year 2016 was retrieved and used for the assessment.
PVGIS is a free online tool that estimates the solar irradiation, taking into consideration shadowing. The solar irradiation information provided by PVGIS is the average direct solar irradiation at an optimum angle for Lisbon (31°) and optimal orientation (south-facing). Diffuse solar irradiation was used to calculate the annual generation of solar window-type technologies. Figure 2 shows a high fluctuation for irradiation levels with lows of about 60 kWh/m2 for January and highs in the summer of about 205 kWh/m2 (JRC, 2021).
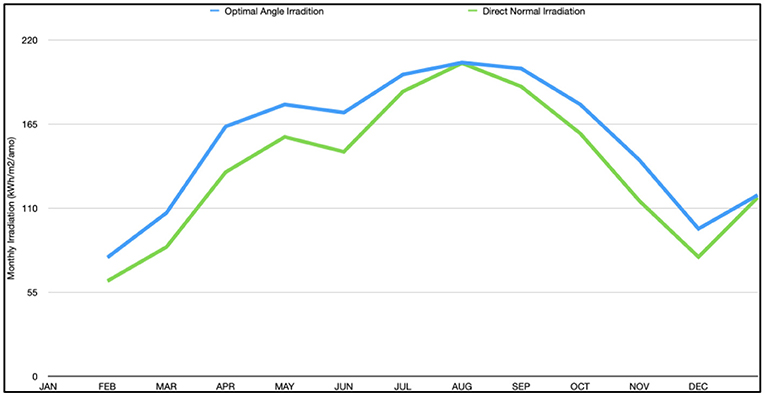
Figure 2. Lisbon monthly solar irradiation estimates (2016) (adopted from JRC, 2021).
Orientation and Rooftop and Windows Area
Building orientation and rooftop availability determine the angle of solar exposure and the total surface available to install the modules. Those features were assessed through a visual analysis of the buildings in different regions of Alfama using Google Earth. The satellite images were used to evaluate rooftop characteristics. The main orientation of the buildings was gathered to identify a significant trend that could be assumed for the majority of the buildings. Little to no variation was found in the orientation of the buildings; in fact, most of them are facing south. Therefore, all the calculations were done based on the assumption that the buildings are south-facing. The next step was the matching between the orientation and rooftop availability information to the respective building typology (see section Representative Building Typologies).
From the energy performance certificate (ADENE, 2019) sample of the district, we retrieve data on the floor surface, number of floors, and total window surface. The average surface of rooftops was computed for each building typology, using the building's footprint area as a proxy indicator. Three classes of rooftop surfaces were defined (i.e., “I: 0–150 m2,” “II: 150–350 m2,” and “III: >350 m2”) as well as for window surfaces (i.e., “A: 0–30 m2,” “B: 30–60 m2,” and “C>60 m2”). These categories enable the identification of outliers, which have areas that are too large or too small in comparison to other buildings, indicating a fault in data recording or a building that has a completely different typology from the defined categories. Outliers are then removed from the assessment.
However, PV technologies will not be installed in the whole rooftop area. This is because only part of the rooftops will be exposed to sunlight, and there may be existing restrictions that prevent the installation of modules in certain areas. For the rooftop availability, a Google Earth visual inspection was done, taking an overview of the district and then taking a building's sample from each one of its subsections. Identified restrictions could include things like chimneys, water collectors, and parabolic antennas (e.g., for television). Another constraint is that as the rooftops are pitched, one side of the rooftop could be privileged with more access to solar irradiation. This is especially true for the study at hand, as most of the buildings are south-facing. This means that only half of the total rooftop area will be facing the sunlight, so only half of the rooftop is suitable for PV technology installation. The calculation of the half-roof was done through the use of trigonometry following other studies such as Moreira (2016). Figure 3 clearly shows a multitude of situations that limit the potential of PV integration; for example, there are roofs completely unrestricted (in green), while others have shadowing (in orange) due to surrounding buildings, and roofs have high levels of restrictions (in red).
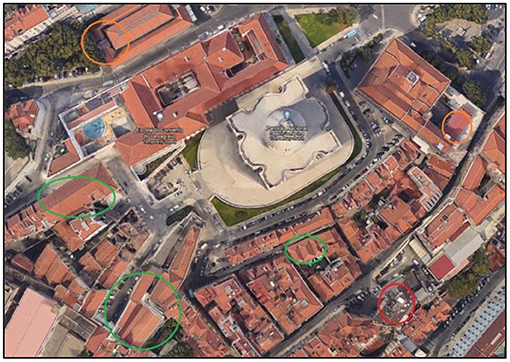
Figure 3. Aerial view of the rooftop availability in the district area of São Vicente de Fora (northeast) (adopted from Google Earth).
Solar PV Electricity Generation
The total solar PV electricity production was estimated considering the average rooftop and window surfaces in Alfama district for the six residential building typologies based upon the results of the previous methodological steps, with varying PV technologies with different levels of maturity and adoption but that are already available on the market. Eight rooftop PV technologies (i.e., building-integrated (BI) and tiles) and two window PV technologies were assessed, as depicted in Table 3. For each technology, total investment costs, annual and lifetime electricity production, and levelized cost of energy (LCOE) were calculated. The installation costs of the modules of an additional 5% and O&M of 3%/year were included in the total investment costs, and a total lifetime of 25 years was considered for lifetime calculations. An average 10% discount rate was used. Finally, for the purpose of this paper's PED conceptual overview, the best technology in terms of overall costs, historic district applicability, generation, and LCOE were selected for each application (window and rooftop). Further details of the full methodology can be found in Luz (2020).

Table 3. Key characteristics and prices of the considered module types.
Results
The results of this study set the scene for the conceptualization of two of the major PED solutions to contribute to energy poverty mitigation in Alfama district while reducing GHG emissions and supporting the transition toward a carbon-neutral city. This section depicts the results for a highly detailed spatial assessment of building EE retrofitting measures and RES integration, unfolding the energy savings' potential of window, roof, and wall retrofit by district subsections and building typologies, as well as roof available surface and solar irradiation, enabling the identification of rooftop PV electricity generation potential for the historic district.
Residential Building Energy Efficiency Potential
The lion share of buildings in this historic district was built before 1960. Before 1930, the use of construction systems such as stone masonry walls, wooden beams in one direction between walls, and pottery floors nailed perpendicular to the beams (i.e., masonry reinforced with wood), without insulation and with lime mortars bringing the stones together, was common. In the period 1930–1950 with the appearance of concrete, there was a constructive evolution but still very poor as no regulation was setting quality standards for thermal performance. Due to climate, culture, and lack of money, there was not much need for improved quality since it would increase costs; thus, roof slab serves as “insulation” and the buildings have wooden windows. All these characteristics set the scene for structural problems and low indoor thermal comfort, with significant potential for improvements (thermal, acoustic, against earthquakes).
Table 4 presents the nominal heating and cooling needs for a dwelling in each building typology before and after the application of the selected retrofitting measures. The current energy needs are generally higher in the dwellings of TP1 and TP2 typologies due to higher thermal transmittance of the building envelope, and because the roof is directly connected to the outside, which does not happen for most dwellings in multi-apartment buildings. The energy needs obtained for the retrofitting scenario were compared to the current needs.
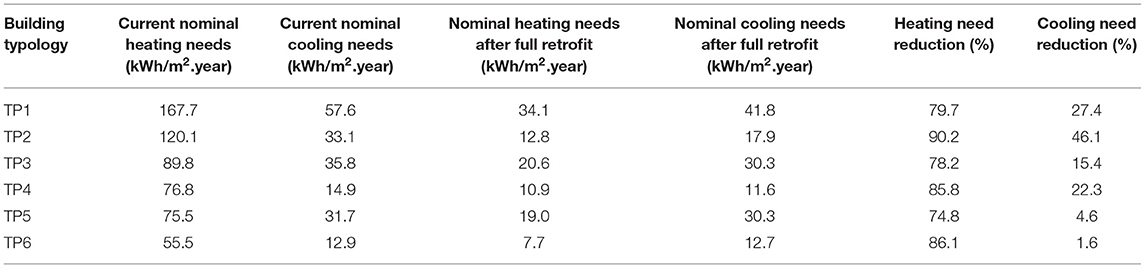
Table 4. Annual nominal heating and cooling dwelling energy needs before and after the retrofit.
Retrofit measures are more effective in reducing space heating energy needs, as the reduction of energy losses related to the improvement of thermal performance directly reduces the need for energy provision, whereas, for space cooling, this relation is not so straightforward. These needs are determined by a ratio between energy gains and losses, and retrofit can magnify energy needs if the reduction of losses is higher than the reduction of gains. The implementation of the combined set of measures shows a significant reduction of space heating energy needs, equal to 84% of the energy needs before the retrofit. On the other hand, space cooling energy needs are reduced by 19% (Table 5). The impact values on windows reflect the trade-off between the application of renovation measures to improve thermal comfort during both seasons (heating and cooling) in a Mediterranean climate, which is an aspect that should be evaluated carefully at the implementation stage. Although space heating energy needs are significantly reduced in all typologies, buildings built before 1919 have slightly lower reductions per dwelling (TP1 with 79.7% and TP3 with 78.2%, and TP5 with 74.8%), as the thick stone walls provide better thermal inertia and consequently a better energy performance from the start. Between the several building typologies, the difference between the higher and lower reductions of the heating energy needs is up to 15.4% (between TP2 and TP5), demonstrating that the building typology plays a relevant role in the efficacy of the retrofit. Space cooling energy need reduction is mostly connected to house typologies as the application of roof retrofit significantly reduces energy gains in those dwellings. Building orientation is also considerably relevant—dwellings with walls and windows facing south have higher energy gains and increased space cooling needs, explaining the low TP5 and TP6 space cooling energy needs reduction, respectively 4.6 and 1.6%.
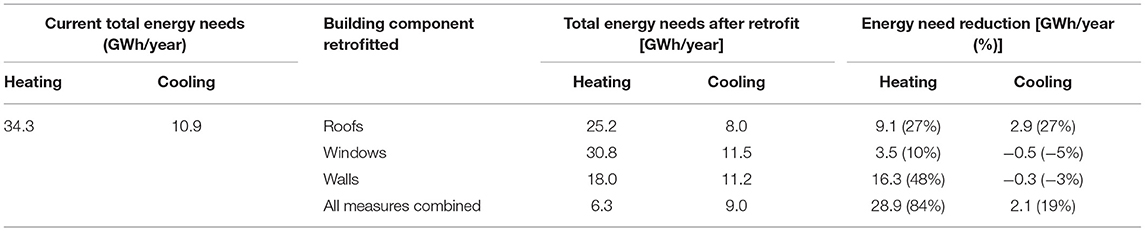
Table 5. Energy needs for space heating and cooling, and the impact of different individual renovation measures for each building components.
Table 5 shows the energy needs for space heating and cooling and the impact of different individual energy renovations for each building component. Improved roof insulation resulted in an average reduction of space heating energy needs of 27% per dwelling (ranging from 14% on TP5 to 50% on TP2), 10% due to window replacement (ranging from 6% on TP3 to 13% on TP6), and 48% due to walls (ranging from 32% on TP1 to 60% on TP6). Regarding space cooling energy needs, roof measures enable a potential average decrease of 27% (ranging from 10% on TP5 to 58% on TP2). On the other hand, window replacement would increase energy needs by 5% (ranging from −2% on TP3 to −9% on TP6) and wall retrofit would lead to an increase of 3% for space cooling (ranging from −10% on TP6 to 1% on TP1).
Figure 4 depicts the spatial analysis of the resulting energy needs for space heating (left panel) and cooling (right panel) per dwelling in each subsection after all building components are retrofitted. From the analysis, 28% of subsections include dwellings with energy needs after retrofitting over 8.8 MWh for space heating and 15% of subsections with over 10.8 MWh for space cooling (two upper classes of the maps). The two categories where energy needs per dwelling are lower account for 39% of all subsections (i.e., 53). The maps of Figure 4 also highlight that most of the subsections with lower heating energy needs after renovation measures are also the same where cooling needs are lower, probably due to the building typologies present in the subsection. Lower energy needs might translate into reduced energy consumption requirement and thus potentially lower vulnerability to energy poverty in these subsections. On the other hand, subsections that have higher energy needs after the building retrofit would need additional measures to reduce energy poverty, e.g., a relevant integration of decentralized RES.
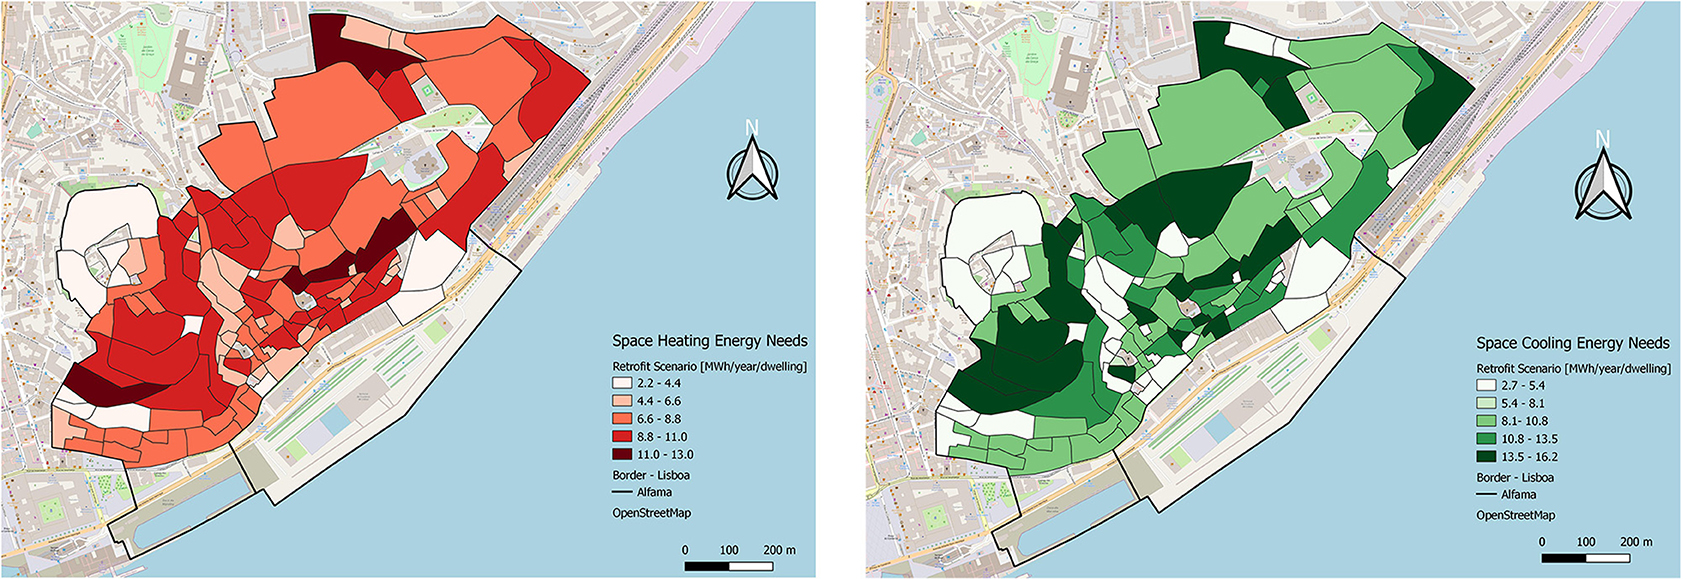
Figure 4. Space heating (left) and cooling (right) energy needs per average dwelling in Alfama subsections after retrofitting measures.
Figure 5 discloses different levels of impact of the overall set of measures. This representation highlights the locations where the EE measures are most impactful, contributing to tackle the related thermal comfort and energy poverty problems. Subsections at the north and center south of the district have higher potential for energy need reduction. Most subsections have potential for space heating energy need reduction, whereas the dwellings of only a few subsections, especially in the western regions of the district, have potential for space cooling energy need reduction through building fabric retrofit. The subsections with high impact might be considered as priority hotspot locations for a cost-effective renovation, toward reducing the gap between energy needs and energy provision, while being also valuable locations for energy poverty mitigation. It is interesting to notice that the subsections with the highest heating energy need reduction are still the subsections that have higher energy needs. This highlights where the biggest vulnerability to energy poverty is present, and where a more detailed retrofit plan should be designed.
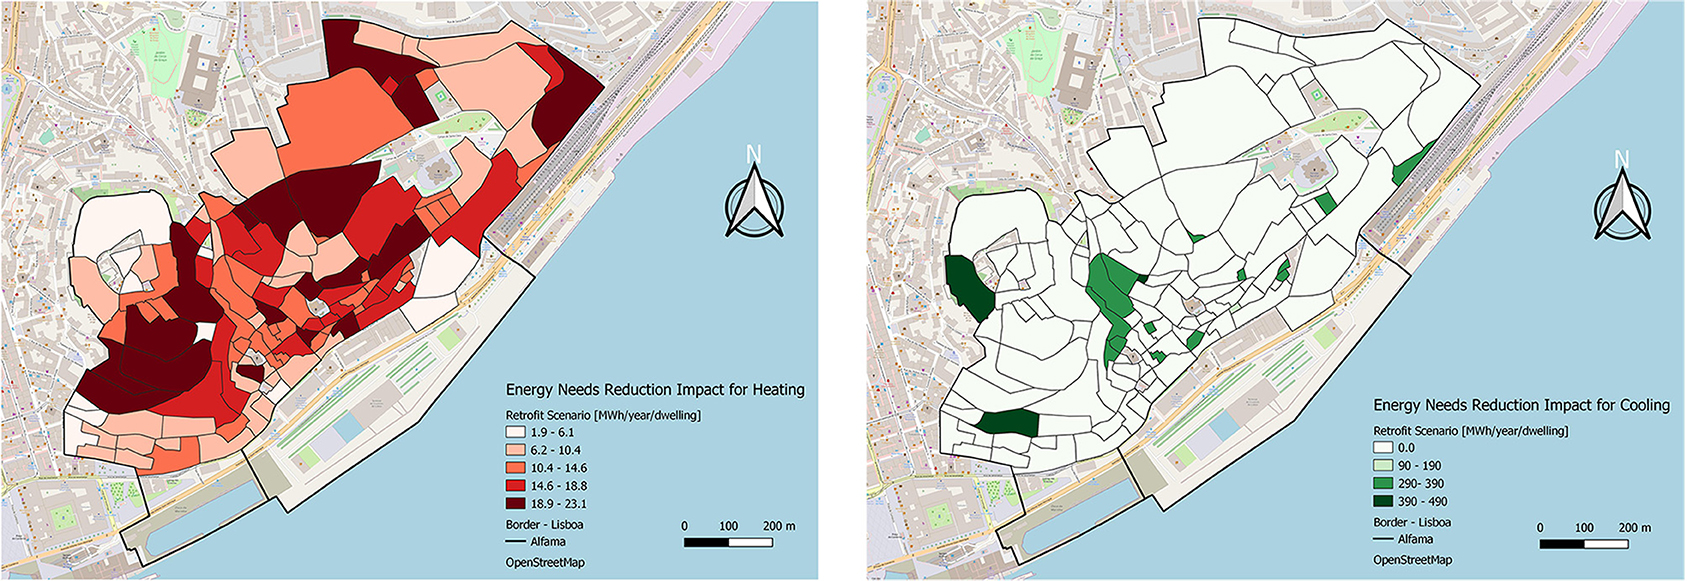
Figure 5. Space heating (left) and cooling (right) energy needs reduction impact per average dwelling in Alfama.
PV Integration Potential in Residential Buildings
Rooftop and Windows Area
Figure 6 illustrates the composition of each building typology, in terms of the average rooftop area category and window area category. These are displayed as a cumulative bar chart for each building typology. The data shows trends for both these features in the different building typologies. Assessing the range for the window areas, the vast majority (96% and over) of buildings have an average window area in category A. Negligible amounts of buildings have average window areas in the range of categories B and C, evidently displaying that all the building typologies considered have relatively small available areas for the installation of window PV technologies.
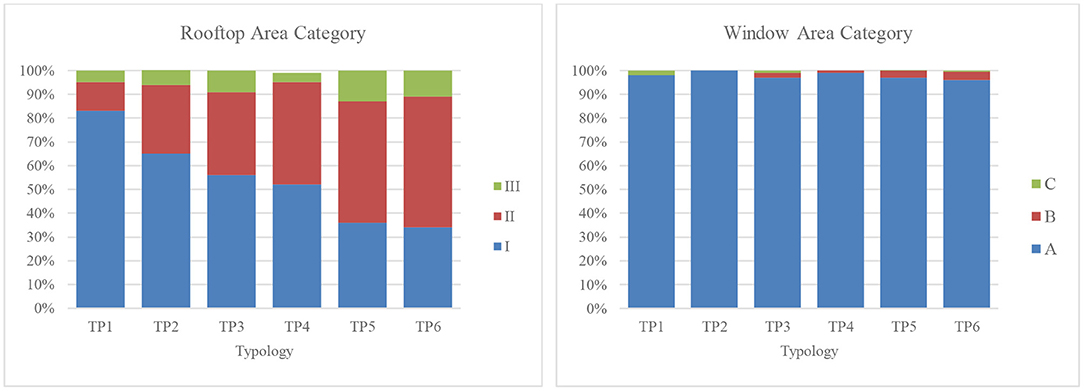
Figure 6. Distribution of rooftop (I, II, III) and window area categories (A, B, C) by building typology for Alfama.
The rooftop area, however, shows a different trend. For TP1 and TP2 buildings, which represent houses/apartments with one or two floors, most of the buildings fall in the roof category I (0–150 m2), whereas for building TP3 and TP4, it is spread almost evenly between categories I and II (150–350 m2), providing a varied spread of average areas. For TP5 and TP6, which represent the tallest apartment buildings with 5+ floors, over half of the buildings have rooftop areas belonging to category II. Once the trends have been analyzed, the average half roof area (without taking rooftop restrictions into account) and average available window area for each building typology were calculated.
The roof availability analysis for each building typology revealed roof restrictions as follows: 0% for TP3; 5% for TP1, TP2, and TP4; and 15% for TP5 and TP6. A single roof availability area for each building typology is assumed. This approximation is due to the lack of detailed data on roof characteristics.
Solar PV Electricity Generation
Individual technological evaluation results for investment costs, electricity generation, and LCOEs are depicted in Table 6. For window technology, the selected choice was FY Solar was the one enabling a continuous unbiased approach, as the source of information for solar irradiation is the same as the ones used for the rooftop PV technology calculations (i.e., PV GIS) and not the manufacturer estimations. For the rooftop technology, the selection process was more complex since two different module types were chosen to be potentially implemented (solar tiles and building integrated panels). From the data gathered in the previous steps, it is shown that for solar tile technologies, the best choice is the Bluesun solar tile. Although the total production is less than if the BRAAS solar tile were to be used, the costs are significantly lower. These lower costs significantly impact the LCOEs, with 0.12 €/kWh for the Bluesun solar tile compared to a four-fold figure of 0.49 €/kWh for BRAAS solar tile. For building-integrated panels, more choices were available. After the analysis of the different electricity production levels, investment costs, and LCOEs, two technologies are seen to be better than the other ones—HCM60X9 and Tallmax. Due to the large area of each module for the Tallmax, HCM60X9 is the better choice as it is more adaptable to smaller rooftops or rooftops with a high level of restrictions.
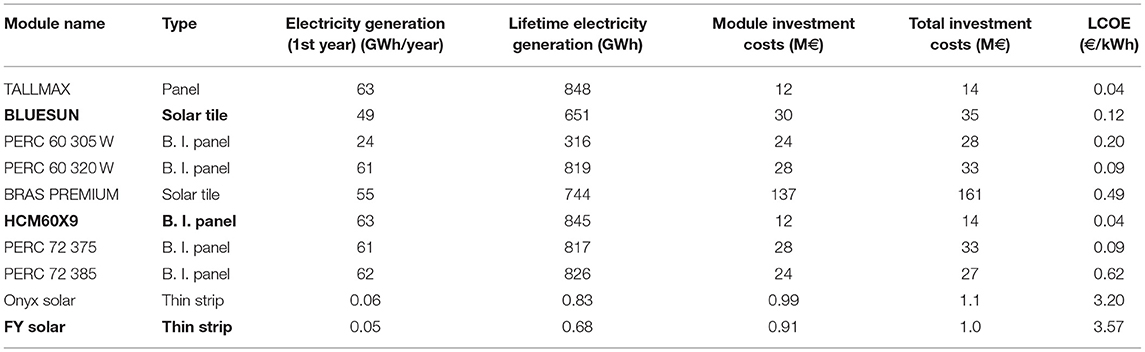
Table 6. Electricity generation, investment costs, and LCOE of solar PV technologies.
For an integrated analysis of PV integration potential in different building parts, we concluded the two best combinations of window and rooftop technologies—FY-solar strips for window and HCM60X9 modules—which resulted in a combined electricity production of 63 GWh per year and a total lifetime of 846 GWh. The combination of FY-solar strips and the BLUESUN solar tiles has a potential of 49 GWh of generated electricity per year, with a total lifetime production of 652 GWh. The latest combination was ultimately selected as the best option for this district context, because the solar tiles have lower visual impact, reducing the influence on the aesthetics of the historic district, thus increasing public acceptance. If compared to the current electricity generation levels in Portugal (2019), these annual figures would represent 0.09–0.012% of total gross electricity generation and 3.7–4.7% of PV generation. Figure 7 shows the potential of solar energy generation for this combination, mapped at the district subsection level. The map highlights that 83% of the subsections have a potential electricity generation lower than 0.6 GWh/year, while ~17% have values in the range from 1.2 to 2 GWh/year (darker purple). There is a higher potential for PV production in the subsections located in the northeast part of the district where most TP2 typologies have higher rooftop areas and also because it is the area in the district with more residential buildings. Lower potential for electricity generation is in the northwestern region where the castle and walls are located.
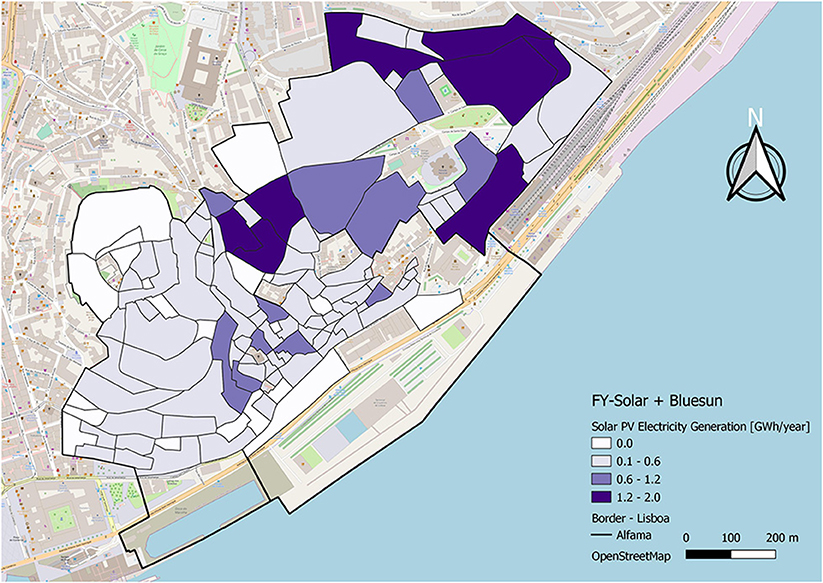
Figure 7. Total solar PV electricity generation technical potential (rooftop and windows) for residential buildings in Alfama.
Investment Costs
This section summarizes the investment costs necessary for deep retrofitting measures and the RES generation through the integration of BIPV technologies in the buildings' windows and rooftops. The analysis provides insights into the relation between energy need reduction and the capital investment necessary to achieve that reduction, for different types of retrofit intervention and solar PV technologies (Figure 7).
The evaluated retrofitting measures for all residential building stocks in Alfama requires an estimated investment of 45M€, with 2.9M€ for roof retrofitting, 26M€ for window retrofitting, and 17M€ for wall retrofitting. The left panel of Figure 7 shows the total investment costs of building retrofit at the subsection level. Wall improvement is the most impactful measure for energy need reduction, with overall investment needed being the second. Roof retrofit has a cost-effectiveness of 0.32 and 1.0€/kWh for energy need reduction for space heating and space cooling, respectively. The retrofit of walls and windows results in 7.4 and 1.0€/kWh, respectively, regarding space heating. Considering only space cooling-related improvements, these interventions are not cost-effective. Overall roof retrofit is the most cost-effective measure for Alfama for both space heating and cooling and should be the first option to be pursued under a limited budget. As discussed in multiple publications (e.g., Howden-Chapman, 2015; COMBI, 2018; Bisello, 2020; Reuter et al., 2020), energy efficiency renovations spawn far beyond direct impact on the environment (e.g., energy consumption and GHG reduction) which should be acknowledged (for health, economy, social welfare) in district-scale ambitious energy efficiency transformations.
As for the PV production, however, the combination of FY-solar strips and HCM60X9 panels was found to be the most cost-effective choice, totaling 15M€ of needed investment with an LCOE of 0.04 €/kWh. The combination of FY-solar strips and the BLUESUN solar tiles were selected, as explained in the previous section, as more suitable to be applied in a historic district with several associated building regulatory restrictions. This combination requires a total investment cost of 36M€ and has an aggregated LCOE of 0.13 €/kWh. The right panel of Figure 8 illustrates the spatial distribution of the total investment costs for the integration of the selected set of PV solutions. It is found that 10% of the subsections entail a potential investment higher than 0.6M€. Locations with high investment costs are mostly found in the eastern part of the district due to their building types and higher presence of residential buildings. Approximately 46% of the subsections depict investments lower than 200k€.
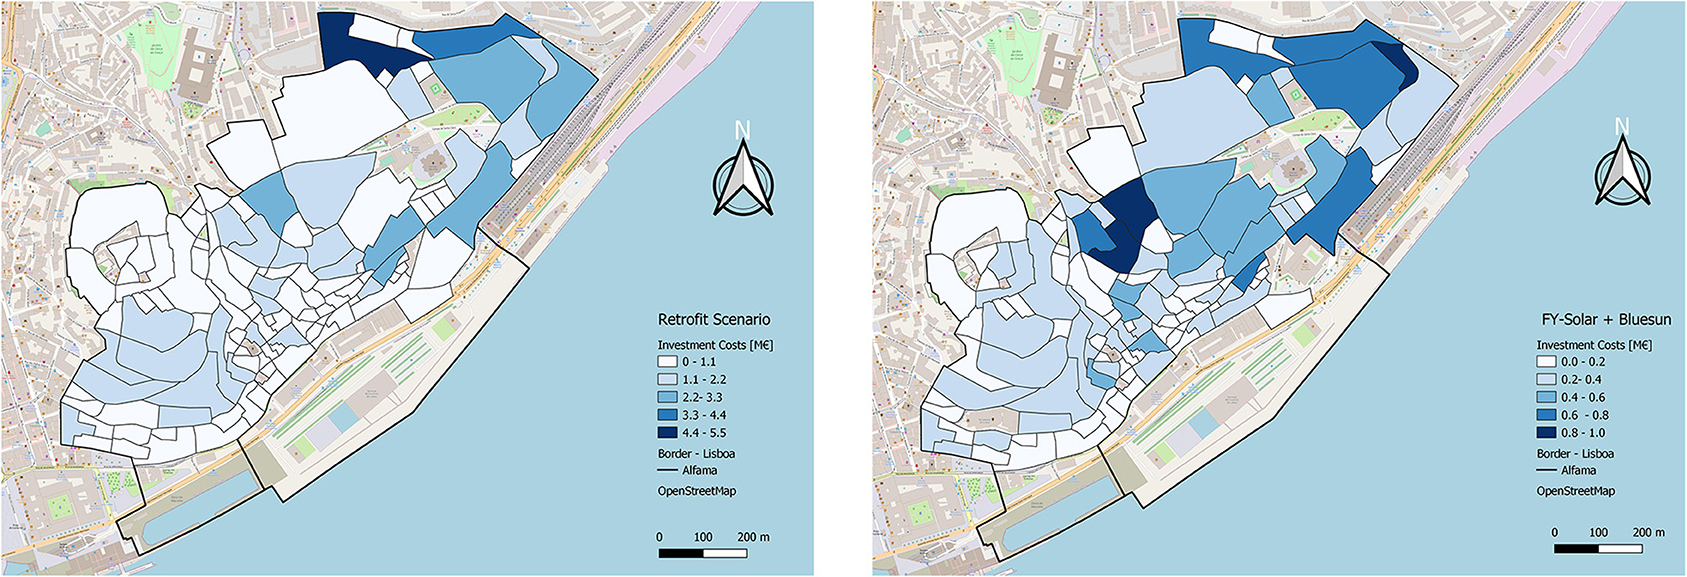
Figure 8. Investment costs needed for full buildings retrofit (left) and solar PV integration (right) in Alfama subsections.
General Discussion
The work presented in this paper provides a first approach to implement a vision of a Positive Energy District in the Alfama historical district, focusing on two key components of the PED framework—EE measures to reduce energy needs and decentralized locally produced RES electricity. We argue that these two components entail a strategy for a structural and sustainable energy poverty mitigation, paving the way for a holistic and systemic district change (technically and socially) toward a sustainable energy transition. The case study highlights the common problems occurring in the Mediterranean historic city districts, and the methodology can be applied to evaluate the potential of PED implementations in many Southern European cities. Considering the current literature, this paper presents two key novelties that should be underlined: the technical and economic feasibility to adopt some key components of a PED concept in a historic district, while most projects focus on the design of newly built districts (Bossi et al., 2020); and the exploration of the PED model as an opportunity to tackle and mitigate energy poverty.
The majority of European cities have buildings or blocks of historical interest, which have great potential to reduce their energy consumption and to cut GHG emissions (Eurocities, 2020), applying the PED concept. However, they present severe challenges to implement integrated PED solutions, either due to regulatory restrictions or due to standard financial bottlenecks that often limit the integration of RES and EE measures. Moreover, the social acceptance of interventions in historical districts may create barriers to the transition toward more sustainable cities. In many cases, the public opinion for the installation of PV panels or small wind turbines is extremely negative as the infrastructures built are considered to be damaging to the district's overall architecture and charm. Therefore, addressing these conflicts and barriers, developing innovative and creative solutions or designs (e.g., technologies, financing schemes), and, on social features, educating the local population toward the benefits of using RES are of vital importance when transitioning the energy usage in historic districts unlocking their full potential.
The results achieved herein aimed to illustrate the high technical potential of historic districts to contribute to carbon neutrality and sustainable cities. For the case of Alfama, the oldest historic district of the city of Lisbon, energy efficiency measures on the dwelling's structure, including the renovation of the roof (i.e., thermal insulation with mineral wool), windows (i.e., PVC window frames with standard double glass), and walls (i.e., expanded polystyrene, EPS6, through internal insulation), may reduce the energy needs around 84% for heating and 19% for cooling, when compared with the energy needs before the retrofitting measures. The required investment totals 45M€ for the full set of EE retrofitting measures in 6 004 dwellings and 15–36M€ for the two combinations (windows plus rooftops) of decentralized solar electricity generation. The investment for the retrofit of the building may represent between 56 and 75% of the total investment for the district, depending on the solar technologies selected. All these results unfold the importance of a deep-scale full package retrofit for reduction of energy needs while improving the living conditions of the occupants throughout the dwelling stock.
We argue that these levels of energy need reduction which enable to keep the thermal comfort at the set reference indoor temperatures in winter (18°C) and in summer (25°C) have a direct impact on energy poverty reduction, meaning that even if a family does not have the financial resources to heat or cool the household up to the ideal temperatures, the significant reduction of energy losses due to EE measures can increase the thermal comfort of the households. These results stress the need for acting first in the building's components, simultaneously with ventilation, which increases the building airtightness through insulation and better windows, while renewing the indoor air for good air quality conditions. Only then, under a PED concept, should the integration of technical systems (PV systems, boilers, heat pumps, etc.) be considered.
Nevertheless, we concluded a significant technical potential for solar electricity generation in the historic district, for two combinations of window and rooftop technologies. The most cost-effective technology combination is FY-solar strips for windows plus HCM60X9 BIPV panels for rooftops. However, due to its visual impact on the historic district rooftops and the potential low public acceptance, the combined solution of FY-solar strips for windows and BLUESUN solar tile for rooftops was spatially assessed. This combination has higher total lifetime costs; however, the aesthetic of the historic districts would be preserved since the solar tiles have a smaller profile and are designed to simulate rooftop tiles. This trade-off illustrates one of the current challenges historic districts are facing regarding locally produced electricity: the visual perception of PV panels.
The role of locally generated electricity in mitigating energy poverty should be underlined, as it brings an opportunity to lower energy bills. In particular, this could be especially relevant when the most adequate subsections for RES integration are closer or the same as the subsections that have high energy needs for space heating and cooling. In these cases, the PED model is an opportunity for a renewable energy community, a priority for the Portuguese government, as evidenced by the approval of the Decree-Law, 162/2019, which establishes the legal framework for the self-consumption of renewable energy and the constitution of energy communities, with potential positive spillover to the most vulnerable inhabitants through sharing surplus electricity generation. Furthermore, it is understood that the integration of renewables within the scope of, for example, Net Zero energy buildings is not profitable when it is performed building by building (Shehadi, 2020). Cost-effectiveness is much higher at district-scale interventions compared to individual buildings and should be explored moving forward to more ambitious renovation strategies.
The barriers that hinder the integration of PED solutions in historical city districts also affect the opportunities to tackle energy poverty. Although EU Directive sets minimum requirements of the energy performance of retrofitted buildings (European Parliament, 2012), legally protected buildings and buildings of historical interest are excluded from complying with energy efficiency requirements (Caro and Sendra, 2020). Therefore, a significant portion of the existing building stock is not covered by energy efficiency ambition (Dol and Haffner, 2010). Moreover, other practical reasons such as the heterogeneous geometry, peculiar materials, conservation strategies, and variety of protected elements (e.g., façades, indoor finishes) of listed buildings are not suited to standardized values and procedures that are usually used by the construction industry, adding complexity to retrofit plans (Caro and Sendra, 2020). As a consequence, residents in historic districts are potentially more vulnerable to energy poverty than residents in newly built districts, therefore confronted with the related health, economic, and climate change risks. However, most of the EE measures and RES technologies do not comply with the specific regulation in Alfama. In this study, only technical constraints (such as building orientation and rooftop surface availability) were taken into account. In future research, the trade-off between compliance with local heritage regulations and compliance with the building's thermal component should be evaluated, to enable effective large-scale renovations. With the increasing availability of smart meters in the country providing more details on energy consumption profiles, a wider analysis including other important PED components such as energy flexibility with smart controls, as highlighted in IEA (2020) and JPI Urban Europe (2021), should be conducted. This research shows the technical potential hidden in historic districts, aiming to disclose the necessary policy, social, and financial discussion around the role of historic districts in the energy transition of cities.
The viability and sustainability of the business model behind EE measures is the biggest identified barrier, being more difficult to overcome than the existing technical limitations. For instance, split incentives, lack of capital financing, high upfront investment, lack of information and awareness about the costs and benefits, difficulty in the decision-making process, and lack of expertise (Vogel et al., 2015; van Oorschot et al., 2016; Bertone et al., 2018; Bertoldi et al., 2020) are limiting the regeneration of historic districts. For RES implementation, intermittency of sources and uncertainty of market subsidies add to the factors driving out investors (European Commission, 2014). In Portugal, the lack of available capital for upfront investment, together with ineffective, mostly loan-based support schemes, is a relevant obstacle preventing homeowners from investing in their assets. The energy gap between the energy needs for thermal comfort and measured energy consumption in Portuguese homes, as demonstrated by Palma et al. (2019), represents an increased challenge for an investment opportunity, especially for EE measures, since the capital return gains linked to energy savings are reduced or inexistent.
Despite the recent trend of fast-decreasing costs of PV, which is expected to proceed in future years opening a window of opportunity for this type of building PV applications, the highlighted investment numbers will require an innovative financial scheme to support not only building owners but also tenants, as these are among the most vulnerable to energy poverty. We argue that the social benefits of the investment should be evaluated, including benefits on health costs, air quality, climate resilience, and productivity. The quantification of potential social co-benefits (e.g., reduction of energy poverty, community building, reduction of gentrification) from the adoption of the PED model could increase the ambition of the project and accelerate the implementation of these solutions in existing districts, and especially in historic districts, which usually present a more pressing need to solve the beforementioned social issues.
The European Commission through the Clean Energy for all Europeans Package (2019) brought a solid basis for renewable deployment and energy efficiency promotion, improving the regulatory structure and funding instruments, but the impact is still not enough, with renovation works only rarely addressing energy performance of buildings, and uptake of RES remains low (Arístegui, 2021).
In conclusion, the PED model is part of the pathway toward the goal of 100 climate neutral cities in Europe, which relate to the final goal of a climate-neutral Europe by 2050. The PED research field is at the beginning; however, it is important to include existing districts in the assessment, through analysis that covers the entire scale of the district, to achieve a relevant impact for a holistic and sustainable transformation. At the moment, the aspiration to be energy positive is difficult to reach in historic districts; however, high ambition is necessary to push research forward and enable to obtain a momentum of innovation and positive impacts. Moreover, historic districts generally have deep social problems and they play a relevant role in the European cultural landscape: deep demonstration projects that show the efficacy of the PED framework in historic districts could accelerate the energy transition in Europe and increase the value of sustainability.
Data Availability Statement
The raw data supporting the conclusions of this article will be made available by the authors, without undue reservation.
Author Contributions
JG: conceptualization, overall methodology, analysis of results, and writing—original draft preparation. JS: analysis of results and writing—original draft preparation. PP: writing—original draft preparation and support on energy efficiency analysis. HD: building energy efficiency retrofit methodology and analysis. HL: building solar PV methodology and analysis. GC: writing—original draft preparation. All authors have read and agreed to the published version of the manuscript.
Conflict of Interest
The authors declare that the research was conducted in the absence of any commercial or financial relationships that could be construed as a potential conflict of interest.
Acknowledgments
The authors acknowledge the COST Action European Energy Poverty: Agenda Co-Creation and Knowledge Innovation (ENGAGER 2017–2021, CA16232) and the COST Action-Positive Energy Districts European Network (PED-EU-NET, CA19126) funded by the European Cooperation in Science and Technology—www.cost.eu for framing the context of this work.
References
ADENE (2017). Estudo de mercado no âmbito das campanhas de sensibilização e de promoção da eficiência energética na Habitação Particular [Market study in the context of the energy efficiency awareness and promotion in private housing campaigns]. Final Report. ADENE—Agência para a Energia.
ADENE (2019). Buildings Energy Performance Certificates Database. Lisbon: ADENE—Agência para a Energia.
Alpagut, B., Akyürek, Ö., and Mitre, E. M. (2019). Positive energy districts methodology and its replication potential. Proceedings 20:8. doi: 10.3390/proceedings2019020008
Arístegui, T. (2021). The Interplay of the Renovation Wave Strategy and the Recommendation on Energy Poverty. Brussels: DG Energy. European Commission
Asdrubali, F., Ballarini, I., Corrado, V., Evangelisti, L., Grazieschi, G., and Guattari, C. (2019). Energy and environmental payback times for an NZEB retrofit. Buil. Environ. 147, 461–472. doi: 10.1016/j.buildenv.2018.10.047
Bertoldi, P., Economidou, M., Palermo, V., Boza-Kiss, B., and Todeschi, V. (2020). How to finance energy renovation of residential buildings: review of current and emerging financing instruments in the EU. Wiley Interdiscip. Rev. Energy Environ. 10:e384. doi: 10.1002/wene.384
Bertone, E., Sahin, O., Stewart, R. A., Zou, X. W., Alam, M., Hampson, K., et al. (2018). Role of financial mechanisms for accelerating the rate of water and energy efficiency retrofits in Australian public buildings: hybrid bayesian network and system dynamics modelling approach. Appl. Energy 210, 409–419. doi: 10.1016/j.apenergy.2017.08.054
Bisello, A. (2020). Assessing multiple benefits of housing regeneration and smart city development: the European project SINFONIA. Sustainability 12:8038. doi: 10.3390/su12198038
Bossi, S., Gollner, C., and Theierling, S. (2020). Towards 100 positive energy districts in Europe: preliminary data analysis of 61 European cases. Energies 13:6083. doi: 10.3390/en13226083
Bouzarovski, S., and Petrova, S. (2015). A global perspective on domestic energy deprivation: overcoming the energy poverty–fuel poverty binary. Energy Res. Soc. Sci. 10, 31–40. doi: 10.1016/j.erss.2015.06.007
Brito, M., Freitas, S., Guimarães, S., Catita, C., and Redweik, P. (2017). The importance of facades for the solar PV potential of a Mediterranean city using LiDAR data. Renew. Energy 111, 85–94. doi: 10.1016/j.renene.2017.03.085
Build Up (2020). Overview–Insulating Historic Buildings: Approaches and Materials. European Commission. Available online at: https://www.buildup.eu/en/news/overview-insulating-historic-buildings-approaches-and-materials (accessed March 17, 2021).
Byrne, J., Taminiau, J., Kurdgelashvili, L., and Nam-Kim, K. (2015). A review of the solar city concept and methods to assess rooftop solar electric potential, with an illustrative application to the city of Seoul. Renew. Sustain. Energy Rev. 41, 830–844. doi: 10.1016/j.rser.2014.08.023
C40 cities (2020). C40: Deadline 2020. Available online at: https://www.c40.org/other/deadline_2020 (accessed March 17, 2021).
Caro, R., and Sendra, J. J. (2020). Are the dwellings of historic mediterranean cities cold in winter? a field assessment on their indoor environment and energy performance. Energy Build. 230:110567. doi: 10.1016/j.enbuild.2020.110567
Cavaco, A., Silva, H., Canhoto, P., Neves, S., Neto, J., and Collares-Pereira, M. (2016). “Annual average value of solar radiation and its variability in Portugal,” in Workshop On Earth Sciences. Conference: WES 2016–Workshop on Earth Sciences (Évora).
CML (2020). Carta Municipal da habitação de Lisboa [Municipal Housing Letter of Lisbon]. Lisbon: Lisbon Municipality.
COMBI (2018). Calculating and Operationalising the Multiple Benefits of Energy Efficiency in Europe. Available online at: https://combi-project.eu/ (accessed March 17, 2021).
CYPE (2013). Gerador de preços para construção civil. S. A. CYPE Ingenieros. Available online at: http://www.geradordeprecos.info (accessed March 17, 2021).
Decree-Law 162/2019, 25th October. Approves the legal regime applicable to self-consumption of renewable energy, partially transposing Directive 2018/2001. Available online at: https://data.dre.pt/eli/dec-lei/162/2019/10/25/p/dre (accessed March 17, 2021).
Derkenbaeva, E., Heinz, H., Lopez Dallara, M. L., Mihailova, D., Galanakis, K., and Stathopoulou, E. (2020). Value Generation by PEDs: Best Practices Case Study Book. WP6 Business Models and Consumers' Value Proposition for PEDs. Smart-BEEjS–Human-Centric Energy Districts: Smart Value Generation by Building Efficiency and Energy Justice for Sustainable Living. Wageningen University and Research, Nottingham Business School (Nottingham Trent University). University of Basel. Available online at: https://smart-beejs.eu/wp-content/uploads/2020/12/WP6-Deliverable-D6.2-Value-Generation-by-PEDs.pdf
DGEG (2021). Estatísticas. Directorate-General for Energy and Geology. Available online at: https://www.dgeg.gov.pt/pt/estatistica/energia/ (accessed March 17, 2021).
Dobbins, A., Nerini, F., Deane, P., and Pye, S. (2019). Strengthening the EU response to energy poverty. Nat. Energy 4, 2–5. doi: 10.1038/s41560-018-0316-8
Dol, K., and Haffner, M. (2010). Housing Statistics in the European Union. The Hague: Ministry of the Interior and Kingdom Relations. Available online at: https://www.researchgate.net/publication/334030779_housing-statistics-in-the-european-union-2010 (accessed March 17, 2021).
Duarte, H. (2020). Identificação do Potencial de Eficiência Energética do Edificado Residencial de Alfama (thesis submitted for MSc degree on Renewable Energy Engineering). NOVA School of Science and Technology, NOVA University of Lisbon, Lisboa, Portugal.
Eslami, H., Najem, S., Ghanem, D., and Ahmad, A. (2021). The potential of urban distributed solar energy in transition economies: the case of Beirut city. J. Environ. Manag. 285:112121. doi: 10.1016/j.jenvman.2021.112121
Eurocities (2020). Cultural Heritage Essentials: Policy Findings for City Makers, Urban Practitioners, and Cultural Heritage Lovers. Available online at: https://indd.adobe.com/view/7e9f39ac-b4d5-4a8b-b9b1-e4941b1eee78 (accessed March 17, 2021).
European Commission (2014). Technical Guidance—Financing the Energy Renovation of Buildings With Cohesion Policy Funding. Final Report. ENER/C3/2012-415. European Commission.
European Commission (2019). The European Green Deal. Available online at: https://eur-lex.europa.eu/legal-content/EN/TXT/?uri=COM%3A2019%3A640%3AFIN (accessed March 17, 2021).
European Commission (2020a). 100 Climate-Neutral Cities by 2030–by and for the Citizens: Report of the Mission Board for Climate-Neutral and Smart Cities. Available online at: http://op.europa.eu/en/publication-detail/-/publication/bc7e46c2-fed6-11ea-b44f-01aa75ed71a1/language-en/format-PDF (accessed March 17, 2021).
European Commission (2020b). A Renovation Wave for Europe–Greening Our Buildings, Creating Jobs, Improving Lives. Available online at: https://eur-lex.europa.eu/legal-content/EN/TXT/?uri=CELEX:52020DC0662 (accessed March 17, 2021).
European Commission (2020c). Commission Recommendation of 14.10.2020 on energy poverty. Available online at: https://ec.europa.eu/energy/sites/ener/files/recommendation_on_energy_poverty_c2020_9600.pdf (accessed March 17, 2021).
European Parliament (2012). Directive 2012/27/EU on energy efficiency. Off. J. Eur. Union L 315, 1–56. Available online at: https://eur-lex.europa.eu/LexUriServ/LexUriServ.do?uri=OJ:L:2012:315:0001:0056:en:PDF
European Union (2018). SET-Plan Action 3.2 on Smart Cities and Communities. Available online at: https://setis.ec.europa.eu/system/~files/setplan_smartcities_implementationplan.pdf (accessed March 17, 2021).
Eurostat (2021a). Inability to Keep Home Adequately Warm–EU-SILC Survey. Database. Available online at: https://ec.europa.eu/eurostat/web/products-datasets/-/ilc_mdes01 (accessed March 17, 2021).
Eurostat (2021b). Share of Population Living in a Dwelling Not Comfortably Cool During Summertime by Income Quintile and Degree of Urbanization. Database. Available online at: https://ec.europa.eu/eurostat/web/products-datasets/-/ilc_hcmp03 (accessed March 17, 2021).
Eurostat (2021c). Gas Prices for Household Consumers–bi-Annual Data (From 2007 Onwards). Database. Available online at: https://ec.europa.eu/eurostat/web/products-datasets/-/nrg_pc_202 (accessed March 17, 2021).
Eurostat (2021d). Electricity Prices for Household Consumers–bi-Annual Data (From 2007 Onwards). Database. Available online at: https://ec.europa.eu/eurostat/web/products-datasets/-/nrg_pc_204 (accessed March 17, 2021).
Frischmann, C. J., Mehra, M., Allard, R., Bayuk, K., Gouveia, J. P., and Gorman, M. R. (2020). “Drawdown's “System of Solutions” helps to achieve the SDGs,” in Partnerships for the Goals. Encyclopedia of the UN Sustainable Development Goals, eds W. Leal Filho, A. Azul, L. Brandli, A. Lange Salvia, T. Wall (Cham: Springer). doi: 10.1007/978-3-319-71067-9_100-1
Gago, A., and Cocola-Gant, A. (2019). “O alojamento local e a gentrificação turística em Alfama, Lisboa,” in A nova questão da habitação em Portugal. Uma abordagem da economia política. Smartour: tourism, holiday rentals and rehabilitation (Lisboa: Actual), 143–170.
Gouveia, J.P., and Palma, P., and Simoes, S. G. (2019). Energy poverty vulnerability index: a multidimensional tool to identify hotspots for local action. Energy Rep. 5, 187–201. doi: 10.1016/j.egyr.2018.12.004
Gouveia, J.P., Seixas, J., and Long, G. (2018). Mining households' energy data to disclose fuel poverty: lessons for Southern Europe. J. Clean. Prod. 178, 534–550. doi: 10.1016/j.jclepro.2018.01.021
Gouveia, J. P., and Palma, P. (2019). Harvesting big data from residential building energy performance certificates: retrofitting and climate change mitigation insights at a regional scale. Environ. Res. Lett. 14:095007. doi: 10.1088/1748-9326/ab3781
Gregório, V., and Seixas, J. (2017). Energy savings potential in urban rehabilitation: a spatial-based methodology applied to historic centres. Energy Build. 152, 11–23. doi: 10.1016/j.enbuild.2017.06.024
Hong, T., Lee, M., Koo, C., Jeong, K., and Kim, J. (2017). Development of a method for estimating the rooftop solar photovoltaic (PV) potential by analyzing the available rooftop area using Hillshade analysis. https://www.sciencedirect.com/science/journal/03062619 Appl. Energy 194, 320–332. doi: 10.1016/j.apenergy.2016.07.001
Horta, A., Gouveia, J. P., Schmidt, L., Sousa, J. C., Palma, P., and Simões, S. (2019). Energy poverty in Portugal: combining vulnerability mapping with household interviews. Energy Build. 203:109423. doi: 10.1016/j.enbuild.2019.109423
Howden-Chapman, P. (2015). How real are the health effects of residential energy efficiency programmes? Soc. Sci. Med. 133, 189–190. doi: 10.1016/j.socscimed.2015.03.017
Huang, Y., Chen, Z., Wu, B., Chen, L., and Mao, W. (2015). Estimating roof solar energy potential in the downtown area using a GPU-accelerated solar radiation model and airborne LiDAR data. Remote Sens. 7, 17212–17233. doi: 10.3390/rs71215877
IEA (2020). Annex 83 on Positive Energy Districts. Energy in Buildings and Communities Programme. Paris: International Energy Agency.
INE (2011). CENSUS 2011. Base Geográfica de Referenciação de Informação. Lisboa: Statistics Portugal. Available online at: http://mapas.ine.pt/download/index2011.phtml (accessed March 17, 2021).
INE (2017). Inquérito às Despesas das Famílias 2015/2016 [Household Budget Survey 2015/2016]. Lisboa: Statistics Portugal. Available online at: https://www.ine.pt/xportal/xmain?xpid=INEandxpgid=ine_publicacoesandPUBLICACOESpub_boui=298558245andPUBLICACOESmodo=2andxlang=pt (accessed March 17, 2021).
INE (2019). Estatísticas da Construção e Habitação 2019 (Construction and Housing Statistics 2019). Available online at: https://www.ine.pt/xportal/xmain?xpid=INEandxpgid=ine_publicacoesandPUBLICACOESpub_boui=358628647andPUBLICACOESmodo=2 (accessed March 17, 2021).
JPI Urban Europe (2021). JPI Urban Europe|Joint Programming Initiative. Available online at: https://jpi-urbaneurope.eu/ (accessed March 17, 2021).
JRC (2021). PVGIS. Ispra: Joint Research Centre. European Commission. Available online at: https://ec.europa.eu/jrc/en/pvgis (accessed March 17, 2021).
Lazzeroni, P., Olivero, S., Stirano, F., Micono, C., Montaldo, P., Zanzottera, G., et al. (2017). Energy efficiency measures for buildings in Hebron city and their expected impacts in the distribution grid. Energy Proc. 134, 121–130. doi: 10.1016/j.egypro.2017.09.547
Liang, J., Qiu, Y., James, T., Ruddell, B. L., Dalrymple, M. Earl, S., et al. (2018). Do energy retrofits work? evidence from commercial and residential buildings in Phoenix. J. Environ. Econ. Manag. 92, 726-743. doi: 10.1016/j.jeem.2017.09.001
Luz, H. (2020). Evaluation of the techno-economic potential of Solar PV integration in Alfama, Lisbon (thesis submitted for MSc degree in Renewable Energy Engineering). NOVA School of Science and Technology, NOVA University of Lisbon, Lisboa, Portugal.
MAKING-CITY (2018). Homepage. MAKING-CITY. EU H2020 Project. Available online at: https://makingcity.eu (accessed March 17, 2021).
Mckinsey (2020). How the European Union could achieve net-zero emissions at net-zero cost. Mckinsey and Company. Available online at: https://www.mckinsey.com/business-functions/sustainability/our-insights/how-the-european-union-could-achieve-net-zero-emissions-at-net-zero-cost (accessed March 17, 2021).
Moreira, D. (2016). Solar PV Rooftop in households: technical potential for the municipality of Évora (thesis submitted for MSc degree in Environmental Engineering). Faculty of Science and Technology, Nova University of Lisbon, Lisboa, Portugal.
Mosannenzadeh, F., Bisello, A., Vaccaro, R., Alonzo, V. D', Hunter, G. W., and Vettorato, D. (2017). Smart energy city Development: a story told by urban planners. Cities 64, 54–65. doi: 10.1016/j.cities.2017.02.001
NREL (2020). PVWatts Solar Resource Data. Available online at: https://pvwatts.nrel.gov/pvwatts.php (accessed March 17, 2021).
Ordinance N°349-B/2013 of November 29th. Diário da República [Government Gazette] 1.a série — N. ° 232. Washington, DC: State Department for Energy.
Palma, P., Gouveia, J. P., and Simoes, S. G. (2019). Mapping the energy performance gap of dwelling stock at high-resolution scale: implications for thermal comfort in Portuguese households. Energy Build. 190, 246–261. doi: 10.1016/j.enbuild.2019.03.002
Phap, V. M., Huong, N., Hanh, P., Duy, P., and Binh, D. (2020). Assessment of rooftop solar power technical potential in Hanoi city, Vietnam. J. Build. Eng. 32:101529. doi: 10.1016/j.jobe.2020.101528
POCITYF (2019). Homepage. POCITYF. EU H2020 Project. Available online at: https://pocityf.eu/ (accessed March 17, 2021).
Pye, S., Dobbins, A., Baffert, C., Brajkovic, J., Miglio, R., and Deane, P. (2015). Energy Poverty and Vulnerable Consumers in the Energy Sector Across the EU: Analysis of Policies and Measures. Available online at: https://ec.europa.eu/energy/sites/ener/files/documents/INSIGHT_E_Energy%20Poverty%20-%20Main%20Report_FINAL.pdf (accessed March 17, 2021).
Reuter, M., Patel, M., Eichhammer, W., et al. (2020). A comprehensive indicator set for measuring multiple benefits of energy efficiency. Energy Policy 139:111284. doi: 10.1016/j.enpol.2020.111284
Ritzen, M., Gammal, A., Warneryd, M., Sprenger, W., Rose-Wilson, H., Payet, J., et al. (2016). Enabling Framework for BIPV Acceleration, IEA PVPS Task 15. Available online at: http://iea-pvps.org/fileadmin/dam/public/workshop/Ritzen_-_IEA_PVPS_Task_15.Pdf https://www.photovoltaic-conference.com/images/2016/2_Programme/parallel_events/AccelerationBIPV/Michiel_RITZEN.pdf (accessed March 17, 2021).
Satterthwaite, D. (2008). Cities' contribution to global warming: notes on the allocation of greenhouse gas emissions. Environ. Urban. 20, 539–49. doi: 10.1177/0956247808096127
Shehadi, M. (2020). “Net-zero energy buildings: principles and applications,” in Zero-Energy Buildings–New Approaches and Technologies, ed Jesus Alberto Pulido Arcas, Carlos Rubio-Bellido, Alexis Perez-Fargallo, and Ivan Oropeza-Perez (London: IntechOpen). doi: 10.5772/intechopen.92285
SUSHI (2020). Sustainable Historic City Districts. Co-funded by EIT Climate KIC. Available online at: https://sustainablehistoriccitydistricts.wordpress.com/ (accessed March 17, 2021).
UN SDGs (2015). Goal 11|Department of Economic and Social Affairs. New York, NY: United Nations. Available online at: https://sdgs.un.org/goals/goal11 (accessed March 17, 2021).
UNDESA (2019). World Urbanization Prospects: The 2018 Revision. New York, NY: United Nations, Department of Economic and Social Affairs, and Population Division. Available online at: https://www.un.org/development/desa/publications/2018-revision-of-world-urbanization-prospects.html (accessed March 17, 2021).
UNFCCC (2016). Paris Agreement. Climate Action–European Commission. Available online at: https://ec.europa.eu/clima/policies/international/negotiations/paris_en (accessed March 17, 2021).
van Oorschot, J., Hofman, E., and Halman, J. I. M. (2016). Upscaling large scale deep renovation in the Dutch residential sector: a case study. Energy Proc. 96, 386–403. doi: 10.1016/j.egypro.2016.09.165
Keywords: renewable energy, Portugal, Alfama, fuel poverty, energy performance of buildings, energy efficiency, Lisbon
Citation: Gouveia JP, Seixas J, Palma P, Duarte H, Luz H and Cavadini GB (2021) Positive Energy District: A Model for Historic Districts to Address Energy Poverty. Front. Sustain. Cities 3:648473. doi: 10.3389/frsc.2021.648473
Received: 31 December 2020; Accepted: 24 February 2021;
Published: 01 April 2021.
Edited by:
Cait Robinson, University of Liverpool, United KingdomReviewed by:
Adriano Bisello, Eurac Research, ItalyEdgar Antonio Barragán, Salesian Polytechnic University, Ecuador
Copyright © 2021 Gouveia, Seixas, Palma, Duarte, Luz and Cavadini. This is an open-access article distributed under the terms of the Creative Commons Attribution License (CC BY). The use, distribution or reproduction in other forums is permitted, provided the original author(s) and the copyright owner(s) are credited and that the original publication in this journal is cited, in accordance with accepted academic practice. No use, distribution or reproduction is permitted which does not comply with these terms.
*Correspondence: João Pedro Gouveia, anBsZ0BmY3QudW5sLnB0