 Avalokita Tuladhar
 Palistha Manandhar
 Kundan Lal Shrestha
- Department of Environmental Science and Engineering, Kathmandu University, Dhulikhel, Nepal
PM2.5 is one of the major air pollutants in Kathmandu Valley, and its emission and the unique atmospheric condition of the valley make it significantly hazardous to human health. The air pollution due to particulate matter is a major health issue with numerous negative impacts on us. This research aims to quantify the health impacts of PM2.5 exposure on the population of Kathmandu Valley. The ambient PM2.5 concentration of Kathmandu Valley was simulated using WRF-Chem model by using a horizontal grid resolution of 3 × 3 km. The concentration obtained from WRF-Chem was used as input in the health equation of an intervention model to quantify the health impacts. This quantitative assessment of atmospheric pollution was applied to evaluate the human exposure to PM2.5 in Kathmandu Valley. PM2.5 concentration and its distribution in the valley along with the ward-wise population distribution were used to find the health impact of the particulate matter in December 2019 in Kathmandu Valley. Exposure analysis using the model showed that 19 people could die due to lung cancer and 175 people could die due to all cause diseases except accidents due to PM2.5 exposure in December 2019. It was estimated that the reduction in the PM2.5 level by half in the valley reduces the monthly mortality by 51.4%. Hence, the exposure analysis of the particulate matter on the urban population could be improved by using air quality models in order to solve the health problems arising from air pollution.
1. Introduction
PM2.5 in the ambient atmosphere is hazardous and detrimental to both the environment and human health. The amount of particulate matter can determine some of the impacts of air pollution on human health. If we consider the World Health Organization's recommended limits for the air pollution, the quality of Nepalese air is very poor with an annual mean PM2.5 concentration of 44.5 μg/m3, which exceeds the recommended threshold of 10 μg/m3 (IQAir, 2019).
Studies have found that the major contributing factors of air pollution in the valley are the vehicles, residential combustion, brick kilns, the manufacturing and construction industries, biowaste burning, and dust particles (Stone et al., 2010; Kim et al., 2015; Sarkar et al., 2017; Shakya et al., 2017). Out of them, vehicular emission is the primary contributing factor due to consumption of fossil fuels (Sarkar et al., 2017; Shakya et al., 2017). The unusually high pollution levels from the vehicles are mainly due to the haphazard traffic system, poor maintenance of the vehicles, and ineffective control of vehicle emissions (CEN and ENPHO, 2003).
The Kathmandu Valley is the capital city of Nepal and has the largest number of population. One of the main reasons for the highly polluted state of Kathmandu Valley is the highly dense concentration of people coming from all over the country (Bakrania, 2015). Nepal has one of the highest rates of urbanization rates in the world that can steadily keep on increasing in the long run as well (Bakrania, 2015). Most of the development work has been concentrated in the Kathmandu Valley and the subsequent economic activities as well as the consumption of fossil fuel have aggravated the pollution and health-related problems in the city.
The traffic scenario in Kathmandu Valley is deteriorating steadily with the constant influx of people. A projection has estimated this increase in the number of vehicles in the valley from 461,927 in 2009 to 895,802 in 2021 (ADB, 2010). The increase in vehicular air pollution affects the human respiratory system. As the vehicular traffic grows, so does the production of PM2.5 that results in adverse health impacts like respiratory and pulmonary diseases (US EPA, 2020). Ghimire and Shrestha (2014) showed that the total estimated PM2.5 was 9646.40 tons/year from vehicular emission in Kathmandu Valley.
The InMAP model has been used to estimate the annual average primary and secondary PM2.5 related to changes in emissions. This model provides marginal health damages based on source–receptor relationships calculated by the WRF-Chem chemical transport model. Inputs to the model include precursor emissions (NH3, SO2, PM2.5, NOx, and VOCs), annual average meteorology, air quality, deposition information, annual gridded surface emissions, and point sources. InMAP model uses population and health incidence data that can be used to estimate health impacts (IEc, 2019). EASIUR is another model that calculates the monetized health impacts of emissions changes in the contiguous United States. The EASIUR model follows a standard method for estimating mortality burden, which is an impact pathway analysis of estimating ambient PM2.5 from precursor emissions and then quantifying associated premature deaths based on epidemiological studies (Heo et al., 2016). This method achieves detailed spatial resolution according to the location of the emission source, accounting for differences in the exposed population downwind. EASIUR can quantify the benefits of the air quality policy scenarios and can be normalized per ton of emissions. Using chemical transport model simulations, the model builds a large dataset of air quality public health impacts from marginal emissions throughout the United States, taking into account the exposed population distribution throughout the country (Heo et al., 2016). APEEP model also follows a similar format of quantifying the health impacts. The model begins with calculating emissions using an air quality model. Next, APEEP computes exposures of people to ambient air pollution to determines the resulting human health impacts. APEEP calculates human exposures to the predicted concentrations by multiplying county-level pollution concentrations by the county-level population data. The model translates exposures into physical effects using concentration–response functions published in peer-reviewed studies in the epidemiological literature (Groosman et al., 2011).
The relationship between the change in concentration of the pollutant (Δx), and the corresponding change in the population health response (Δy) derived from a concentration response relationship is the health impact function (US EPA, 2010). Many epidemiological studies report some measure of the change in the population health response associated with a specific change in the pollutant concentration, which is called the relative risk.
Pope et al. (2002) assessed the relationship between long-term exposure to fine particulate air pollution and all-cause, lung cancer, and cardiopulmonary mortality. The study found that each 10 μg/m3 elevation in fine particulate air pollution was associated with 4, 6, and 8% increased risk of all-cause, cardiopulmonary, and lung cancer mortality, respectively. The findings are based on 16 years of research involving about 500,000 people and 116 metropolitan areas in the United States. Similarly another study by Krewski et al. (2009) consisted of approximately 360,000 participants residing in areas of the country that have adequate monitoring information on levels of PM2.5 analyzed the relative risks of all causes, cardiopulmonary disease (CPD), ischemic heart disease, lung cancer, and all remaining causes. The study showed 6% increase in overall mortality for every 10 μg/m3 increase in PM2.5 concentration. Lepeule et al. (2012) found significant associations between PM2.5 exposure and increased risk of all-cause, cardiovascular and lung cancer mortality, and reported that each increase in PM2.5 (10 μg/m3) was associated with an increased risk of all-cause mortality of 14%, along with 26 and 37% increase in cardiovascular and lung cancer mortality, respectively.
The health impact of PM2.5 exposure in Nepal has been conducted using concentration–response relations from various other regions (Gurung and Bell, 2013). Giri et al. (2007) have estimated the mortality due to the PM10 pollution in Kathmandu Valley as 17,132 premature deaths/year. Shah and Nagpal (1997) estimated the impact of PM on mortality and morbidity and found the impact of 84 deaths, 506 cases of chronic bronchitis, 475,298 restricted activity days, and 1.5 million respiratory symptom days in Kathmandu Valley in 1990. In this study, the PM2.5 pollution exposure in Kathmandu Valley and its health impacts have been evaluated using the distributed approach of simulating the air quality by employing WRF-Chem modeling.
The annual PM2.5 concentration of Nepal is 10 times the limit set by WHO. The strongest predictor for deaths caused by ambient air pollution is chronic PM2.5 exposure (Künzli et al., 2001; Pope and Dockery, 2006). PM2.5 is capable of traveling long distances and can also be highly spatially variable near emission sources. To date, limited studies have been conducted to analyze the PM2.5 emission and its health impacts in Kathmandu Valley. This study aims to use a high-resolution WRF-Chem simulation to test and support the research on PM2.5 emission and its health impact.
2. Materials and Methods
2.1. Study Area
The research was conducted for Kathmandu Valley as shown in Figure 1, having a population of 1,376,000 in 2019, and 665 km2 area (Macrotrends, 2020). The valley stands at 1,425 m (4,675 ft) above sea level. It comprises three main districts of Nepal: Kathmandu, Lalitpur, and Bhaktapur District. The total number of wards in each district are 71 wards in Lalitpur, 38 in Bhaktapur, 138 in Kathmandu. The temperature in Kathmandu valley is around 20–35°C in the summer and −3 to 20°C in winter.
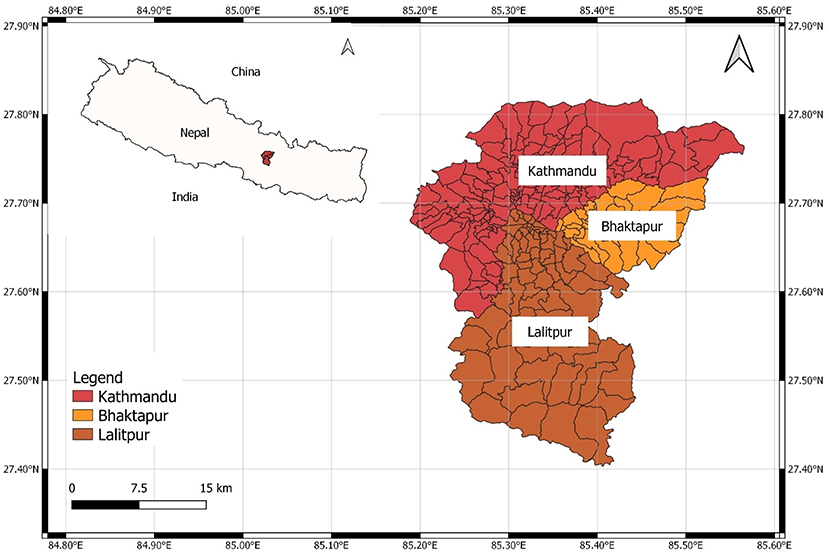
Figure 1. Map of Kathmandu Valley.
2.2. Study Period
In order to select the time period for the study, US embassy station data were analyzed. Upon analyzing the PM concentrations throughout the year of 2019, we observed that PM peaks in the driest winter month of December. In December, the average temperature ranges between min 3.7°C (38.7°F) and max 20.2°C (68.4°F), during which PM concentration is the maximum (IQAir, 2019; Weather Atlas, 2020). The pollution stations of Government of Nepal started operating only from 2016, and US Embassy stations operated after a year in 2017. During this research, only 3-year data were available but the data were very limited with lots of missing data. In a comparison of monthly data, we found that December, January, and February usually have high PM concentrations. For example, in US embassy station data of 2018, December had the highest PM2.5 concentration of 101.6 μg/m3 followed by January and February with 99.9 and 94.8 μg/m3, respectively. The PM2.5 exposure analysis of this study was done in very high spatial resolution of 3 × 3 km. Some papers (Heo et al., 2016; Thind et al., 2019) have used 36 × 36 km and 48 × 48 km resolution. Being a high-resolution simulation with a time period representing the highest PM2.5 pollution in Kathmandu Valley, the time period from December 1, 2019 to December 30, 2019 was selected for the study.
2.3. Population Data
The baseline population data from Central Bureau of Statistics (CBS), Nepal (https://cbs.gov.np/population/) was used for the study. Using the Ratio method as used by CBS reports for population projection, this ward-wise population data were projected from the baseline year 2011 to year 2019.
The equation of this method is:
where,
Sub area Projected Population is the required ward-wise projected population for 2019,
Sub area Population is the ward-wise population of baseline year 2011,
Parent Population is the Population of Nepal in baseline year 2011,
Parent Population Projection is the projected population of Nepal in 2019.
The Parent Population was taken from the Population Projection Report prepared by CBS (2014).
2.4. Mortality Data
The mortality rate for lung cancer and all-cause mortality data to quantify the health impacts were taken from the reports published by Nepal Health Research Council (NHRC). The all-cause mortality rate for the valley is found to be 607.8 per 100,000 people (NHRC, 2018).
2.5. WRF-Chem Modeling
The Weather Research and Forecasting (WRF) model (Skamarock et al., 2008) is a widely used distributed model to simulate the atmospheric process and it is able to model meteorological processes and atmospheric transport.
WRF-Chem is a numerical weather and atmospheric simulation model that is coupled with chemistry (Grell et al., 2005). It can simulate and predict the atmospheric emission of pollutants, the chemical transport, and transformation at multiple spatial scales. The interaction between meteorology and chemical processes is also modeled by WRF-Chem.
2.6. Modeling Setup
Version 4.0 of Weather Research and Forecasting Model coupled with Chemistry was used for simulating the meteorology and chemistry over the model domain shown in Table 1. The model domain is defined on the mercator projection. The model contains 3 km grid resolution and of 38 vertical layers.
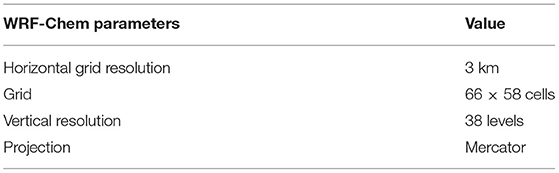
Table 1. WRF-WPS model setup.
The data required for the model run were downloaded from different sources.
NCEP FNL Operational Global Analysis was used for the initial and lateral boundary conditions for meteorological field. Fire Inventory from the National Centre for Atmospheric Research (NCAR) (FINN) version 1.5 was used for biomass burning data. The anthropogenic emission required for running the model is taken from Emission Database for Global Atmospheric Research (EDGAR-HTAP v2) inventory. The biogenic emissions were from Model of Gases and Aerosols from Nature (MEGAN). WSM 5-class microphysics scheme, Grell 3-D cumulus parameterization, RRTM longwave option, Dudhia shortwave scheme, Yonsei University planetary boundary layer parameterization, MOZCART chemistry scheme, and Madronich F-TUV photolysis option were used for running the WRF-Chem model.
2.7. Estimation of PM2.5 Pollution-Related Deaths
Health impact function was used to estimate the number of deaths and illnesses associated with PM2.5 attributable to each of the 247 wards of Kathmandu Valley. One of the input parameters is the PM2.5 concentration from the WRF-Chem model.
Various reduced complexity models (RCMs) have been developed to quantify and value the health impacts of changes in air quality. The reduced form models employ simpler methods to approximate the more complex analyses with a lower computational burden (IEc, 2019). Health benefit results from the models can be obtained by the use of Chemical Transport Models (CTMs) to estimate the impact of emissions on ambient concentrations, and the health effects from exposure to these concentrations can be quantified by using concentration–response functions (Gilmore et al., 2019). Several RCMs such as EASIUR (Heo et al., 2016), InMAP (Tessum et al., 2017), and APEEP (Muller and Mendelsohn, 2007) use health impact function from BenMAP (US EPA, 2010) to determine the mortality due to pollutant exposure. The function calculates the number of death resulted per year due to PM exposure by taking a certain concentration response relation (Pope et al., 2002; Krewski et al., 2009). All three RCMs use the same equation to predict the mortality burden caused by PM2.5 pollution.
The log-linear relationship is the most common form of health impact function used in these types of studies (US EPA, 2010). A typical health impact function specifying a log-linear relationship between risk and air quality change is as follows (US EPA, 2010):
where
c is the average PM2.5 concentration,
Total Population is the ward-wise population,
Mortality Rate is the mortality rate for certain diseases per 100,000 people,
R is the relative risk reported from various published epidemiological studies,
yi is the estimated number of PM2.5-related total deaths for each ward.
In this study, the value of R is different for lung cancer and all-cause mortality (Table 2). Since Nepal does not have a reliable published source of relative risk, we have taken it from the study conducted by Pope et al. (2002), which states that an increase of 10 μg/m3 in fine PM concentration in the atmosphere contributes about 6 and 14% increase in the risk of all cause and lung cancer mortality, respectively. Due to lack of mortality data for Kathmandu Valley, only two factors—lung cancer and all cause disease—could be considered.
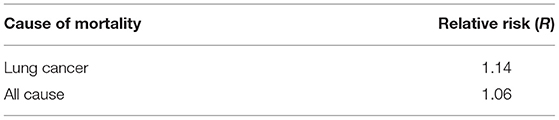
Table 2. Relative risk for the diseases from epidemiological study done by Pope et al. (2002).
The input and output of the model were plotted in the Kathmandu Valley map by using the QGIS software.
3. Results
3.1. Projected Population
The ward-wise population of Kathmandu Valley for the year 2019 was estimated using the Ratio method. The baseline population was taken from Central Bureau of Statistics (2011). Figure 2 shows the projected population of the valley for 2019. Kathmandu Valley at 2019 has approximately 2.7 million people. The densely populated urban centers comprise the Kathmandu and Patan cities and Bhaktapur city in the eastern edge of the valley. Urbanization can be seen increasing throughout the valley, agricultural field are also present over the flat valley floor, and substantial area is found to be used for brickfields especially in the Bhaktapur district.
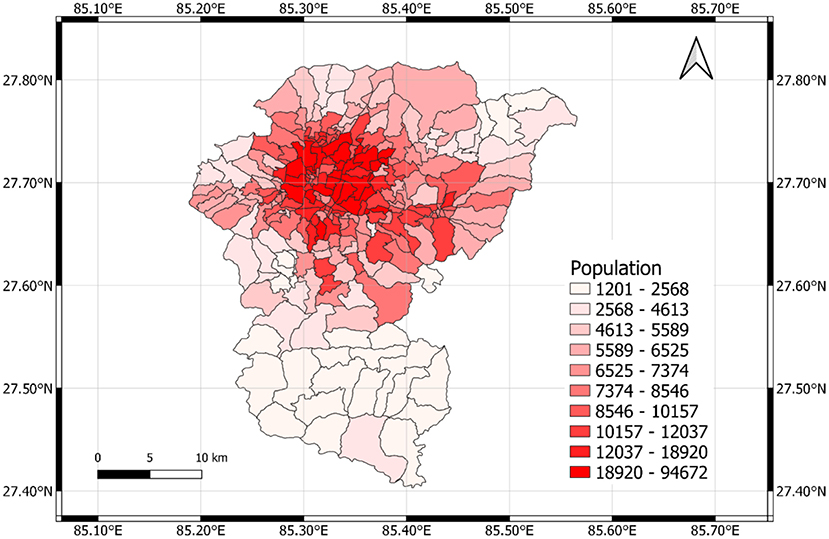
Figure 2. Ward-wise population of Kathmandu Valley for the year 2019.
3.2. Mortality Rate
Figure 3 shows the mortality rate of Kathmandu Valley for lung cancer (NHRC, 2018). Mortality rate (per 100,000 people) due to all cause (except accidents) diseases in Kathmandu valley was taken as 607.8 (NHRC, 2018). We projected the rate from 2018, using Ratio method, to 2019 but no significant changes were observed. So we used mortality rate of 2018.

Figure 3. Mortality rate (per 100,000 people) due to lung cancer in Kathmandu Valley in 2018.
3.3. Emission Concentration From WRF-Chem
In Figure 4, the 1 month (December, 2019) average spatial distribution of calculated PM2.5 is shown along with the population distribution in the Kathmandu valley. The maximum PM2.5 concentration is seen in Kathmandu district. This region of Kathmandu, being the main urban center, holds the maximum population density along with maximum traffic congestion, with large development activities resulting in high air pollution. Largely protected from any winds, the pollutants are not dispersed and hang heavy over the local population especially during the dry winter months. Wards including Nagarjun 4, Nagarjun 9, Nagarjun 10, Chandragiri 13, and Chandragiri 14 experience the greatest PM2.5 concentrations. The lowest concentration was found to be at Bagmati 4. There is less PM2.5 concentration in the outskirts of Kathmandu, lower region of Lalitpur and Bhaktapur district.
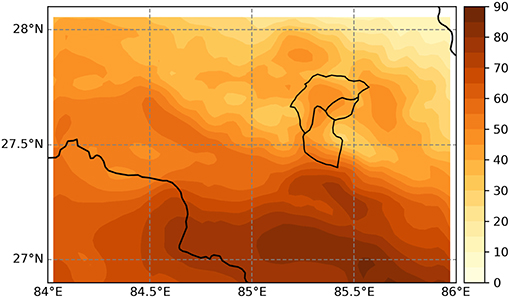
Figure 4. Average PM2.5 emission (μg/m3) in the valley obtained from WRF-Chem for December 2019.
3.3.1. Health Impact of PM2.5 Exposure
The cumulative deaths due to PM2.5 induced lung cancer and all cause is found to be 19 and 175, respectively, for December 2019, which was obtained using Equation (2) that estimates the number of PM2.5-related total deaths (Y) for each ward i (i = 1,2,3…247).
where yi is the ward-wise PM2.5-related death (see Equation 1) and Y is the total PM2.5-related death of entire Kathmandu Valley.
The health impact function was applied to the 247 wards individually to calculate the mortality burden per ward. The summation of all the ward results provided us with the total number of deaths in the entire valley. Table 3 shows that the death number for lung cancer and all cause disease are 19 and 175, respectively. Different relative risks were applied for lung cancer and all cause, along with different mortality data input to provide the mortality results.
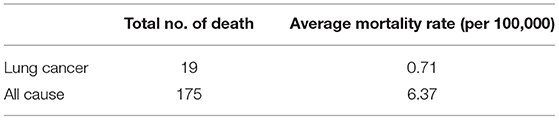
Table 3. PM2.5 related premature deaths attributable to emissions in December 2019.
4. Discussion
Figure 5 shows maximum and minimum mortality values for lung cancer to be 0.403 and 1.081 per 100,000 people, respectively. The highest PM2.5 induced lung cancer mortality rates are seen in Lalitpur district. The mortality rate for lung cancer is 41.6 (per 100,000) as provided by NHRC (2018), which explains the higher PM2.5 induced lung cancer mortality rates than the other two districts. Although the population density of Kathmandu is greater, the lung cancer mortality rate for Lalitpur district is greater than that of both Kathmandu and Bhaktapur districts. The topmost region of Lalitpur district has the maximum mortality rates due to high emission concentration as well as large population.
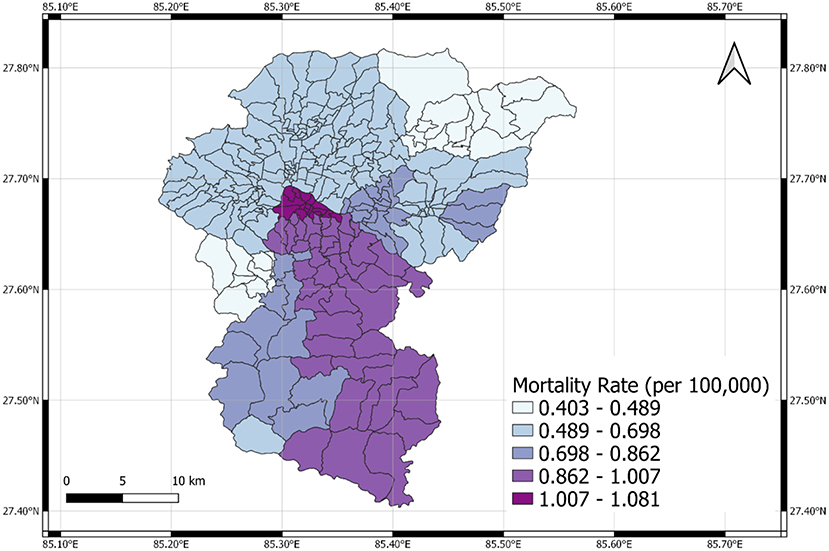
Figure 5. PM2.5 induced lung cancer mortality rate (per 100,000 people) for December 2019.
The maximum and minimum mortality rate burden for all cause is shown in Figure 6 to be 4.31 and 6.93 per 100,000 people, respectively. The highest PM2.5 induced all cause mortality rates are seen in Kathmandu district. The mortality rate for all cause is 607.8 (per 100,000) for the entire valley. It is evident that the high emission concentration and population cause maximum mortality burden due to PM2.5 in Kathmandu district. Therefore, PM2.5-related mortality burden is highest where population concentration and PM2.5 emission is maximum.
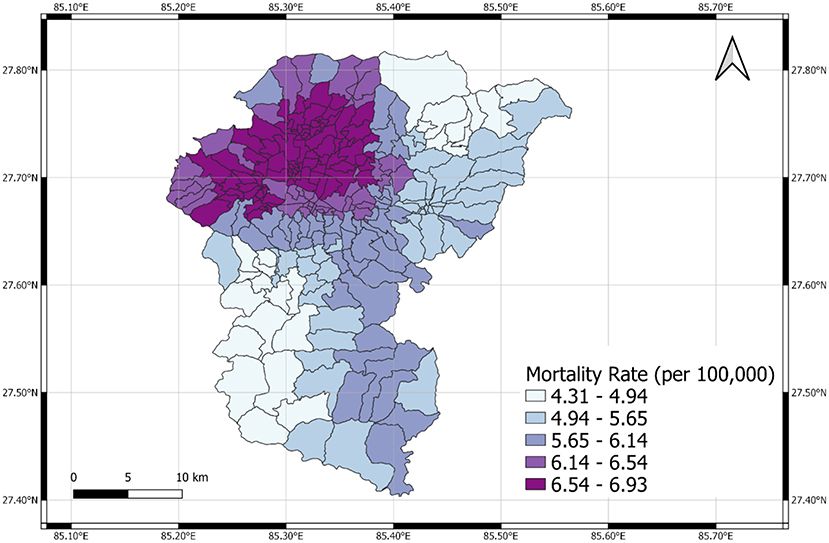
Figure 6. PM2.5 induced all cause mortality rate (per 100,000 people) for December 2019.
The estimated mortality is higher than that reported by Regmi and Kitada (2003). Regmi and Kitada (2003) estimated 226 deaths per year, whereas this study estimates around 175 deaths during the month of December (Table 4). Increase of both the population and pollutant concentration has contributed toward this trend. The health impact functions (Ostro and Chestnut, 1998) used by Regmi and Kitada (2003) provides very less relative risk compared to ours, and the target population for the valley was also 50% less than the target population of this study. This change in the health impact constant and the population distribution predicted lesser mortality results.
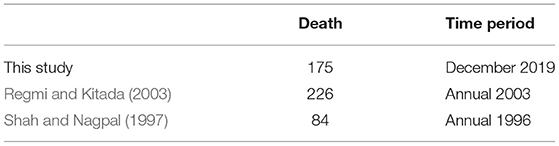
Table 4. Comparison of the results with previous studies for Kathmandu Valley.
Similar study was done by Shah and Nagpal (1997), who estimated similar results as that of Regmi and Kitada (2003). Shah and Nagpal (1997) had also used the same health impact equation for similar target population as that of Regmi and Kitada (2003). The main reasons for the difference in the results are the increases in population and pollutant concentration.
The mortality results due to PM2.5 emission was calculated after reducing the concentration of every ward by half. The hourly PM2.5 concentration data are not compared with the observed station data since the model provides average of the grid (3 km) while the stations provide point wise data. The grid value and the station point data are not comparable. The monthly data obtained for the individual wards got reduced by nearly 50% and the results were obtained (Table 5). Upon analyzing the result before and after the emission reduction, it is seen that the death result also significantly reduced by half. Thus, it is estimated that reduction in PM2.5 level in the valley will reduce the monthly mortality by approximately 50%.
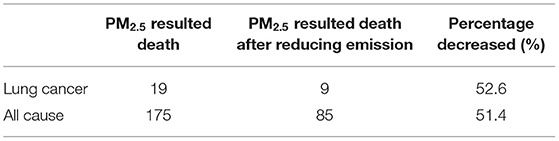
Table 5. Comparison between PM2.5 resulted death after reducing the emission by half in December 2019.
Taking into account the exposure map, high concentration of exposure seems to be prevalent in the cities of Kathmandu district. To reduce adverse health outcome stringent emission control measures should be implemented (Regmi and Kitada, 2003). Nepal is regularly ranked poorly in the air quality indices. Considering the mortality burden, the places affected by PM2.5 pollution should be identified and effective air pollution mitigation plan should be enforced.
4.1. Conclusion and Recommendations
In this research, numerical simulation of particulate matter of Kathmandu Valley was done using Chemical Transport Model, WRF-Chem for December, 2019. Values of simulated 24-h mean PM2.5 concentration ranges from 30 μ to 65 μg/m3. The values of PM2.5 obtained from the model simulation exceeds the WHO standard, which is 25 μg/m3 24-h mean. The level of PM2.5 in Kathmandu's air is extremely high, especially in the dry winter month (December). In this month, the air in urban Kathmandu can be classified as “ very unhealthy.”
Human PM2.5 pollution exposure has been studied utilizing the numerically simulated PM2.5 concentration value and residential distribution of population over Kathmandu valley. Human-PM2.5 pollution-exposure maps for Kathmandu valley have been analyzed and various health outcomes due to the prevalence of PM2.5 are evaluated. Spatial exposure strength, i.e., population times concentration for PM2.5, occurs in the main urban area of Kathmandu, Patan, Thimi, and Bhaktapur cities due to the large population living in these cities. From the model, we calculated the total number of deaths for the month of December, 2019 to be 19 from lung cancer and 175 from all cause disease, both PM2.5 induced. The results obtained showed that greater the emission and population concentration, greater is the mortality rate in the region. From our calculations, mortality burden was highest in central Kathmandu with a value of 1.081 and 6.93 per 100,000 people for lung cancer and all cause diseases, respectively. The highest PM2.5 concentration is seen in the central region of Kathmandu Valley where the population density is also high, thereby contributing to highest mortality in that area. If the monthly average emissions are reduced by 50%, the total number of deaths are also approximately reduced by 50%, implying that PM2.5 is directly related to total number of deaths in this case. Finally, the results indicate that PM2.5 is dangerous to human health and can even be fatal.
This research plays a role in understanding the health impacts caused by PM2.5 based on quantitative analysis. Since annual time period was not possible for this study, a future study with a longer time period could be proposed. Other air pollutants can also be studied in the future along with their health impacts. Moreover, study including whole Nepal as study area can also be proposed to further understand the relation between PM2.5 and its human health impact. There are evidences that link air pollution and health impacts and further studies are required on the health effects of air pollution in Kathmandu valley. The result from these studies can be used by policymakers to improve the air quality in Nepal. We also recommend the simulation for a longer time period at high resolution to better understand the relation between PM2.5 concentration and number of death attributable to it.
Data Availability Statement
The raw data supporting the conclusions of this article will be made available by the authors, without undue reservation.
Author Contributions
PM carried out the GIS processing of input and output data in the exposure maps. AT performed the population projection analysis. KS performed the simulations of WRF-Chem and coordinated the entire research. All authors contributed to the article and approved the submitted version.
Conflict of Interest
The authors declare that the research was conducted in the absence of any commercial or financial relationships that could be construed as a potential conflict of interest.
References
ADB (2010). Kathmandu Sustainable Urban Transport Project (RRP NEP 44058-01). Technical report, Asian Development Bank.
Bakrania, S. (2015). Urbanisation and Urban Growth in Nepal. Report, GSDRC, University of Birmingham, Birmingham.
CBS (2014). National Population and Housing Census 2011 (Population Projection 2011 - 2031). Technical report, Central Bureau of Statistics, Government of Nepal.
CEN and ENPHO (2003). Health Impacts of Kathmandu's Air Pollution. Technical Report September, Clean Energy Nepal (CEN) Environment and Public Health Organization (ENPHO). Submitted to Kathmandu Electric Vehicle Alliance, Prepared for KEVA Secretariat under USAID/Nepal.
Ghimire, K., and Shrestha, S. (2014). Estimating vehicular emission in Kathmandu Valley, Nepal. Int. J. Environ. 3:143. doi: 10.3126/ije.v3i4.11742
Gilmore, E. A., Heo, J., Muller, N. Z., Tessum, C. W., Hill, J. D., Marshall, J. D., et al. (2019). An inter-comparison of the social costs of air quality from reduced-complexity models. Environ. Res. Lett. 14, 3–6. doi: 10.1088/1748-9326/ab1ab5
Giri, D., Murthy, V. K., Adhikary, P. R., and Khanal, S. N. (2007). Estimation of number of deaths associated with exposure to excess ambient PM10 air pollution. Int. J. Environ. Sci. Technol. 4, 183–188. doi: 10.1007/BF03326272
Grell, G. A., Peckham, S. E., Schmitz, R., McKeen, S. A., Frost, G., Skamarock, W. C., et al. (2005). Fully coupled “online” chemistry within the WRF model. Atmos. Environ. 39, 6957–6975. doi: 10.1016/j.atmosenv.2005.04.027
Groosman, B., Muller, N. Z., and O'Neill-Toy, E. (2011). The ancillary benefits from climate policy in the United States. Environ. Resour. Econ. 50, 585–603. doi: 10.1007/s10640-011-9483-9
Gurung, A., and Bell, M. L. (2013). The state of scientific evidence on air pollution and human health in Nepal. Environ. Res. 124, 54–64. doi: 10.1016/j.envres.2013.03.007
Heo, J., Adams, P. J., and Gao, H. O. (2016). Reduced-form modeling of public health impacts of inorganic PM2.5 and precursor emissions. Atmos. Environ. 137, 80–89. doi: 10.1016/j.atmosenv.2016.04.026
IEc (2019). Evaluating Reduced-Form Tools for Estimating Air Quality Benefits. Technical report, Industrial Economics, Incorporated, Cambridge, MA.
Kim, B. M., Park, J.-S., Kim, S.-W., Kim, H., Jeon, H., Cho, C., et al. (2015). Source apportionment of PM10 mass and particulate carbon in the Kathmandu Valley, Nepal. Atmos. Environ. 123, 190–199. doi: 10.1016/j.atmosenv.2015.10.082
Krewski, D., Jerrett, M., Burnett, R. T., Ma, R., Hughes, E., Shi, Y., et al. (2009). Extended follow-up and spatial analysis of the American Cancer Society study linking particulate air pollution and mortality. Health Effects Inst. 5–114; discussion: 115–36.
Künzli, N., Medina, S., Kaiser, R., Quénel, P., Horak, F. Jr., and Studnicka, M. (2001). Assessment of deaths attributable to air pollution: should we use risk estimates based on time series or on cohort studies? Am. J. Epidemiol. 153, 1050–1055. doi: 10.1093/aje/153.11.1050
Lepeule, J., Laden, F., Dockery, D., and Schwartz, J. (2012). Chronic exposure to fine particles and mortality: an extended follow-up of the Harvard six cities study from 1974 to 2009. Environ. Health Perspect. 120, 965–970. doi: 10.1289/ehp.1104660
Macrotrends (2020). Kathmandu, Nepal Metro Area Population 1950-2021. Available online at: https://www.macrotrends.net/cities/21928/kathmandu/population
Muller, N. Z., and Mendelsohn, R. (2007). Measuring the damages of air pollution in the United States. J. Environ. Econ. Manage. 54, 1–14. doi: 10.1016/j.jeem.2006.12.002
NHRC (2018). Population Based Cancer Registries at Kathmandu, Bhaktapur, Lalitpur, Siraha, Saptari, Dhanusha, Mohattari, West Rukum and East Rukum Districts, Nepal, 2018. Technical report, Nepal Health Research Council, Government of Nepal.
Ostro, B., and Chestnut, L. (1998). Assessing the health benefits of reducing particulate matter air pollution in the United States. Environ. Res. 76, 94–106. doi: 10.1006/enrs.1997.3799
Pope, C. A. III., Burnett, R. T., Thun, M. J., Calle, E. E., Krewski, D., Ito, K., et al. (2002). Lung cancer, cardiopulmonary mortality, and long-term exposure to fine particulate air pollution. JAMA 287, 1132–1141. doi: 10.1001/jama.287.9.1132
Pope, C. A. III., and Dockery, D. W. (2006). Health effects of fine particulate air pollution: lines that connect. J. Air Waste Manage. Assoc. 56, 709–742. doi: 10.1080/10473289.2006.10464485
Regmi, R. P., and Kitada, T. (2003). Human-air pollution exposure map of the Kathmandu valley, Nepal: assesment based on chemical transport simulation. J. Glob. Environ. Eng. 9, 89–109. Available online at: https://ci.nii.ac.jp/naid/10024474542/en/
Sarkar, C., Sinha, V., Sinha, B., Panday, A. K., Rupakheti, M., and Lawrence, M. G. (2017). Source apportionment of NMVOCs in the Kathmandu Valley during the SusKat-ABC international field campaign using positive matrix factorization. Atmos. Chem. Phys. 17, 8129–8156. doi: 10.5194/acp-17-8129-2017
Shah, J. J., and Nagpal, T. (1997). Urban Air Quality Management Strategy in Asia. Kathmandu Valley report. The World Bank. doi: 10.1596/0-8213-4032-8
Shakya, K. M., Rupakheti, M., Shahi, A., Maskey, R., Pradhan, B., Panday, A., et al. (2017). Near-road sampling of PM2.5, BC, and fine-particle chemical components in Kathmandu Valley, Nepal. Atmos. Chem. Phys. 17, 6503–6516. doi: 10.5194/acp-17-6503-2017
Skamarock, W. C., Klemp, J. B., Dudhia, J., Gill, D. O., Barker, D. M., Duda, M. G., et al. (2008). A Description of the Advanced Research WRF Version 3. Technical report, Mesoscale and Microscale Meteorology Division, National Center for Atmospheric Research (NCAR), Boulder, CO.
Stone, E. A., Schauer, J. J., Pradhan, B. B., Dangol, P. M., Habib, G., Venkataraman, C., et al. (2010). Characterization of emissions from South Asian biofuels and application to source apportionment of carbonaceous aerosol in the Himalayas. J. Geophys. Res. Atmos. 115, 1–2. doi: 10.1029/2009JD011881
Tessum, C. W., Hill, J. D., and Marshall, J. D. (2017). InMAP: a model for air pollution interventions. PLoS ONE 12:e0176131. doi: 10.1371/journal.pone.0176131
Thind, M. P., Tessum, C. W., Azevedo, I. L., and Marshall, J. D. (2019). Fine particulate air pollution from electricity generation in the US: health impacts by race, income, and geography. Environ. Sci. Technol. 53, 14010–14019. doi: 10.1021/acs.est.9b02527
US EPA (2010). Quantitative Health Risk Assessment for Particulate Matter. U. S. Environmental Protection Agency.
US EPA (2020). Health and Environmental Effects of Particulate Matter (PM). US EPA. Available online at: https://www.epa.gov/pm-pollution/health-and-environmental-effects-particulate-matter-pm
Weather Atlas (2020). Monthly Weather Forecast of Kathmandu. Available online at: https://www.weather-atlas.com/en/nepal/kathmandu-climate
Keywords: air quality, exposure, health impact model, Kathmandu Valley, WRF-Chem model, PM2.5
Citation: Tuladhar A, Manandhar P and Shrestha KL (2021) Assessment of Health Impact of PM2.5 Exposure by Using WRF-Chem Model in Kathmandu Valley, Nepal. Front. Sustain. Cities 3:672428. doi: 10.3389/frsc.2021.672428
Received: 25 February 2021; Accepted: 10 May 2021;
Published: 24 June 2021.
Edited by:
Atinderpal Singh, University of Delhi, IndiaReviewed by:
Pallavi Saxena, Hindu College, University of Delhi, IndiaMohd Talib Latif, National University of Malaysia, Malaysia
Copyright © 2021 Tuladhar, Manandhar and Shrestha. This is an open-access article distributed under the terms of the Creative Commons Attribution License (CC BY). The use, distribution or reproduction in other forums is permitted, provided the original author(s) and the copyright owner(s) are credited and that the original publication in this journal is cited, in accordance with accepted academic practice. No use, distribution or reproduction is permitted which does not comply with these terms.
*Correspondence: Kundan Lal Shrestha, a3VuZGFuQGt1LmVkdS5ucA==