 Marianne Vanderschuren
 Alexandra Newlands
 Andrew Wheeldon
- 1Department of Civil Engineering, Centre for Transport Studies, University of Cape Town, Cape Town, South Africa
- 2Bicycle Cities, Cape Town, South Africa
Walking is the most important mode of transport in the “Global South. ” Depending on the location, the mode accounts for between 33 and 90% of trips. Despite its importance and the notion that walking is available to all, there are vast parts of the population that cannot use the mode, as infrastructure is not conducive. The gender and ability neutral approach to infrastructure provision ignores the needs of up to 75% of inhabitants, leading to isolation and the inability to access services. This paper describes the results of a desktop study that uses various types of literature and secondary data sources to conduct a qualitative assessment of the inclusivity of non-motorized transport and vulnerable population groups (women, children, the elderly, and people with disabilities) in its planning and implementation approach, rather than actual implementations. Cape Town is used as a case study city. Results were verified by local experts. Gender neutral planning and roll out of infrastructure has been slow and there is no evidence at all that women, children, and the elderly are considered in the “Global South” context. Regarding people with disabilities, there has been some progress. Tactile paving and drop curbs are occasionally included. However, due to a lack of training of contractors and personnel that audits implementation projects, the quality of infrastructure for people with disabilities is poor. In the case of Cape Town, the qualitative scores are a mere two credits out of a maximum of 75 credits regarding the non-motorized transport, gender and social inclusion in transportation planning and practice. The authors suspect that scores in many African cities will be even lower. As with many other cities in the “Global South,” and more specifically in Africa, Cape Town needs to change its management structure, break down the silos between departments, embrace the input of representatives of vulnerable groups during infrastructure design and implementation and, more importantly, increase the budget for non-motorized transport. There is also a clear need for improved training for contractors and city infrastructure auditors, as implemented infrastructure is often substandard. The study resulted in the development of a hierarchical framework.
Introduction
Urban centers in Africa overwhelmingly report that Non-Motorized Transport (NMT), particularly walking, is the dominant mode. Different studies report between 33 and 90% of trips are made as a pedestrian [Sub-Saharan Africa Transport Policy Program (SSATP), 2015; Vanderschuren and Jennings, 2017]. Walking is something that “most people who live in African cities have to do every day” (Okyere et al., 2021), as they are captive NMT users due to their economic circumstances.
Many Africans walk along and across major arterials and highways, as there are often no secondary roads that could be used as an alternative. Furthermore, urban sprawl makes distances and travel times long. If NMT facilities are available, they are often badly maintained. This leads to various secondary problems, such as inaccessibility for people with mobility challenges (on crutches, with a walking stick or in a wheelchair), drainage problems, poor landscaping, inadequate lighting and the likes. Anecdotal information from Kenya and Lesotho has revealed that, due to flooding, combined with missing manhole covers, children have drowned in the past.
One of the major burdens that NMT users in Africa face is road fatalities (and injuries), as verified in many country databases. While more than 5,000 pedestrians are killed on the world's roads each week [(World Health Organization (WHO), 2013)], in low- and middle-income countries, pedestrians are over-represented in road traffic fatalities. Vulnerable road users, mostly pedestrians, account for a third of road deaths [World Health Organization (WHO), 2009; Peden et al., 2013] in Sub-Saharan African cities.
Vulnerable population groups (women, children, the elderly and people with disabilities) experience an exponentially higher burden when using the transport system. Scholars with mobility impairments in the City of Tshwane recently reported to the authors that they do not consider their environment conducive to traveling independently. They cannot step away from any road safety hazards and are also too slow to get away from personal security danger. There is no safety or security provided anywhere.
A recent analysis of the South African Household Travel Survey (2013)1 revealed that approximately 75% (also representative of Cape Town) of inhabitants require special consideration in the planning, designing, and implementing of transport infrastructure. That percentage includes children, females, and persons with disabilities (see Figure 1). Furthermore, there are also adult males with compromised transport experiences, generally in lower income groups.
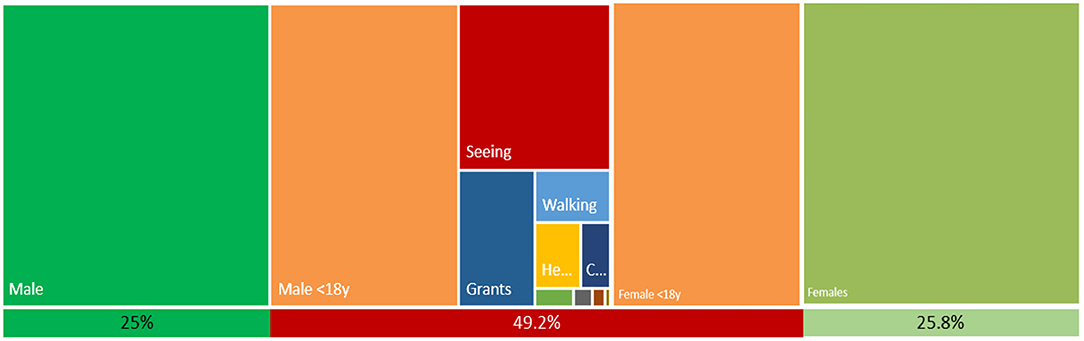
Figure 1. South African population gender, age, and disability split (SANHTS, 2013).
There is an overwhelming lack of support of walking (and cycling) in African cities. Many countries and cities in the region do not include the mode in plans and, where infrastructure is provided, implementation is often not fit for purpose. In many instances, this is further compounded by a lack of supply of suitable bicycles, with a failing or weak bicycle industry notably lacking in official government support.
The support of vulnerable population groups is equally lacking. Vanderschuren and Nnene (2021) established that the majority of African countries have neither general, nor transportation specific policies to support the most vulnerable in our society. Based on South African data, Vanderschuren and Nnene (2021) proved that this leads to severe isolation. This was confirmed by the two scholars with mobility impairments, who also indicated that this has led to anxiety and depression in the past.
To improve the transport experience for the most vulnerable, i.e., children, females, the elderly and people with disabilities, it is important to identify their travel needs and listen to their daily experiences using NMT. For example, the security of NMT users is an important factor to consider when thinking about the improvement of this transport mode, especially for the most vulnerable. According to the SANHTS (2013), 56% of household heads in South Africa are (very) unsatisfied with the security situation when walking to Metrorail stations. This is 38% for taxi ranks, 35% for bus stops and 14% for Gautrain stations (see Figure 2).
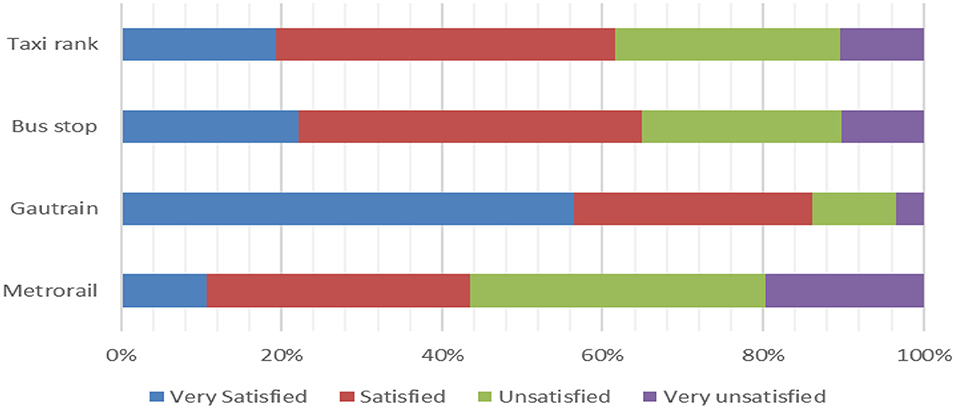
Figure 2. Satisfaction with security when walking to/from public transport (SANHTS, 2013).
The recognition of vulnerable population groups and the need to plan and design for them is a relatively recent development, i.e., the research priorities have shifted, over time, from a focus on enhancing road capacity where drivers were predominantly male, middle-class workers using private motor vehicles (Nash, 1976), in the 1970s, to gender issues in transport planning, four decades later (Allen and Vanderschuren, 2016).
Gender and social identity introduce the concept of “intersectionality,” which is critical to understanding “social inclusion.” The essence of intersectionality is that each individual is layered; they bear multiple social identities (i.e., gender, race, ethnicity, religion, place of residence and more) and each identity may confer either negative or positive social experiences. Intersectional research approaches encourage examining the experience of individuals in relation to the multiple intersecting characteristics that define an individual's experience of the city. Marginalization is, therefore, further exacerbated when people belong to more than one social exclusion group (UN Women, 2020). For example, an educated woman might face marginalization, due to her gender, but can still be relatively advantaged compared to other individuals, thanks to her social status.
From a transportation perspective, users make mode choices based on a variety of factors. These factors are economic, or service driven, based on individual roles, habits and interests or age, income, life cycle, gender and ability. As transport involves the human movement from one place or neighborhood to another, the power dynamics that flow from race, gender, class, and other systems of subjugation or privilege will, generally, transcend the boundaries of any given space, place or neighborhood (Kershaw and Forer, 2010). Analysis reflects different mobility patterns for males and females and suggests that harassment experiences have a significant effect on user choices (Vanderschuren et al., 2019).
Making transportation policy more responsive to Gender and Social Inclusion requires developing a structured approach to understanding different needs, identifying instruments to address those needs, analyzing the costs and benefits of the instruments, and establishing an appropriate policy framework. It also requires that Gender and Social Inclusion (G&SI) be represented at each step of the planning and design process of transport investments. Government agencies and NGOs, community-based organizations, and G&SI groups that can be involved in planning and implementation should be identified and consulted (UN Economic Social Council, 2008).
This paper unpacks the status quo on NMT provision, in general, and the provision of this for the most vulnerable population groups, more specifically, from a planning perspective. The focus of the study is on the management of NMT in Cape Town as a case study, rather than existing infrastructure implementations in conducive vs. non-conducive environments.
Methodology
The city-focus of the paper, as well as the accessibility of information, including secondary data, gray literature, meeting minutes and the likes, informed the case study choice, the City of Cape Town. The remainder of this document will unpack planning and practice trends in the City of Cape Town, and the magnitude of potential improvements.
The city's progress toward improving NMT, specifically for vulnerable road users and vulnerable population groups, will be investigated and analyzed qualitatively, looking through an NMT and “Gender and Social Inclusivity” lens simultaneously.
This desktop study leans heavily on the review of academic documents and gray literature. This is complemented by safety and security sources (see Figure 3). The combined literature forms the basis for two distinct components: a description of the case study and the identification of NMT specific G&SI indicators. Secondary data sources, particular to the City of Cape Town, were collected and analyzed. This also assisted in the description of the case study. Furthermore, interviews with experts that have a long-standing relationship with the City of Cape Town, spanning a two-decade period, through serving on committees (3), conduction projects (5), and lobbying officials (4), were conducted. For privacy reasons, names and positions are not included in this paper.
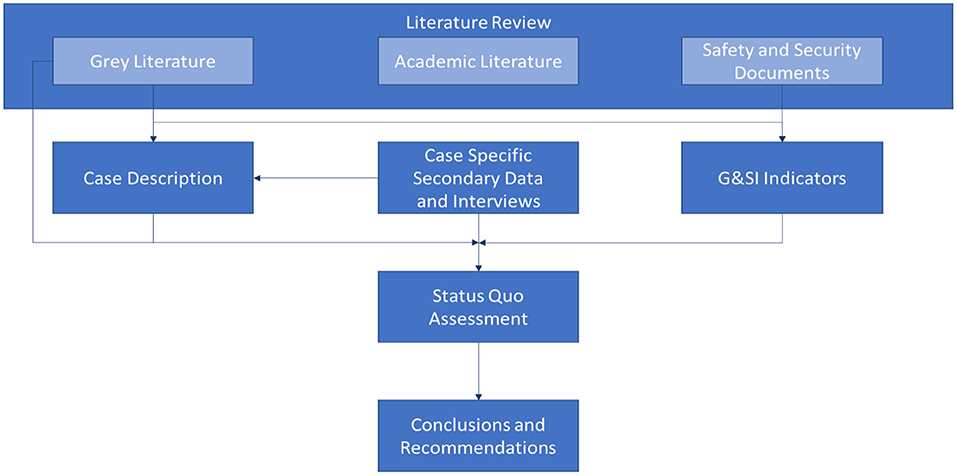
Figure 3. Flow diagram showing the methodology for this study.
The second part of this study involved using case specific secondary data, and interview information, together with the previously identified G&SI indicators, to conduct a qualitative status quo assessment for the City of Cape Town, as a case study for cities in the “Global South.” The indicators and results of the assessment are discussed in detail, and conclusions and recommendations are provided, suggesting improvements for NMT specific G&SI planning, with a focus on the situation in Cape Town (see Figure 3).
Case Study Description: The City of Cape Town
The City of Cape Town houses around 4.4 million people, making it the second largest metropolitan area by population size in South Africa [(City of Cape Town (CoCT), 2015)]. According to Statistics South Africa (STATSSA) (2013), 31.2% of Capetonians are age 17 or less. The City's land area is 2 446 km2, which results in an average density of almost 1,800 persons/km2, relatively low when compared to other major cities in Africa and the world. The density in the City of Cape Town varies significantly, from 10,120 persons/km2 in Khayelitsha to a mere 580 persons/km2 in Constantia [(Statistics South Africa (STATSSA), 2011)]. The City of Cape Town has identified the inhabitants of the denser suburban areas as most vulnerable, manifesting itself through poverty and unemployment, as well as limited access to healthcare. The latter has resulted in more COVID-19 casualties in Gugulethu, Khayelitsha, Mitchells Plain, Macassar, and Du Noon [(City of Cape Town (CoCT), 2020)].
In Cape Town, four reliable historic data sources were identified that provided modal splits for all trips. The percentages in the different databases range substantially. For walking, the National Household Travel Survey (NHTS) 2013 identifies 20% as the mode share, while the Census 2011 found that 24% of people in Cape Town walk. For other modes, the different ranges are also substantial (see Figure 4): public transport ranges between 26 and 38%, while travel by private vehicle ranges between 34 and 50%. All databases found the percentage of bicycle use low (between 0.4 and 1%). When including all trip purposes and walking as an ingress and egress mode, an overwhelming 46.7% of all trips are made using NMT (Vanderschuren and Jennings, 2017), which is comparable to other African cities. In low-income areas, Behrens and van Rensburg (2009) found that walking is the main mode for 61% of households. It is, therefore, essential that this mode of transport is given sufficient attention and resources, in order to provide safe and secure infrastructure for all inhabitants. When analyzing the NMT trips by gender split, 43.4% are made by males, and the remaining 56.5% by females (SANHTS, 2013).
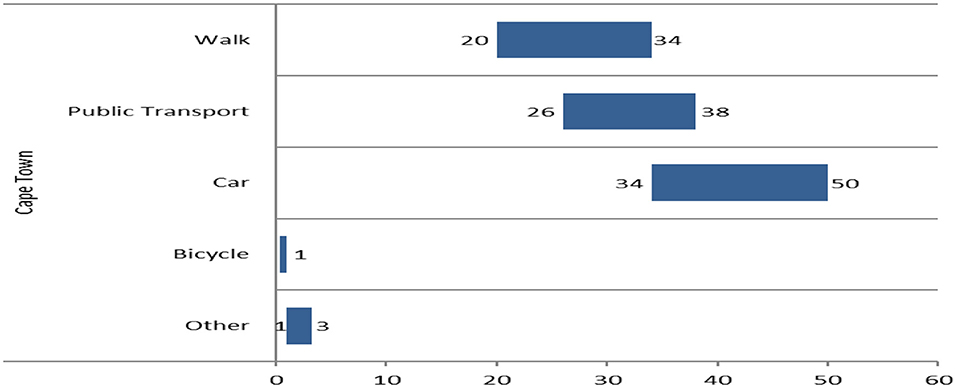
Figure 4. Modal share in the city of Cape Town [Statistics South Africa (SANHTS), 2003; Census, 2011; CCT, 2013; Statistics South Africa (STATSSA), 2013; Vanderschuren and Jennings, 2017].
Figure 1 showcases that transport planning is not gender or needs neutral. In South Africa, 75% of the population should be reviewed differently than currently the case in planning processes. When reviewing the portions for Cape Town, similar patterns emerged. In the planning process, the over 1.2 million children are not catered for appropriately. They are unable to travel to school independently, as the road safety and personal security threats are significant. Other vulnerable populations groups are the almost 27,000 Capetonians with hearing impairment, that cannot anticipate traffic coming from behind (Pardo-Ferreira et al., 2020).
The literature review revealed the challenges of persons that have mobility impairments. When using a walking stick or crutches, swift movement for a road safety or personal security danger is not possible. In Cape Town, almost 27,500 inhabitants require a walking aid. A further 22,000 persons in the City of Cape Town require a wheelchair to fulfill their mobility needs. A lack of appropriate facilities and services has led to 7,500 of them not being able to make any trips in the 7 days before the SANHTS data collection day in 2013. Although the impacts are less challenging for more, there are another 660,000 Capetonians that suffer from reduced vision, potentially hampering their road safety and personal security judgement.
In Cape Town, the road fatality burden falls heavily on NMT users, as 57% of fatalities are pedestrians and 3% are cyclists (Vanderschuren and Jennings, 2017). The latter is extremely high, given the low mode share of between 0.4 and 1%, as mentioned before.
As women are more cautious, their road safety burden is not particularly high. However, their personal security burden is high. In a study along the “safest” train route in Cape Town, 57.9% of female passengers indicated that they have reported crimes. Furthermore, besides pickpocketing and muggings that males are also exposed to, females have experienced verbal (10%) and sexual harassment (6%) during the use of Cape Town's transport services (Vanderschuren et al., 2019).
For children in Cape Town, road fatalities are the third leading cause of death. In Cape Town, 4 050 children were injured in road crashes between 2015 and 2017, while 183 children perished on Cape Town's roads (ChildSafe, 2018). Unfortunately, there is a lack of data regarding personal security challenges among children. Improved data collection is required. For persons with disabilities, there is a lack of data for road safety and personal security.
Analysis of G&SI in NMT Planning in the Case City of Cape Town
Supporting NMT users and vulnerable population groups requires the development of a vision, strategy, supporting plans and appropriate guidelines (Vanderschuren and Nnene, 2021) that guide the conducive implementation of infrastructure projects. Based on the literature and interviews a list of indicators was established. Via a desktop approach, the extensive list was consolidated into 25 individual indicators (see Table 1). The latter actually needs to happen on the ground, which requires a conducive management structure. In many cities around the world, various city departments work in silos. They advocate the implementation of strategies, in general, but do not even implement these strategies in their own organization. Furthermore, funding allocation may not promote the vision. It is paramount, when implementing a strategy, to monitor the success. This requires the collection of information. When advocating and promoting the vision and strategy, provision of services goes beyond infrastructure implementation, and required access to vehicle and specific services. Regarding gender and social inclusion, this includes reporting hotlines, panic buttons and the likes. The integration of all transport services, specifically NMT infrastructure and services with public transport, is at the base of good planning.
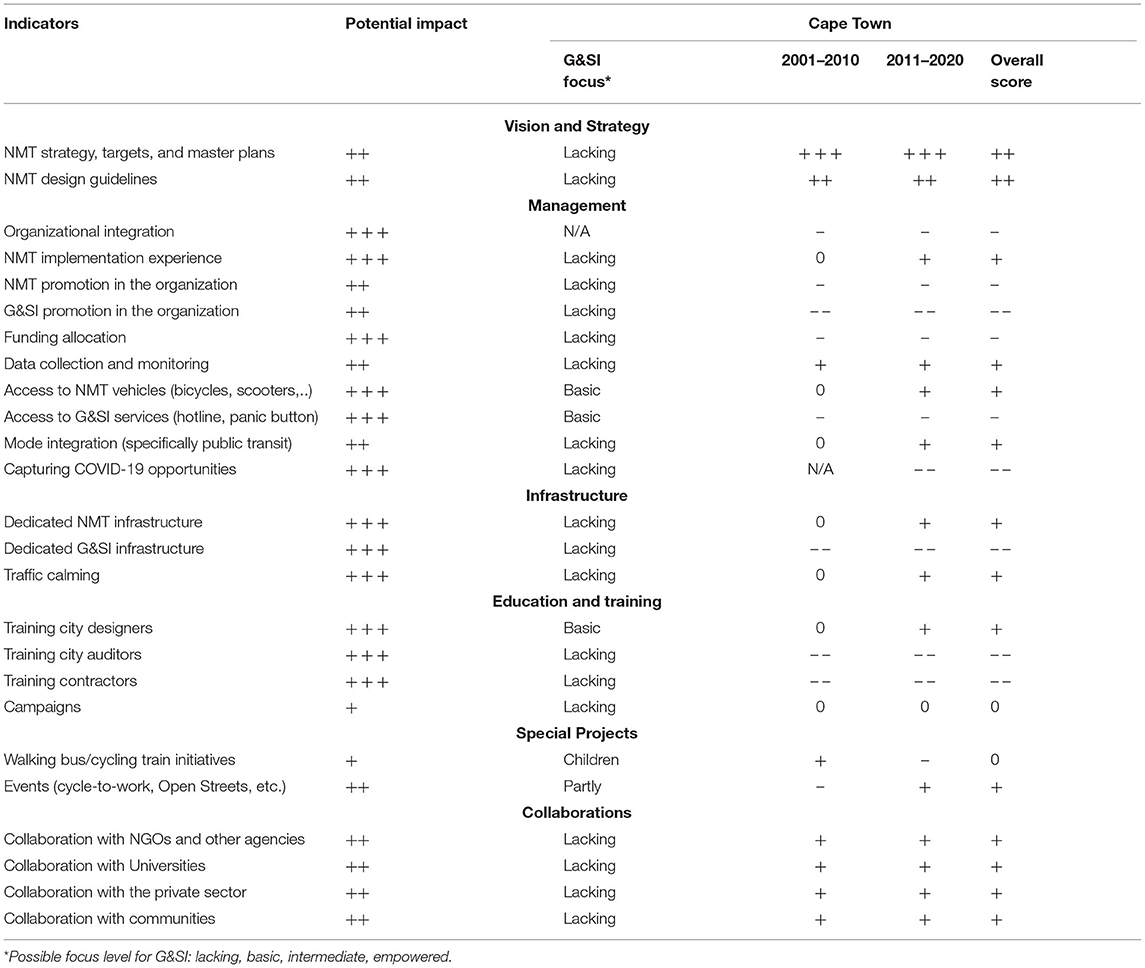
Table 1. Qualitative G&SI based NMT implementation assessment for the case city of Cape Town.
It is important to note that, despite the effects of lockdown, health concerns, curfew, and the limitations in the supply of bicycles, due to reduced manufacture, industry hours, availability of materials and a reduction in shipping and importation, levels of cycling still managed to grow significantly over the period between late 2019 and early 2021—and in many markets, across many countries. Many governments responded positively to the concept of the social distancing and health benefits of cycling, whilst maintaining productivity and allowing safe movement and commuting of their citizens. As a result, for example, Finland, Poland and Canada saw an increase in online searches for google maps for cycling routes of over 250% during the first half of 2020. Italy, Portugal, France, the UK and Germany all witnessed an increase in cycling of over 20% between September 2019 and September 2020 (Is the COVID-19 cycling boom real? The numbers say yes! | ECF). The final management indicator that will be included in the qualitative assessment is the opportunities to create more inclusive cities, created by COVID-19.
Implementation on the ground will only transform when training is provided (World Bank, 2020). Training needs to happen at all levels, i.e., for the personnel in design offices, for the colleagues that sign off drawings, as well as sites after implementation, and the contractors conducting the work on the streets. A further training and education opportunity is influencing the broader public through campaigns.
Either in collaboration with external entities, such as NGOs, Universities, the private sector, or communities, or on their own accord, cities can elect to provide special events, such as walking bus or cycling train initiatives for schools, car-free days, and cycle-to-work days, to name a few (Mitullah et al., 2017). These special events do need to be supported by campaigns and should consider G&SI too (see Table 1).
Reviewing the Table 1 with a “bird-eye-view” it is clear that appropriate management, infrastructure implementation and targeted training programs have the highest impact potential. It is possible to write comprehensive strategy and guideline documents that do not lead to the improvements in practice. Special projects can have a major local impact, but the benefits do not necessarily spill over to other areas and the city at large. The same holds for collaboration initiatives that generally have a local focus.
As mentioned, the inclusion of women, children, the elderly and people with disabilities is required during the planning, implementation and operation of the transportation system (Vanderschuren and Nnene, 2021). The scores can range from lacking to empowered. Reviewing the G&SI assessment for the case city of Cape Town, it is clear that major improvements are required. Besides occasional tactile paving infrastructure and drop curbs, no proof was found of the consideration of vulnerable population groups. The authors acknowledge that this field has recently gained traction internationally (over the past 5 years), however, Cape Town is already lagging behind.
When quantifying the overall score, where the maximum score per indicator is 3 credits, the City of Cape Town's value is a mere 2 credits, out of a maximum of 75 credits. A paradigm shift is required for the city to move toward G&SI based NMT implementation (see Table 1).
It is paramount to develop a vision and strategy for G&SI based NMT implementation. Regarding G&SI, there is no evidence of the inclusion in any of the case city of Cape Town's documentation. The city has developed and used NMT strategies, targets, and masterplans over the past two decades. Nonetheless, according to Laing et al. (2019) “Cape Town's vision for transport and its strategy for change and improvement remain somewhat unclear.” Giving the city the benefit of the doubt, the overall score is two plusses for both “Vision and Strategy” indicators.
Interviews revealed that the City of Cape Town is a hierarchical and fragmented structure. Various departments have their own responsibilities, and collaboration is not a major priority. NMT implementation through parks is a success in many global cities. However, the “Parks and Recreation” department is not a stakeholder in mobility provision. Even past collaboration cannot be appropriately maintained, as the employees in the Parks and Recreation department are not trained regarding NMT implementation, and neither in G&SI. The overall score is, therefore, one minus (see Table 1).
Dedicated planning of NMT projects in the case city of Cape Town started in 2003 [(City of Cape Town (CoCT), 2005)], catalyzed by the planning of the Velo Mondial Conference, which was hosted in Cape Town in 2006. The vision of the city at the time was to have demonstration projects implemented by the time the Conference arrived. Unfortunately, this did not materialize at the time. At the conference itself, a declaration was compiled together with all the delegates and signed off by the City of Cape Town—this has since helped as a guide, but not a hard and fast policy document. Since, various NMT plans and projects have seen the light, even if the roll out is slow. This warrants an overall score of one plus.
There is no evidence that the City of Cape Town is actively promoting NMT projects. Over the years, some plans were verbalized, but no proof of implementation has commenced. The city scores a minus one for the promotion of NMT in the organization. For G&SI, the situation is even worse. There is no evidence at all of any meetings, documents and roll out on the ground. The overall score is, therefore, minus two.
“There are severe fiscal and funding constraints, which bring uncertainty to capital- and revenue-intensive plans for transport systems expansion and upgrade” (Laing et al., 2019). The dedicated budget for NMT is 2%, while there are some investments in other departments, Ward Councilors etc. However, even if the amount is twice the estimated budget, there is a clear underspending and this has not changed over the past two decades, even though the NMT share is substantial in the city (46.7%, see section Case Study Description). “The City of Cape Town's Cycling Strategy (2017) set a target of achieving 8% of all trips by bicycle by 2030 (from 1% in 2015). Yet the requirements to commence implementing this strategy have not yet been integrated into the City's overall transport action plans” (Laing et al., 2019), nor has budgeting for the implementation started. The overall score for funding allocation by the City of Cape Town is, therefore, minus one.
The city actively collects transportation data. Road safety information is also monitored. However, more dedicated G&SI data, and NMT data is warranted. The overall score is, therefore, plus one. The score for “access to NMT vehicles” is also plus one. Where there were no services in the decade from 2001–2010, some services have emerged, for example a rental bike scheme in the Sea Point area. As there is an upwards trend, the overall score is plus one. The access to G&SI services, however, is very basic. The only system identified by the researcher is the “Dial-a-Ride” system, which is very specific to people with disabilities (and also falls outside the NMT focus of this paper). The overall score for the City of Cape Town on G&SI services is minus one.
The City of Cape Town has made a real effort to include NMT along the BRT systems. The system was designed as a legacy project for the Soccer World Cup 2010. Unfortunately, operations only started after the event. Given the upward trend, the City of Cape Town scores plus one on mode integration. Furthermore, a study by Baufeldt and Vanderschuren (2017) revealed that the implementation of cycling infrastructure has not led to an increase in ridership or a decrease in crashes. Baufeldt and Vanderschuren concluded that this is due to flaws in the design and implementation of infrastructure.
Bicycle retailers, in South Africa, witnessed an enormous increase in demand for bicycles since COVID-19 affected our lives and lifestyles, notably in the area of commuter-style and e-bikes. However, as the international production and supply faced harsh shortages with lockdown, it was proving difficult to meet this need. This has eased somewhat during 2021, but there is still a delay to the supply chain. The large importers have seen lead times three to four times the length of pre-covid on certain items. Officials in the City of Cape Town have indicated that cycling forms an important component of the COVID-19 mobility response but has been slow to respond in any meaningful way. Chapter 9 of the City of Cape Town draft 2021 CITP Annual Review details NMT and the need to expand the walking and cycling networks and the review of the NMT, Walking and Cycling Strategies. The City has placed a strong emphasis on the 2017 Cycling Strategy and to the need to build upon the goals set out therein. However, COVID-19 called for a major rethink, and for a critical realignment of budgets and of an immediate response to the pandemic: the urgency of this was not fully appreciated nor acted upon [(City of Cape Town (CoCT), 2021)].
Hand in hand with the lack of funding goes a slow implementation pace of NMT infrastructure and traffic calming measures. However, given the fact that there is some implementation, the overall score for each indicator is plus one. On the other hand, there is no spending on G&SI infrastructure at all, resulting in an overall score of minus two.
The case city of Cape Town, sometimes in collaboration with NGOs, Universities, private entities and communities, implements “Special Events.” Examples are walking buses at schools, cycle-to-work and Open Streets events. Some events have increased over time, while others were initiated but collapsed when the city stopped their support. The latter is particularly the case for walking buses at schools. The over score for special events is, therefore, plus one.
Given that some of the previous indicators mentioned are implemented in consultation or collaboration of entities external to the city, the score for each of the collaboration stakeholders is one plus.
Conclusions and Recommendations
Walking is a daily activity for most (South) Africans. However, road environments are often hostile environments. Road crashes, resulting in pedestrian injuries and fatalities, are common and global improvement efforts have not materialized in major reductions, calling for improved infrastructure provision.
The international research community has made a paradigm shift toward the gender and social inclusive transportation planning, as women, children, the elderly, and people with disabilities require a different approach, compared to the traditional male commuter focus. In the South African context, the estimated portion of the population that has not received sufficient attention by transport planners and engineers, amounts to 75% of the population. The lack of special focus on the most vulnerable in our societies, has led to isolation and reduced mobility.
Like many other cities and countries in the “Global South,” Cape Town's transportation planning traditionally focuses on commuter travel. Depending on the data source, between 20 and 34% of commuters walk, while the cycling portion is <1%. When including all trip purposes, an overwhelming 46.7% of all trips (SANHTS, 2013) in the case city of Cape Town are made using NMT.
Unfortunately, the City of Cape Town also ignores the most vulnerable in its planning approach, while the volume of people with disabilities in the city should not be ignored. Almost 27,000 Capetonians are hearing impaired, another 27,500 inhabitants require the use of a walking aid to get around, and a further 22,000 persons are wheelchair users. The isolation and mobility challenges of people with disabilities is clear when it is revealed that 7,500 wheelchair users do not travel at all within the SANHTS (2013) data collection. Interviews with persons using walking aids, revealed major road safety and personal security risks.
Reviewing non-motorized transport and social inclusion literature, six categories of indicators surfaced, including having a vision and strategy, management, infrastructure, education and training, special projects (such as walking buses, cycling-to-work days, and Open Streets events), as well as collaboration with relevant stakeholders. Over the past two decades, the case city of Cape Town has made limited progress regarding these indicator categories. The qualitative assessment revealed a score of two credits, out of a potential 75 credits. It can, therefore, be concluded that there is major room for improvement, within the case city of Cape Town, regarding non-motorized transport provision and the inclusion of women, children, the elderly, and people with disabilities.
It is paramount that the transportation systems in the “Global South” are built on a people centric vision. This is also the case in the City of Cape Town. Improving the daily experience for our people, specifically in the City of Cape Town, requires:
• A management improvement: the three most important improvements in the case city of Cape Town is breaking down the silos between departments, developing a common vision, and moving a substantial part of the budget toward non-motorized transport and gender and social inclusion. During all project phases, non-motorized transport, as well as gender and social inclusion representatives, should be consulted. Data collection practices also need to be reviewed, for example, to include people with disabilities in injury and fatality statistics. When a larger part of the budget is spent on non-motorized transport, the required experience of planners, implementors, contractors and auditors will automatically follow.
• The pace of non-motorized transport infrastructure implementation has been extremely slow. The earlier mentioned budget change should increase the infrastructure rollout. When planning and implementation, G&SI experts should be part of the project team. Furthermore, improved traffic calming rollout is required to warrant the safety of the most vulnerable.
• Education and training are a must regarding non-motorized transport implementation, as previous studies have revealed that current implementation practices, specifically for cycling are not meeting requirements (Baufeldt and Vanderschuren, 2017). To improve designs and implementation, training needs to focus on employees from the design office, the contractors, and the personnel responsible for auditing projects before sign-off.
• On a different note, campaigns can improve the safety and security of non-motorized transport users, in general, and women, children, the elderly and people with disabilities, more specifically.
• Special projects are a brilliant way to trail ideas and expose communities to a different reality. Previous events in the case city of Cape Town included walking bus projects for school children in different suburban areas, cycle-to-work days and car-free corridors on Sundays, organized in collaboration with various NGOs. Unfortunately, the no events have recently been implemented, and that includes capturing the opportunity created by COVID-19.
• Various special events have previously been implemented in collaboration with external stakeholders, such as universities, NGOs, the private sector, and communities. Collaboration and the co-production of knowledge can be a catalyst for system improvement. It is, therefore, paramount that the cities embrace external experts, community leaders and the likes. External stakeholders are not the enemy or a nuisance. When the City recognizes that community leaders are the glue and leverage needed to get local buy-in, and experts have knowledge and experience to share, the possibilities to build a sustainable, and socially inclusive transportation system are endless.
The different facets presented above are interrelated. This study identifies a hierarchical framework, presented in Figure 5. Where a vision is needed to transform into become a fully gender and socially inclusive, appropriate infrastructure is required to meet basic requirements. Infrastructure examples include smooth surfaces, lighting, and clear sightlines. A full overview of the hierarchical framework is presented in Figure 5.
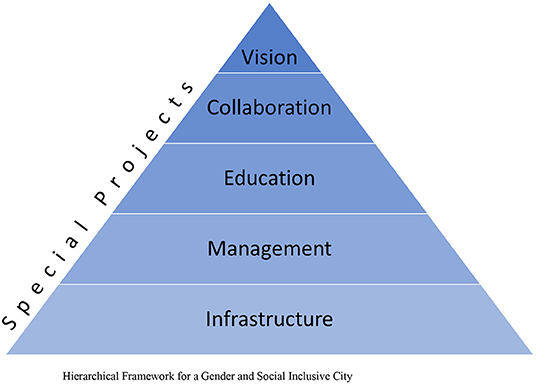
Figure 5. Hierarchical framework for a gender and social inclusive city.
Data Availability Statement
The original contributions presented in the study are included in the article/supplementary materials, further inquiries can be directed to the corresponding author/s.
Ethics Statement
The studies involving human participants were reviewed and approved by Ethics in Research Committee (EiRC), EBE Faculty, UCT. The patients/participants provided their written informed consent to participate in this study.
Author Contributions
MV has conducted the research and drafted the paper. AN and AW have collaborated in a supporting role and added some of the details. All authors contributed to the article and approved the submitted version.
Conflict of Interest
The authors declare that the research was conducted in the absence of any commercial or financial relationships that could be construed as a potential conflict of interest.
Publisher's Note
All claims expressed in this article are solely those of the authors and do not necessarily represent those of their affiliated organizations, or those of the publisher, the editors and the reviewers. Any product that may be evaluated in this article, or claim that may be made by its manufacturer, is not guaranteed or endorsed by the publisher.
Acknowledgments
The authors would like to thank all officials, committee members, project contributors and lobbyists for their insights. A work of thank also goes to Cheryl Wright for her editing efforts.
Footnotes
1. ^This analysis will be redone with the 2019 data, once the raw data is available to the authors.
References
Allen, H., and Vanderschuren, M. (2016). Safe and sound – international research on women's personal safety on public transport. Research Series: Paper 6. Paris: FIA Foundation.
Baufeldt, J., and Vanderschuren, M. (2017). “Non-motorized transport infrastructure assessment in cape town,” in Non-Motorized Transport Integration Into Urban Transport Planning in Africa, eds W. Mitullah, M. Vanderschuren, and M. Khayesi (Cape Town: Routledge), 112–125. ISBN: 9781472411402.
Behrens, R., and van Rensburg, J. (2009). Key results of a feasibility study of non-motorised travel initiatives amongst selected Rondebosch schools, Rondebosch schools non-motorised transport initiative, ACET Project 11: school travel planning. Working Paper 11-01. Rondebosch; Cape Town: University of Cape Town.
ChildSafe (2018). Preventing Road Injuries Impacting Children in South Africa (PRICSA) - Secondary Data analysis Report, ChildSafe is a campaign of the Child Accident Prevention Foundation of Southern Africa (CAPFSA) and Safe Kids Worldwide.
City of Cape Town (CoCT) (2005). NMT Policy and Strategy, Vol. 1: Status Quo Assessment. The City of Cape Town's Transport Authority, Cape Town.
City of Cape Town (CoCT) (2015). City of Cape Town Cycling Strategy. The City of Cape Town's Transport and Urban Development Authority, Cape Town.
City of Cape Town (CoCT) (2020). Profile and Analysis – District Development Model, Developed by the City of Cape Town for the Republic of South Africa, Stay Safe South Africa, and the National Development Plan 2030.
City of Cape Town (CoCT) (2021). Comprehensive Integrated Transport Plan 2018 – 2023 – 2021 Annual Update, Draft for Public Participation. Transport Directorate, Cape Town.
Kershaw, P., and Forer, B. (2010). Selection of area-level variables from administrative data: an intersectional approach to the study of place and child development. Health Place 16, 500–511. doi: 10.1016/j.healthplace.2009.12.008
Laing, G., Williams, R., and Guerrero Casas, M. (2019). The Urgent Agenda for Non-motorised Transport – Working Together to Reclaim Cape Town's Streets for People. Open Streets Cape Town.
Mitullah, W., Vanderschuren, M., and Khayesi, M. (2017). Non-Motorized Transport Integration Into Urban Planning in Africa. London; New York, NY: Taylor and Francis Group, Routeledge.
Nash, C. A. (1976). “Urban passenger transport,” in Public versus Private Transport: Macmillan Studies in Economics. ed C. A. Nash (London: Palgrave). doi: 10.1007/978-1-349-15629-0_5
Okyere, S., Oviedo, D., Frimpong, L., Nieto, M., and Kita, M. (2021). People Living in African Urban Settings Do a Lot of Walking: But Their Cities Aren't Walkable. Available online at: https://theconversation.com/people-living-in-african-urban-settings-do-a-lot-of-walking-but-their-cities-arent-walkable-156895 (accessed September 13, 2021).
Pardo-Ferreira, M. C., Torrecilla-García, J. A., de Heras-Rosas, C., and Rubio-Romero, J. C. (2020). New risk situations related to low noise from electric vehicles: perception of workers as pedestrians and other vehicle drivers. Int J Environ Res Public Health. 17:6701. doi: 10.3390/ijerph17186701
Peden, M., Kobusingye, O., and Monono, M. E. (2013). Africa's roads – the deadliest in the world. South Afr. Med. J. 103, 1–3. doi: 10.7196/SAMJ.6866
Statistics South Africa (SANHTS) (2003). National Household Travel Survey (SANHTS), 2003. Version 1. Pretoria: Statistics South Africa [producer], 2005. Cape Town: DataFirst [distributor], 2016.
Statistics South Africa (STATSSA) (2011). Census 2011: Census in Brief, Statistics South Africa, Pretoria. Available online at: http://www.statssa.gov.za/?s=census%20dataandsitem=statistics%20by%20place
Statistics South Africa (STATSSA) (2013). National Household Travel Survey (SANHTS), 2013. Version 1. Pretoria: Statistics South Africa [producer], 2014. Cape Town: DataFirst [distributor], 2014.
Sub-Saharan Africa Transport Policy Program (SSATP) (2015). Policies for sustainable accessibility and mobility in urban areas of Africa. Working Paper No. 106.
UN Economic and Social Council (2008). Achieving Sustainable Development and Promoting Development Cooperation - Dialogues at the Economic and Social Council. Office for ECOSOC Support and Coordination, United Nations, New York, NY. ISBN: 978-92-1-104587-1.
UN Women (2020). Realising Women's Rights to Land and Other Productive Resources - Second Edition. United Nations Human Rights Office of the High Commissioner, New York, NY; Geneva. Available online at: https://creativecommons.org/licenses/by-nc-nd/3.0/igo/.
Vanderschuren, M., and Jennings, G. (2017). “Non-motorized transport travel behaviour in Cape Town, Dar es Salam and Nairobi,” in Non-Motorized Transport Integration into Urban Transport Planning in Africa, eds W. Mitullah, M. Vanderschuren, and M. Khayesi (Routledge), 11–26. ISBN: 9781472411402.
Vanderschuren, M., Phayane, S., and Gwynne-Evans, A. (2019). Perceptions of gender, mobility, and personal safety: South Africa moving forward. Transp. Res. Rec. 2673, 1–12. doi: 10.1177/0361198119854087
Vanderschuren, M. J. W. A., and Nnene, O. A. (2021). Inclusive planning: African policy inventory and South African mobility case study on the exclusion of persons with disabilities. Health Res. Policy Syst. 19:124. doi: 10.1186/s12961-021-00775-1
World Bank (2020). Handbook for Gender-Inclusive Urban Planning and Design. Washington, DC: International Bank for Reconstruction and Development/The World Bank.
World Health Organization (WHO) (2009). Global Status Report on Road Safety: Time for Action. Geneva: World Health Organization. ISBN 978 92 4 156384 0.
World Health Organization (WHO) (2013). More Than 270 000 Pedestrians Killed on Roads Each Year. Available online at: https://www.who.int/news/item/02-05-2013-more-than-270-000-pedestrians-killed-on-roads-each-year (accessed September 13, 2021).
Keywords: non-motorized transport, gender inclusive planning, social justice, road design, road infrastructure implementation, Cape Town
Citation: Vanderschuren M, Newlands A and Wheeldon A (2022) Improving Non-Motorized Transportation Provision in a Socially Inclusive Way—the Case of Cape Town. Front. Sustain. Cities 4:775339. doi: 10.3389/frsc.2022.775339
Received: 13 September 2021; Accepted: 31 May 2022;
Published: 27 June 2022.
Edited by:
Meleckidzedeck Khayesi, World Health Organization, SwitzerlandReviewed by:
John Zacharias, Peking University, ChinaMuhammad Zaly Shah, University of Technology Malaysia, Malaysia
Copyright © 2022 Vanderschuren, Newlands and Wheeldon. This is an open-access article distributed under the terms of the Creative Commons Attribution License (CC BY). The use, distribution or reproduction in other forums is permitted, provided the original author(s) and the copyright owner(s) are credited and that the original publication in this journal is cited, in accordance with accepted academic practice. No use, distribution or reproduction is permitted which does not comply with these terms.
*Correspondence: Marianne Vanderschuren, bWFyaWFubmUudmFuZGVyc2NodXJlbkB1Y3QuYWMuemE=