 Shengyan Cao
 Yafei Wang
 Zhuobiao Ni
 Beicheng Xia1
- 1School of Environmental Science and Engineering, Sun Yat-sen University, Guangzhou, China
- 2College of Natural Resources and Environment, South China Agricultural University, Guangzhou, China
With the expansion of cities, the urban population explodes globally, and the thermal environment continues to deteriorate. The studies on urban microclimate have important implications for the construction of green communities and the sustainable development of cities. Various blue-green infrastructures (BGIs) in the urban ecosystem play an important role in regulating urban microclimate and human thermal comfort. This study investigated the current microclimate of a residential area (Chigang community, Guangzhou) under hot weather by carrying out field surveys. Subsequently, a model was established with ENVI-met to simulate the microclimate conditions under different BGIs scenarios. The results showed that adding water bodies can improve the thermal comfort of residential areas. The cooling effect was the best when the water bodies were added dispersedly. In terms of thermal comfort, adding water bodies reduced the heat stress in the surrounding environment. In addition, reducing the existing vegetation heated the study area and reduced humidity. The more dispersed the vegetation, the better the thermal comfort. Vertical greening has better cooling and humidifying effects before noon, whereas it slightly increased the temperature of the study area in the afternoon. Finally, the dispersed vegetation combined with the addition of vertical greening in Chigang community was found to be the optimal design. Under the optimal scenario, the proportion of “neutral” thermal comfort was increased by 1.65%. The results of this study provide references for urban planning and BGI construction.
Introduction
With the rapid rate of urbanization in China, the urban population is increasing steadily, and the scale of the city has continued to expand, resulting in the continuous deterioration of the urban environment (Zhou and Zhang, 1985; Li et al., 2007). The root cause of urban thermal environment deterioration lies in man-made heat emissions, underlying surface changes, and various pollutants generated in the process of daily production and life (Evyatar, 2008). The deterioration of the thermal environment has led to a sharp rise in the frequency of heat island effect, acid rain, and smog (Luke, 2012). These environmental problems have severely reduced the residents' quality of life and threatened their health and living conditions. The environmental issues and ameliorative strategies are gaining increasing attention. In terms of the urban heat island effects, previous studies mainly focused on the regional, national, or international scale as the research level, while the urban microclimate gradually attracted attention in the late twentieth century. Different from urban climate and architectural climate, the research field of urban microclimate is more complex, involving meteorology and climatology, physical geography, life science, environmental physics, architecture, and urban and rural planning. The research on urban microclimate is important for the construction of green communities, the improvement of human settlements, and the sustainable development of cities (Xue, 2016).
The various blue-green infrastructures (BGIs) in the urban ecosystem, such as lakes, canals, gardens, greenways, etc., play an important role in the development of human society and cities, by contributing ecosystem services to human wellbeing in the urban ecosystem (Li, 1999). As an effective and practical approach to alleviate urban heat islands and enhance thermal comfort, BGIs have attracted more and more attention from urban environmental researchers (Guidotti, 2010; Wang et al., 2014). In the process of urbanization, it is necessary to carry out quantitative research on the impact of BGIs on different functional areas of the city, especially the residential areas that are closest to people's living environment. Developing and improving a comprehensive research method combining field measurement and numerical simulation are necessary to help better understand the role of BGIs in the sustainable development of cities, as well as planning and managing these infrastructures to maximize their ecosystem services (Zhang et al., 2019).
In this study, field measurements combined with model simulation were carried out in Chigang community, Guangzhou, under hot weather (Liu et al., 2012). In total, four blue infrastructure scenarios and 12 green infrastructure scenarios were constructed to compare the effects of BGIs with various amounts and layouts. Finally, a comprehensively optimal design of BGIs for the residential area was obtained from the perspective of adjusting the environmental thermal comfort under hot weather. The results of this study provide a reference for the improvement of the urban human settlement environment.
Methods
Study Area
Guangzhou (latitude 22°26′ to 23°56′N, longitude 112°57′ to 114°3′E) is located in the south of China, at the middle and northern edge of the Pearl River Delta. It is the confluence of Beijiang, Xijiang, and Dongjiang rivers. It borders Boluo and Longmen counties to the east, Sanshui, Nanhai, and Shunde to the west, Qingyuan, Fogang, and Xifeng to the north, Dongguan, and Zhongshan to the south. Facing Hong Kong and Macao across the sea, it is the Chinese “Southern Gate” and one of the starting points of the Maritime Silk Road.
Chigang community, the research area of this study, is located 1.5 km north of Haizhu Lake, 256-m long, 250-m wide, and a total area of 64,000 m2 (Figure 1). It is a typical community located in the central city of Guangzhou. The heights of the buildings are from 20 to 30 m, while the vegetation is mainly trees (a total of 94) distributed on both sides of the road and around the building, such as Ficus microcarpa, Roystonea regia, etc.
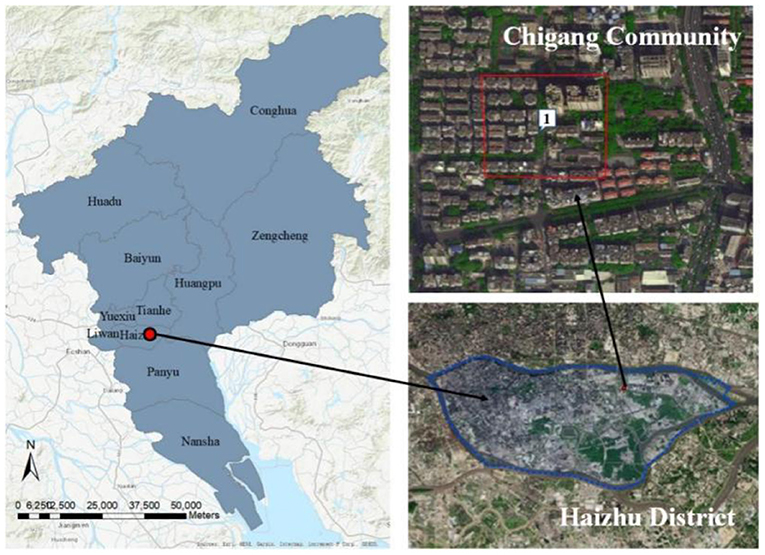
Figure 1. Bitmap of the study area (from Baidu Satellite Map).
Field Measurements
In order to explore the microclimatic condition in Chigang community, field measurements were carried out in the study area on a hot day during autumn 2019 (October 19, 2019). To avoid interference from direct sunlight, the measurement was performed in a shaded place by the tree canopy. The selected measurement location of the study area is shown in Figure 1. At a height of 1.5 m from the ground to the measuring point, the microclimatic conditions were monitored with a mobile microclimate monitoring station equipped with a thermal index WBGT measuring instrument (model: WBGT-2010SD, ball diameter 75 mm, from Lutron Electronics Co., Ltd.), and an anemometer (model: HHF-SD1, from OMEGA) (Figure 2). The measured parameters included air temperature (Ta), black bulb temperature (Tg), relative humidity (RH), wind speed (Va), and were automatically stored once at a frequency of half a minute. The measurements were taken from 10 a.m. to 5 p.m. local time. The fisheye images of the canopy cover were taken in the measurement area (Panasonic DMC-FZ100, From Panasonic Electric Co., Ltd.). Subsequently, the LAD values of vegetation were analyzed by the CAN-EYE image analysis software.
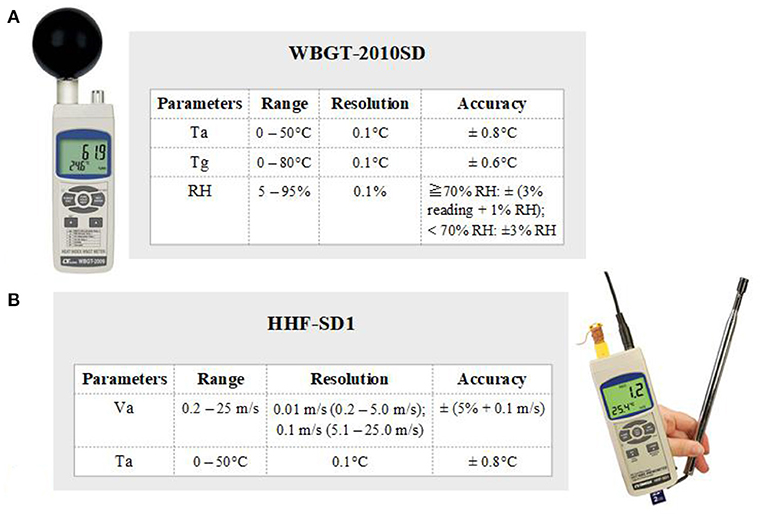
Figure 2. Field measurement instruments [(A) is a heat index WBGT measuring instrument, and (B) is an anemometer].
ENVI-Met Model Setup
According to the Urban Residential Area Planning and Design Standard GB50180-2018, the green land rate of new residential areas shall not be <30%, and the green land rate of old areas shall not be <25%. At present, certain types of water, such as pools, falls, and fountains have been added in many residential areas. These blue-green infrastructures not only enhance the landscape of the residential area but also improve the thermal comfort level of the residential area. Zhang (2017) performed various ENVI-met models with different water body layouts within a square to simulate the corresponding changes in temperature, relative humidity, and thermal comfort. The study found that different water body layout factors had a major impact on the microclimate during the day, with less impact at night. Zhang (2015) extracted typical green space forms and quantitative indicators of green space in the residential areas, established a model using ENVI-met as a simulation platform, and evaluated and compared microclimate under different green space layouts from four aspects, including thermal environment, wind environment, thermal comfort, and particulate matter concentration based on numerical statistics. However, previous studies mostly focused on the impact of single infrastructure on microclimate. Therefore, this study considers different types of both green and blue infrastructures, of which microclimatic impacts are comprehensively addressed in the study site of Chigang community.
ENVI-met is a 3D grid-based computational fluid dynamics (CFD) model for the simulation of surface–plant–air interactions with spatial and time resolutions of 0.5–10 m and 1–10 s, respectively. The first step in using ENVI-met is building a 3D model of the research area. In this research, the model area was built based on Google Earth satellite images, LocaSpace Viewer digital map application software, and field survey data. The required data include elevation data [digital elevation model (DEM)], surface data (type and distribution), building data (structure, height, material, and distribution), and vegetation data (LAD, height, crown, and distribution). The meteorological inputs were obtained from the weather station near the study area. The data from the weather station is used as the background value of the model constructed by ENVI-met. After ENVI-met calculates the simulated value of temperature and relative humidity based on the background value, the value measured on the spot is used for verification to judge the effect of the model simulation.
The resolution of the model in the study area was set according to the actual situation. The pavements of the model were all concrete. The number of nesting grids was set as 3 to move the model borders as far away as possible from the core area, thereby improving numerical stability. The underlying surface of the nesting area was set to concrete. The specific modeling and configuration file parameters are shown in Table 1. The ENVI-met model of the research area is shown in Figure 3.
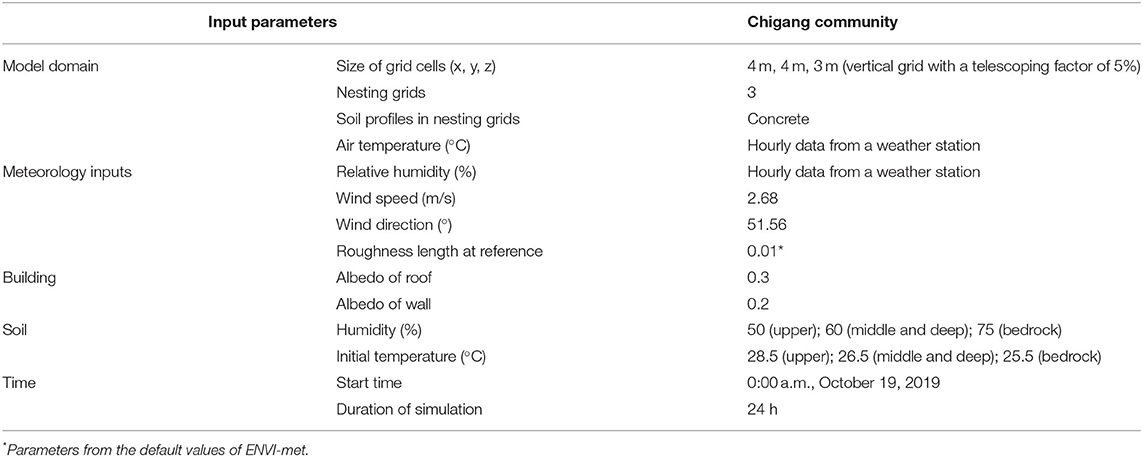
Table 1. Chigang community modeling file and configuration file.
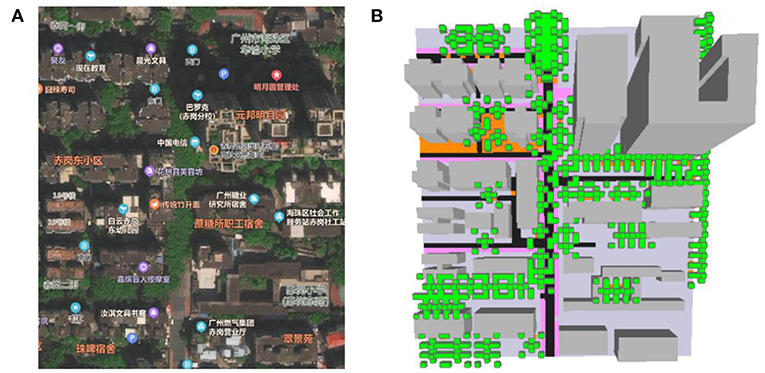
Figure 3. Satellite image (A) and model image (B) of Chigang community.
After running a 24-h stimulation with a half-hour interval, Ta and RH at 1.5-m height were extracted from the whole study area. For assessing thermal comfort conditions, a well-known biometeorological index, the physiological equivalent temperature (PET) that was estimated in ENVI-met was also obtained (Lai, 2012). Table 2 demonstrates the PET classifications for (sub)tropical regions (Matzarakis et al., 2010; Morakinyo et al., 2017).
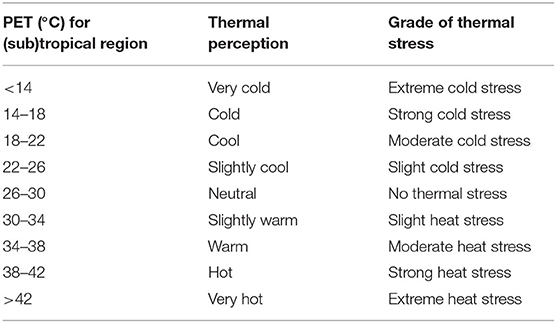
Table 2. Thermal sensation classification for (sub)tropical regions [source: according to Matzarakis et al. (2010), Morakinyo et al. (2017)].
Model Evaluation
Figure 4 shows the correlation analysis diagram between the field-measured Ta and RH in Chigang community and the simulated values from 10:00 to 17:00 on October 19, 2019. It can be seen that the R2 of the two values were 0.961 and 0.938, respectively, indicating a strong correlation. To further evaluate the simulation accuracy, root mean square error (RMSE), mean absolute percentage error (MAPE), and Wilmot consistency index (d) were calculated. For a reliable model, R2 and d should approach 1 as much as possible, while RMSE and MAPE approach 0 as much as possible. Table 3 shows the error analysis of Ta and RH. It can be seen in Table 3 that R2 > 0.6, d > 0.65, RMSE, and MAPE were close to 0, indicating that the errors between the measured value and simulated value were small in Chigang community, and the model can accurately simulate the microclimate in Chigang community.
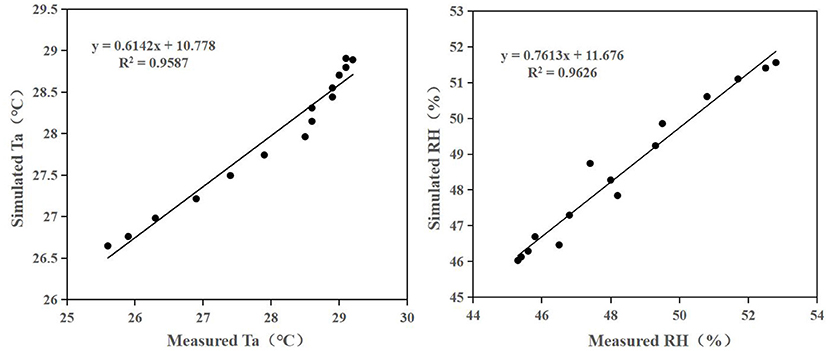
Figure 4. Simulated air temperature (Ta)/relative humidity (RH) and measured Ta/RH in Chigang community.
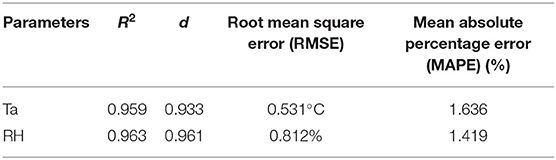
Table 3. Quantitative measurement of ENVI-met model performance based on simulated and measured values of meteorological elements in Chigang community.
Results
Microclimatic and Thermal Conditions of Study Area
Under the current situation, the thermal difference of the whole study area was obvious. At 14:00 on October 19, 2019, the maximum and minimum Ta at 1.5 m above the ground in Chigang community were 30.01 and 25.5°C, respectively. The maximum and minimum RH were 58.05 and 43.10%. From 10:00 a.m. to 17:00 a.m., the Ta increased steadily and reached a maximum of 28.89°C at 16:00. The RH showed a slow downward trend, and the maximum value was 51.56%. PET of Chigang community was estimated by ENVI-met simulation, and the average PET value on October 19, 2019 was 26.11°C. Figure 5A shows the grade distribution of all-day thermal comfort in Chigang community. The highest thermal sensation frequency was “slightly cool” (60.06%), followed by “cool” (15.46%), and “neutral” (7.96%). Figure 5B shows the frequency distribution of thermal comfort in Chigang community at different times throughout the day, which displays the difference of thermal sensation between day and night. At midnight, the thermal condition began to be “warm” and “hot,” and even “extremely hot” in some areas. After 10:00, all thermal sensations were “cool” and “slightly cool,” with the former reaching up to 70% and the latter reaching 100% from 15:00 to 17:00.
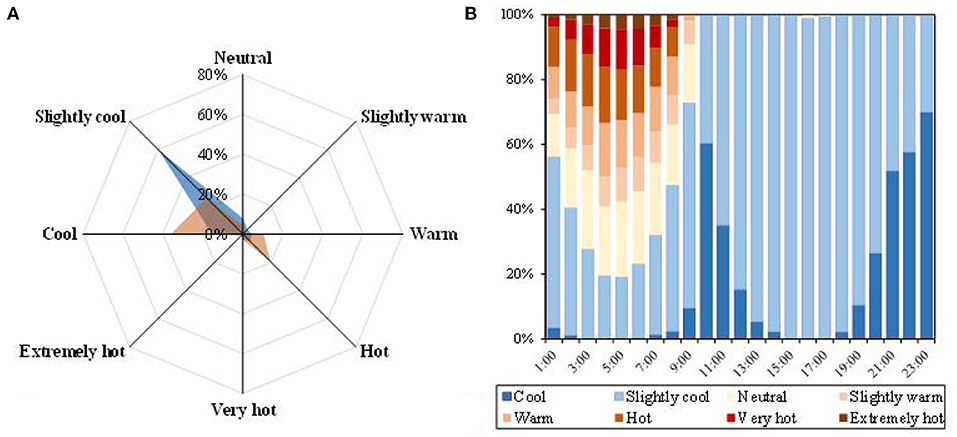
Figure 5. Distribution of thermal comfort level in Chigang community (A) and overtime (B).
Effect of Blue Infrastructure
There was no blue infrastructure in Chigang community under the current situation. The influence of blue infrastructure on microclimate and thermal comfort in the study area was explored by adding different layouts of the water body. In this study, the blue infrastructures that account for 5% of the total area based on the current situation of Chigang community were added. The layouts and location of the added blue infrastructures are shown in Figure 6.
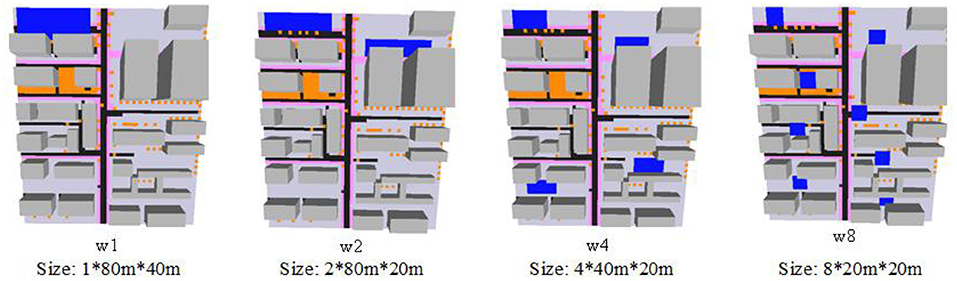
Figure 6. Different layouts of water bodies in Chigang community.
Figure 7A shows the Ta differences of Chigang community under different layouts of the water body. It can be seen that Ta between the four scenarios and the current situation were all negative, indicating that adding the water body can reduce the Ta in Chigang Community. In W1 scenario, Ta fluctuated greatly, demonstrating that the influence of the centralized water body on microclimate was not stable. In general, the cooling effect on the whole region from low to high was W1 < W8 < W4 < W2. In terms of RH, ΔRH between the four scenarios and the current situation were all positive, indicating that adding water increased the average RH of Chigang community. The trend of ΔRH was basically consistent within the four scenarios. ΔRH first increased and then decreased before 10:00, and then tended to be stable. In general, the humidifying effect for the whole region was W8 < W4 < W1 < W2. Figure 7B shows the PET frequency distribution of different water body layouts in Chigang community. The criteria for judging thermal sensation is that the closer the thermal sensation is to “neutral,” or the less the thermal sensation is to “extremely cold,” “extremely hot,” “very cold,” and “very hot,” the more comfortable the thermal sensation is. The proportion of “neutral” sensation decreased slightly after adding the water body, whereas “hot,” “very hot,” and “extremely hot” decreased due to the cooling effect of the water body. Therefore, the water body could improve the thermal comfort of Chigang community. The comparison among the four scenarios showed that the thermal comfort levels changed little, and “slightly cool” and “cool” accounted for a large proportion.
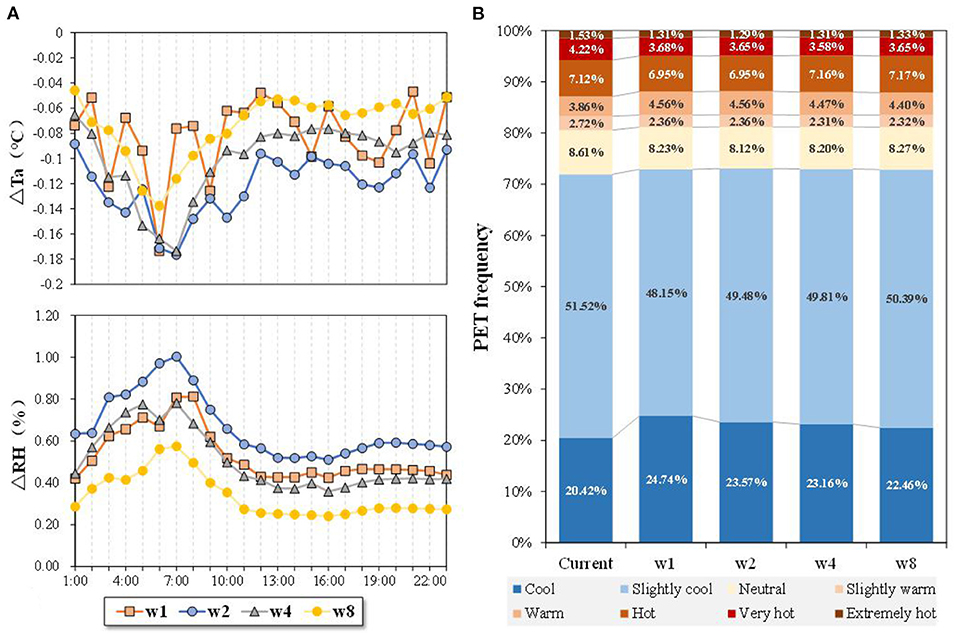
Figure 7. Hourly changes in average ΔTa and ΔRH of different water body layouts in Chigang community (A). Physiological equivalent temperature (PET) frequency distribution under different water body layout scenarios in Chigang community (B).
Effect of Green Infrastructure
Current Trees
In total, there were 94 trees in Chigang community. Of the total trees, 20, 50, and 100% were removed to explore the impact of current trees on the microclimate in Chigang community. Figure 8 shows the changes in trees in the ENVI-met model.
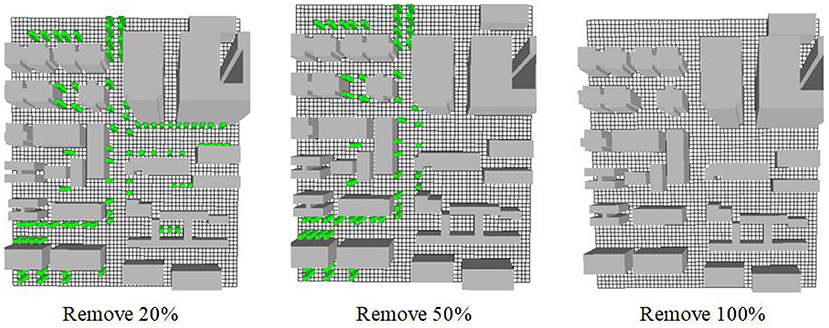
Figure 8. Model of changed trees in Chigang community.
Figure 9A shows the difference of Ta in Chigang community with different tree covers. It can be seen that the three scenarios were likely to exhibit similar heating trends. Before 10 o'clock, the heating effect was great, and the curve fluctuated greatly. After 10 o'clock, the heating effect decreased dramatically, and the curve was relatively stable. The larger the removed tree cover, the stronger the heating effect. In the case of 100% removal, the Ta can be increased by up to 0.076°C. In terms of RH, before 10 o'clock, the moisture reduction was large, and the curve fluctuated greatly under three scenarios. After 10 o'clock, the dehumidification effect decreased dramatically, and the curve was more stable. The larger the tree cover is, the greater the dehumidification effect. In the case of 100% removal, the RH can be reduced by up to 0.283%. Figure 9B shows the PET frequency distribution of different tree covers in Chigang community. It can be seen that, with the increase in removed trees, the frequency of comfortable thermal sensations, such as “neutral,” decreases, while the proportion of uncomfortable thermal sensations, such as “extremely hot,” “very hot,” “hot,” and “cool,” gradually increases. For example, when the trees were completely removed, the frequency of “neutral” sensation decreases by 0.56%, whereas “extremely hot,” “very hot,” and “hot” were increased by 2.43% in total. Therefore, reducing tree cover deteriorated the thermal condition of Chigang community.
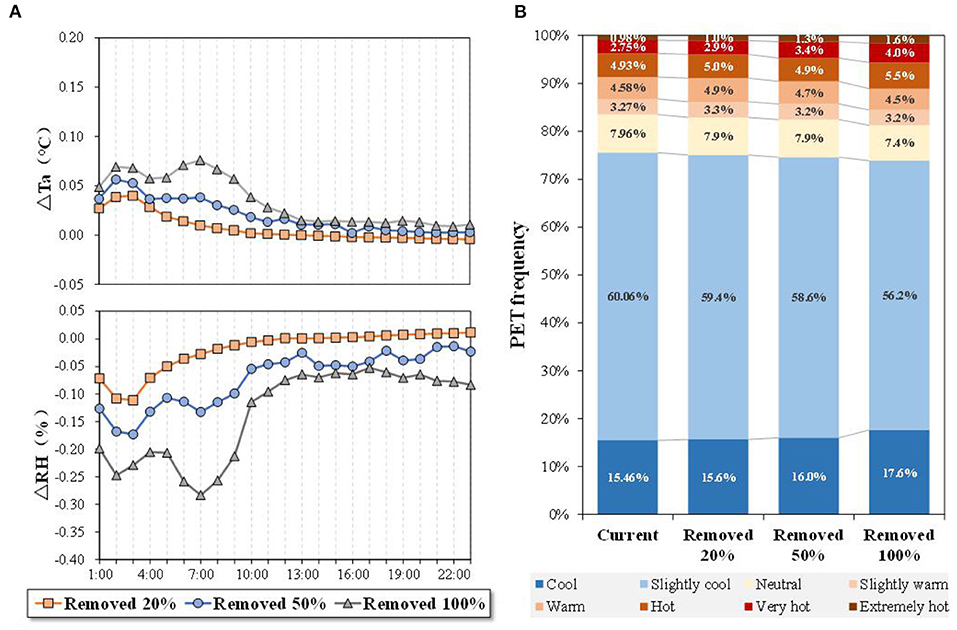
Figure 9. Hourly changes in average ΔTa and ΔRH of different tree covers in Chigang community (A). PET frequency distribution of different tree cover scenarios in Chigang community (B).
To sum up, the reduction in tree cover led to the increase in Ta, the decrease in RH, and the deterioration of thermal comfort in Chigang community. However, the changes in tree cover had little impact on the overall microclimate of the community because of the small and distributed trees in the community.
Adding Trees With Different Layouts
As mentioned above, this study explored the influence of existing trees on microclimate and thermal comfort in Chigang community, and found that green infrastructure made certain contributions to the cooling and humidification of the community and the improvement of thermal comfort. However, since the existing green infrastructures in Chigang community were distributed trees and rare, the effect was limited. Therefore, this study further explored the effect of the extra green infrastructures (5% of the total area) on the microclimate of Chigang community by adding trees with different layouts. The added tree was the most common species in the study area, i.e., Ficus microcarpa, with a height of 20 m. Figure 10 shows the layouts and location of added trees.
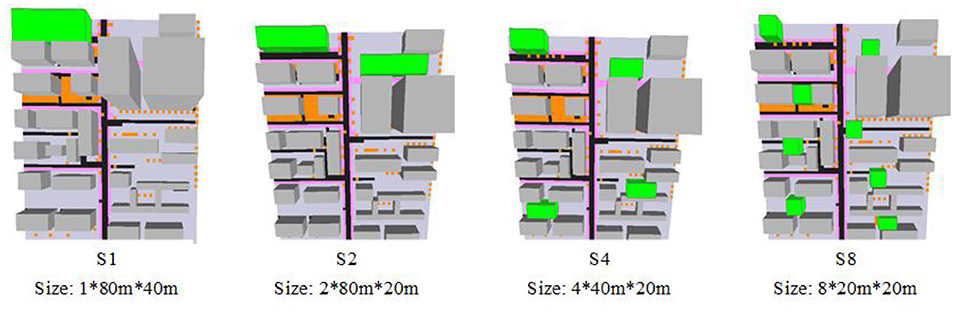
Figure 10. Different tree layouts in Chigang community.
Figure 11A shows the Ta difference in Chigang community between different tree layout scenarios and the current situation. It can be seen that ΔTa of the four scenarios were all negative, indicating the positive cooling effect of adding trees. The ΔTa in the four scenarios showed a similar trend. However, ΔTa fluctuated the most under S1 scenario, indicating that the influence of clustered trees on Ta was unstable. The mean values of the whole day for the four scenarios were −0.073, −0.096, −0.098, and −0.084°C, respectively. The cooling effect for the whole region from low to high was S1 < S8 < S2 < S4. In terms of RH, ΔRH of the four scenarios were all positive, indicating that adding trees increased the RH of the Chigang community. With a similar trend, the ΔRH in the four scenarios increased before 10:00, then decreased, and finally stabilized. The mean ΔRH of the four scenarios were 0.537, 0.519, 0.445, and 0.394%, respectively. The results indicated that the more clustered trees were, the stronger the humidification effect were. Figure 11B shows the PET frequency distribution of the different tree layouts in the Chigang community. Compared with the current situation, the proportion of “neutral” sensation did not change much after adding trees, whereas the proportion of “hot,” “very hot,” and “extremely hot” decreased. Hence, adding trees improved the thermal comfort of the Chigang community. Comparing the four layout scenarios, the more dispersed trees added, the better the thermal condition became, with the proportion of “neutral” increased, and the “extremely hot” and “very hot” decreased. Therefore, S8 scenario had the best effect on improving the thermal condition of Chigang community.
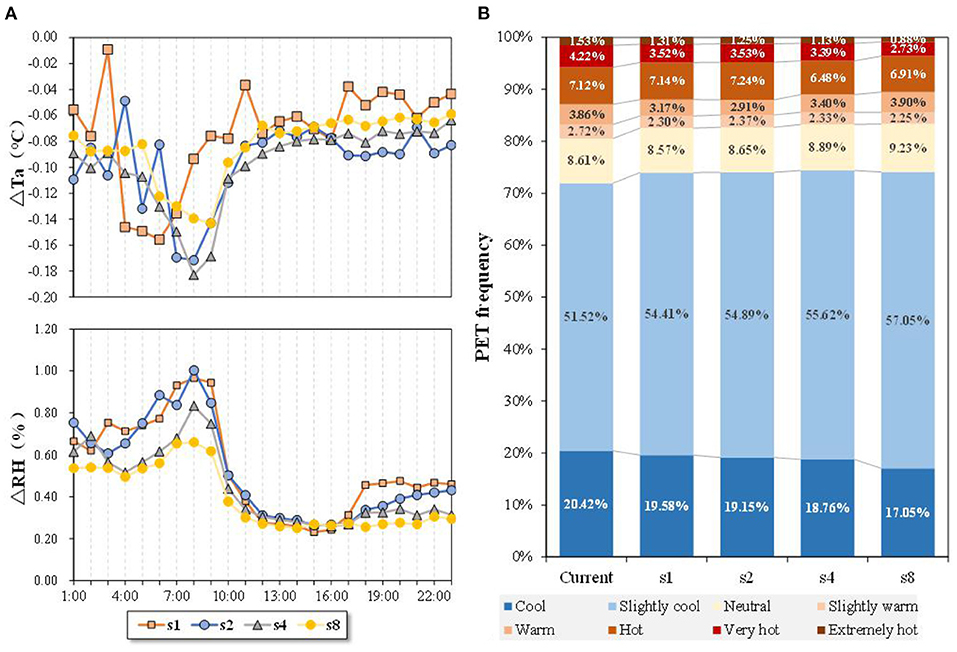
Figure 11. Hourly changes of mean ΔTa and ΔRH of different vegetation layouts in Chigang community (A) PET frequency distribution under different vegetation layout scenarios in Chigang community (B).
Adding Vertical Greening
Due to the lack of space for adding green infrastructures in Chigang community, this study explored the influence of vertical greening on the microclimate of Chigang community. As shown in Figure 12, the green wall was set on all four sides of all buildings in the study area. In the ENVI-met model, the green walls with LAI = 1.5 m2/m2 and thickness = 0.3 m were added. The heights of the green wall were 3 m (v3), 6 m (v6), 9 m (v9), 12 m (v12), and fully covered (vall).
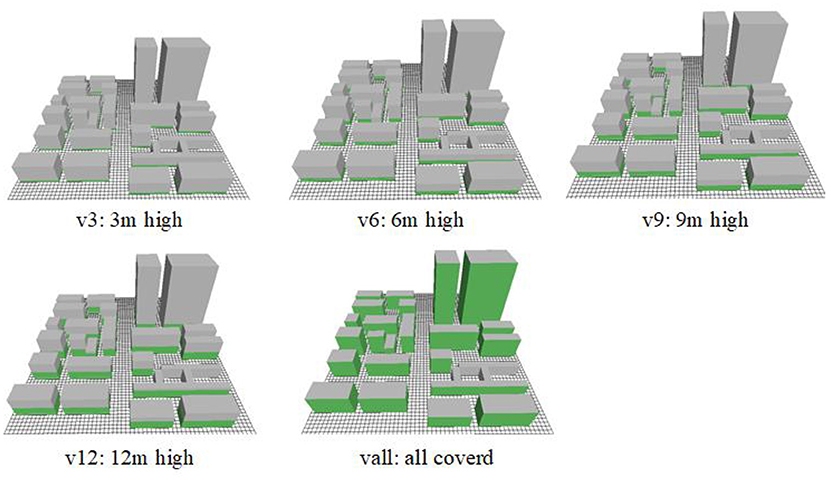
Figure 12. Layouts of different vertical greening.
Figure 13A shows Ta differences in the community under different vertical greening scenarios compared with the actual situation of the Chigang community. Before 12:00, vertical greening reduced the Ta of the Chigang community. The more vertical greening, the better the cooling effect. When vertical greening was added to all walls, the maximum Ta decrease in the community was 0.25°C at 8:00. In the afternoon, the vertical greening slightly increased the mean Ta of the community. The more greening was added, the higher the Ta is. Under the scenario of greening all walls, the maximum Ta increase can reach 0.08°C. In addition, adding vertical greening before 12:00 increased the mean RH of Chigang community. In the scenario of adding vertical greening to all walls, the mean RH of the community was increased by 1.7% at 7:00. After 12:00, the humidification effect of vertical greening decreased dramatically, basically below 0.2%.
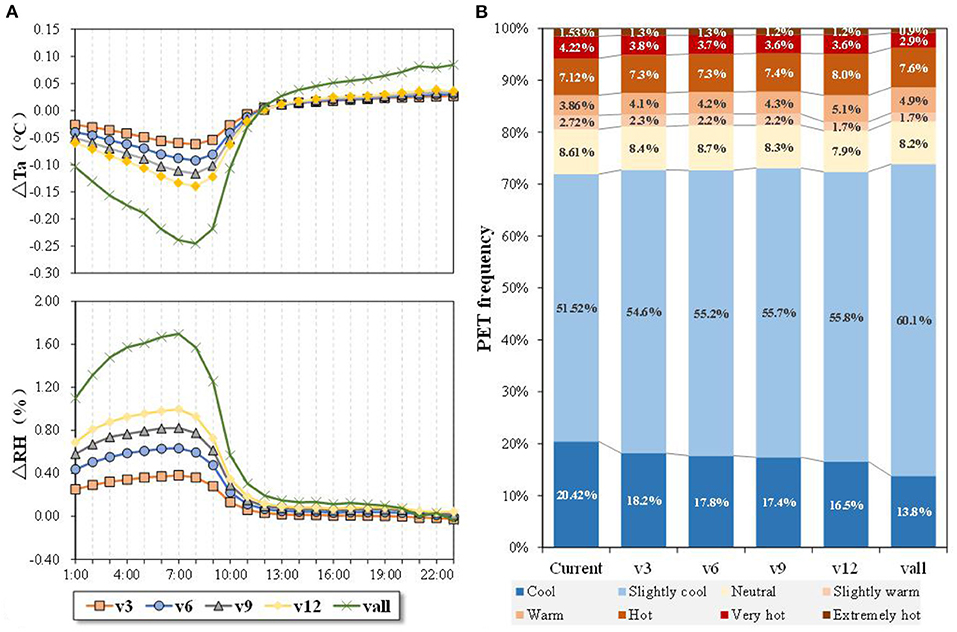
Figure 13. Hourly changes in average ΔTa and ΔRH of different vertical greening quantities in Chigang community (A). PET frequency distribution in Chigang community with different vertical greening quantities (B).
Figure 13B shows the PET frequency distribution of scenarios with different amounts of vertical greening in Chigang community. It can be seen that the vertical greening had little change in “neutral”; however, it decreased the proportion of “very hot” and “extremely hot.” Therefore, adding vertical greening improved the thermal condition of Chigang community. By comparing the five scenarios with different amounts of vertical greening, it was found that as the amount of vertical greening increased, the frequency of “neutral” increased, whereas the proportions of uncomfortable heat sensations, such as “extremely hot,” “very hot,” “hot,” and “cool,” gradually decreased, for example, comparing all wall greening and 3-m greening, whereas “extremely hot” “very hot,” and “hot” were reduced by 1%. Therefore, the more vertical greening, the better the thermal condition for the entire area.
Optimal Blue-Green Infrastructure Design
Effects of Optimal Design on Microclimate
According to the above findings, adding BGIs with different layouts and locations in Chigang community mitigated the urban warming and improved local thermal comfort conditions. For the blue infrastructure, W8 scenario had the strongest effect on improving the thermal condition; S8 scenario performed the best among the green infrastructure scenarios. Comparing the PET frequency distribution of S8 and W8, it is found that when the adding area and layout were consistent, green infrastructures performed better on the cooling and humidification effect and thermal comfort of Chigang community than that of the water body. Therefore, S8 was selected for the optimal design of Chigang community. Moreover, vertical greening was also found to improve the thermal condition of the study area and was not limited by the horizontal space. Hence, we combined S8 with all wall greening and compared their performance on the cooling and humidification effect with individual S8 and W8. Figure 14 shows the optimal design of BGIs for Chigang community in ENVI-met.
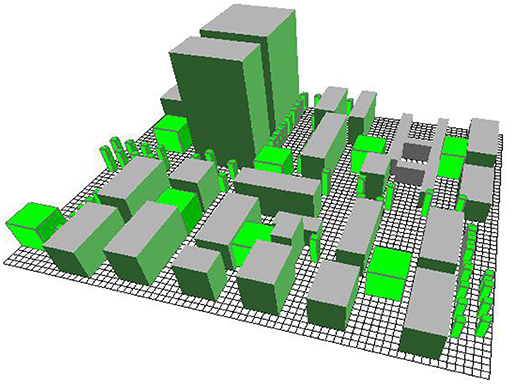
Figure 14. The optimal design of blue-green infrastructures (BGIs) for Chigang community in ENVI-met.
The comparison of Ta and ΔRH between the optimal design with individual S8 and W8 is shown in Figure 15A. It can be seen that the cooling effect first increased and then decreased with time, reaching the maximum value of 0.32°C at 8:00. After 12:00, the optimal design heated up Chigang community instead due to the vertical greening, and the heating effect became stronger with time. In terms of RH, the humidification effect of the optimal design was stronger than that of S8 and W8 scenarios before 8:00 and reached the maximum value of 2.1% at 7:00. After 8:00, the humidification effect decreased rapidly due to the enhancement of solar radiation. In the afternoon, the humidification effect of the optimal design was basically the same as that of S8 and W8.
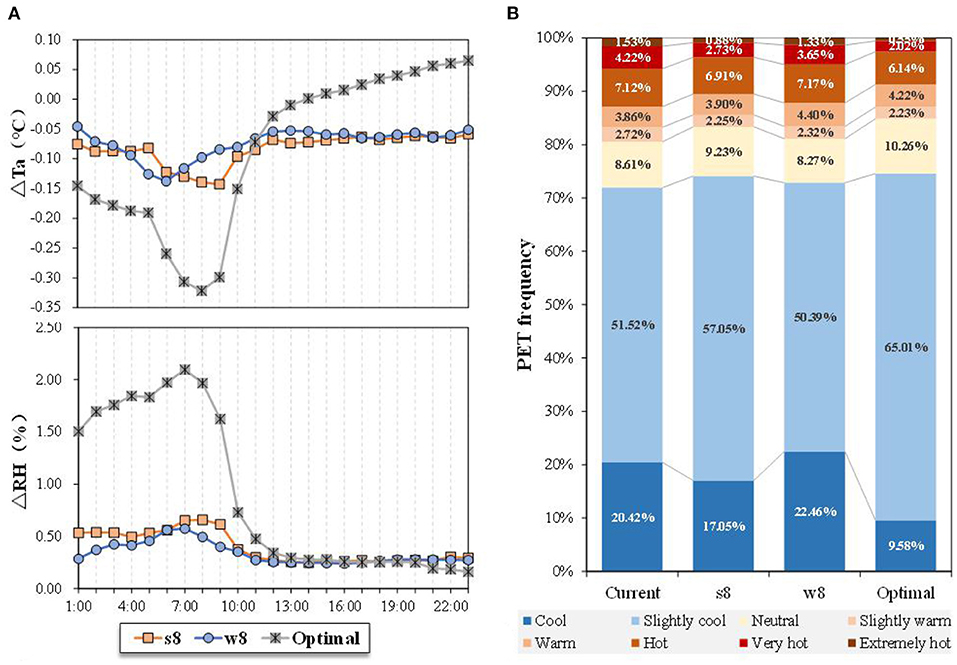
Figure 15. Comparison of average ΔTa and ΔRH with S8 and W8 in the optimization scheme (A). Comparison of optimized schemes PET, S8, and W8 (B).
Figure 15B shows the comparison of the distribution frequency of thermal sensation between the optimal design with that of S8 and W8. It can be seen that the optimal design dramatically improved the thermal comfort of the study area. Compared with S8 scenario, the proportions of “neutral” sensations increased by 1.03%, and the proportion of “hot,” “very hot,” and “extremely hot” decreased by 1.82% in total. Compared with the current situation of Chigang community, the proportion of “neutral” sensations increased by 1.65%, and the proportion of “hot,” “very hot,” and “extremely hot” decreased by 4.17% in total. Therefore, adding trees and vertical greening situation greatly improved the thermal comfort of Chigang community.
Effect of Optimal Design on Surface Temperature of Buildings
Some researchers have summarized the impact of vertical greening of the building on the thermal environment (Li, 2020), which include four aspects: (1) the shading of the plant, (2) the cooling and humidification effect of plant transpiration, (3) the wind barriers of the plant canopy, and (4) the heat insulation effect of the plant and the growth substrate. Hence, the vertical greening added in the optimal design of Chigang community also had a great cooling effect on the exterior wall of the building. Figure 16 shows the distribution of ΔTa between the optimal design and the current building exterior wall at 14:00. It can be seen that the optimal design had an obvious cooling effect on exterior walls in the community, with a maximum cooling of 1.22°C. For an individual building, the closer to the ground, the better the cooling effect. With the increase in building height, the cooling effect decreased gradually.
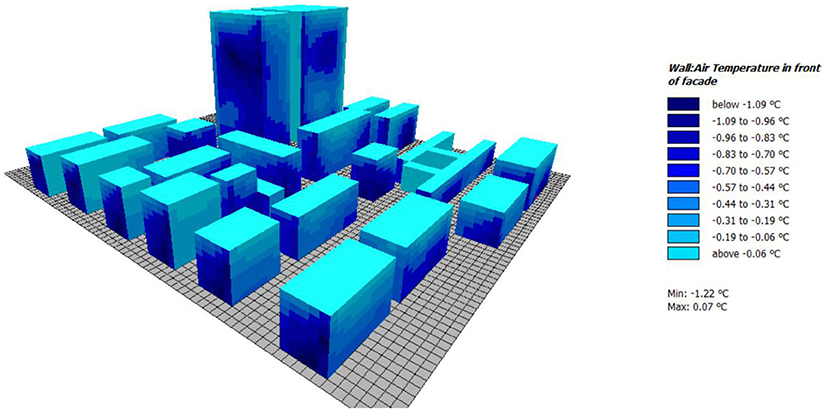
Figure 16. ΔTa distribution of building exterior wall between optimal design and current situation (at 14:00).
Discussion
Previous studies have reported that vertical greening can significantly reduce ambient temperature by comparing external wall temperature before and after vertical greening. For example, Zhao (2019) compared facades with plant materials and ordinary facades in the same research environment to evaluate the performance of the vertical greening system. The results found that the external wall heat of the vertical greening system was reduced by 40–50% compared with ordinary external walls. Xiong et al. (2017) investigated the temperature of the inner and external surfaces of the green facade in Guangzhou, and showed that the external surface temperature decreased by 6.80°C on average, while the inner surface temperature decreased by 1.72°C on average. This study addressed the effect of added vertical greening on the temperature of the whole Chigang community. In contrast to previous researches, our result was not significant, with a maximum cooling range being 0.3°C. The current study also found that adding green infrastructure improved the landscape of the community and enhanced the wellbeing of the community residents. The vertical greening reduced the temperature of the exterior wall, and consequently improved the thermal comfort of both pedestrians and residents in their buildings. However, this study found that adding vertical greening had fewer effects on the thermal condition of the whole Chigang community, with the maximum cooling range being only 0.3°C. This is probably because the simulated data did not fully represent instant temperature conditions. The possible immediate disturbances from measurements could not be realistically reflected in the model outputs. This leads to the underestimation of the reduction in the temperature. Moreover, the choice of plants species also caused the difference in the cooling capability. Another difference compared with previous studies was that the vertical greening added in this research had a smaller warming effect on the whole area after 12:00. This finding may be due to the effect of adding vertical greening on thermal insulation.
The results demonstrated that the more dispersed the vegetation, the better the thermal comfort of the whole region. This finding is consistent with the previous studies. Zhang (2017) studied the temperature differences by adding water bodies with different dispersion degrees to the urban square. They reported that there were more cooling areas in the water body when water bodies gather, while moderate dispersion was more conducive to cooling the surrounding area. Similar results were also found for green infrastructures (Zhang, 2015; Luo, 2020). Considering the thermal comfort of the whole area of Chigang community, the optimal design proposed by this study was also a dispersed layout.
Because of the limitations of time and model simulation speed, this research has some shortcomings. First, the scenario setting of the simulation was not comprehensive enough. For example, this study only investigated the impact of adding water bodies by 5%, without discussing the effects of other proportion scenarios. In fact, adding all covered vertical greening is an ideal situation. If the model is constructed according to the actual situation, it will involve factors, such as window area and wall orientation, thus, becoming much more complicated. To simplify the study, the ideal situation is assumed. Second, only 1 day of typical hot weather was selected for measurement and simulation in this study, and simulation in different seasons should be supplemented in future studies. Finally, the optimal design proposed in this study was from the perspective of improving the microclimate and enhancing the thermal comfort level. Further studies should be performed with consideration of the landscape design in BGI's planning.
Conclusions
The various BGIs play extremely important roles in the development of cities and human society. Evaluating their effects on the urban microclimate is conducive to proposing practical and effective solutions to improve the urban thermal environment and achieve sustainable development. Applying the different BGI scenarios and the effects of BGIs with different layouts and locations on microclimate and thermal comfort under hot weather were analyzed and compared in this research. Finally, an optimal design was proposed for the study area. The main findings are listed as follows:
1) Adding water improved the thermal comfort of Chigang community. When the area was constant, the more clustered the water body, the stronger the cooling and humidification effect on the surrounding area. However, the influence of the centralized water body on microclimate was not stable. In terms of thermal comfort, adding the water body improved the thermal comfort of the community.
2) Removing the existing trees deteriorated the thermal environment of Chigang community. In contrast, the thermal comfort of the community was improved by adding green infrastructures. The more scattered the added trees, the better the thermal comfort. Adding vertical greening had a cooling and humidification effect on the microclimate before 12:00. The effect was stronger with the increase in the amount of vertical greening. Although the vertical greening slightly raised the temperature after 12:00, it generally improved the thermal comfort of Chigang community.
3) Finally, the distributed trees, together with the vertical greening, were selected to form the final optimal design. The results showed that the optimal design dramatically improved the cooling and humidification effect, and also greatly improved the thermal comfort condition. The proportion of “neutral” sensations increased by 1.65%.
In general, this study shows that a proper BGI design can effectively mitigate urban warming and regulate the thermal environment, and further improve thermal comfort. In a limited space, the combination of different types of BGIs can improve the cooling capacity. In terms of microclimate regulation, increasing dispersed vegetation is superior to water, but water has also been proven to play a positive role in microclimate conditions (Li and Wang, 2021). Therefore, this study recommends to organically integrate the two infrastructures (green and blue) according to the actual situation. In addition, vertical vegetation is less restricted by space and has been proved to have energy saving and emission reduction effects (Xing et al., 2018). Hence, vertical vegetation is also suggested to be included in urban planning. In addition, the optimal design proposed in this study was mainly from the perspective of improving the microclimate and enhancing the thermal comfort level. Future studies should consider landscape design in BGI planning. Overall, this study provided insights into the effects of different layouts and locations of BGIs on residential microclimates. This relevant information provides theoretical support and the scientific basis for urban designers and planners to formulate optimal greening schemes.
Data Availability Statement
The raw data supporting the conclusions of this article will be made available by the authors, without undue reservation.
Author Contributions
SC: conceptualization, methodology, and writing-original draft. ZN: writing—reviewing and editing. YW: supervision and writing—reviewing and editing. BX: project administration. All authors contributed to the article and approved the submitted version.
Funding
This research was financially supported by the Natural Science Foundation of Guangdong Province, China (2019A1515011580) and the Fundamental Research Funds for the Central Universities (19lgpy163).
Conflict of Interest
The authors declare that the research was conducted in the absence of any commercial or financial relationships that could be construed as a potential conflict of interest.
Publisher's Note
All claims expressed in this article are solely those of the authors and do not necessarily represent those of their affiliated organizations, or those of the publisher, the editors and the reviewers. Any product that may be evaluated in this article, or claim that may be made by its manufacturer, is not guaranteed or endorsed by the publisher.
References
Evyatar, E (2008). The application of urban climate research in the design of cities. Adv. Build. Energy Res. 2, 95–121. doi: 10.3763/aber.2008.0204
Guidotti, T. L (2010). Health and urban ecosystems. Archiv. Environ. Occupat. Health 65, 54–55. doi: 10.1080/19338240903400435
Lai, D (2012). Study on outdoor thermal comfort in Northern China (Master thesis). Tianjin University, Tianjin, China.
Li, C. Y., and Wang, K. (2021). Basin urban park space construction based on microclimate regulation strategies. J. Green Sci. Technol. 23, 42–44. doi: 10.16663/j.cnki.lskj.2021.11.013
Li, M (1999). Urban Green Space System and Human Settlement Environment Planning. China Construction Industry Press.
Li, Q. L (2020). Research on the vertical greening design of buildings in Guangzhou based on thermal environmental benefits (Master thesis). Guangzhou University, Guangzhou, China.
Li, Z. L., Wang, N., Jia, J., Wang, N. A., Zha, J., Liu, T., et al. (2007). Lanzhou's urban climate seasonal changes and urban development in the past 40 years. Plateau Meteorol. 26, 586–592. doi: 10.3321/j.issn:1000-0534.2007.03.021
Liu, Y. H., Guo, J. P., and Wei, Q. S. (2012). Analysis of thermal environmental effects of urban green space pattern based on CFD. Acta Ecol. Sin. 32, 1951–1959. doi: 10.5846/stxb201102170183
Luke, H (2012). The Climate of London, Deduced from Meteorological Observations. Cambridge University Press.
Luo, R. Y (2020). Research on the optimization of urban green infrastructure layout based on the principle of urban air duct construction (Master thesis). Chengdu University of Technology, Chengdu, China.
Matzarakis, A., Rutz, F., and Mayer, H. (2010). Modelling radiation fluxes in simple and complex environments: basics of the RayMan model. Int. J. Biometeorol. 54, 131–139. doi: 10.1007/s00484-009-0261-0
Morakinyo, T., Dahanayake, K., Ng, E., and Chow, C. (2017). Temperature and cooling demand reduction by green-roof types in different climates and urban densities: a co-simulation parametric study. Energy Build. 145, 226–237. doi: 10.1016/j.enbuild.2017.03.066
Wang, Y., Bakker, F., de Groot, R., and Wörtche, H. J. (2014). Effect of ecosystem services provided by urban green infrastructure on indoor environment: a literature review. Build. Environ. 77, 88–100. doi: 10.1016/j.buildenv.2014.03.021
Xing, Q. W., Hao, X. L., Yang, K., Huang, M. H., Zhang, K. T., et al. (2018). Energy saving mechanism of vertical greening and its potential of energy saving and emission reduction in Changsha area. Build. Energy Conservat. 46, 111–114. doi: 10.3969/j.issn.1673-7237.2018.09.024
Xiong, X., Li, L., and Zhou, X. Q. (2017). Analysis of the effect of vertical greening on improving the indoor and outdoor thermal environment of buildings. Build. Energy Conservat. 45, 68–72. doi: 10.3969/j.issn.1673-7237.2017.09.013
Xue, S. H (2016). Study on spatial elements layout pattern of Lingnan Garden based on climate adaptability (Master thesis). South China University of Technology, Guangzhou, China.
Zhang, C (2017). Research on the microclimate effect of urban leisure square water layout (Master thesis). Nanjing University, Nanjing, China. doi: 10.15354/sim.17.re029
Zhang, M. J., Wei, X., Su, X. L., and Li, C. (2019). Microclimate regulation of plant communities with different structures in Nanjing during winter and summer. J. Ecol. 38, 27–34. doi: 10.13292/j.1000-4890.201901.020
Zhang, W (2015). Simulation study on the impact of green space layout in residential quarters on microclimate (Master thesis). Nanjing University, Nanjing, China.
Zhao, X (2019). Analysis of the effect of vertical greening system on urban microclimate improvement. Val. Eng. 38, 205–206.
Keywords: urban microclimate, blue-green infrastructure, ENVI-met, thermal comfort, vertical greening
Citation: Cao S, Wang Y, Ni Z and Xia B (2022) Effects of Blue-Green Infrastructures on the Microclimate in an Urban Residential Area Under Hot Weather. Front. Sustain. Cities 4:824779. doi: 10.3389/frsc.2022.824779
Received: 29 November 2021; Accepted: 15 February 2022;
Published: 29 March 2022.
Edited by:
Jin Yang, China University of Geosciences, ChinaReviewed by:
Saige Wang, Beijing Normal University, ChinaLing Shao, China University of Geosciences, China
Copyright © 2022 Cao, Wang, Ni and Xia. This is an open-access article distributed under the terms of the Creative Commons Attribution License (CC BY). The use, distribution or reproduction in other forums is permitted, provided the original author(s) and the copyright owner(s) are credited and that the original publication in this journal is cited, in accordance with accepted academic practice. No use, distribution or reproduction is permitted which does not comply with these terms.
*Correspondence: Yafei Wang, d2FuZ3lmOTdAbWFpbC5zeXN1LmVkdS5jbg==; Zhuobiao Ni, bml6aHVvYmlhb0Bob3RtYWlsLmNvbQ==