 Lourdes Montalvo
 David Fosca
 Edwin Villanueva
- Department of Engineering, Pontificia Universidad Católica del Perú, Lima, Peru
Monitoring air quality is very important in urban areas to alert the citizens about the risks posed by the air they breathe. However, implementing conventional monitoring networks may be unfeasible in developing countries due to its high costs. In addition, it is important for the citizen to have current and future air information in the place where he is, to avoid overexposure. In the present work, we describe a low-cost solution deployed in Lima city that is composed of low-cost IoT stations, Artificial Intelligence models, and a web application that can deliver predicted air quality information in a graphical way (pollution maps). In a series of experiments, we assessed the quality of the temporal and spatial prediction. The error levels were satisfactory when compared to reference methods. Our proposal is a cost-effective solution that can help identify high-risk areas of exposure to airborne pollutants and can be replicated in places where there are no resources to implement reference networks.
1. Introduction
Air pollution is a major challenge in urban environments. There is ample evidence supporting the association between prolonged exposure to air pollutants and negative effects on human health (Kumar et al., 2019). In the short term, it can cause irritation in the respiratory tract, eyes, headaches, nausea, etc. In the long term it may produce allergies, cardiovascular and neuropsychiatric diseases, or even cancer (Shahriyari et al., 2021). Several authors have warned that air pollution is the largest environmental risk factor for ill health. This has been named as “the new tobacco” (Manisalidis et al., 2020).
As part of air pollution control policies, several countries, mainly in the developed world, have deployed large air quality monitoring systems in urban centers in order to collect real-time data to inform authorities and citizens about their current air quality situation (see waqi.info). However, such a reality is not commonly found in low-to-middle income countries, where there are precarious or even non-existent environmental monitoring systems. One of the main reasons for this is the high costs of having a certified air quality monitoring system as a reference. This is the case of Peru, where its capital city, Lima, with an urban area of around 3,000 square kilometers and more than 10 million inhabitants, has an official air monitoring network of 10 stations, half of which are nowadays inoperative. This is even more critical in other major cities in Peru, where there is absolute absence of any kind of air monitoring. This reality is contrasted with several studies that place Peru as one of the most polluted countries in Latin America by particulate matter (Reátegui-Romero et al., 2018).
Due to the high costs of reference monitoring stations, over the last years low-cost sensing technologies have increased their variety and appear as a cost-effective alternative for air quality assessment (Morawska et al., 2018; Liu X. et al., 2020). In fact, various monitoring networks, based on low-cost sensors, have been deployed around the world to aid or supplement air monitoring. Some representative examples are the IVAN project in Imperial County—California (ivan-imperial.org), the Lufdaten project (luftdaten.info) and the Opensense project (opensense.epfl.ch). All these initiatives have shown the advantages of low-cost technologies in providing air quality data with high spatial resolution that would be very expensive if implemented with high-end stations.
A sensor network is a powerful tool for scientific research and environmental agencies. However, it is not enough for the citizens, who need tools to be informed about the current and future air quality in the places where they carry out their activities. Traditionally, numerical-based models have been proposed to infer the spatial distribution of air pollutants by simulating the physicochemical and dispersion processes of air pollution (Gea et al., 2017). However, despite being based on physical principles, the implementation of numerical models often requires accurate emissions inventories and high-end computing platforms, which discourages their adoption when the cost is a limitation. Recently, models based on Artificial Intelligence have emerged as a data-driven alternative to predict air quality with satisfactory results and without requiring expensive computational hardware (Iskandaryan et al., 2020; Amuthadevi et al., 2021).
The present work describes the implementation of an air quality monitoring system in Lima city based on a network of low-cost stations and Artificial Intelligence (AI) techniques. The low-cost stations, called qHAWAX, are IoT devices that can measure the concentration levels of five gas pollutants, fine particulate matter and meteorological parameters. They were located in strategic locations in the central region of Lima city and have been operating since March 2020. With the data collected it has been possible to adjust Artificial Intelligence (AI) models that are able to produce real-time pollution maps and to forecast air quality values for the next 6 h.
The major contributions of this work are: (i) a new design of a complete low-cost IoT system for air quality monitoring, detailing the components in the sensing layer, the data processing and the construction of artificial intelligence models for spatial and temporal prediction; (ii) a deployment description of the first low-cost IoT air quality network installed in Lima city, together with a dataset collected during a year of operation; and (iii) a web platform to show measurements and predictions to end users (available at: https://main.d2bs3bzajz7n0u.amplifyapp.com).
The rest of the work is organized as follows. Section 2 presents a brief review of related works. Section 3 describe the components and methods of the proposed air quality monitoring system. Section 4 present evaluation results of the components. Finally, the conclusions are presented in Section 5.
2. Related Work
Modern air quality monitoring systems are being designed as Internet of Things (IoT) systems. IoT can be defined as the interconnection of everyday devices in order to share and analyze data for monitoring and decision making processes (Somayya et al., 2015). IoT coupled with automated data analytic techniques has fueled the rise of “smart cities” concept. In a smart city, IoT devices collect data in real time from different city-related variables and locations with the intention of turning such data into useful knowledge so that citizens and authorities know the current state of their environment and can take actions to improve the quality of life (Mohd Abdul et al., 2020). Air quality monitoring is a representative application in Smart Cities due to the serious issues that many cities suffer associated to poor air quality and the need to monitor and control this problem (Bashir Shaban et al., 2016).
The literature on air quality monitoring systems focuses primarily on two aspects: (i) the sensing/network layer; and (ii) the application layer. With respect to the sensing layer, we can find a variety of technologies (see reviews in Zhang and Srinivasan, 2020; Kang et al., 2022). There is an increasing number of companies offering hardware for air quality measurement. Among them, we can mention: AQMesh (www.aqmesh.com), Kunak AIR Pro (www.kunak.es), Aeroqual (www.aeroqual.com), Alphasense (www.alphasense.com), among others. The common parameters targeted are: toxic gases (NO2, O3, CO, SO2, H2S), particulate matter and meteorological variables. Also, some researchers have described implementations of low-cost monitoring hardware. For instance, Barot et al. (2020) implemented and deployed a low-power consumption IOT device using an ESP8266 Wi-Fi chip for transmission of PM10, PM2.5, and CO, temperature and humidity sensor data. Glass et al. (2020) implemented a low-cost sensor to work as part of a wireless sensor network running a LoRaWAN protocol in a Murata chip (microcontroller + radio) as well as working individually through an ESP8266 Wi-Fi chip. Moreover, the project “Moreair” (Gryech et al., 2020) is another example of a low-cost device built on top of a Raspberry Pi.
Regarding the application layer, most academic works are focused on the construction of models for near-term air quality forecasting or for correcting uncalibrated measurements. Machine learning algorithms are widely employed for these tasks (Cabaneros et al., 2019; Ullo and Sinha, 2020; Su et al., 2021). For instance, Liu et al. (2016) proposed Spatio-Temporal Extreme Learning Machine (STELM) to forecast PM2.5 concentration considering temporal and spatial features; Bashir Shaban et al. (2016) applied Support Vector Machines (SVMs), shallow neural networks and M5P models to forecast NO2, SO2, and O3 using 3 months of historical data for training; Chiwewe and Ditsela (2016) applied also shallow neural networks to predict ground ozone levels using data from Johannesburg air quality network; Maleki et al. (2019) also applied classical feedforward neural networks to predict air pollutant concentrations, air quality index (AQI), and health quality index (AQHI). More recently, some sophisticated deep neural network architectures have been devised for air quality prediction. For instance, Liu D.-R. et al. (2020) proposed an attention Long Short-term Memory (LSTM) wind-sensitive model with extreme Gradient Boosting (XGBoost) to predict PM2.5 concentrations for the next 6–24 h. Fan et al. (2017) described a procedure to better handle missing values during pre-processing, arguing that real-world time series are more probable to present discontinuous intervals of data, which in turn may affect the adequate training of the model. Lastly, Wen et al. (2019) presented a novel procedure for spatio-temporal prediction of air pollutants. This approach considers the possibility of working with data from stations deployed in different geographical points. For this purpose the authors proposed a Convolutional Neural Network (CNN) combined with a LSTM Neural Network to predict PM2.5 concentrations over all the monitoring stations for the next 24 h.
Despite this growing amount of literature on sensing hardware and predictive models, there are few publications describing complete designs and implementations of low-cost air quality monitoring systems. Among them we can mention the work of Wong et al. (2018), who implemented a Integrated Environmental Monitoring System (IIEMS) formed by a set of portable devices that can measure nine parameters (temperature, humidity, PM2.5, PM10, CO, SO2, VOC, UV, and noise) and send the acquired data to a web database through a wireless service. However, this work lacks user app and forecast services. Another system, described by Bashir Shaban et al. (2016), is composed by a network of low-cost devices that can sense toxic gases (O3, SO2, and NO2) and meteorological parameters. Part of this system is a Web portal and a mobile application, which also integrates forecasting models to predict gases concentration up to 24 h ahead. However, the system lacks spatial prediction models to provide pollution maps.
3. Materials and Methods
In this section we describe the overall air quality monitoring system, including the methods and procedures employed for its development. Figure 1 shows a general scheme of the system, which is composed of three main components described bellow: (i) low-cost air quality sensor network; (ii) spatio-temporal forecasting models, and (iii) a web application.
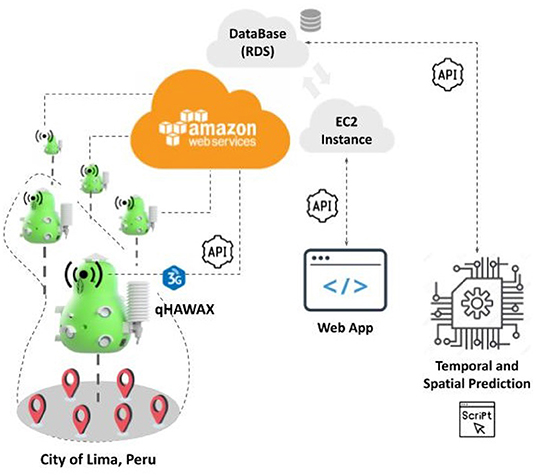
Figure 1. General architecture of the proposed air quality monitoring and forecasting system. It is composed by a network of air quality stations (qHAWAXs), predictive models and a web application to deliver information to users.
3.1. Low-Cost Air Quality Sensing Devices (qHAWAXs)
The sensing layer of the proposed system is composed by several low-cost IOT sensing devices named qHAWAX (“Air guardian” in Quechua), which can be seen in Figure 2. Each device can sense concentrations of the following air pollutants: CO (ug/m3), SO2 (ug/m3), H2S (ug/m3), O3 (ug/m3), NO2 (ug/m3), PM2.5 (ug/m3), and PM10 (ug/m3). Additionally, the devices are equipped with sensors to measure ambient variables like: temperature (°C), relative humidity (%), ultraviolet radiation (UV), ambient noise (dB), and atmospheric pressure (hPa). For gas sensing, electrochemical sensors from Alphasense (Zuidema et al., 2021) were used. The sensor outputs an analog signal, which is digitized with the help of an 18-bit ADC. On the other hand, optical sensors from the same provider (Bezantakos et al., 2021) were used for particulate mater. The remaining sensors (particulate matter and ambient sensors) deliver digital signals that are gathered every second by the core microprocessor MCUSTM32F446RE (ARM Cortex M4) and averaged every 20 s. The mean values are backed up in a microSD card (8GB) and send through the 3G mobile network to a cloud database using the Adafruit FONA GSM cellular module (SIM5320E). Finally, the HTTPS protocol is used for data transmission, which ensures a secure communication through a TLS/SSL encryption layer.
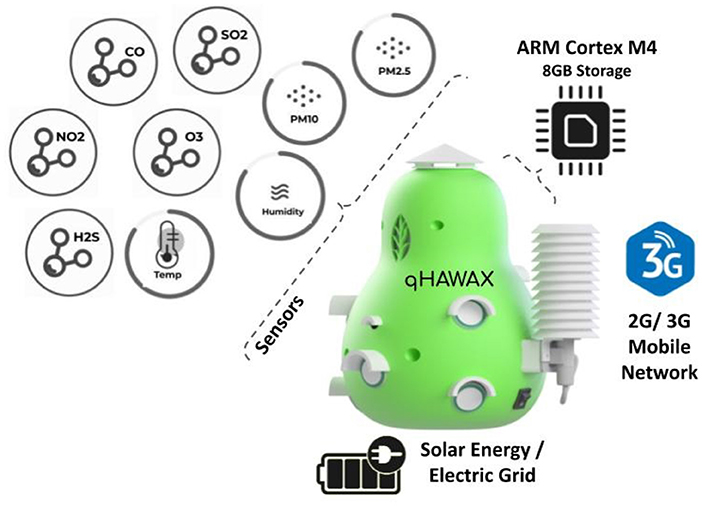
Figure 2. qHAWAX: a low-cost IoT device used in the proposed system to sense air quality. It is equipped with sensors to measure toxic gas concentrations (CO, SO2, H2S, O3, and NO2), particulate matter (PM2.5, PM10) and ambient variables (temperature, relative humidity and atmospheric pressure).
Each module communicates directly and individually with the server. Among the communication functionalities, the following stand out: (i) sensory data transmission, (ii) remote monitoring and diagnosis, (iii) parameters calibration, and (iv) over-the-air software updates. The device has a power source module composed by a 12 V solid acid battery (26 Ah). It is prepared to charge/run plugged into the electric-grid or to a solar panel. All sensors are calibrated using EPA-certified equipment before being deployed in the city.
3.2. Predictive Modeling
Two types of models have been developed for the system: one to predict the hourly spatial distribution of important air pollutants, and the other to predict air quality in the near future (short-term forecasting).
3.2.1. Data Acquisition
Thirteen monitoring stations were deployed in public spaces in the central region of Lima city during the period from March to May 2020. Figure 11 shows the geographic locations of the installed stations (represented as rhombuses). The minimum (maximum) distance between stations was 440 m (9.8 km). As the stations are compact and lightweight devices they were installed on street lamppost and on roofs at a height from the surface between 2 and 4 m (the Peruvian norms regulates that for outdoor monitoring the sensors must be at a height between 1.5 and 15 m). Among the criteria considered to choose the locations were: sites with different pollution conditions, easy access to the site for maintenance, availability of power source, and site security to prevent damage or theft of equipment.
For model construction we considered data collected during 2020. The measurements were aggregated at hourly frequency, resulting in 60,102 records from all stations. For the present system we only target to predict concentrations of three pollutants that are of concern in Lima city: CO, NO2, and PM2.5. Together with these variables we considered the Temperature and Relative Air Humidity as input variables, which are known to be related with the target pollutant concentrations. The data is available at the link in section Data Availability Statement.
3.2.2. Spatial Prediction Modeling
Our proposed system uses spatial prediction techniques to provide estimates of pollutant concentration levels across the entire monitored region (pollution maps). To this end we experimented with two techniques commonly implemented in GIS software: Inverse Distance Weighting (IDW) and Ordinary Kriging (OK). We tried these techniques due to its appealing trade-off between simplicity and effectiveness that we seek for our system (Shukla et al., 2020). There is no agreement in the literature on which of these techniques is more effective for air quality modeling, some point to IDW (Sajjadi et al., 2017; Choi and Chong, 2022), some others point to Kriging (Kumar et al., 2016; Shukla et al., 2020). Such differences could be due to variations in local environments and sensor networks. Due to this, we performed our own evaluation to choose the most suitable technique for our system (results presented in Section 4.1). First, we describe the preprocessing step we followed to arrange the acquired data for spatial modeling and then describe the IDW and Ok technique.
3.2.2.1. Data Preprocessing
The data stream of each station and pollutant is aggregated to an hourly temporal granularity (average aggregation). Each resulting time series is then submitted to a verification process to identify possible wrong data points. For each pollutant we defined a maximum hourly threshold value as twice the hazard threshold level defined by the Peruvian air quality standard (INCA). Values exceeding this threshold are marked as null values to avoid distorting the spatial modeling. After this, the data of the different stations are arranged into a matrix for each pollutant, with columns representing stations and rows representing aggregated hours. In the evaluation phase we use leave-one-out crossvalidation (LOOC): each station (column) is iteratively simulated to be an unknown point and the remaining stations are used as known points for the estimation of the unknown point values, so an error metric can be calculated between the predicted and the actual values.
3.2.2.2. Inverse Distance Weighting (IDW)
IDW is a deterministic method that estimates the value of an unknown point, x0, using the values of known points {x1, …, xk}. Considering the values of the known points at a given hour are in the vector Z = (Z(x1), …, Z(xk)), the estimated value at point x0 by IDW is calculated as Equation 1:
where is a weight vector, with element λi representing the weight of point xi values, computed as: . Here dj is the distance from known point xj to point x0. Parameter p controls how fast the contribution of known points decreases with the distance to the interpolated point (typically p = 2) (Schloeder et al., 2001).
3.2.2.3. Ordinary Kriging (OK)
OK is a statistical method that follows IDW's idea of interpolating the unknown point x0 by weighting known points values, as in Equation 1. However, the way Kriging chooses the weights λT is different. Kriging considers not only the distances from the known points, but also the structure of correlations between neighboring points. For this end, it is defined a variogram function γ(h), that assesses the degree of similarity between any two points around x0 separated by a distance h. This can be empirically computed for any pair of neighboring points, xi, xj separated by distance ||xi−xj|| as in Equation 2:
where Mij is a set of pairs of observed values of the two points, [Zt(xi), Zt(xj)], t∈{1, ..., |Mij|}.
Having been defined the variogram function γ(), the weights λT can be obtained by solving the system of equations given in Equation 3:
where m is the lagrange multiplier. Solving this system ensures the minimization of the error variance. Note that the weights are constrained to sum 1 and depend on the prediction location and the positions of the known points.
3.2.3. Forecasting Models
Another functionality of the proposed system is its ability to provide short-term forecasts (6 h in advance) of concentration levels of target pollutants (CO, NO2, and PM2.5) at station locations. We describe here the steps taken to build the forecasting models: data processing, training, testing and deployment of the models.
3.2.3.1. Data Preprocessing
Figure 3 shows density plots of the data collected at each monitoring station for each pollutant. It can be seen variations in the distributions across the different stations. This is attributable to the differences in the station's local environment, such as vehicular traffic density and land use type. Similar to the spatial modeling case, we mark as null data all values that are above the defined maximum threshold of the corresponding pollutant. Subsequently, we impute null time points that are surrounded by valid time points using linear interpolation.
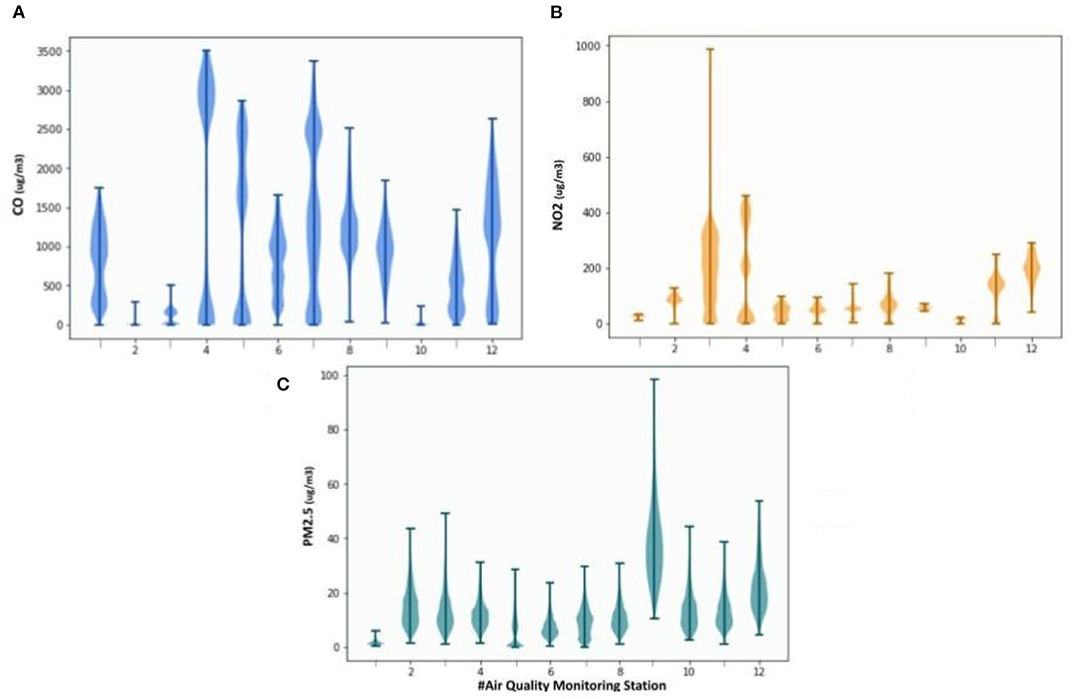
Figure 3. Density Plots of the (hourly) air quality data acquired at each monitoring station during 2020. (A) Represents the distributions of CO pollutant (ug/m3), (B) Represents the distributions of NO2 pollutant (ug/m3), and (C) Represents the distributions of PM2.5 pollutant (ug/m3). X axis represents the station.
Aside outliers and missing values, we also sporadically observed short sub-sequences of repeated values at some stations and pollutants. After verification, it was found that this was related to power supply interruptions or fluctuations causing repeated entries in the station's memory and in the data forwarding to the cloud. It was established that a sub-sequence of repeated values for more than 12 h can be safely considered as an incorrect sub-sequence and null values are attributed instead for the following processing steps. Figure 4A illustrates this preprocessing task.
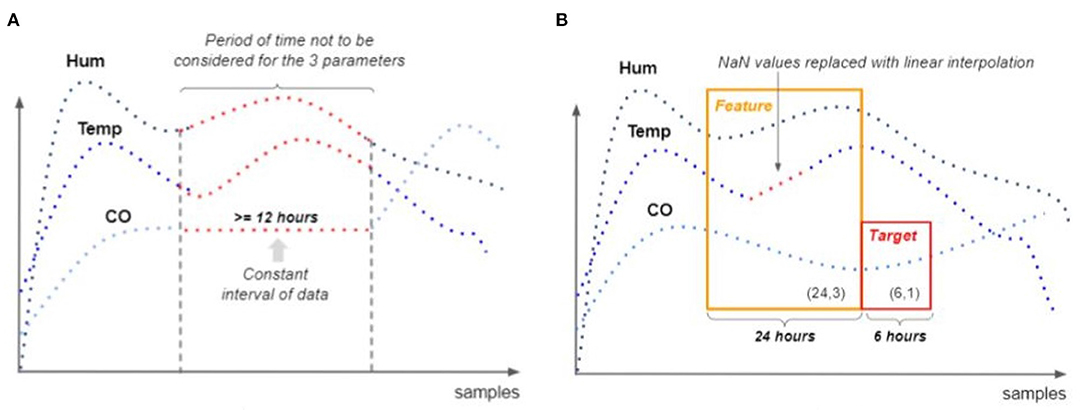
Figure 4. Illustration of the preprocessing step to deal with constant incorrect subsequences (A) and the procedure to generate training instances for forecasting model induction (B). (A) Illustrates the case when one variable (e.g., CO) presents a subsequence of repeated values for more than 12 consecutive hours. In this case, the subsequence is considered erroneous and is replaced by null values to discard its use as training data. (B) Shows how the one-step moving window is used to generate the input-target pairs (training instances). The input sequence is of 24 h length, the target sequence is of 6 h length. Null values are linearly interpolated provided that they are surrounded by valid values.
After the above processing, we proceeded to induce the forecasting models. We tried two approaches for this: a multi-model approach (one model to predict one pollutant) and a single-model approach (one model to predict the 3 target pollutants at once). In our experiments, we found the multi-model approach giving better predictive performances (data not shown). This may be due to the fact that each pollutant has its own dynamics and specialized per-pollutant models find it easier to learn such dynamics than a multi-pollutant model that gets hard trying to learn the interlinks among pollutants. We describe next the data preparation for the multi-model approach, as this was adopted in the proposed system.
We explain here the data preparation for the case of CO forecasting modeling. The same applies to the other pollutants. A training instance is a tuple composed by a multivariate input sequence [CO, Temperature (Temp) and Relative Air Humidity (Hum)] and a output sequence (target) of the predicted pollutant (CO). For the input sequences it was determined that 24 h is suitable for the desired task. Longer input lengths increase the model complexity but do not improve predictability. For the output sequence, it was decided to predict 6-h in advance (6 time-points). This horizon presented tolerable error levels in our experimental results and is of practical use for planning activities. The inclusion of Temperature and Air Humidity as inputs showed better overall results than using only the target variable. This can be explained by the known influence that meteorological parameters have on air pollution. The whole training set is obtained by sliding the input-target window over the entire training sequences of each station (see Figure 4B). Each movement of the window one step forward produces a training instance, provided that the input and target sequences have non-null values. If there is a null value in the current window, the instance is not generated and the window is moved one step forward. This process is performed on every station data stream, stacking the resulting instances in a single training data-set with input shape (n_instances, 24, 3) and target shape (n_instances, 6, 1). Each variable of the generated training dataset is then scaled using Min-Max scaling. This is done to have the same scale in all variables and thus facilitate model training. The max and min values used for the scaling transformation are found from the training set and then used to scale both training as well as testing sets. Finally, the scaled instances are converted to time-difference instances, as depicted in Figure 5. This is done in order to have stationary sequences so that the models can focus on learning the most relevant part, which is, predicting future variations in air quality based on past variations. After differentiation, each input instance has a shape of (23, 3) and the corresponding output target has a shape of (6, 1). Predicted difference vectors are converted to value vectors for model evaluation and operation.
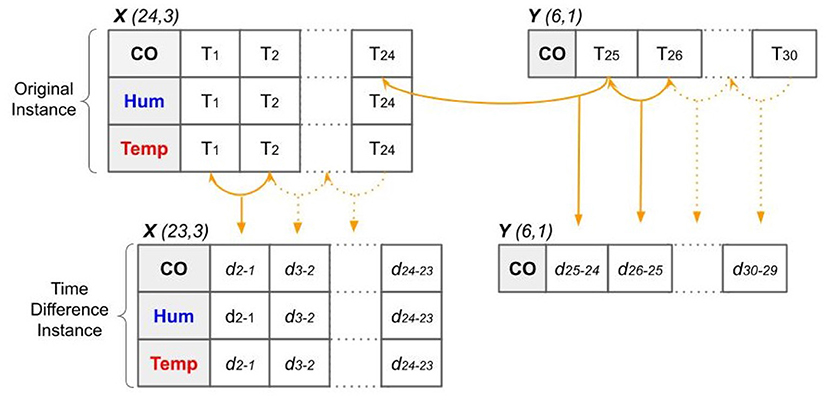
Figure 5. Illustration of the generation of time-difference instances from the original instances. The time-differencing process is done to each input-target instance resulting from the moving-window procedure. All three variables are differenced. The resulting differenced instances are used for training the deep learning models.
3.2.3.2. Forecasting Model Selection
Three types of models were evaluated for the forecasting task: Recurrent Neural Networks with Long Short-Term Memory units (LSTM), Recurrent Neural Networks with Gated Recurrent Units (GRU), and 1D Convolutional Neural Networks (CNN). These neural network architectures have shown recently interesting results on air quality forecasting applications (Krishan et al., 2019; Tao et al., 2019; Ragab et al., 2020; Yan et al., 2021; Kristiani et al., 2022). Although most of these works show predictive advantages over classical methods, it is not clear which of them is more suitable for our system, since the data used in the publications have been collected under different conditions of our system (differences on: input variables, target pollutants, meteorological and pollution conditions, sample size, temporal granularity, forecast time, etc.). For this reason, a comparative evaluation was carried out (results on Section 4.2).
Figure 6 shows the process used for model evaluation to identify a suitable forecasting model for each pollutant. In this process a hyperpararmeter grid search is performed for each model architecture. The optimized hyperparameter and tried values: number of convolutional/recurrent layers = {1,2}; number of units (state dimension) in recurrent layers = {100,200,300,400}; number of 1D kernels in convolutional layers = {16,32,64}. Fixed hyperparameter: units in output layer = 6 (each output neuron predict one future time-step); units in pre-output layer = 50; dropout ratio previous to dense layers = 0.2; kernel size in first and second convolutional layer = (4,3); pool size in max pooling layer = 2; activation function in hidden (output) layers = Relu (Linear); learning rate = 0.001; optimizer = Nadam; loss function = mse (mean squared error); batch size = 64; kernel initializer = Glorot uniform.
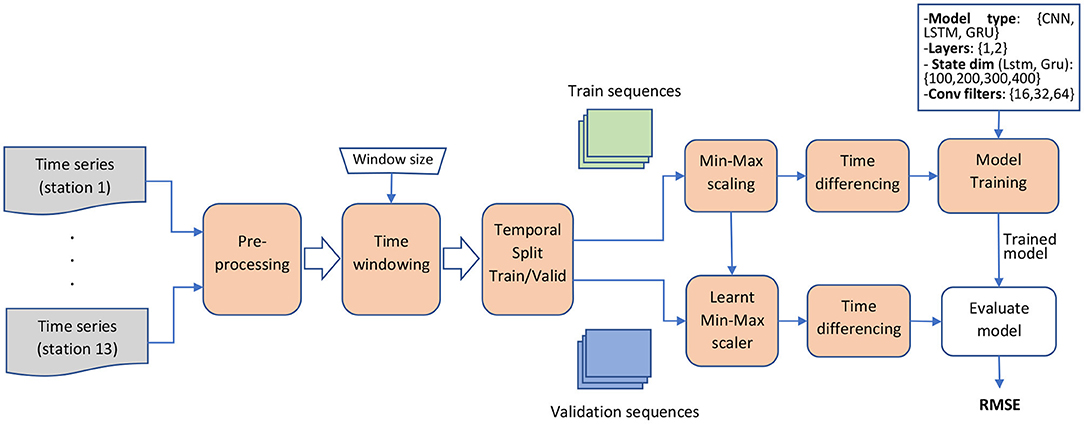
Figure 6. Illustration of the process used to evaluate forecasting models. For a given model architecture this process evaluates the predictive performance in validation data of all combinations of hyperparameters indicated in the textbox above “Model Training” box. At the end, the process delivers the RMSE value of each evaluated combination.
Each hyperparameter configuration was evaluated using a train-validation strategy: the model is fitted using the first 80% of the training instances and then evaluated in the remaining 20% set (validation set). The same train-validation sets were used for all configuration evaluations. All models were trained for 100 epochs. The evaluation were based on two error criteria metrics: MAE (Mean Absolute Error) and RMSE (Root Mean Squared Error), calculated in validation data for each pollutant and forecasted time-step. Figure 7 shows the optimized configuration for each model type after hyperparameter optimization. Section 4 presents and discuss performance results of these best models on new test data.
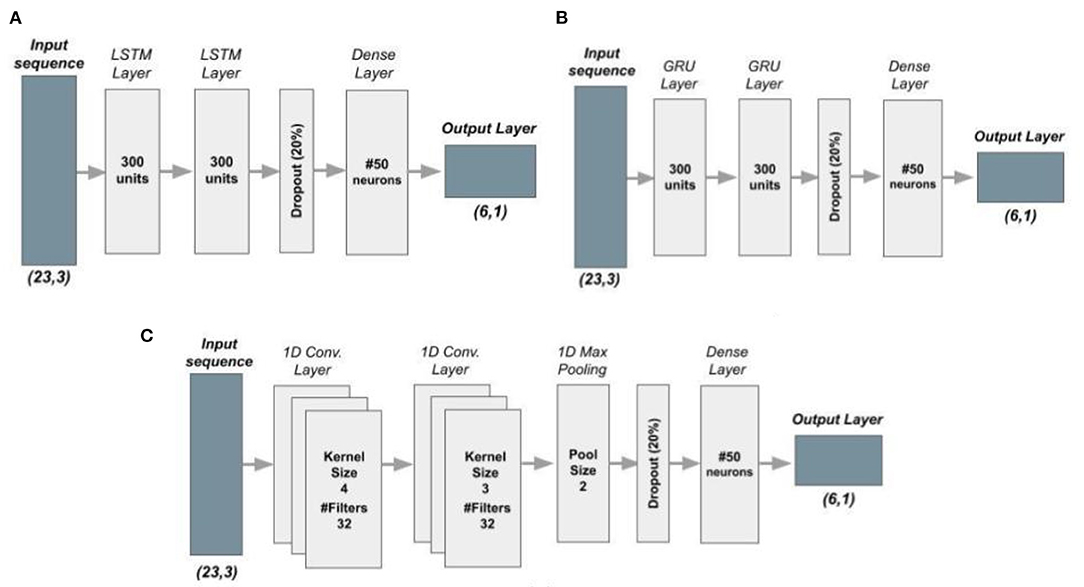
Figure 7. Neural network architectures optimized for air quality forecasting. (A) Corresponds to a LSTM model, (B) corresponds to a GRU model, and (C) Corresponds to a CNN model.
3.3. Web Application
A web application was developed to offer the users two functionalities: a view of pollution level in a city map and detail information about air quality forecasting. The application also has a configuration functionality to set up the monitored area and to add/remove monitoring stations. Bellow we describe the app components and integration in detail.
3.3.1. App Components and Integration
Figure 8 shows the application components and their integration. For the front-end web side we use AWS Amplify service, which stores all front-end code in a cloud server. Every button in the web application is connected to a RESTful API built in Python using Flask framework. This API runs in a EC2 cloud server and is responsible to serve any request from the client application. It is also capable of connecting to a PostgreSQL database (using RDS service) to recover/store air quality measurements and predictions. Two python scripts were developed and programmed to run every hour the spatial prediction and forecasting models respectively, storing the prediction results into the database for later visualization in the web application. These scripts are executed independently of user requests and do not depend on their number, thus guaranteeing the scalability of the app. Details of these scripts are given bellow.
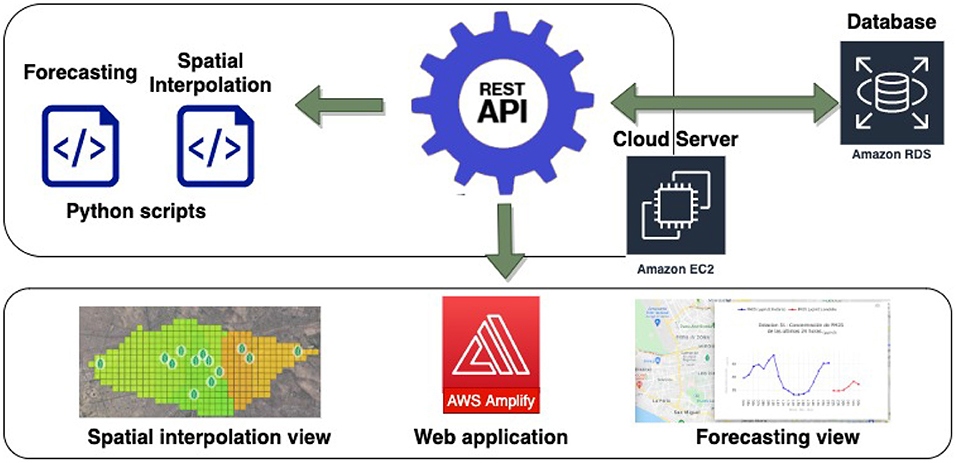
Figure 8. Software components of the web application developed for delivering air quality information.
3.3.1.1. Spatial Prediction Script
After every o'clock hour this script wakes up and retrieves the last hour average measurements of each station (using the API service). It also retrieves the grid cell centers stored in the database. Then, it calls the selected spatial prediction model (IDW for CO pollutant and Kriging with gaussian variogram for NO2 and PM2.5) to estimate each pollutant concentration map. To achieve this, in each cell center location, (x,y), the script finds the k-nearest stations with valid values (according to our experimentation, the most suitable value for k was equal to 5 stations for all pollutants, see section [ref]). Then, the interpolation is obtained at (x,y) using such stations. After all the cells get interpolated, the resulting values are stored in the database with the timestamp of the last hour. In this way, the app can retrieve and visualize the last and historical pollutant maps to give an understanding of the pollutant's spatial dynamics.
3.3.1.2. Forecasting Script
The forecasting script awakes also after every o'clock hour. The forecasting is computed only at station sites. The following steps are carried out to forecast future time points at each station and pollutant: (i) retrieve the last 24 h averages measurements (pollutant+temperature+humidity) of the station through the API service; (ii) arrange the data into a matrix of shape (24,3); (iii) identify outliers and replace them with null values; (iv) impute missing values with linear interpolation, provided that the imputed data is surrounded by valid data; (v) apply min-max value normalization using the max and min values of each pollutant found in the training dataset; (vi) transform the data to time-differences, leaving a matrix of shape (23,3); (vii) submit the resulting matrix to the corresponding forecasting model to predict the next 6 h differences of the target air pollutant; (viii) transform the output prediction (time differences) to actual pollutant concentration values; (ix) apply the inverse operation of the min-max normalization to recover the non-scaled values of the air pollutant, (x) store the predicted values into the database through the API service for use of the app.
4. Results and Discussion
4.1. Evaluation of Spatial Prediction
In order to identify the best spatial prediction model for each pollutant we performed an empirical evaluation of the following methods: IDW, OK with spherical variogram, OK with gaussian variogram and OK with exponential variogram. Each method was evaluated in each pollutant using a spatial cross-validation strategy: one station is selected as a testing point and the k nearest neighbors stations with non-null values are used as known points in the model (k is iterated from 2 to 7) and a prediction is obtained for every hour of the testing period (July 2021). Then, the root mean square error (RMSE) is calculated between the predicted values and the actual values measured by the testing station. This process is repeated until every station is used as testing point. Figures 9A–C show boxplots of the obtained RMSE values for CO, NO2, and PM2.5 pollutant, respectively. The boxplots are shown as a function of the number of nearest stations (k) and colored according to the method type.
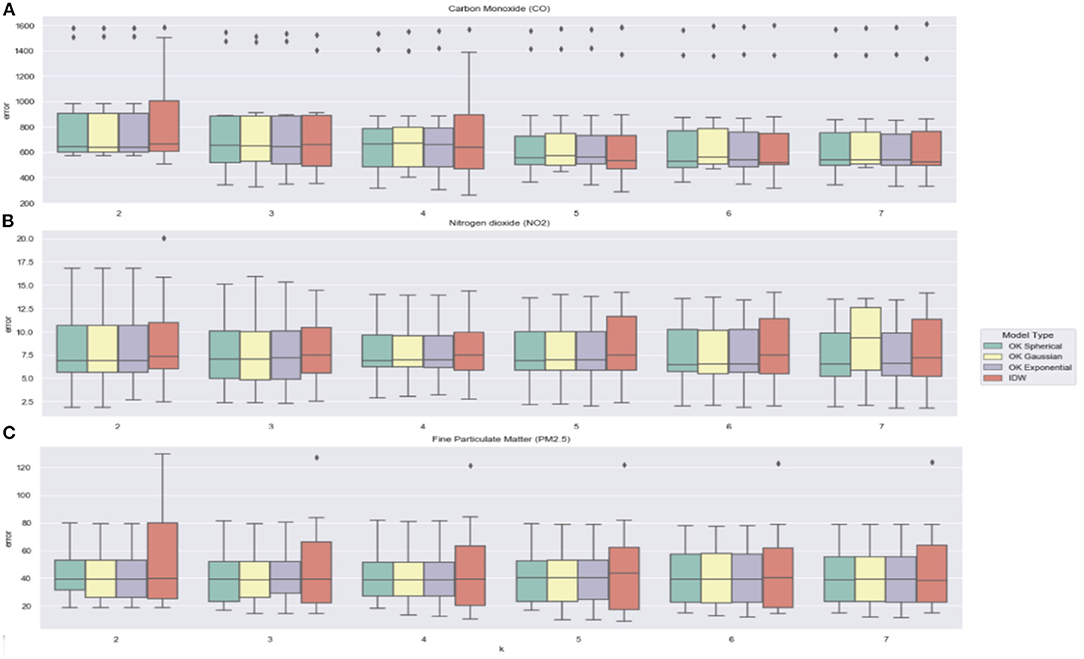
Figure 9. Boxplots of RMSE values obtained in a spatial cross-validation strategy by different spatial prediction models (IDW and OK with spherical, gaussian, and exponential variogram). (A) Presents results for CO pollutant, (B) presents results for NO2 pollutant, and (C) presents results for PM2.5 pollutant. The X-axis indicates the number of nearest stations used in the models to make the predictions.
With respect to the effect of k value, we can see that for all pollutants and prediction models, the mean cross-validation error decreases as more nearest stations are used in the model until reaching 5 stations, where the error stabilizes. In the case of CO pollutant there are two stations with outlier errors and in the case of PM2.5 pollutant there is one station with outlier values. With respect to the model type, we can see that OK method presents similar results across the different tested variograms. IDW model tends to present higher RMSE values and variances in NO2 and PM2.5 pollutants. However, in CO pollutant, IDW presents slightly better results than the other methods for k ≥ 5. Based on these results we selected the following spatial models for deployment in the system:
• IDW with k = 5 for CO pollutant. This model presented the lowest error values with k ≥ 5.
• OK with k = 5 and exponential variogram for NO2 and PM2.5 pollutants. Despite all OK models presented similar results and better than IDW for k ≥ 5, the exponencial variogram was selected because it is simple to compute.
Figures 10A–C show, for each pollutant respectively, the per-station error distributions (real-predicted) of the selected models. We can observe that the spatial prediction of gas concentrations (CO and NO2) is harder than predicting particulate matter concentration (PM2.5). In this latter we see the violin plots more centered around zero (less bias). In the case of gases we observe that the predictions at some stations have systematic overestimations or underestimations. To better understand the spatial behavior of the prediction error, we show maps (Figures 11A–C) with the prediction points (rhombus icons) whose sizes are proportional to the average RMSE values obtained with the chosen model for each pollutant. In the case of CO pollutant it seems that the error of the prediction point are associated with the proximity of it to large avenues (points 13, 3, 5). In the case of NO2, it seems that one error contributing factor is the distance of the prediction point to the sensor network (points 5, 11). In PM2.5 we also observe this behavior, but it seems that other factors are contributing to the prediction error. For example, point 6 and 8 are near to sensors but have high errors. Probably, the local urban features and land use are influencing the transportation of particulate matter. In fact, point 6 is on a large plaza with restricted traffic and point 8 is located on a large park. This shows that it may be possible to improve spatial prediction errors with models that take into account the local features of the prediction point.
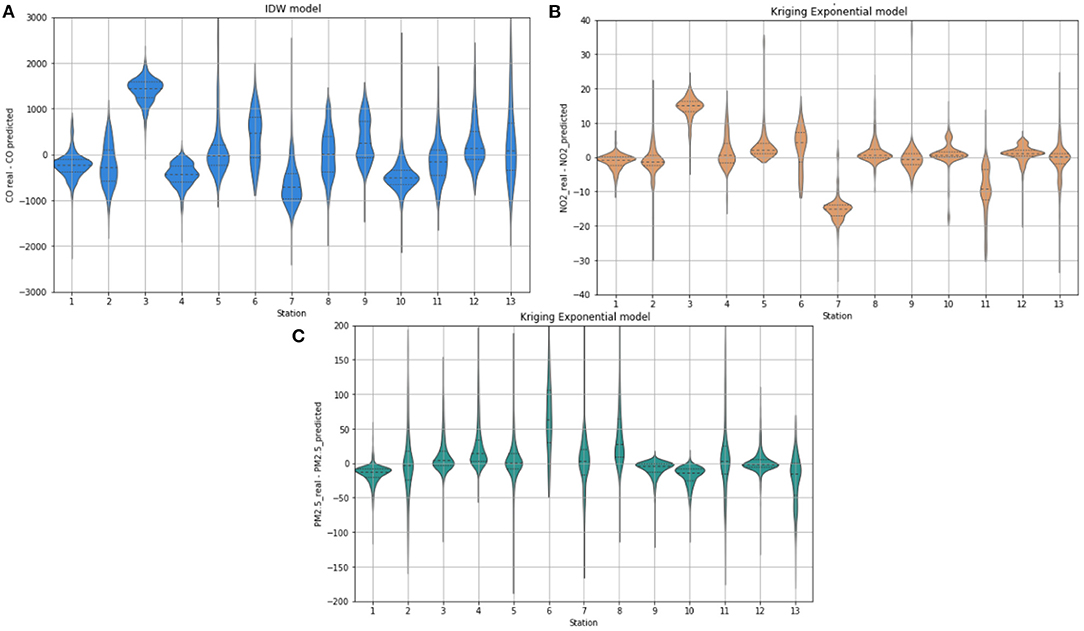
Figure 10. Error distribution (real - predicted) at each station obtained by the selected spatial prediction models. (A) Presents results for CO pollutant, (B) presents results for NO2 pollutant, and (C) presents results for PM2.5 pollutant. The X-axis indicates the test station.
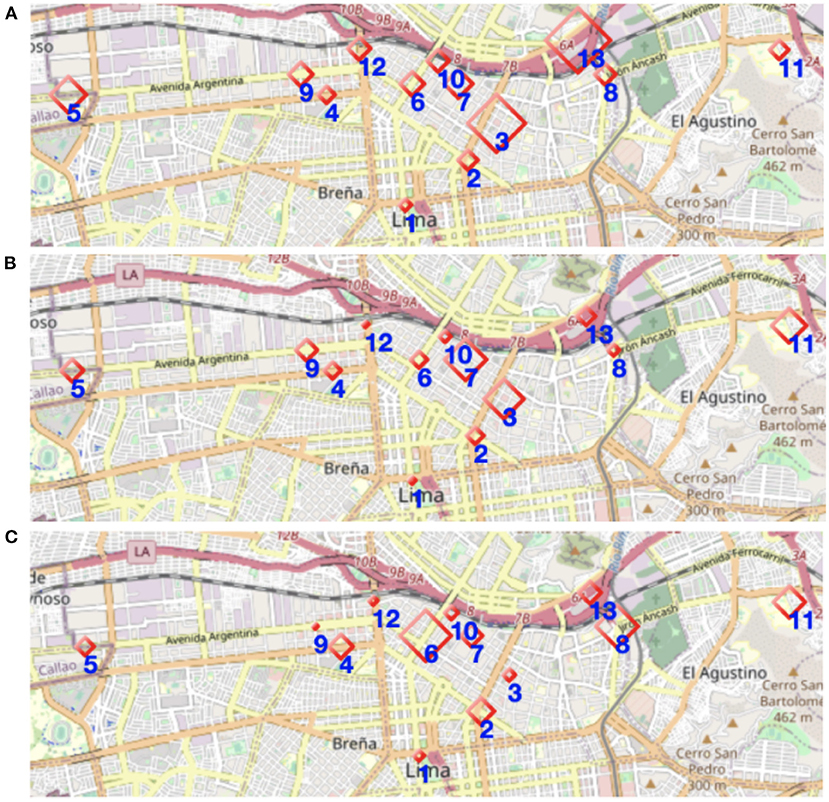
Figure 11. Representation of spatial prediction errors across the monitored points (rhombus icons). The sizes of the rhombus are proportional to the average RMSE values obtained with the chosen model for the respective pollutant. (A) Presents results for CO pollutant, (B) presents results for NO2 pollutant, and (C) presents results for PM2.5 pollutant.
4.2. Evaluation of Forecasting Models
The optimized forecasting models for each pollutant (Figure 7) were tested on a new test dataset, which was constructed with data collected from 7 new monitoring stations implemented in Lima city during the months of March 2021 to May 2021 (the training/validation data were from 2020). Table 1 shows the average RMSE and MAE values obtained on this dataset with the optimized models for each model type and pollutant (averaged over the 6 forecasted hours). We included in the evaluation a persistent model, which predicts the next 6 h equal to the value of the current hour. This simple method is used as a baseline to get a lower-bound performance. We can appreciate that the LSTM model presents the best average performance values for NO2 and PM2.5 pollutant, while the CNN model proved to be the most suitable model for forecasting CO values.
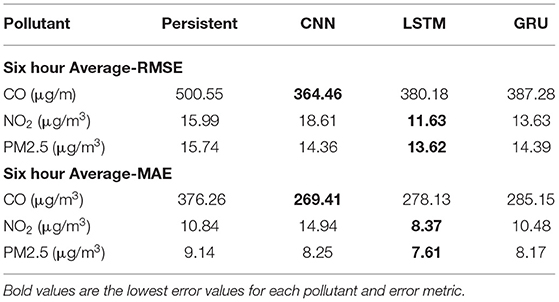
Table 1. Six-hours average of RMSE and MAE values for the three optimized deep learning models and the persistent model.
Figures 12A–C show, for each pollutant, the per-station RMSE curves of the best models as a function of the forecasted hour. We also include the RMSE curves of the respective persistent model for comparison. From these plots it is clear that the deep learning models show to be consistently better than the persistent model, especially predicting the distant future (4 h onward), where the error is considerably lower than the persistent model.
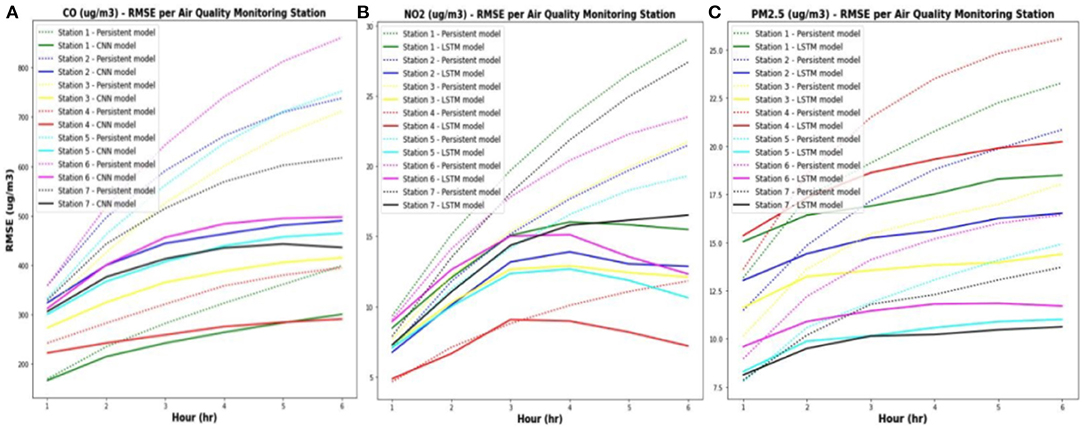
Figure 12. RMSE of selected forecasting models at each station vs predicted hour. (A) Presents results for CO pollutant, (B) presents results for NO2 pollutant, and (C) presents results for PM2.5 pollutant. It is also included results of persistent models (dotted curve) as a baseline for comparison.
To further verify how close the predictions are to the actual values, we show in Figures 13A–C some examples of the deep learning predictions (at 6 h ahead) against the actual values for each one of the three air pollutants during the testing period (March–May 2021). It is important to notice that air pollution dynamics in 2021 was different from that of 2020 due to COVID19 mobility restrictions. However, throughout our experiments we found that the deep learning models have been able to generalize well on data of a different period. We infer that this result can be due to the fact of having trained the models on data from varied locations and having worked on temporal differences and not in absolute values. Working on time differences seems to facilitate the learning of the air pollution dynamics since the model pays attention to changes of consecutive observations and not their scale. Finally, Table 2 presents the MAPE (%) metrics per hours for the selected deep learning models evaluated on the new validation data. It can be seen that the LSTM models for NO2 and PM2.5 behaves reasonably, presenting a maximum MAPE of 22.5%. The forecasting of CO seems to be harder, reaching a maximum MAPE of 61.2% at the last forecasted hour.
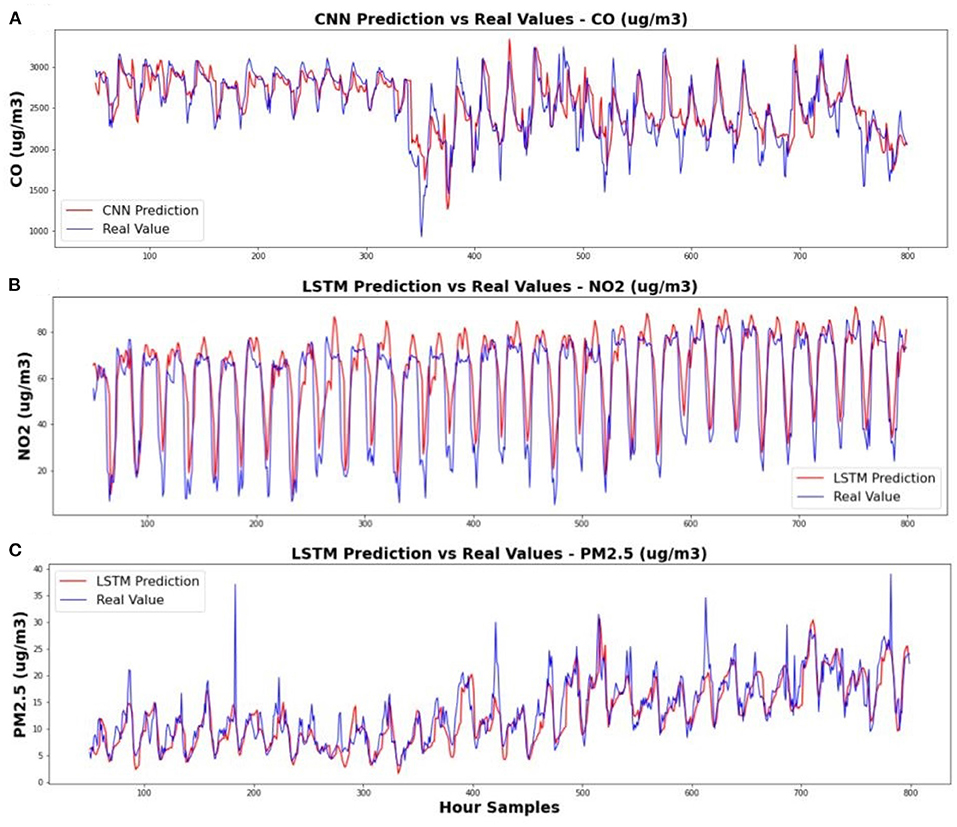
Figure 13. Examples of predictions with the selected deep learning models (at 6 h ahead) against the actual values during the testing period (March to May 2021). (A) Presents results for CO pollutant, (B) presents results for NO2 pollutant, and (C) presents results for PM2.5 pollutant.
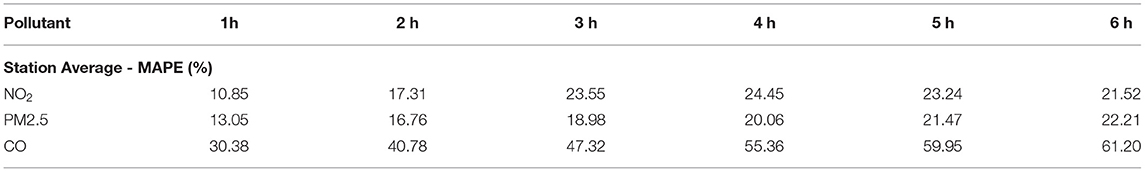
Table 2. Average MAPE (%) values by hour ahead predicted obtained by the selected models in the 7 new air quality stations evaluated with data from March, April and May from 2021.
5. Conclusions
In urban environments there is a need for citizens to be informed about the current and future situation of the quality of the air they breathe in order to minimize the risks of overexposure to polluted air. However, the implementation of official monitoring networks can be prohibitive for many cities, given the high costs of acquisition and maintenance. In this paper we described a low-cost solution for air quality monitoring that can inform to the citizen the current and the near future situation (6 h ahead) about the quality of his surrounding air. The system, deployed in Lima city, is composed of low-cost IoT stations, Artificial Intelligence models and a web application that can deliver the predicted information in a graphical way (pollution maps). Through a series of experiments we assessed the quality of the temporal and spatial prediction. The error levels were satisfactory for predicting particulate matter (PM2.5) when compared to reference methods. We conclude that this low-cost solution is a cost-effective solution that can help identify high-risk areas for exposure to airborne pollutants. The computational resource requirements for the deployment of the system are modest when compared to numerical operational models. It can be easily replicated in places where there are no resources to implement reference networks. In future work we plan to incorporate in the AI models more layers of information to give the models more local context and improve predictions. For example, we are planning to supply the models with variables such as: vegetation index, surface elevation data, and land use data, information that is known to be related with air pollution processes.
Data Availability Statement
The datasets presented in this study can be found in online repositories. The names of the repository/repositories and accession number(s) can be found at: https://drive.google.com/drive/folders/1Wh-d_5DJ372Wz0RyHgl_7m42f0DDggBC?usp=sharing.
Author Contributions
LM developed and deployed the web app. DF developed and evaluated the forecast models. DP implemented and evaluated the spatial prediction models. MA and CS developed the monitoring hardware and participated in the deployment of the networks. EV conceived the overall research, supervised and managed the different research stages, performed the data analysis, and discussion. All authors contributed to draft the paper.
Funding
The authors gratefully acknowledge financial support by Programa Nacional de Investigación Científica y Estudios Avanzados (PROCIENCIA) - Mundial Bank (Grant: 50-2018-FONDECYT-BM-IADT-MU).
Conflict of Interest
The authors declare that the research was conducted in the absence of any commercial or financial relationships that could be construed as a potential conflict of interest.
Publisher's Note
All claims expressed in this article are solely those of the authors and do not necessarily represent those of their affiliated organizations, or those of the publisher, the editors and the reviewers. Any product that may be evaluated in this article, or claim that may be made by its manufacturer, is not guaranteed or endorsed by the publisher.
Acknowledgments
The authors are grateful for the help of Grupo Qaira S.A.C and the Metropolitan Municipality of Lima for their support in the deployment of the monitoring network.
References
Amuthadevi, C., Vijayan, D. S., and Ramachandran, V. (2021). Development of air quality monitoring (AQM) models using different machine learning approaches. J. Ambient Intell. Humaniz Comput. in press. doi: 10.1007/s12652-020-02724-2
Barot, V., Kapadia, V., and Pandya, S. (2020). Qos enabled iot based low cost air quality monitoring system with power consumption optimization. Cybern. Inf. Technol. 20, 122–140. doi: 10.2478/cait-2020-0021
Bashir Shaban, K., Kadri, A., and Rezk, E. (2016). Urban air pollution monitoring system with forecasting models. IEEE Sens. J. 16, 2598–2606. doi: 10.1109/JSEN.2016.2514378
Bezantakos, S., Costi, M., Barmpounis, K., Antoniou, P., Vouterakos, P., Keleshis, C., et al. (2021). Qualification of the alphasense optical particle counter for inline air quality monitoring. Aerosol Sci. Technol. 55, 361–370. doi: 10.1080/02786826.2020.1864276
Cabaneros, S. M., Calautit, J. K., and Hughes, B. R. (2019). A review of artificial neural network models for ambient air pollution prediction. Environ. Modell. Softw. 119, 285–304. doi: 10.1016/j.envsoft.2019.06.014
Chiwewe, T. M., and Ditsela, J. (2016). “Machine learning based estimation of ozone using spatio-temporal data from air quality monitoring stations,” in 2016 IEEE 14th International Conference on Industrial Informatics (INDIN) (Poitiers: IEEE), 58–63.
Choi, K., and Chong, K. (2022). Modified inverse distance weighting interpolation for particulate matter estimation and mapping. Atmosphere 13, 846. doi: 10.3390/atmos13050846
Fan, J., Li, Q., Hou, J., Feng, X., Karimian, H., and Lin, S. (2017). “A spatiotemporal prediction framework for air pollution based on deep rnn,” in ISPRS Annals of Photogrammetry, Remote Sensing and Spatial Information Sciences, Vol. IV-4/W2 (Cambridge, MA), 15–22.
Gea, O. C., Heibati, B., Kloog, I., Fiore, M., and Ferrante, M. (2017). A review of airq models and their applications for forecasting the air pollution health outcomes. Environ. Sci. Pollut. Res. 24, 6426–6445. doi: 10.1007/s11356-016-8180-1
Glass, T., Ali, S., Parr, B., Potgieter, J., and Alam, F. (2020). “Iot enabled low cost air quality sensor,” in 2020 IEEE Sensors Applications Symposium (SAS) (Kuala Lumpur: IEEE), 1–6.
Gryech, I., Ben-Aboud, Y., Guermah, B., Sbihi, N., Ghogho, M., and Kobbane, A. (2020). Moreair: a low-cost urban air pollution monitoring system. Sensors 20, 998. doi: 10.3390/s20040998
Iskandaryan, D., Ramos, F., and Trilles, S. (2020). Air quality prediction in smart cities using machine learning technologies based on sensor data: a review. Appl. Sci. 10, 2401. doi: 10.3390/app10072401
Kang, Y., Aye, L., Ngo, T. D., and Zhou, J. (2022). Performance evaluation of low-cost air quality sensors: a review. Sci. Total Environ. 818, 151769. doi: 10.1016/j.scitotenv.2021.151769
Krishan, M., Jha, S., Das, J., Singh, A., Goyal, M. K., and Sekar, C. (2019). Air quality modelling using long short-term memory (lstm) over nct-delhi, india. Air Q. Atmosphere Health 12, 899–908. doi: 10.1007/s11869-019-00696-7
Kristiani, E., Lin, H., Lin, J.-R., Chuang, Y.-H., Huang, C.-Y., and Yang, C.-T. (2022). Short-term prediction of pm2.5 using lstm deep learning methods. Sustainability 14, 2068. doi: 10.3390/su14042068
Kumar, A., Gupta, I., Brandt, J., Kumar, R., Dikshit, A. K., and Patil, R. S. (2016). Air quality mapping using gis and economic evaluation of health impact for mumbai city, india. J. Air Waste Manag. Assoc. 66, 470–481. doi: 10.1080/10962247.2016.1143887
Kumar, P., Druckman, A., Gallagher, J., Gatersleben, B., Allison, S., Eisenman, T. S., et al. (2019). The nexus between air pollution, green infrastructure and human health. Environ. Int. 133, 105181. doi: 10.1016/j.envint.2019.105181
Liu, B., Yan, S., Li, J., and Li, Y. (2016). “Forecasting pm2.5 concentration using spatio-temporal extreme learning machine,” in 2016 15th IEEE International Conference on Machine Learning and Applications (ICMLA) (Anaheim, CA: IEEE), 950–953.
Liu, D.-R., Lee, S.-J., Huang, Y., and Chiu, C.-J. (2020). Air pollution forecasting based on attention-based lstm neural network and ensemble learning. Expert Syst. 37, e12511. doi: 10.1111/exsy.12511
Liu, X., Jayaratne, R., Thai, P., Kuhn, T., Zing, I., Christensen, B., et al. (2020). Low-cost sensors as an alternative for long-term air quality monitoring. Environ. Res. 185, 109438. doi: 10.1016/j.envres.2020.109438
Maleki, H., Sorooshian, A., Goudarzi, G., Baboli, Z., Tahmasebi Birgani, Y., and Rahmati, M. (2019). Air pollution prediction by using an artificial neural network model. Clean Technol. Environ. Policy 21, 1341–1352. doi: 10.1007/s10098-019-01709-w
Manisalidis, I., Stavropoulou, E., Stavropoulos, A., and Bezirtzoglou, E. (2020). Environmental and health impacts of air pollution: a review. Front. Public Health 8, 14. doi: 10.3389/fpubh.2020.00014
Mohd Abdul, A., Paiva, S., Tripathi, G., and Feroz, N. (2020). Enabling technologies and sustainable smart cities. Sustainable Cities 61, 2210–6707. doi: 10.1016/j.scs.2020.102301
Morawska, L., Thai, P. K., Liu, X., Asumadu-Sakyi, A., Ayoko, G., Bartonova, A., et al. (2018). Applications of low-cost sensing technologies for air quality monitoring and exposure assessment: how far have they gone? Environ. Int. 116, 286–299. doi: 10.1016/j.envint.2018.04.018
Ragab, M. G., Abdulkadir, S. J., Aziz, N., Al-Tashi, Q., Alyousifi, Y., Alhussian, H., et al. (2020). A novel one-dimensional cnn with exponential adaptive gradients for air pollution index prediction. Sustainability 12, 90. doi: 10.3390/su122310090
Reátegui-Romero, W., Sánchez-Ccoyllo, O., Andrade, M., and Moya-Álvarez, A. (2018). Pm2.5 estimation with the wrf/chem model, produced by vehicular flow in the lima metropolitan area. Open J. Air Pollut. 07, 215–243. doi: 10.4236/ojap.2018.73011
Sajjadi, S. A., Zolfaghari, G., Adab, H., Allahabadi, A., and Delsouz, M. (2017). Measurement and modeling of particulate matter concentrations: Applying spatial analysis and regression techniques to assess air quality. MethodsX 4, 372–390. doi: 10.1016/j.mex.2017.09.006
Schloeder, C., Zimmerman, N., and Jacobs, M. (2001). Comparison of methods for interpolating soil properties using limited data. Soil Sci. Soc. Am. J. 65, 470–479. doi: 10.2136/sssaj2001.652470x
Shahriyari, H. A., Nikmanesh, Y., Jalali, S., Tahery, N., Zhiani Fard, A., Hatamzadeh, N., et al. (2021). Air pollution and human health risks: mechanisms and clinical manifestations of cardiovascular and respiratory diseases. Toxin Rev. 41, 606–617. doi: 10.1080/15569543.2021.1887261
Shukla, K., Kumar, P., Mann, G. S., and Khare, M. (2020). Mapping spatial distribution of particulate matter using kriging and inverse distance weighting at supersites of megacity delhi. Sustain. Cities Soc. 54, 101997. doi: 10.1016/j.scs.2019.101997
Somayya, M., Ramaswamy, R., and Tripathi, S. (2015). Internet of things (iot): A literature review. Comput. Commun. 3, 164–173. doi: 10.4236/jcc.2015.35021
Su, X., Liu, X., Motlagh, N. H., Cao, J., Su, P., Pellikka, P., et al. (2021). Intelligent and scalable air quality monitoring with 5g edge. IEEE Internet Comput. 25, 35–44. doi: 10.1109/MIC.2021.3059189
Tao, Q., Liu, F., Li, Y., and Sidorov, D. (2019). Air pollution forecasting using a deep learning model based on 1d convnets and bidirectional gru. IEEE Access 7, 76690–76698. doi: 10.1109/ACCESS.2019.2921578
Ullo, S. L., and Sinha, G. R. (2020). Advances in smart environment monitoring systems using iot and sensors. Sensors 20, 3113. doi: 10.3390/s20113113
Wen, C., Liu, S., Yao, X., Peng, L., Li, X., Hu, Y., et al. (2019). A novel spatiotemporal convolutional long short-term neural network for air pollution prediction. Sci. Total Environ. 654, 1091–1099. doi: 10.1016/j.scitotenv.2018.11.086
Wong, M. S., Wang, T., Ho, H. C., Kwok, C. Y. T., Lu, K., and Abbas, S. (2018). Towards a smart city: development and application of an improved integrated environmental monitoring system. Sustainability 10, 623. doi: 10.3390/su10030623
Yan, R., Liao, J., Yang, J., Sun, W., Nong, M., and Li, F. (2021). Multi-hour and multi-site air quality index forecasting in beijing using cnn, lstm, cnn-lstm, and spatiotemporal clustering. Expert Syst. Appl. 169, 114513. doi: 10.1016/j.eswa.2020.114513
Zhang, H., and Srinivasan, R. (2020). A systematic review of air quality sensors, guidelines, and measurement studies for indoor air quality management. Sustainability 12, 9045. doi: 10.3390/su12219045
Keywords: air quality, low-cost, Artificial Intelligence, spatio-temporal prediction, air pollution, machine learning, forecasting, monitoring system
Citation: Montalvo L, Fosca D, Paredes D, Abarca M, Saito C and Villanueva E (2022) An Air Quality Monitoring and Forecasting System for Lima City With Low-Cost Sensors and Artificial Intelligence Models. Front. Sustain. Cities 4:849762. doi: 10.3389/frsc.2022.849762
Received: 06 January 2022; Accepted: 09 June 2022;
Published: 07 July 2022.
Edited by:
Alberto Castellini, University of Verona, ItalyReviewed by:
Daranee Jareemit, Thammasat University, ThailandSouvik Sengupta, IEXEC Blockchain Tech SAS, France
Copyright © 2022 Montalvo, Fosca, Paredes, Abarca, Saito and Villanueva. This is an open-access article distributed under the terms of the Creative Commons Attribution License (CC BY). The use, distribution or reproduction in other forums is permitted, provided the original author(s) and the copyright owner(s) are credited and that the original publication in this journal is cited, in accordance with accepted academic practice. No use, distribution or reproduction is permitted which does not comply with these terms.
*Correspondence: Edwin Villanueva, ZXJ2aWxsYW51ZXZhQHB1Y3AuZWR1LnBl