 Jose María Cordero
 Adolfo Narros
- ETSII-UPM (Escuela Técnica Superior de Ingenieros Industriales), Madrid, Spain
The coronavirus disease (COVID) lockdown was implemented in 2020, which included harsh restrictions on the amount of traffic. As a consequence, a low-emission scenario that could only be simulated before, actually occurred. This constituted a unique and valuable opportunity to study the effect of air quality pollutant concentrations. Although a direct comparison between the observed measured values given by reference air quality stations (AQSs) and values from before the COVID lockdown provides an idea of the pollution reduction, it cannot be separated from the meteorology, and hence, those studies could be misleading. This study used the approach of modeling a normal business day using both air quality and meteorological data from 2017 to 2019 to train machine-learning models to be able to predict what concentration of the three most concerning pollutants (NO2, O3, and PM10) would be given by the meteorological conditions and the time of the year. The XGBoost and LightGBM gradient boosting decision tree-based models were applied to the time series recorded in Madrid and used to predict the expected concentrations in 2020 if no restrictions had been made. The predictions could then be compared to the real observed AQS data to determine the meteorological normalized reductions. The results showed around a 60% reduction in the NO2 at the three types of AQSs (traffic, suburban, and background) during the most restrictive months of the pandemic. The O3 concentration showed a different behavior depending on the type of AQS, pointing to changes in the regime of other pollutants, such as VOCs. The PM10 was the most difficult case to analyze because of its dependence on external transport phenomena, which were difficult to consider in the models. A set of CTM simulations should be done in the future to assess the O3-VOCs-NOx chemistry.
Introduction
The rapid spread of coronavirus disease 19 (COVID-19) affected the European countries from March 2020 onward. Spain was one of the most affected countries in the first wave of COVID-19. The viral threat forced the government to implement a state of alarm on 14 March, which restricted the mobility of the citizenry to strictly necessary activities, such as purchasing food and receiving medical assistance. Where possible, non-essential activities were restricted to teleworking, and travel by car was completely forbidden unless it was indispensable. This situation occurred worldwide (Anjum, 2020; Bao and Zhang, 2020). After 30 March, the government implemented even more restrictive measures on 9 April, when only some essential services, such as pharmacies, the food sector, and some industries, were allowed. This was due to an increasing number of detected COVID-19 cases and hospital admissions: Spain detected 9,222 new cases in 24 h on 31 March 2020. Once the infection curve started to stabilize, the Government implemented a method known as “de-escalation,” which consisted of several phases (from Phases 0 to 3) that would be followed to achieve a “new normal” situation while keeping the spread of COVID under control. These kinds of measures were designed to be implemented asymmetrically and could hence vary among autonomic communities. For instance, the Municipality of Madrid was among the most affected regions of Spain since it has a high population density and level of population mobility. It was also one of the places where more restrictive measures were taken and maintained for a longer duration. For example, Madrid was in Phase 0 from 4 May 2020, to 24 May 2020, in Phase 1 from 25 May 2020 to 8 June 2020, and in Phase 2 from 9 June 2020, until 21 June 2020, when it moved directly into the new normal stage. Until this point, only strictly justified travel, inside or outside of the Greater Madrid Region, was allowed.
These implemented measures caused a dramatic decrease in the traffic intensity and, hence, in its pollutant emissions (Tobias et al., 2020). This constituted a valuable and unprecedented opportunity to study a low-emission scenario with low traffic that could only be modeled previously.
Several studies have been conducted globally on the effects of traffic reduction on atmospheric pollution due to the COVID measures. Many of them compared the measured pollutant concentrations with the corresponding time series that were recorded in the previous years. However, this does not consider the effect of the weather on the pollutant dynamics, chemistry, and dispersion, which makes a comparison with the previous years unsuitable.
Generally, previous studies have found an abrupt decrease in NOx, mostly due to traffic restrictions. In contrast, there has been a reported increase in O3 (Kondo et al., 2020; Mahato et al., 2020; Tobias et al., 2020; Wang et al., 2020; Chu et al., 2021). This effect is often related to a decrease in the oxidative capacity of the atmosphere due to the NOx decrease (Baldasano, 2020; Li et al., 2020), to a change in the VOCs-O3 regime (Ding et al., 2021; Lin et al., 2021) or a seasonal solar irradiation increment. This effect was especially strong in large urban areas (Adhikari and Yin, 2020; Sicard et al., 2020). Additionally, the particulate matter (PM) was found to decrease but still was over the threshold recommended by the WHO (Cole et al., 2020; Kerimray et al., 2020); it likely did not undergo a high decrease, such as NOx, due to regional transport, meteorological constraints, and non-linear aerosol chemistry (Le et al., 2020). Furthermore, in some stages of the lockdown, no decrease was found at all (Dobson and Semple, 2020; Siciliano et al., 2020) or the PM even increased (Nadzir et al., 2020) due to external events.
Some studies have considered the effect of meteorology to make the pollutant concentration of different years comparable. For instance, Xiang et al. (2020) found that the pollutant concentrations were very different when meteorology was considered.
Different scientists have used different approaches. Ding et al. (2021) used dispersion coefficients to remove the meteorological effects from the measured PM2.5. Song et al. (2021) found that meteorology was responsible for 8.8% of the observed PM increase, using a wind decomposition technique. Moreover, Lin et al. (2021) used CTMs to determine the effect of meteorology.
Some authors used statistical or machine-learning (ML) algorithms. Henneman et al. (2015) applied detrending methods to a time series, Qu et al. (2020) used ensemble algorithms (based on a set of models), Barmpadimos et al. (2011) employed generalized additive models, Gong et al. (2022) used multiple linear regression (MLR), and Falocchi et al. (2021) and Liu et al. (2022) employed random forests.
In addition, other authors used more sophisticated ML algorithms, such as non-parametric kernel regression (Liang et al., 2016) and gradient boosting trees (GBT) (Carslaw and Taylor, 2009). Grange et al. (2018) applied this methodology using the random forests (RF) algorithm to predict the Swiss PM10 trends. In this study, we used the approach of several authors (Grange et al., 2018; Grange and Carslaw, 2019; Cole et al., 2020; Dobson and Semple, 2020), who applied ML algorithms to predict the pollutant concentrations of a normal business day (business as usual [BAU]). This kind of model, once trained, allows for the prediction of a pollutant concentration time series during the lockdown period that would have been expected to occur under normal conditions (without lockdown measures). Then, the results can be compared to the true observed concentrations, creating an estimate of the real decrease in atmospheric pollution (Petetin et al., 2020).
Materials and Methods
The following methodology was used to assess the pollutant concentration reduction caused by the COVID lockdown in the city of Madrid in 2020. The lockdown started on 16 March 2020 and was removed after several phases were implemented, which successively eliminated restrictions on mobility. In the community of Madrid, the starting dates of such phases were as follows: Phase 0: 4 May 2020; Phase 1: 25 May 2020; Phase 2: 8 June 2020; and the “new normal” on 21 June 2020.
We followed a similar methodology to the study by Grange and Carslaw (2019). Following Petetin et al. (2020), ML models were fitted to the previous year's data using the pollutant concentration as the dependent variable and a set of meteorological variables and time variables as features. The meteorological variables introduced the effect of dispersion, short- or long-range transport, removal, and chemical evolution whereas the time variables provided a time series effect like trends or seasonality information for the models. The models were therefore trained for a given subjacent emission forcing, and their predictions during the lockdown did not consider the restriction measures but considered only the meteorology and the seasonal components of time. The predictions made with such models were thus independent from lockdown measures and could be compared with the true observations by means of air quality stations (AQSs) to estimate the real decrease in atmospheric pollution.
In this study, we opted to apply gradient boosted trees, specifically the state-of-the-art XGBoost (Chen and Guestrin, 2016) and LightGBM (Ke et al., 2017) algorithms. Both are non-linear since they are based on recursive node splits until the desired degree of node purity is achieved. They are also non-parametric, removing the necessity for the data to be independent, homoscedastic, and normally distributed. They count with a set of tuning hyperparameters that are easy to adjust and can be implemented without configuring a complex model architecture, such as artificial neural networks. In addition, both algorithms' implementations allow for post-analysis of the results using a feature importance analysis; therefore, the weight of the impact of the different features that were used on the pollutant concentrations could be studied.
In this study, the OpenAir (Carslaw and Ropkins, 2012) R package timeVariation function was used to visualize the effect of the lockdown on the pollutant concentrations, considering only the AQS observations. Then, the meteorology-normalized time series were obtained, and the effects of the lockdown measures on the pollutant concentrations were assessed.
Air quality station data were downloaded from the Madrid City Council (Madrid City Council, 2021) and consisted of NO2, O3, and PM10 hourly observations from 22 stations in 2017. Earlier years were not considered since the emission patterns varied highly, making their measurements non-comparable. The choice of PM10 instead of PM2.5 was made because PM2.5 is only minimally monitored in Madrid, and the behaviors of both PM2.5 and PM10 are similar since they both are greatly affected by external factors. The stations were classified into three categories: traffic, background, and suburban. The meteorological data were downloaded from the AEMET Open Data API (AEMET, 2021) and included the daily average temperature (tmean), the maximum and minimum daily temperatures (tmax and tmin, respectively), the wind speed and direction (Ws and Wd, respectively), the maximum and minimum daily surface pressures (presMax and presMin, respectively), and the gust speed. For this study, only the meteorological station of Retiro was used, since it should be sufficiently representative of the diurnal and seasonal variations in the whole city of Madrid, and other studies have successfully used wide spatial resolutions (Petetin et al., 2020). These meteorological variables were then used to separate the effect of the meteorology from the pollutant concentrations, as the pollutant concentrations are strongly dependent on them.
In addition to the AQS and meteorological variables, other time-based features were used to capture temporal trends: the Julian day, taken as the first day of 1 January 2017; the year-day and the month to account for seasonality; and the weekday to include the working day or weekend effect.
Data Visualization
In this section, the data from the AQSs were simply plotted to observe the variation in the pollutant concentrations before and after the lockdown. First, one AQS representative of each one of the three categories was chosen, and the concentrations were represented by plotting the successive months of April from the year 2017. This was conducted since April 2020 was the first full month where the most restrictive measures were implemented. Figures 1–3 cover the three pollutants studied: NO2, O3, and PM10. The three representative stations were as follows: traffic, Escuelas Aguirre; background, Farolillo; and suburban, Casa de Campo.

Figure 1. The NO2 time series for the consecutive months of April for three air quality station (AQS) representatives of each category: (A) Escuelas Aguirre: traffic, (B) Casa de Campo: suburban, and (C) Farolillo: background. The figure was made using the function timeVariation from the OpenAir R package (Carslaw and Ropkins, 2012).
As shown in Figure 1, the NO2 concentration decreased as expected in all stations studied, with a dramatic decrease in the traffic station. Additionally, the measured NO2 concentration was higher on Fridays and Saturdays. This behavior was also observed in the rest of the AQSs (refer to Supplementary Figure 1, where this figure is reproduced for all the stations aggregated by type). This pattern was less obvious for the suburban AQSs where the NO2 concentration was, in absolute terms, lower. Figures 2, 3 show a comparable analysis for O3 and PM10.
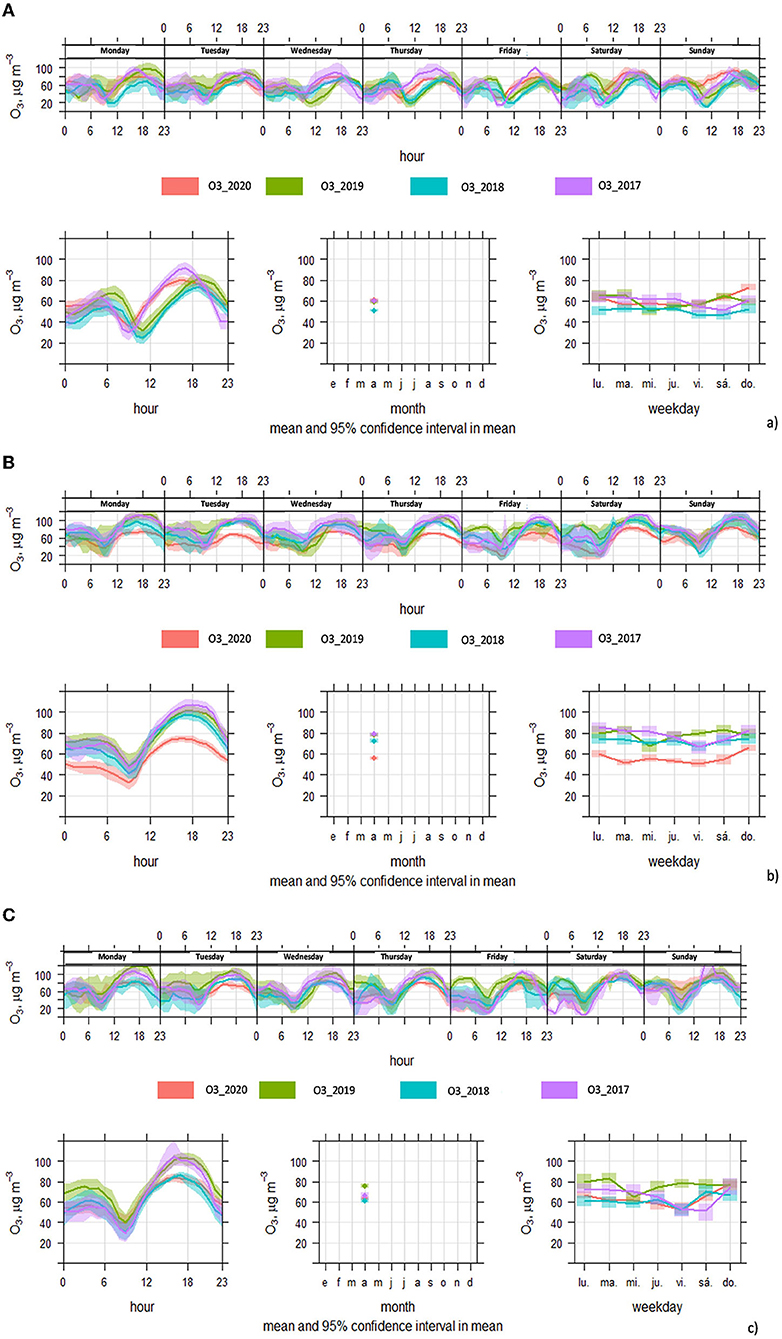
Figure 2. The O3 time series for the consecutive months of April for three air quality station (AQS) representatives of each category: (A) Escuelas Aguirre: traffic, (B) Casa de Campo: suburban, and (C) Farolillo: background. The figure was made using the function timeVariation from the OpenAir R package (Carslaw and Ropkins, 2012).
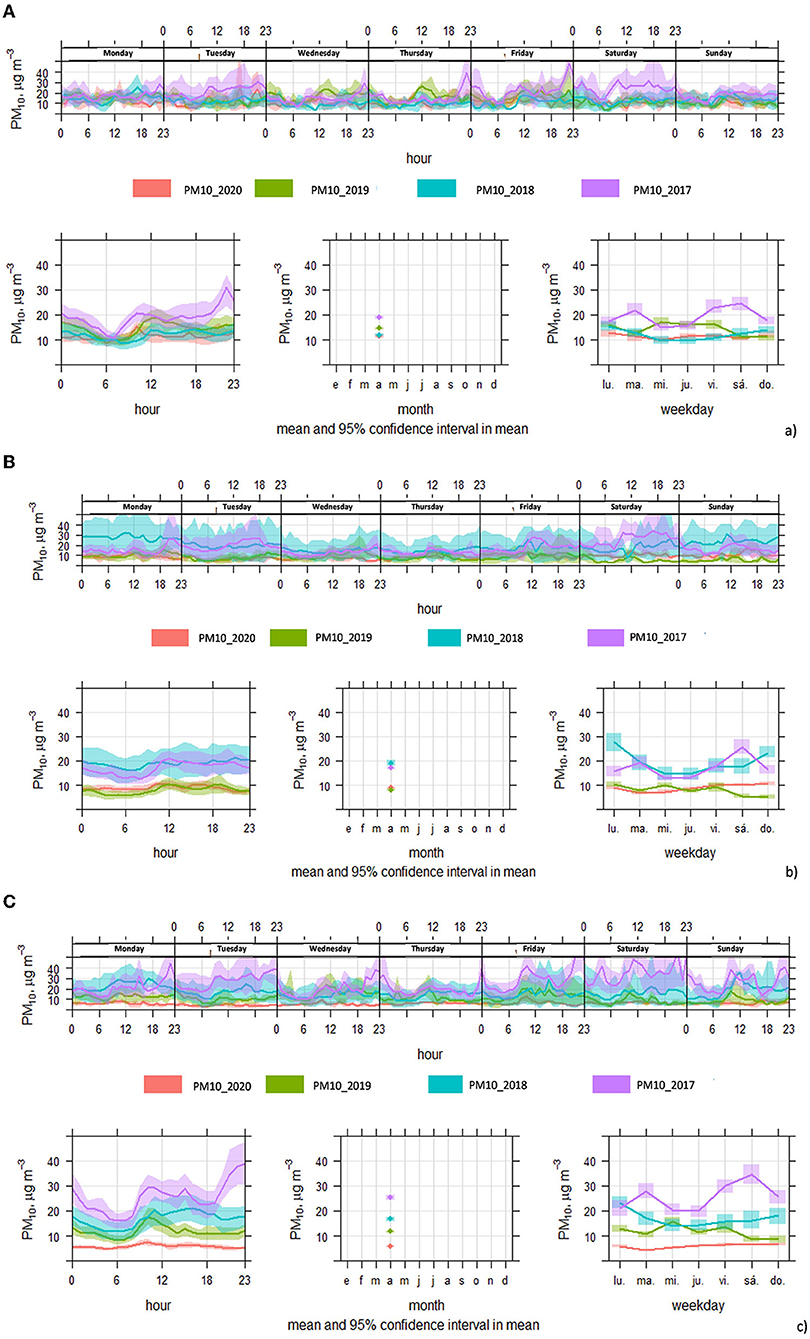
Figure 3. The PM10 time series for the consecutive months of April for three air quality station (AQS) representatives of each category: (A) Escuelas Aguirre: traffic, (B) Casa de Campo: suburban, and (C) Farolillo: background. The figure was made using the function timeVariation from the OpenAir R package (Carslaw and Ropkins, 2012).
In the case of O3, the pattern was more complex, since it did not decrease as steeply as NO2 in all locations. For example, it even increased in some years. The only place where it decreased was at the suburban station (Casa de Campo), pointing to complicated changes in its regime. Previously, reductions in NOx resulted in increases in O3 (Dávalos et al., 2017). In this case, if the changes in emissions were a lot higher and no effect was seen, which is because the VOCs are affecting the O3, as was found to occur by other authors (Ding et al., 2021; Lin et al., 2021). Changes in the VOCs-NOx regime could strongly affect O3 concentrations. Furthermore, according to Jung et al. (2022), O3 concentrations increase more in winter than in summer, showing a strong dependence on the season. Therefore, in the future, we plan to carry out chemical transport models to elucidate the mechanisms between O3 and the other pollutants.
For PM10, it cannot be stated whether it decreases or increases, and therefore, it does not have a clear pattern. This points to an important background component that could be affecting this pollutant and the potential effect of external transport like salt or Saharan intrusion episodes.
Next, Figure 4 shows the violin plots for NO2, O3, and PM10 at the three locations that were studied in the successive months from February 2020. Moreover, Supplementary Figure 2 shows the pollutants aggregated by AQS type and NO2. A violin plot has the advantage over the traditional box and whiskers plot of being visual. Their shape indicates where the data were located. A narrow part of the “violin” has less data than the wider parts of the plot. Therefore, they offer the additional possibility that their shape can be used to check for multimodalities.
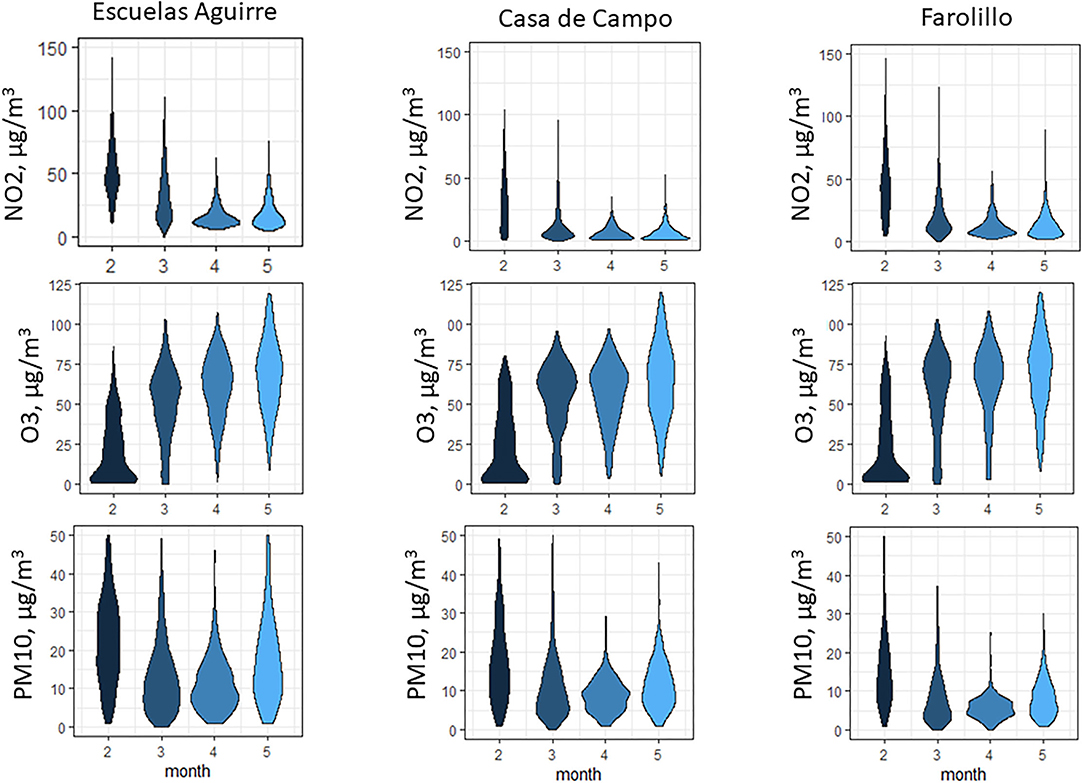
Figure 4. The violin plots for the three air quality stations (AQSs) and the pollutants NO2, O3, and PM10 grouped by consecutive months in (2020).
The patterns for the consecutive months of the same year showed that the consecutive months of April were very similar for the three AQSs. In summary, NO2 decreased in all the locations, with a minimum in April, and started to recover a little in May, but remained very low. The O3 concentration increased month by month as expected because of the increase in solar irradiation. Then, the PM10 decreased until April and then increased in May. However, in the case of the Escuelas Aguirre station (traffic), the results were roughly similar for March and April, whereas in May, despite the lockdown having not ended, the PM10 measurements were similar to those in February when no measures were taken. This reflects the complexities behind the factors that affect this pollutant regime and supports that its concentration cannot only be related to traffic emissions.
Gradient Boosting Trees
To predict the NO2, O3, and PM10 concentrations and to separate them from the meteorological effects, tree-based gradient boosting models were used, similar to the methodology of the study by Grange and Carslaw (2019). The two novel and high-performance algorithms were selected: XGBoost (Chen and Guestrin, 2016) and LightGBM (Ke et al., 2017). The corresponding pollutant concentration was the target variable, whereas the meteorological and time sets were considered as features. Instead of performing a classical random train or test split, a time split was selected since we were working with a time series and desired the highest accuracy. Therefore, the years 2017–2019 were used for training the models, except for the last 2 1/2 months of 2019 that were used for testing. Then, the predictions were made for 2020. The hyperparameters of the models were tuned using a typical grid search process.
With this approach, the predicted NO2/O3/PM10 were only based on the effect of the meteorology and time series and did not consider the emission reduction due to the lockdown restrictions. Thus, the difference between the model results and the observed values at the AQSs provided the actual reduction in pollutants.
The models were fitted to the full three sets of data corresponding to the type of AQS (traffic, background, and suburban), and initially, we did not introduce the source of variability induced from each individual station. However, high variations among locations were detected when comparing the predictions for different individual locations, especially in the case of O3 and the background type of AQS. These findings made us consider introducing the location feature among the set of features. This was performed by creating dummy variables (the number of AQSs measuring each pollutant of each type, minus one to avoid the dummy-trap or multicollinearity). With this procedure, we obtained very accurate results by training a model for each pollutant and every type of AQS, similarly and more efficiently than we would have trained a separate model for each location.
Confidence Intervals
The uncertainty of the predictions was estimated from the residuals that were calculated from the weekly averages of the predictions and the observed values for the period 2017–2019. Then, the 5th and 95th percentiles were used as the lower and upper bounds of the confidence intervals at a 90% confidence level (Petetin et al., 2020).
The residuals were calculated, considering that the uncertainty of the relative differences (%) propagates the individual errors of the variables in equation 1. Therefore, they were calculated according to the following formula:
where δx is the amplitude of the individual confidence interval for variable x*, and
x is the average value of variable x.
*Note that our calculated confidence intervals were not symmetric due to the form of the calculation that was based on the percentiles; therefore, we had to separately calculate the upper and the lower bounds. The variables a and b stand for the numerator and denominator calculated NO2 term, respectively, whereas c is the AQS uncertainty, which is 15%, as this is the maximum uncertainty allowed for AQSs (Directive 2008/50/EC of the European Parliament of the Council of 21 May 2008 on ambient air quality cleaner air for Europe, 2008).
Note that this equation gives the result in terms of percentages, so we converted them back to relative difference (%) units.
Location Dummy Variables
In this study, up to 22 AQSs were used. Each location has its own characteristics which are difficult to consider if a global model is used. Practically, a global model is preferred, since fitting a separate model for each AQS and pollutant would increase the number of models substantially. However, it was needed to make sure that the global model worked well once applied to the individual AQS data. Consequently, a dummy variable approach for the locations was utilized and the results were checked. Figure 5 shows the corresponding model's percentage difference O3 results, fitted exclusively for the individual Barrio del Pilar AQS data, and both global models without and with location introduced as dummy variables. The dummy approach plots resembled the global model results much more than the individual models. This means that we were able to fit a global model that introduces dummy variables for the location features, and we were able to apply the resulting model to each AQS data individually, without losing information and significantly reducing the number of models needed. Therefore, we used this form of model fitting in this study.
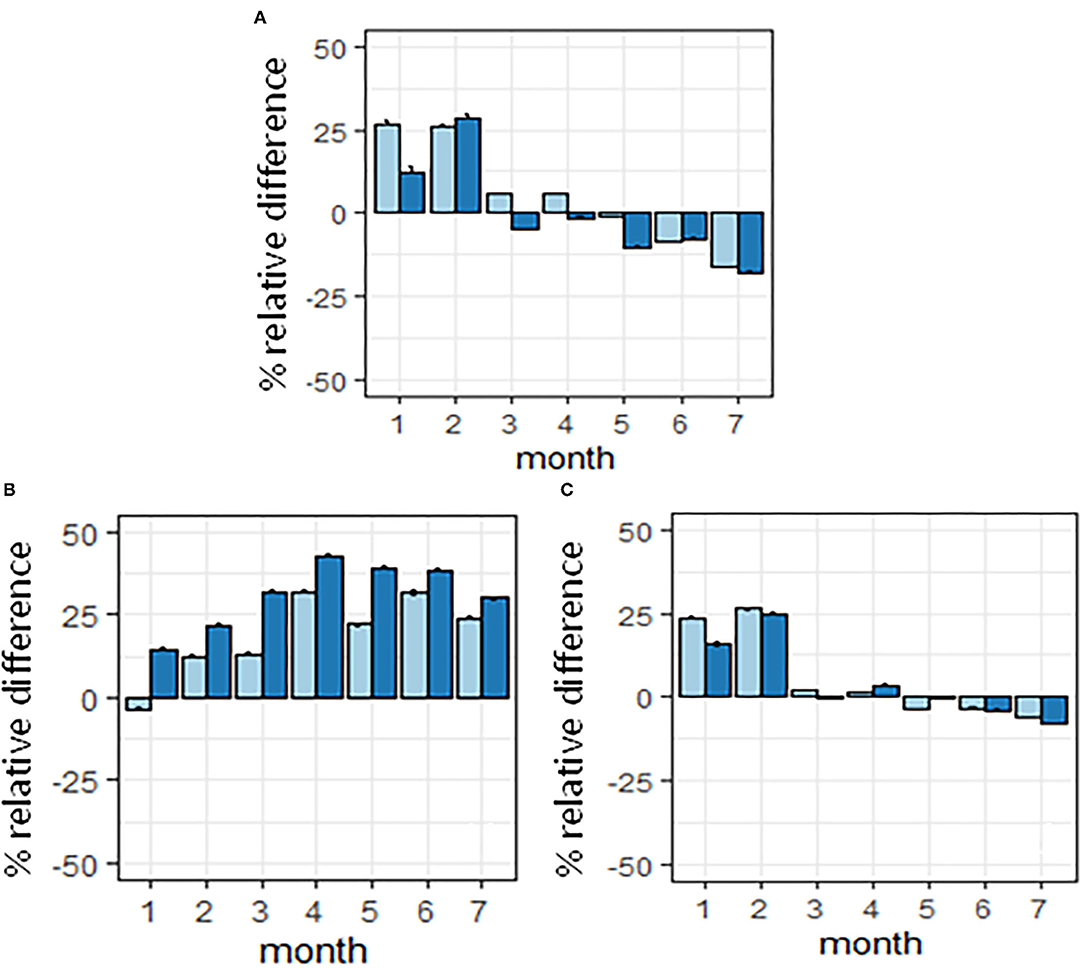
Figure 5. (A) The model fitted exclusively for the Barrio del Pilar air quality station (AQS) data; (B) the global model without location features applied to the Barrio del Pilar AQS data; (C) the global model with dummy variables for the location features for the Barrio del Pilar AQS data. The results are in percentage relative differences for the year 2020 with respect to the AQS observations.
K-Fold Cross-Validation of the Models
Apart from the validation performed using the observed vs. predicted r2, a k-fold cross-validation of the models was performed using 10-folds, which is a common practice. Notably, because the predictions obtained from the models during 2020 cannot be compared to the real values since they are hypothetically normalized, no external validation could be conducted. Instead, the k-fold cross-validation was used to determine a measure of the accuracy of the models and their variance when submitted to different sets of data. This algorithm allowed us to obtain an average metric followed by its standard deviation when run ten times and switching the train or test partitioning among the folds. One fitting contained 90% of the data for training (9-folds), and the remaining 10% was for calculating the error metrics. In this study, for error metrics, we used the r2, because it is widely used and its interpretation is very straightforward: the root mean squared error (RMSE), and the mean absolute error (MAE). When both metrics are used, they offer information about whether there were outliers that affected the results, because RMSE is very susceptible to the outliers since it is squared. In contrast, the MAE is less susceptible to outliers. Therefore, by evaluating whether the RMSE was a lot larger than the MAE, it could be concluded that the data had outliers, which could have been affecting the predictions. If that were the case, the outliers should be identified and explained. But, in this study, the RMSE was only slightly higher than the MAE, so we did not have to consider outliers.
Feature Importance
Both the XGBoost and LightGBM packages provide graphical representations of the feature importance of their models. This is useful for understanding which variables are the most important and which are less and could be removed if computational requirements are too high. The method that the models use to measure the feature importance varies among the models. The XGBoost offers the gain of each feature in the model, whereas the LightGBM measures the number of splits. Conceptually, if a variable produces more branch splits, it governs more of the architecture (or an ensemble) of a decision tree and hence should be more important for determining the final prediction. The gain represents the fractional contribution of each feature to the model, based on the total gain of the feature's splits. A higher percentage indicates a more important predictive feature. Therefore, the gain and the number of splits are similar measurements.
Figure 6 displays both the XGboost and LightGBM feature importance bar plots when a global model (with dummy variables for location) is used for the three types of pollutants and the case of traffic AQSs.
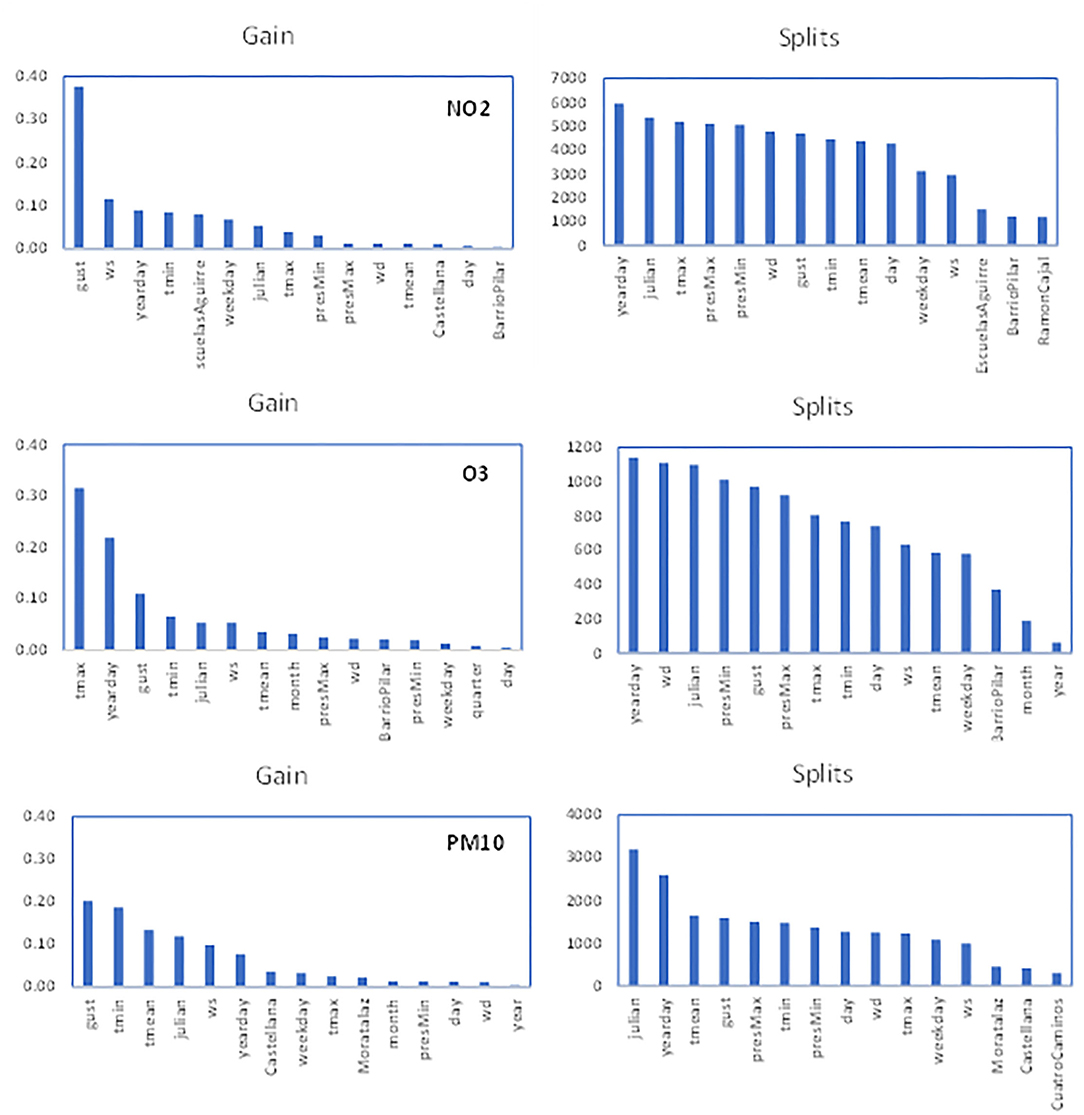
Figure 6. The feature importance bar plots represent the gain for the XGboost model and the number of splits for the LightGBM model and the three pollutants. The results are for the traffic air quality stations (AQSs) using a pool model.
In the case of NO2, we found that the XGBoost model relied on the gust feature, whereas the LightGBM relied more on the seasonal features for making its predictions, although the gust remained as one of the most important variables. This can be explained because the gust and Ws are related to the dispersion of NO2 and hence lead to lower concentrations. The year-day was also important for both models since the NO2 concentration has a marked seasonality effect. For instance, its concentration usually decreases during July–August due to a reduction in traffic emissions during the holidays. In comparison, it is normally higher during winter due to meteorological thermal inversions, which are typical during anticyclonic episodes.
In terms of the O3 panels, the temperature and seasonality features are noteworthy: during summer, the high solar irradiation and longer day length increased the O3 concentration. The gust also had intermediate or high importance since it is related to pollution dispersion.
Then, the analysis for PM10 varied from model to model. Nevertheless, the most influential features were not reflected in the model since they are based on external transport.
Notably, even though the location dummy variables appear as less important features, they sum up and the results that were discussed in this section support their use.
Results and Discussion
The models were validated using k-fold cross-validation. Tables 1, 2 summarize the results when using 10-folds (which is common practice) for every combination of pollutant and the type of AQS for both models.
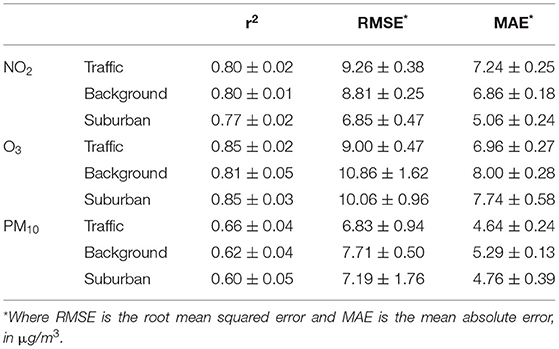
Table 1. The results of the k-fold cross validation for the XGBoost model using 10 folds and displayed as the average value ± standard deviation.
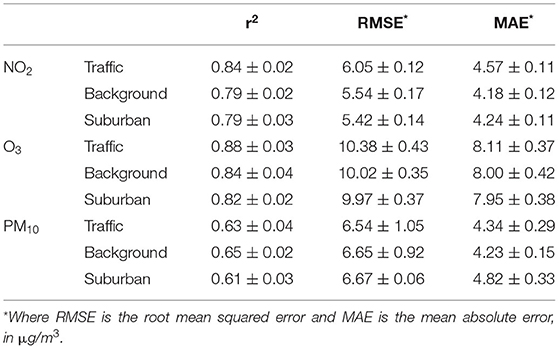
Table 2. The results of the k-fold cross validation for the LightGBM model using 10 folds and displayed as the average value ± standard deviation.
The k-fold cross-validation outputs show that the LightGBM models are slightly more robust. Nevertheless, both models performed well with a high r2 (>0.80 in most cases), low RMSE, and MAE with a very low standard deviation; so, the fittings do not depend on the data. This means that our data were sufficiently representative to be partitioned, without producing noticeable changes in the performance of the models. The PM10 offered the lowest accuracies. This was expected since its concentration did not depend only on emissions within Madrid.
The models that were used (XGBoost and LightGBM) are gradient boosting decision tree-based models and are very complex, highly non-linear, and non-parametric. The obtained results were in line with or better than the results reported by other authors. For instance, Grange and Carslaw (2019) found an r2 of 0.82, and Falocchi et al. (2021) an r2 of 0.86 for NO2 using the RF algorithm. This is a previously developed ML algorithm and is not GBT-based but still gives accurate results. Note that the r2 was calculated in the training sets, where we obtained an r2 > 0.90. However, we prefer to use the k-fold cross-validation as it represents the robustness of the models through different training sets. Furthermore, Gong et al. (2022) obtained an r2 of 0.66 for O3 using MLR and a more variable result for PM2.5. Therefore, they deduced that PM2.5 is less affected by meteorology than O3. In terms of particulates, Grange et al. (2018) obtained an r2 that ranged between 0.54 and 0.71 for PM10, whereas Qu et al. (2020) found an r2 of 0.69 for PM2.5 in the test set using a complex ensemble algorithm. The abovementioned results highlight the performance of more modern GBT algorithms.
In summary, the validation performed increased our confidence in the results of the models that we used for the gaseous pollutants when applied to the 2020 data because of the high accuracies and low standard deviations that were observed.
Figure 7 shows the normalized predicted meteorologically, the observed NO2 true concentration time series for the year 2020, and the traffic AQSs aggregated by weekly averages.
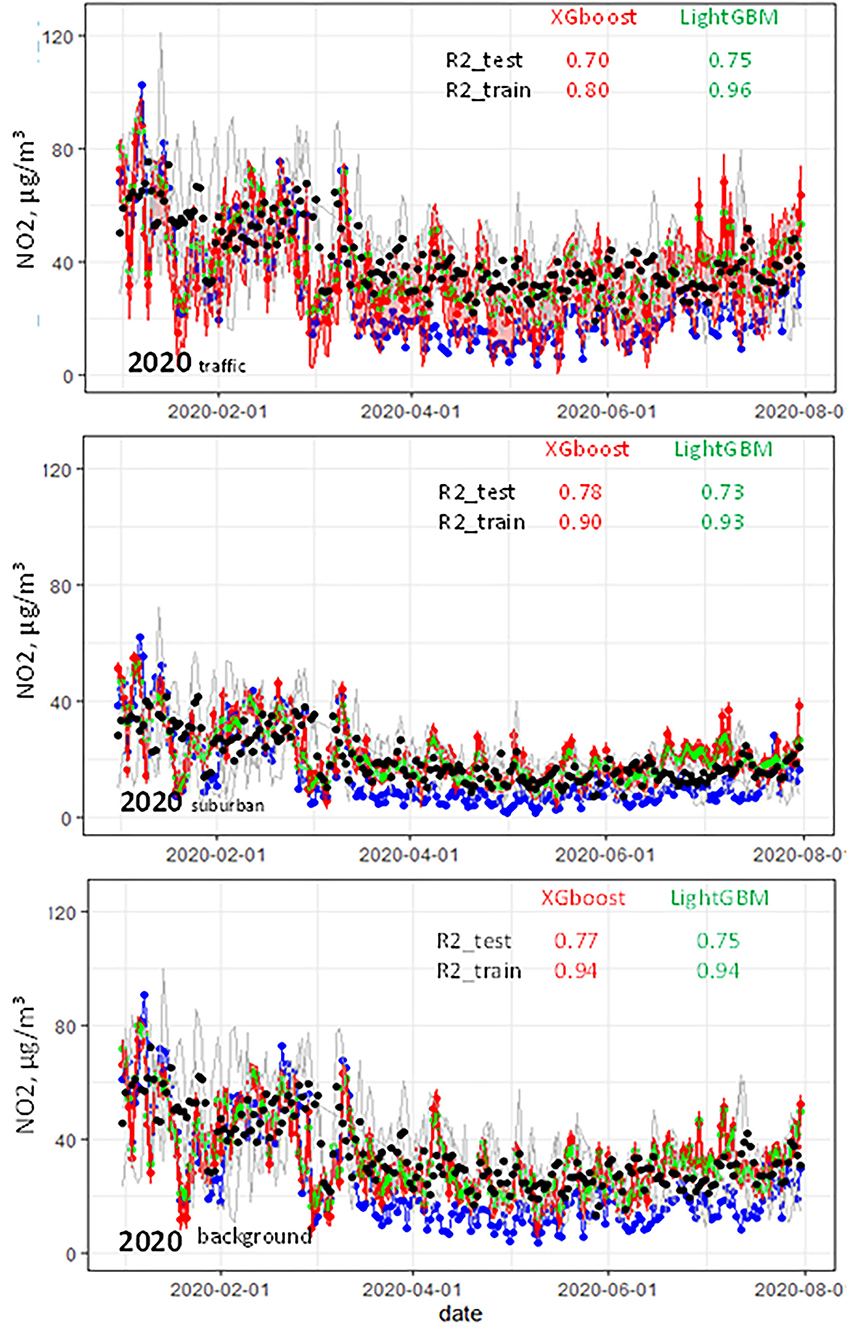
Figure 7. The NO2 time series for the air quality stations (AQSs) in Madrid, aggregated by type, previously and during the COVID lockdown. The LightGBM and XGBoost predictions are shown in green and red, respectively. The AQS observations are shown as the blue line and points. The concentrations over the past 3 years are represented as gray lines, whereas the black points indicate their average. A weekly moving average was used to smooth the data.
In all panels that reflect the type of AQS, from around mid-March, the observed NO2 decreased, more steeply in the traffic stations and less steeply in the suburban stations. This was reflected both in the black points, which represent the true concentrations of the past 3 years, and in the blue points, which represent the observed concentrations in 2020. The predictions of the models were in the same range as the values that were averaged from the past 3 years of concentrations, indicating their reliability. This is consistent with Figures 1–3. In late July, both the predictions and average concentrations remained higher than the 2020 observations. This can be explained by the start of the holiday summer period and the fact that teleworking remained common.
Figure 8 shows the percentage relative difference between the model's estimated NO2 concentrations and the corresponding measurements from the stations, averaged by month. The type of station and the confidence intervals for each bar are indicated. This difference (variable percentage relative difference) was calculated as follows (Equation 2):
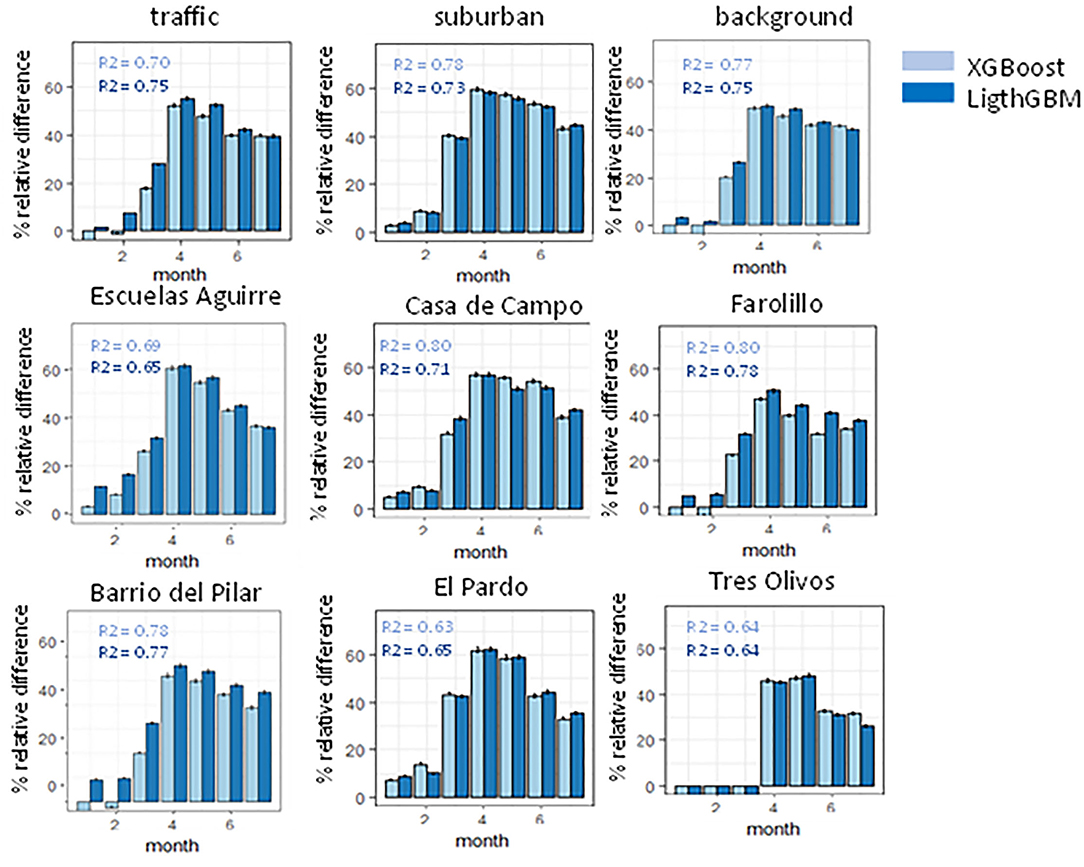
Figure 8. The percentage relative difference between the NO2 concentration estimated by the models and the measurements from the stations, aggregated by month and type of station. The results of applying the pool model for the two selected air quality stations (AQSs) of each type are also indicated.
The calculated confidence intervals were [−8.1, 7.2], [−5.8, 4.7], and [−7.8, 6.7] μg/m3 for the traffic, suburban, and background AQSs for the XGBoost model, and [−1.7, 1.5], [−3.2, 2.6], and [−1.9, 2.0] μg/m3 for the LightGBM model. The LightGBM algorithm offered higher confidence than the XGBoost algorithm in its predictions but achieved a slightly lower r2 in the test set. Looking at Figure 8, both models' predictions were quite similar, following the same trends and showing similar absolute values of NO2 concentrations.
Figure 8 also shows the results of applying the global model to the two individual AQSs of each type.
The upper three panels showed that a close to normal NO2 concentration was estimated by both models from January to February. Those results increased sharply from March when the lockdown was applied, and in some cases, in April, they are above 50–60%. Notably, although the quarantine started on 16 March 2020, this is not the month when the maximum percentage relative difference was obtained. Instead, in April, which was the first complete month of confinement, there were percentage relative differences above 50% and, in some cases, close to 60% (traffic and suburban station types).
For the April–June period, the average percentage relative differences for the traffic, suburban, and background stations were XGBoost model [LightGBM model] 41.2 [41.5], 43.1 [45.0], and 39.0 [40.3], respectively. These results, averaged over the state of alarm period, were similar and in the same order of magnitude as described in the previous studies (Petetin et al., 2020). However, we obtained a slightly higher reduction in the case of the background stations. Additionally, in absolute terms, the reduction was significantly stronger for the traffic stations: −12.7 [−14.1], −8.4 [−8.1], and −11.7 [−12.1] μg/m3, respectively.
July was the first month of the so-called new normal, but the percentage difference values remained very high. The likely explanation is that this period was the holiday period for many citizens, there was a massive exit from Madrid after more than 3 months of confinement, and teleworking continued, where possible, for many companies.
A comparable study was performed for O3 and PM10 pollutants. The results are shown in Supplementary Materials 3–6. In terms of PM10, we found that our models achieved the lowest r2 among the three pollutants studied. This might be attributable to the meteorological variables possessing less explanatory power for this contaminant, which is highly influenced by medium- and long-term transport, instead of the conditions at the time of measurement. For instance, Saharan dust intrusion episodes are frequent in Spain. Nevertheless, we think that the obtained results are accurate enough to be used for evaluating the levels of this pollutant. Supplementary Figure 3 shows the time series for PM10 during January–July 2020, whereas Supplementary Figure 4 shows the percentage difference bar plots. The differences among the predictions from both models and the AQS observed values were difficult to evaluate. This again points to the fact that PM10 was only minimally affected by the emission patterns inside the city and is consistent with the literature, which shows an indistinguishable decrease in this pollutant (Dobson and Semple, 2020; Siciliano et al., 2020).
In January–February 2020, some peaks were in the recoded level of PM10 at the three types of AQSs, likely due to Saharan dust intrusions.
In all cases in the bar plots, there was high variability in the PM10 concentration. Particularly, in April, a clear reduction was observed. However, this was the opposite case for NO2, where all points showed the same trend, whereas, for PM10, it was difficult to determine a trend. Moreover, no conclusions were drawn for the traffic and suburban sites, whereas the background type showed the highest reduction in the PM10 concentrations, higher even than that observed at the traffic stations.
Quantitatively, the percentage relative differences for the traffic, suburban, and background stations were 14.9 [11.1], −12.6 [−5.3], and 19.4 [25.0]%, respectively. The January–July 2020 period for the suburban type showed an increase in PM10, whereas the other pollutants showed a percentage decrease. In absolute values, the results were −3.4 [−2.2], 1.1 [1.8], and −5.2 [−6.2] μg/m3, respectively, with less variation when the differences were assessed.
Supplementary Figure 5 shows the time series for O3 from January to July 2020. There was a monotonically ascending trend for all station types. This was attributed to the increase in the solar irradiance and hence temperatures. Notably, the panel corresponding to the background type clearly showed smaller predictions than the average, potentially indicating a change in the interaction with the VOCs regime.
Supplementary Figure 6 shows a lower than usual O3 concentration during the first 2 months and varies depending on the type of AQS. At the traffic stations, the concentration was approximately the same as the previous 3-year average. However, for the background type, it was clearly higher and remained lower for the suburban type but increased with time. The results for the background type were expected since a reduction in the NO2 would have caused the O3 concentration to increase due to a decrease in the oxidative capacity of the atmosphere. However, the results obtained for the other two types indicate that other mechanisms are affecting the measured O3 concentrations.
Quantitatively, the percentage relative differences for the traffic, suburban, and background stations were −1.5 [−2.8], 3.4 [1.2], and −13.7 [−16.3]%, respectively. In absolute values, the results were 2.6 [4.7], −3.0 [−1.2], and 7.8 [9.5] μg/m3, respectively, showing a considerable increase for the background stations.
Meteorology plays a key role in determining air pollutant concentrations. We have successfully normalized the observed datasets to remove the effect of meteorology and thereby to determine the effect of the decrease in emissions due to the COVID-19 lockdown. The effect on O3 was found to be very complex, and consequently, CTM simulations need to be conducted in more detail to gain insight into the VOCs-O3-NOx regimes. Our findings will support the development of new mitigation measures that will be increasingly needed as climate change intensifies.
Conclusion
The newest gradient boosting ML algorithms were applied to different types of pollution datasets and were trained on the previous 3 years of data, assuming a constant circulating float. Therefore, when applied to predict the NO2 concentrations during the COVID-19 lockdown, they were able to predict the meteorology-normalized results that would have been expected to have occurred if no changes in the circulating park were produced.
These calculated values were directly compared to the real NO2 concentrations, which were measured by the AQS, and the percentage relative differences were assessed. The results showed an abrupt decay in the NO2 emissions from the start of the lockdown that continued in the following months. In some cases, a NO2 concentration in a BAU was predicted that as double the real measured values.
In the case of PM10, the results were difficult to assess due to high variability in the calculated relative percentage aggregated by month and type of station. Only a tentative discussion was conducted in this study because the PM10 levels are probably highly affected by external transport.
For O3, a change of regime was found that depended on the type of AQS being considered. In the case of traffic and suburban stations, it seemed to slightly decrease or to remain constant; whereas for the background stations, it clearly increased. The cause of the trends is likely due to not only the relationship with NO2 but also the VOCs.
Data Availability Statement
Publicly available datasets were analyzed in this study. This data can be found at: Aemet, Madrid City Council.
Author Contributions
All authors listed have made a substantial, direct, and intellectual contribution to the work and approved it for publication. JC was responsible for software, data curation, and writing—original draft preparation. AN for resources and writing—review and editing. RB was responsible for funding acquisition and writing—review and editing.
Funding
This study was carried out within the AIRTEC-CM (urban air quality and climate change integral assessment) scientific program funded by the Directorate General for Research and Innovation of the Greater Madrid Region (S2018/EMT-4329).
Conflict of Interest
The authors declare that the research was conducted in the absence of any commercial or financial relationships that could be construed as a potential conflict of interest.
The handling editor declared a past collaboration with one of the authors RB at time of review.
Publisher's Note
All claims expressed in this article are solely those of the authors and do not necessarily represent those of their affiliated organizations, or those of the publisher, the editors and the reviewers. Any product that may be evaluated in this article, or claim that may be made by its manufacturer, is not guaranteed or endorsed by the publisher.
Acknowledgments
The State Meteorological Agency (AEMET) is acknowledged for providing meteorological observations.
Supplementary Material
The Supplementary Material for this article can be found online at: https://www.frontiersin.org/articles/10.3389/frsc.2022.869000/full#supplementary-material
References
Adhikari, A., and Yin, J. (2020). Short-Term Effects of Ambient Ozone, PM2.5, and Meteorological Factors on COVID-19 Confirmed Cases and Deaths in Queens, New York. Int. J. Environ. Res. Public Health. 17, 4047. doi: 10.3390/ijerph17114047
AEMET [WWW. Document] (2021). Available online at: http://www.aemet.es/es/portada
Anjum, N. (2020). Good in the worst: COVID-19 restrictions and ease in global air pollution. doi: 10.20944/preprints202004.0069.v1
Baldasano, J. M. (2020). COVID-19 lockdown effects on air quality by NO2 in the cities of Barcelona and Madrid (Spain). Sci. Total Environ. 741, 140353. doi: 10.1016/j.scitotenv.2020.140353
Bao, R., and Zhang, A. (2020). Does lockdown reduce air pollution? Evidence from 44 cities in northern China. Sci. Total Environ. 731, 139183. doi: 10.1016/j.scitotenv.2020.139052
Barmpadimos, I., Hueglin, C., Keller, J., Henne, S., and Prevot, A. (2011). Influence of meteorology on PM10 trends and variability in Switzerland from 1991 to 2008. Atmos. Chem. Phys. 11, 1813–1835. doi: 10.5194/acp-11-1813-2011
Carslaw, D., and Taylor, P. (2009). Analysis of air pollution data at a mixed source location using boosted regression trees. Atmos. Environ. 43, 3563–3570. doi: 10.1016/j.atmosenv.2009.04.001
Carslaw, D. C., and Ropkins, K. (2012). openair—An R package for air quality data analysis. Environ. Model. Softw. 27, 52–61. doi: 10.1016/j.envsoft.2011.09.008
Chen, T., and Guestrin, C. (2016). “{XGBoost}: A Scalable Tree Boosting System”, in: Proceedings of the 22nd ACM SIGKDD International Conference on Knowledge Discovery and Data Mining, KDD'16. ACM, New York, NY, USA. pp. 785–794. doi: 10.1145/2939672.2939785
Chu, B., Zhang, S., Liu, J., Ma, Q., and He, H. (2021). Significant concurrent decrease in PM2.5 and NO2 concentrations in China during COVID-19 epidemic. J. Environ. Sci. 99, 346–353. doi: 10.1016/j.jes.2020.06.031
Cole, M. A., Elliott, R. J. R., and Liu, B. (2020). The impact of the Wuhan covid-19 lockdown on air pollution and health: a machine learning and augmented synthetic control approach. Environ. Resour. Econ. 76, 553–580. doi: 10.1007/s10640-020-00483-4
Dávalos, J. Z., Notario, R., Cuevas, C. A., Oliva, J. M., and Saiz-Lopez, A. (2017). Thermochemistry of halogen-containing organic compounds with influence on atmospheric chemistry. Comput. Theor. Chem. 1099, 36–44. doi: 10.1016/j.comptc.2016.11.009
Ding, J., Dai, Q., Li, Y., Han, S., Zhang, Y., and Feng, Y. (2021). Impact of meteorological condition changes on air quality and particulate chemical composition during the COVID-19 lockdown. J. Environ. Sci. 109, 45–56. doi: 10.1016/j.jes.2021.02.022
Directive 2008/50/EC of the European Parliament and of the Council of 21 May 2008 on ambient air quality and cleaner air for Europe (2008). Official Journal of the European Communities.
Dobson, R., and Semple, S. (2020). Changes in outdoor air pollution due to COVID-19 lockdowns differ by pollutant: evidence from Scotland. Occup. Environ. Med. 77, 798–800. doi: 10.1136/oemed-2020-106659
Falocchi, M., Zardi, D., and Giovannini, L. (2021). Meteorological normalization of NO2 concentrations in the Province of Bolzano (Italian Alps). Atmos. Environ. 246, 118048. doi: 10.1016/j.atmosenv.2020.118048
Gong, S., Zhang, L., Liu, C., Lu, S., Pan, W., and Zhang, Y. (2022). Multi-scale analysis of the impacts of meteorology and emissions on PM2.5 and O3 trends at various regions in China from 2013 to 2020 2. Key weather elements and emissions. Sci. Total Environ. 824, 153847. doi: 10.1016/j.scitotenv.2022.153847
Grange, S. K., and Carslaw, D. C. (2019). Using meteorological normalisation to detect interventions in air quality time series. Sci. Total Environ. 653, 578–588. doi: 10.1016/j.scitotenv.2018.10.344
Grange, S. K., Carslaw, D. C., Lewis, A. C., Boleti, E., and Hueglin, C. (2018). Random forest meteorological normalisation models for Swiss PM10 trend analysis. Atmos. Chem. Phys. 18, 6223–6239. doi: 10.5194/acp-18-6223-2018
Henneman, L. R. F., Holmes, H. A., Mulholland, J. A., and Russell, A. G. (2015). Meteorological detrending of primary and secondary pollutant concentrations: method application and evaluation using long-term (2000–2012) data in Atlanta. Atmos. Environ. 119, 201–210. doi: 10.1016/j.atmosenv.2015.08.007
Jung, D., de la Paz, D., Notario, A., and Borge, R. (2022). Analysis of emissions-driven changes in the oxidation capacity of the atmosphere in Europe. Sci. Total Environ. 827, 154126. doi: 10.1016/j.scitotenv.2022.154126
Ke, G., Meng, Q., Finley, T., Wang, T., Chen, W., Ma, W., et al. (2017). “LightGBM: a highly efficient gradient boosting decision tree”, in: Guyon, I., Luxburg, U.V., Bengio, S., Wallach, H., Fergus, R., Vishwanathan, S., and Garnett, R., (Eds.), Advances In Neural Information Processing Systems 30. Neural Information Processing Systems (NIPS), la Jolla, California.
Kerimray, A., Baimatova, N., Ibragimova, O. P., Bukenov, B., Kenessov, B., Plotitsyn, P., et al. (2020). Assessing air quality changes in large cities during COVID-19 lockdowns: the impacts of traffic-free urban conditions in Almaty, Kazakhstan. Sci. Total Environ. 730, 139179. doi: 10.1016/j.scitotenv.2020.139179
Kondo, N., Liane, Y., and Custodio, R. (2020). COVID-19 pandemic: Impacts on the air quality during the partial lockdown in São Paulo state, Brazil. Sci. Total Environ. 730, 139087. doi: 10.1016/j.scitotenv.2020.139087
Le, T., Wang, Y., Liu, L., Yang, J., Yung, Y. L., Li, G., et al. (2020). Unexpected air pollution with marked emission reductions during the COVID-19 outbreak in China. Science 369, 702–706. doi: 10.1126/science.abb7431
Li, L., Li, Q., Huang, L., Wang, Q., Zhu, A., Xu, J., et al. (2020). Air quality changes during the COVID-19 lockdown over the Yangtze River Delta Region: an insight into the impact of human activity pattern changes on air pollution variation. Sci. Total Environ. 732, 139282. doi: 10.1016/j.scitotenv.2020.139282
Liang, X., Li, S., Zhang, S., Huang, H., and Chen, S. X. (2016). PM2.5 data reliability, consistency, and air quality assessment in five Chinese cities. J. Geophys. Res. Atmos. 121, 10 210–220. doi: 10.1002/2016JD024877
Lin, C., Lau, A. K. H., Fung, J. C. H., Song, Y., Li, Y., Tao, M., et al. (2021). Removing the effects of meteorological factors on changes in nitrogen dioxide and ozone concentrations in China from 2013 to 2020. Sci. Total Environ. 793, 148575. doi: 10.1016/j.scitotenv.2021.148575
Liu, H., Yue, F., and Xie, Z. (2022). Quantify the role of anthropogenic emission and meteorology on air pollution using machine learning approach: a case study of PM2.5 during the COVID-19 outbreak in Hubei Province, China. Environ. Pollut. 300, 118932. doi: 10.1016/j.envpol.2022.118932
Madrid City Council (2021). [WWW Document], Available online at: http://www.mambiente.munimadrid.es/
Mahato, S., Pal, S., and Ghosh, K. G. (2020). Effect of lockdown amid COVID-19 pandemic on air quality of the megacity Delhi, India. Sci. Total Environ. 730, 139086. doi: 10.1016/j.scitotenv.2020.139086
Nadzir, M. S. M., Ooi, M. C. G., Alhasa, K. M., Abu Bakar, M. A., Mohtar, A. A. A., Nor, M. F. F. M., et al. (2020). The Impact of Movement Control Order (MCO) during pandemic COVID-19 on local air quality in an urban area of Klang valley, Malaysia. Aerosol Air Qual. Res. 20, 1237–1248. doi: 10.4209/aaqr.2020.04.0163
Petetin, H., Bowdalo, D., Soret, A., Guevara, M., Jorba, O., Serradell, K., et al. (2020). Meteorology-normalized impact of COVID-19 lockdown upon NO2 pollution in Spain. Atmos. Chem. Phys. Discuss. 2020, 1–29. doi: 10.5194/egusphere-egu21-14422
Qu, L., Liu, S., Ma, L., Zhang, Z., Du, J., Zhou, Y., et al. (2020). Evaluating the meteorological normalized PM2.5 trend (2014–2019) in the “2 + 26” region of China using an ensemble learning technique. Environ. Pollut. 266, 115346. doi: 10.1016/j.envpol.2020.115346
Sicard, P., De Marco, A., Agathokleous, E., Feng, Z., Xu, X., Paoletti, E., et al. (2020). Amplified ozone pollution in cities during the COVID-19 lockdown. Sci. Total Environ. 735, 139542. doi: 10.1016/j.scitotenv.2020.139542
Siciliano, B., Carvalho, G., da Silva, C. M., and Arbilla, G. (2020). The impact of COVID-19 partial lockdown on primary pollutant concentrations in the atmosphere of Rio de Janeiro and São Paulo Megacities (Brazil). Bull. Environ. Contam. Toxicol. 105, 2–8. doi: 10.1007/s00128-020-02907-9
Song, Y., Lin, C., Li, Y., Lau, A. K. H., Fung, J. C. H., Lu, X., et al. (2021). An improved decomposition method to differentiate meteorological and anthropogenic effects on air pollution: A national study in China during the COVID-19 lockdown period. Atmos. Environ. 250, 118270. doi: 10.1016/j.atmosenv.2021.118270
Tobias, A., Carnerero, C., Reche, C., Massague, J., Via, M., Cruz Minguillon, M., et al. (2020). Changes in air quality during the lockdown in Barcelona (Spain) one month into the SARS-CoV-2 epidemic. Sci. Total Environ. 726. doi: 10.1016/j.scitotenv.2020.138540
Wang, L., Li, M., Yu, S., Chen, X., Li, Z., Zhang, Y., et al. (2020). Unexpected rise of ozone in urban and rural areas, and sulfur dioxide in rural areas during the coronavirus city lockdown in Hangzhou, China: implications for air quality. Environ. Chem. Lett. 18, 1713–1723. doi: 10.1007/s10311-020-01028-3
Keywords: air quality, COVID lockdown, gradient boosting trees, meteorological normalization, machine learning (ML)
Citation: Cordero JM, Narros A and Borge R (2022) True Reduction in the Air Pollution Levels in the Community of Madrid During the COVID-19 Lockdown. Front. Sustain. Cities 4:869000. doi: 10.3389/frsc.2022.869000
Received: 03 February 2022; Accepted: 04 April 2022;
Published: 18 May 2022.
Edited by:
Sotiris Vardoulakis, Australian National University, AustraliaReviewed by:
Kim Natasha Dirks, The University of Auckland, New ZealandUlas Im, Aarhus University, Denmark
Copyright © 2022 Cordero, Narros and Borge. This is an open-access article distributed under the terms of the Creative Commons Attribution License (CC BY). The use, distribution or reproduction in other forums is permitted, provided the original author(s) and the copyright owner(s) are credited and that the original publication in this journal is cited, in accordance with accepted academic practice. No use, distribution or reproduction is permitted which does not comply with these terms.
*Correspondence: Jose María Cordero, am0uY29yZGVyb0B1cG0uZXM=