 Lauren Johnson1†Perrin Krisko1†
 Maha Malik1†
 Catherine O'Donnell1†Nick Pendleton1†
 Doyeon Ahn1Andrea Bizberg2
 Zoe A. Chafe2Daniel Kim3Sabrina McCormick1Seneca Naidoo2
 Susan C. Anenberg1*
- 1Milken Institute School of Public Health, George Washington University, Washington, DC, United States
- 2C40 Cities Leadership Group, New York, NY, United States
- 3Trachtenberg School of Public Policy and Public Administration, George Washington University, Washington, DC, United States
Many actions to reduce greenhouse gases (GHGs) in cities have benefits for environmental quality, public health, and equity. These local and immediate “co-benefits” can include cleaner air, expanded green space, improved physical activity, and reduced noise. However, progress incorporating co-benefits assessments into climate mitigation planning has been limited. Here, we capitalized on the new availability of climate action plans (CAPs) from dozens of C40 cities to explore the stated role of environmental quality, health, and equity in urban GHG mitigation planning. Specifically, we qualitatively reviewed how four topics—equity, exposure to environmental risk factors, health effects of climate change, and health co-benefits of GHG mitigation—were addressed in CAPs from 27 C40 member cities. The cities span Africa, Asia, Australia, Europe, North America, and South America. We found that more references pertained to exposures (57% of all identified references across the four topics) than to equity (21%), health co-benefits of GHG mitigation (15%), or health effects of climate change (7%). On average across all cities, five exposure categories represented the majority of exposure references: green space (23% of total coded exposure references), disasters (20%), physical activity (24%), heat (16%), and air quality (12%). Approximately two-thirds of health effects and health co-benefits references noted a link with health generally, without specificity to disease or other health outcome. Our results indicate that while environmental quality is commonly considered in CAPs, health effects of climate change and health co-benefits of GHG mitigation are mentioned less frequently. Future work should further develop methods to qualitatively and quantitatively assess health consequences of action and inaction to reduce GHG emissions, using approaches that are appropriate for and accessible to multiple levels of governments.
Introduction
Imbalances between perceived costs and benefits have challenged climate policy. Changes in the climate system resulting from greenhouse gas (GHG) emission reductions are long-term and diffuse, playing out over decades and centuries in the future and across planetary scales; therefore, it can be difficult to identify tangible and observable effects of climate change locally. In contrast, the costs of changing urban, energy, transportation, agricultural, and industrial systems to burn less fossil fuel are considerable and immediate. This spatiotemporal imbalance of the costs and benefits of GHG mitigation actions has contributed to climate policy stagnation. With many local and immediate public development needs, governmental actors at national and urban scales may be reluctant to invest in the deep GHG cuts necessary to address dangerous climate change because the long-term, global benefits are not persuasive enough to counteract the local and immediate expense.
However, this narrow framing of GHG mitigation actions as only addressing climate change ignores several additional impacts, including the vast and varied local and immediate benefits of these actions. Many actions to reduce GHGs also have multiple benefits for environmental quality, public health, and equity. Depending on the approach taken, “co-benefits” of reducing fossil fuel combustion in the urban context may include cleaner air, expanded green space, improved physical activity, and reduced noise, among other societal improvements such as economic savings (Marshall and Toffel, 2005; Scovronick et al., 2019; Karlsson et al., 2020; Negev et al., 2022). For example, mitigation efforts in the transport sector can promote physical activity and improve air quality, contributing to declines in overall mortality (Mueller et al., 2017). Furthermore, advancements in green infrastructure and expanded access to green space not only increases physical activity, but reduces exposure to noise and air pollution (Wolkinger et al., 2018; World Health Organization, 2021). These local and immediate impacts benefit the communities where the GHG-reducing actions are taking place, potentially providing strong additional motivation for mitigating long-term, global climate change. In addition, the economic value of these benefits often outweighs the cost of action (Markandya et al., 2018). Thus, considering the many local and immediate benefits of actions to mitigate GHG emissions can lead to improved decision-making and potentially raise ambition to achieve deeper GHG reductions.
The multiple societal benefits of GHG mitigation are especially important for cities. Urban vulnerability to climate change is high due to dense populations, critical infrastructure, and vulnerable assets and populations (De Sherbinin et al., 2007; Cities: the century of the city, 2010; Dawson, 2011; Hunt and Watkiss, 2011). In addition, cities are responsible for three-quarters of global GHG emissions, are currently home to about half the world's population with expected growth to two-thirds of the population by 2050 (United Nations, 2015), and experience challenges regarding environmental quality and health inequity (World Health Organization UN and Habitat, 2016; World Health Organization, 2010). Of 13,160 urban areas worldwide, only 2% have particulate matter (PM2.5) concentrations lower than the 2021 World Health Organization (WHO) Guidelines for annual average PM2.5 of 5 μg/m3 (Southerland et al., 2022). By reducing GHGs, cities will benefit from avoided climate-related damages as well as improvements in local environments and population health.
Despite a substantial body of academic literature on these multiple benefits since the mid-1990s, progress incorporating co-benefit assessments into climate mitigation planning has been limited (Castillo et al., 2021). As of 2019, only 10% of 184 Nationally Determined Contributions (NDCs) submitted by countries under the Paris Agreement had assessed the health benefits of national climate mitigation policies (WHO Climate Change and Health, Environment, Climate Change and Health, 2019; WHO Environment, Climate Change and Health, 2020). However, the degree to which health co-benefits are considered in national climate action planning may be changing. By October 2021, 14 countries were anticipated to include short-lived climate pollutants, air pollutants that harm both health and climate, into their NDCs (Climate and Clean Air Coalition, 2022). At the urban scale, mayors around the world are committing to aggressive GHG mitigation. Many cities have developed Climate Action Plans (CAPs) to delineate GHG targets and policy pathways, with multiple co-benefits. For example, an assessment of New York City's CAPs reported that the mitigation actions would lead to substantial reductions in air-pollution-related deaths, health-care spending, and health disparities (Climate and Clean Air Coalition, 2022; Johnson et al., 2020).
Several large city networks, including C40 Cities, the Global Covenant of Mayors, and the International Council for Local Environmental Initiatives (ICLEI), serve as fora for advancing collective urban mitigation efforts. As one example of these efforts, C40 Cities is working with city governments to implement the largest international urban climate action planning effort underway, encompassing 97 cities and more than 700 million people globally. C40 encourages, but does not require, member cities to assess environmental and health benefits of CAP actions (C40 Cities, 2020a). Although both the evidence base for assessing multiple benefits of GHG mitigation and the number of cities undertaking CAPs have grown, the degree to which recent CAPs include environmental exposures and health is unknown.
Here we capitalized on newly available CAPs from dozens of C40 cities to explore the role of environmental quality, health, and equity in urban GHG mitigation planning. We specifically assessed the degree to which each city's CAP referenced four environmental topics: exposures to environmental health risks, health effects of climate change, health co-benefits of GHG mitigation, and equity. Plans developed in accordance with the CAP framework are required to meet specific criteria and to contain certain elements. At the same time, cities had independence and flexibility to determine their own mitigation pathways, highlight considerations important to them, and conduct analyses according to their priorities and capabilities. Understanding the ways that this subset of cities considered benefits of GHG mitigation actions for environmental exposures, health, and equity can indicate the degree to which the scientific evidence on co-benefits is entering policy development, and whether cities find the co-benefits justification to be compelling, as is hypothesized in academic literature.
Methods
We reviewed the role of health in publicly-available C40 CAPs through emergent qualitative coding, following a similar process as McCormick et al. (2017) who reviewed the role of science in climate-related lawsuits. The process entailed developing a coding structure to capture exposure and health references in each document and analyzing results. We focused strictly on C40 CAPs for several reasons. First, there is no central database of urban CAPs, making it otherwise challenging to collect plans for a broad, globally representative sample of cities. Second, the C40 CAPs reviewed here followed C40's CAP framework for compatibility with the Paris Agreement. As such, they included consistent elements: commitment to a carbon neutral pathway by 2050; demonstration of how the city will adapt and improve resilience to climate hazards; consideration of the governance and collaborative structures that will be engaged to deliver the city's mitigation targets and adaptation goals; engagement with the community to inform the plan; and detailing of the social, environmental and economic benefits expected from implementing the plan and ways to ensure equitable distribution of these benefits. These consistencies make the CAPs included in this analysis more comparable as documents that serve a common purpose for the municipal government and that contain common elements in addressing how GHG targets can be achieved within the local context.
Importantly for our study, C40 Cities encourages cities to design and plan their climate actions in a way that avoids unintended inequities and that increases access to programs and services for the majority of the population. Ambitious goals and targets should be aligned with local priorities and developed to realize the wider social, environmental, and economic benefits associated with climate action. Thus, the comparable set of C40 CAPs we examined ranged in the degree to which, and how, they addressed the benefits of GHG mitigation pathways for environmental exposures and health.
Inclusion and Exclusion Criteria
We started with all Paris Agreement-compatible CAPs published on C40's website as of August 10, 2021 (N = 42). We then excluded six CAPs that were not available in English by that date, as the keywords that we used to code exposure and health references did not directly translate to other languages. An additional three documents were excluded as they were executive summaries and not complete CAP documents. Therefore, we included 33 CAPs, spanning 27 cities on all six inhabited continents (Africa, Asia, Australia, Europe, North America, South America).
For consistency across CAPs, we only reviewed material published by our cutoff date (August 10, 2021) and did not review any appendices or annexes. To ensure the review was focused on material that was primary to the CAP document, appendices were omitted to avoid coding supplementary material. Furthermore, annexes were left out because they were not consistently included in all member city CAPs. Some cities produced multiple documents (e.g., an overarching CAP and more specific plans pertaining to certain sectors or implementation strategies) which were included as part of their CAP documentation on C40's website. In these cases, reviewers coded each document separately and results for all documents were combined for each city prior to analysis. Cities with multiple documents included Durban (CAP and Learning Journey), London (CAP, CAP Key Findings Report, Implementation Plan, and Compatible Plan), Washington DC (Sustainable DC and Climate Ready DC), and Stockholm (City Plan and Fossil-Fuel Free Strategy). These and other cities likely have additional CAP-relevant documents that are either internal or publicly accessible but not published to C40's website.
As part of a separate project, from 2019 to 2021, C40 staff engaged with local officials and an international team of researchers to help several pilot cities incorporate PM2.5 concentration reductions and associated health benefits into their CAPs. Three cities in our review participated in this pilot program for PM2.5: Accra, Buenos Aires, and Johannesburg. Among those, only for Johannesburg were PM2.5 and associated health benefits described in the CAP main text and therefore included in the present analysis. For Buenos Aires's CAP, the PM2.5 material was in an appendix and so was not included in our review. For Accra's CAP, the version available on our cutoff date did not yet include PM2.5 benefits.
Characteristics of Included Cities and CAPs
While the characteristics of included cities did not affect the coding or analysis, we provide information on total urban population, GHG emissions, and emission reduction targets for context. Urban population estimates are derived from the Worldpop dataset for 2018, which is available at ~1 km resolution globally (Tatem, 2017). We aggregated the gridded data up to urban area boundaries from the Global Human Settlement Model (GHS-SMOD) Urban Center dataset for 2015, the latest year available (Pesaresi et al., 2019). We considered grid cells to be part of an urban cluster if they were located in “urban” and “suburban” areas in the GHS-SMOD dataset, defined as areas with >300 people per km2 that are part of clusters with >5,000 people.
City-wide GHG emissions and corresponding inventory years are from the C40 GHG Emissions Interactive Dashboard (C40 Cities Climate Leadership Group and C40 Knowledge Hub, 2021). The C40 Interactive Dashboard provides access to GHG emissions data reported by C40 cities, compliant with the Global Protocol for Community-scale (GPC) GHG Emission Inventory. We used annual GHG emissions accumulated under the city-induced framework (termed “BASIC” in GPC), which accounts for GHG emissions attributable to activities within the city's geographic boundary (Fong et al., 2021). The BASIC reporting level covers scopes 1 and 2 emissions from stationary energy and transportation sectors, and scopes 1 and 3 emissions from the waste sector. See Figure 2 in Fong et al. (2021) for the complete list of sub-sectors included in the BASIC reporting level. While the population data represent the broader built-up area surrounding urban centers, the GHG emissions data are for each city's administrative boundary, which is often much smaller in area.
We documented the date of publication, number of pages, GHG target by year, and emissions base year information from each CAP. Each CAP document had GHG emission reduction goals, but did not consistently use the same year for targets or emissions base years. While all C40 member cities are expected to aim for carbon neutrality by 2050, policy scenarios explored within CAPs consider both ambition and feasibility. Therefore, many CAPs include “Ambitious” scenarios that do not reach carbon neutrality by 2050. For consistency, if a CAP included emissions estimates for multiple GHG mitigation scenarios [e.g., Business-as-Usual (BAU), Accelerated], we used the most ambitious GHG reduction goal.
Coding Strategy
We used NVivo software to create a coding structure (Table 1), conduct a text search for each CAP, and analyze results. A list of synonyms was developed for each code. When a synonym was added to capture different terminology within a particular CAP, we re-coded the previously completed CAPs using the updated text search criteria. We set the parameter of NVivo's Text Search query to include “stemmed” words to be more comprehensive. However, this process often identified words or phrases that were not relevant, such as “parking” when searching for parks related to green space exposure. To account for incongruent Text Search results, each flagged term was manually reviewed one-by-one; the coder considered the context surrounding each Text Search result to decide whether to code the words or phrases. When the same text was highlighted for different codes due to search criteria similarity, the text was coded in the most closely-related category.
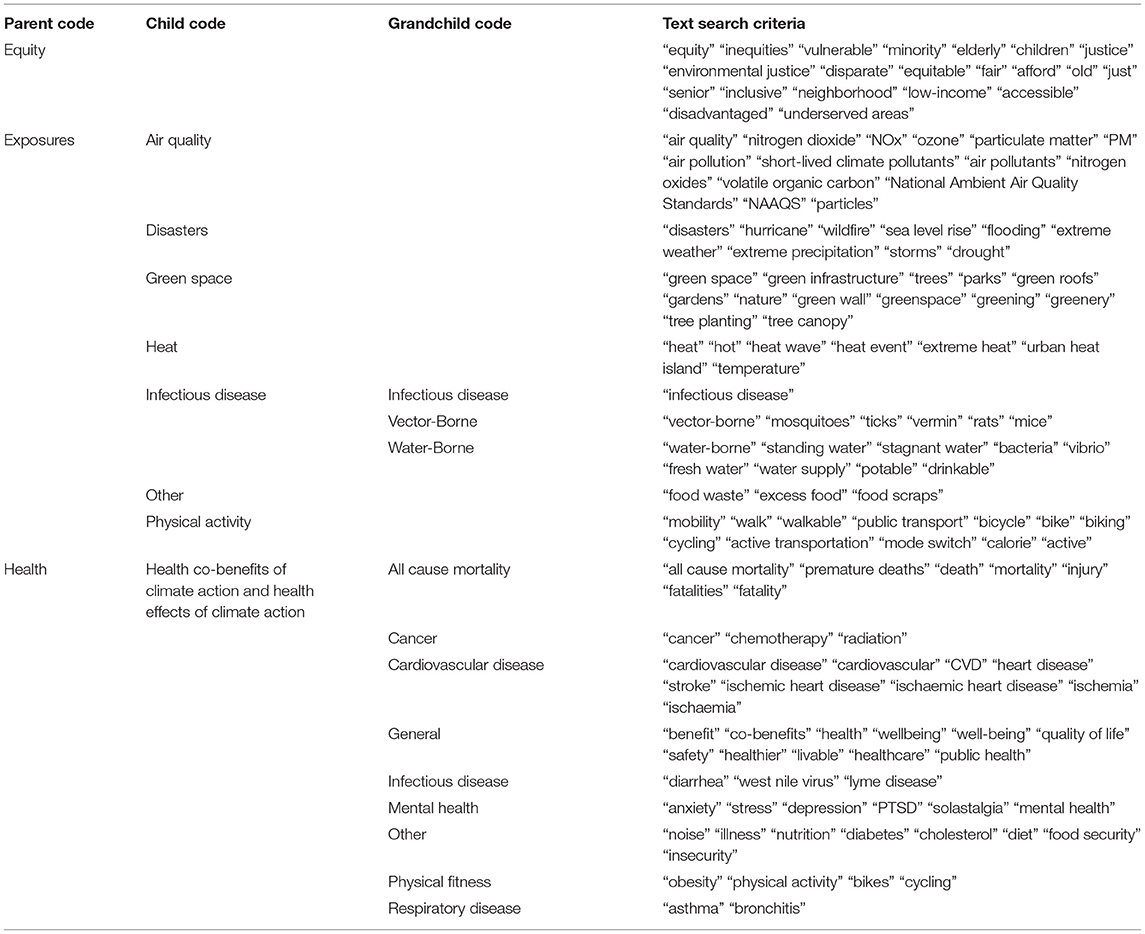
Table 1. Coding structure used as a basis for our qualitative review, including three tiers of codes and associated synonyms for text search criteria.
The five primary authors of this paper completed the qualitative analysis for all CAP documents. Because each CAP document was assigned randomly for independent review by two reviewers, the coding process was subjective. While inter-coder reliability was verified by ensuring that each CAP had at least 90% agreement in NVivo, reviewers had the ability to code any portion of a sentence or paragraph that provided context to the queried word, which could vary considerably based on the reviewer. We did not code indexes, appendices, annexes, or references.
Our coding structure had four main categories: equity, exposures, negative health consequences of climate change (health “effects”), and the ancillary health benefits of GHG mitigation actions (health “co-benefits”). Equity was a broad code used to capture relevant information such as inequity, vulnerable populations, and underserved areas. Codes for exposures included air quality, disasters, green space, heat, infectious disease, and physical activity. Codes for health were all-cause mortality, cancer, cardiovascular disease, general, infectious disease, mental health, physical fitness, and respiratory disease. We used a “general” code to capture broad mentions of health such as “wellbeing,” “quality of life,” and “safety.” We also used an “other” code for both exposures and health to account for potentially relevant information that did not have its own code, such as noise or food security. Health effects and health co-benefits references were evaluated to assess whether the text search result was indicative of the direct effects of climate change on health (e.g., rising temperatures amplifies risk of infectious disease) or of the co-benefits of climate mitigation on human health (e.g., increasing bike lane infrastructure facilitates improvements in physical fitness). Each flagged health effects and health co-benefits reference was manually reviewed and the text was coded in the most closely-related category.
We conducted an initial review of three CAPs (Washington DC, New York, London) to test the coding structure, compare results against hand searches, and modify the search terms to ensure our coding strategy captured all relevant exposure and health references. For the review of all CAPs, each CAP was assigned to two researchers who each independently reviewed the document. We then combined both independently-coded documents into one NVivo file and used the coding comparison query to identify percent agreement between the two coders. If there was 90% or greater agreement in the NVivo coding comparison results between both reviewers, no further discussion was initiated and one of the coded documents was used as the final reference. For instances with <90% agreement between the two reviewers, a third coder adjudicated. A workflow overview of the CAP analysis process is shown in Figure 1.
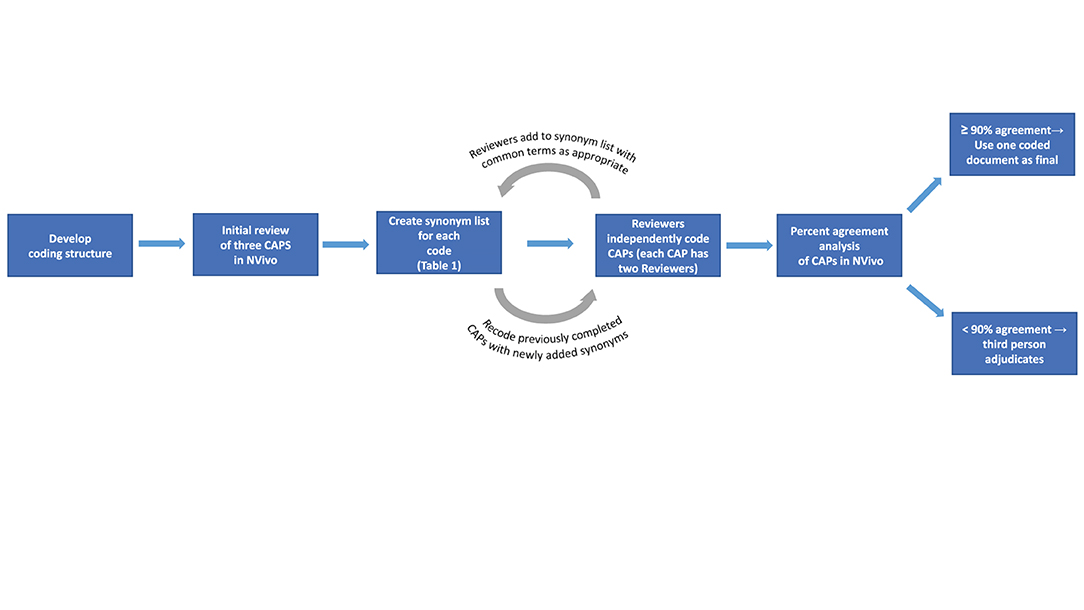
Figure 1. Overview of workflow used to identify references to environmental exposures, equity, health effects, and health co-benefits in urban Climate Action Plans.
Results
Characteristics of the Included Cities and CAPs
We included 27 cities spanning North America (9 cities), Europe (8), Africa (5), South America (2), Asia (2), and Australia [(1); Table 2]. The cities ranged in population size, from 0.7 million people (Oslo) to 23 million people (Seoul). Total urban GHG emissions ranged from 1.1 (Oslo) to 50.1 Million tons of carbon dioxide equivalent (tCO2e; New York City). The year of each city's most recent self-reported inventory spanned 2015–2019.
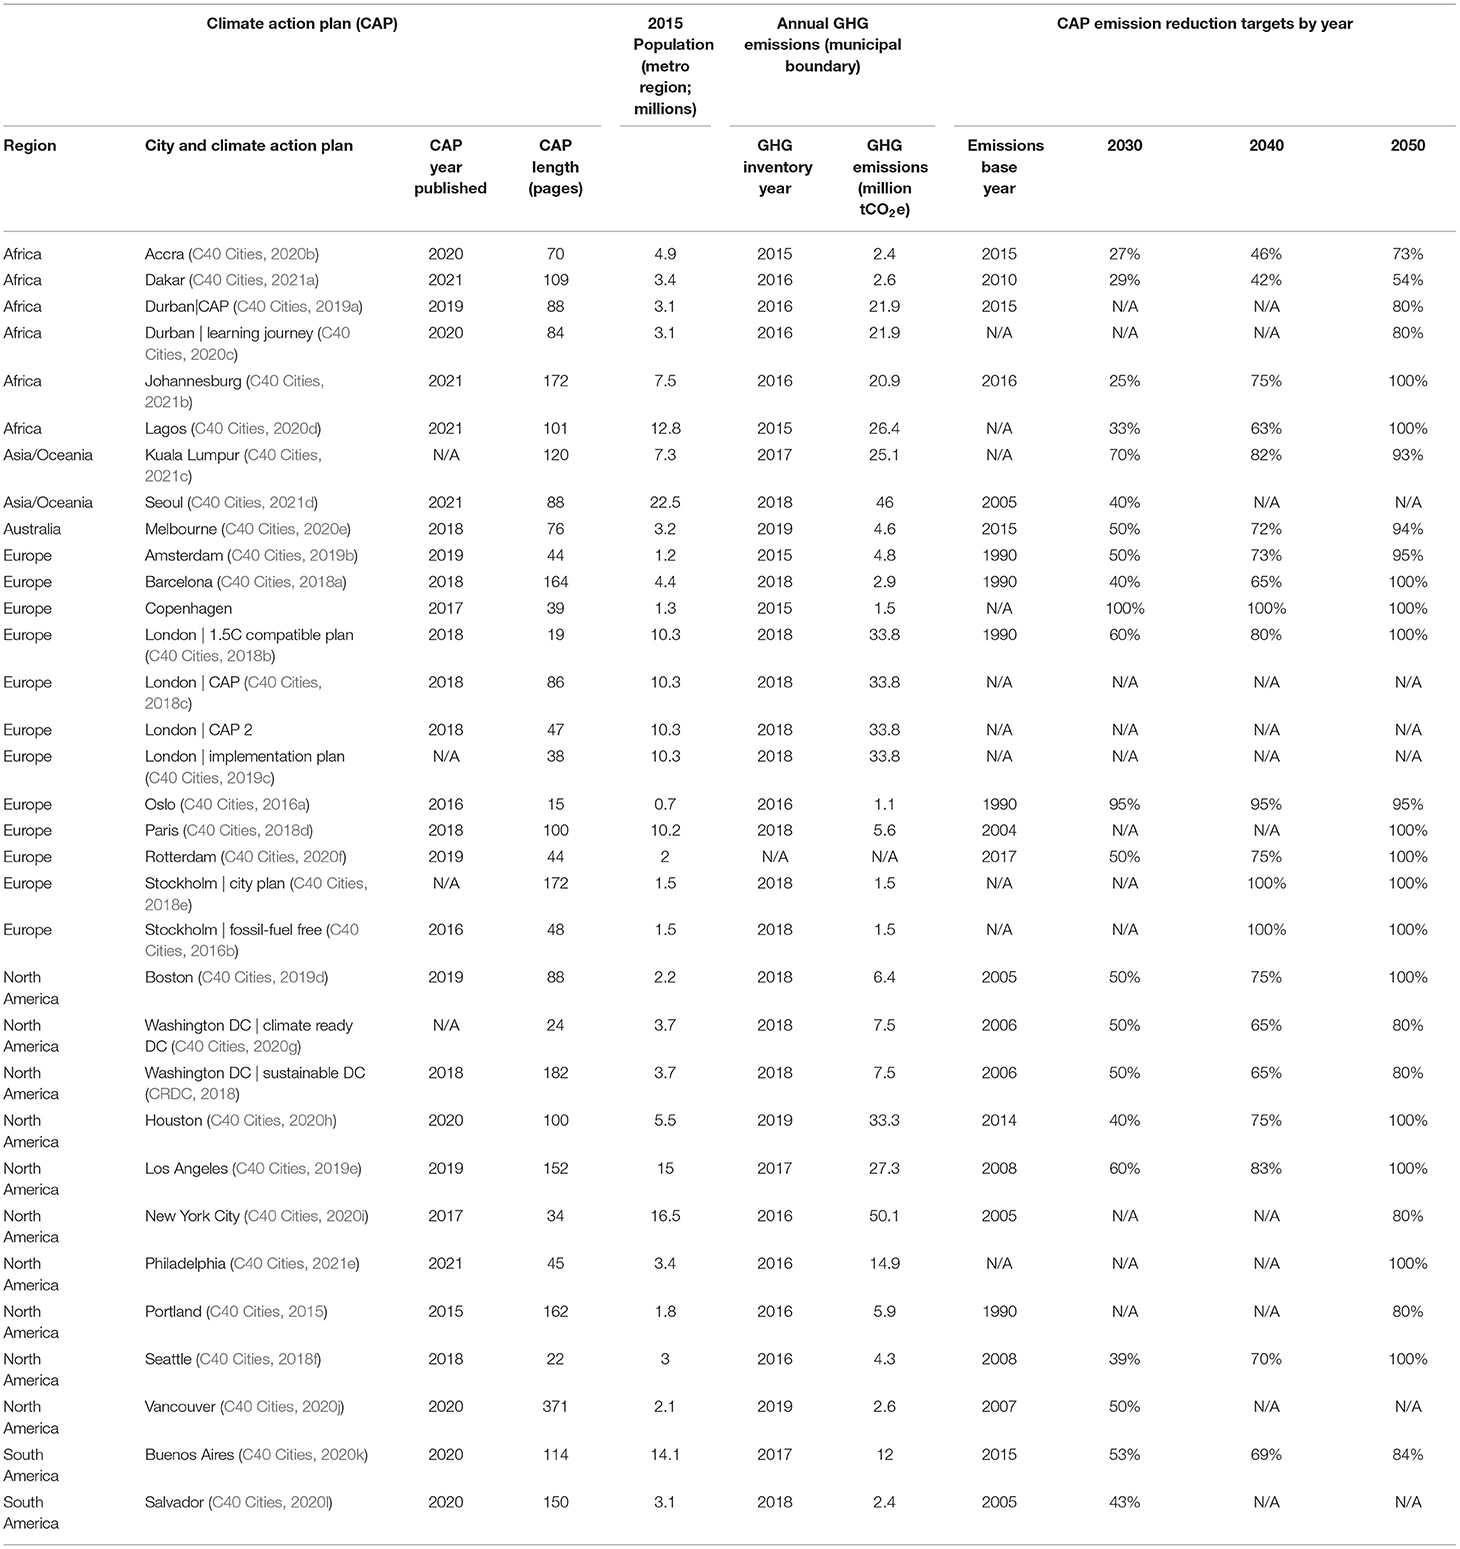
Table 2. Characteristics of each city in our review, including population, total urban GHG emissions for the most recent year of self-reported inventory, the year the CAP was published, and GHG emission reduction targets contained within the CAP.
Over half (World Health Organization UN and Habitat, 2016) of the cities aimed to achieve 100% reduction in carbon emissions by 2050 or earlier within their CAPs. The most ambitious GHG emission reduction goals, in terms of percent reduction and achievement time, were that of Copenhagen (100% by 2030, though the base year for this percent reduction was not reported) and Oslo (95% from 1990 levels by 2030). The least ambitious GHG emission reduction goals in terms of percent reduction were those of Dakar (54% from 2010 levels by 2050) and Accra (73% from 2015 levels by 2050). Those four cities had some of the lowest levels of total GHG emissions among the included cities. Many cities with high GHG emission levels also set ambitious targets. For example, New York City, with the largest overall GHG emission level, has a goal of 80% emission reductions from 2005 levels by 2050. London also has a target of 100% emission reductions from 1990 levels by 2050.
Overall References to Equity, Exposure, and Health
We next report the total number of coded references to equity, environmental exposures, health effects of climate change, and health co-benefits of GHG mitigation actions within each city's CAP (Figure 2A). Despite following a common C40 CAP framework, the number of exposure and health references ranged widely. Of the 27 cities, Washington DC had the largest number of total equity, exposure, and health references (862), followed by Stockholm (772) and Portland (681). The cities with the smallest number of total equity, exposure, and health references were Oslo (Fong et al., 2021), Amsterdam (C40 Cities, 2021a), and Seattle (C40 Cities, 2020c).
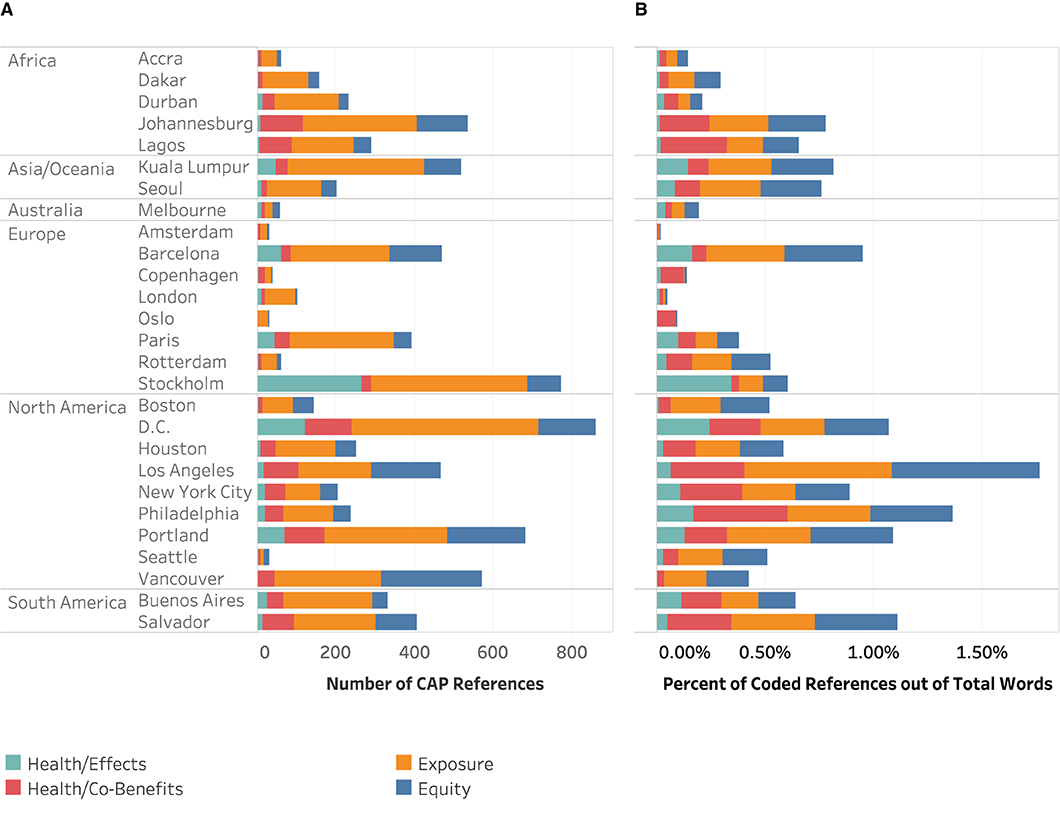
Figure 2. References to equity, exposure, health effects, and health co-benefits in 33 Climate Action Plans from 27 cities in terms of (A) total number of coded references and (B) percentage of coded references out of the total number of words in each CAP document.
The total number of equity, exposure, and health references in each CAP is highly impacted by the length of the CAP, which ranged from 15 (Oslo) to 371 pages (Vancouver). To improve comparability across CAPs, we normalized the results by calculating the percentage of words in the document captured by these codes (Figure 2B). We found that the text referencing the equity, exposure, health effects, and health co-benefits represented, in aggregate, between 0.01 and 1.77% of each CAP. Los Angeles and Philadelphia had the largest percentages, with 1.77 and 1.36% of their CAPs captured by equity, exposure, and health codes, respectively. Salvador, Portland, and Washington DC had only slightly lower percentages, ~1.1% for each city. The cities with the smallest percentages were Amsterdam (0.01%) and London (0.05%).
We examined the percent of total coded references by topic to determine which topics were referenced more frequently than others in each city and whether cities within the same region exhibited similarities in the topics they emphasized in their CAPs (Figure 3). For all cities, exposure was referenced more frequently than other coded categories (57% of total coded references), followed by equity (21%), health co-benefits (15%), and health effects (7%). We did not observe any discernible geographic pattern in coded references, though North American cities consistently included equity in their CAPs. References to exposure dominated the number of overall identified references in most cities; this was particularly notable in cities located in South America, Africa, and Asia (Figure 3).
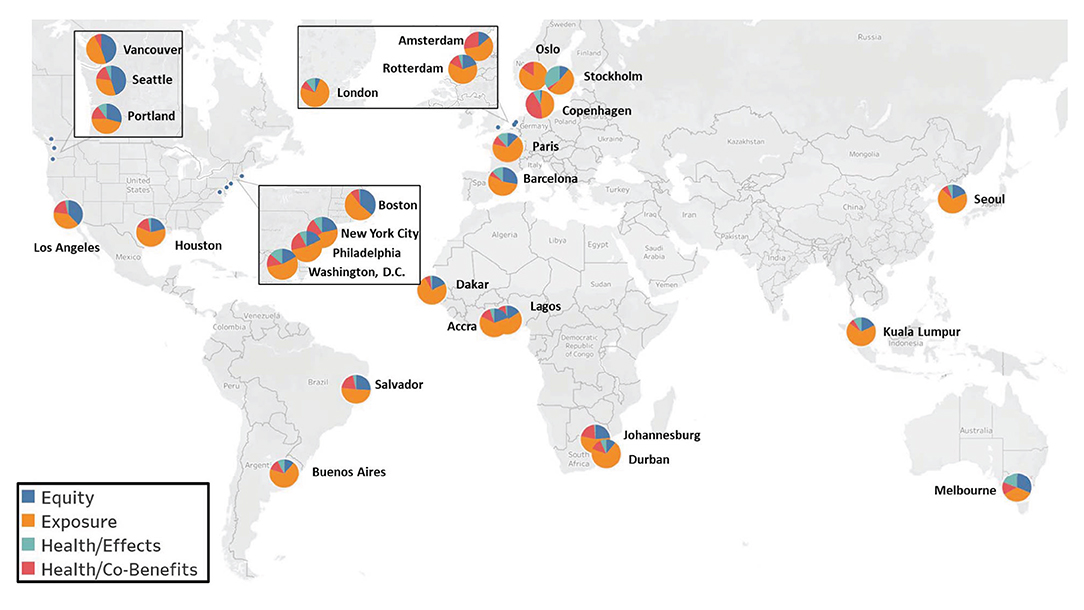
Figure 3. World map of the percentage of identified references related to equity, exposure, health effects, and health co-benefits in 33 CAPs from 27 included cities.
References by Sub-category
We next explored the degree to which each city's CAP(s) referenced individual sub-categories within each exposure, health effects, and health co-benefits category. Nearly all CAPs contained at least one reference to all eight sub-categories. On average across all cities, five exposure categories represented the majority of exposure references: physical activity (24% of total coded exposure references), green space (23%), disasters (20%), heat (16%), and air quality (12%; Figure 4). Water-borne and vector-borne exposures were referenced less frequently, together comprising only 2% of total coded exposure references, with the remaining 3% of exposure references coded as “other.”
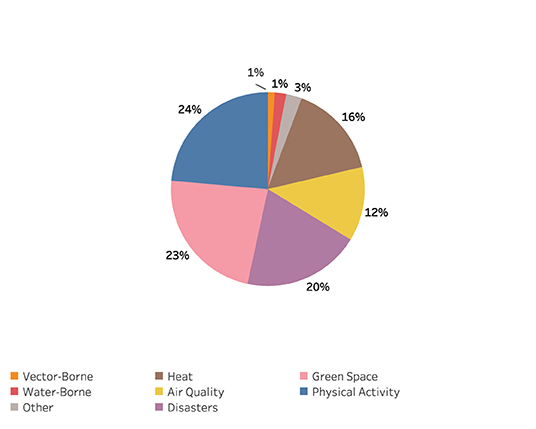
Figure 4. Percent of all exposure references by exposure sub-category from our review of 33 CAPs from all 27 included cities.
Individual cities differed substantially in the exposure sub-categories that were referred to most, with little consistency within each region (Figure 5). A large percentage of exposure references were related to physical activity in Accra, Rotterdam, Vancouver, Oslo, Seattle, Copenhagen, and Amsterdam. Disasters played a significant role in Johannesburg, Lagos, Durban, Melbourne, and Salvador. Stockholm, Washington DC, Houston, Los Angeles, and Melbourne discussed green space frequently. Air quality was referenced frequently in Copenhagen, London, Seattle, Buenos Aires, New York City, Paris, Dakar, and Boston. The cities with the greatest percentages of their exposure references relating to heat were Barcelona, Durban, Seoul, Melbourne, New York City, Philadelphia, and Portland.
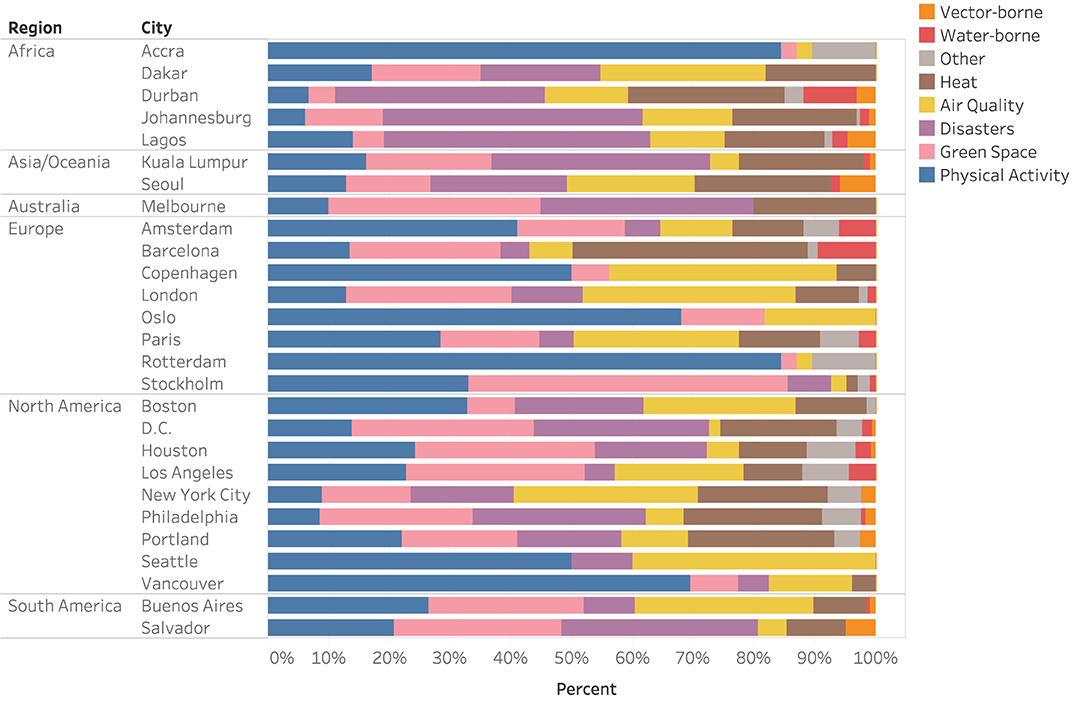
Figure 5. Percent of exposure references by exposure sub-category for each of the 27 included cities.
For health effects and health co-benefits, we found that health was mentioned in three ways: (1) qualitative non-specific indication that an action will have an effect on health (or that a climate risk will have an effect on health); (2) citation of previously published estimate of effects on health; and (3) estimation of the effect of mitigation, adaptation, or climate risk on health. About two-thirds (63% for health effects, 68% for health co-benefits) of references in these categories related to a general description of health, with only one-third of references including some specificity regarding type of health effect (Figure 6).
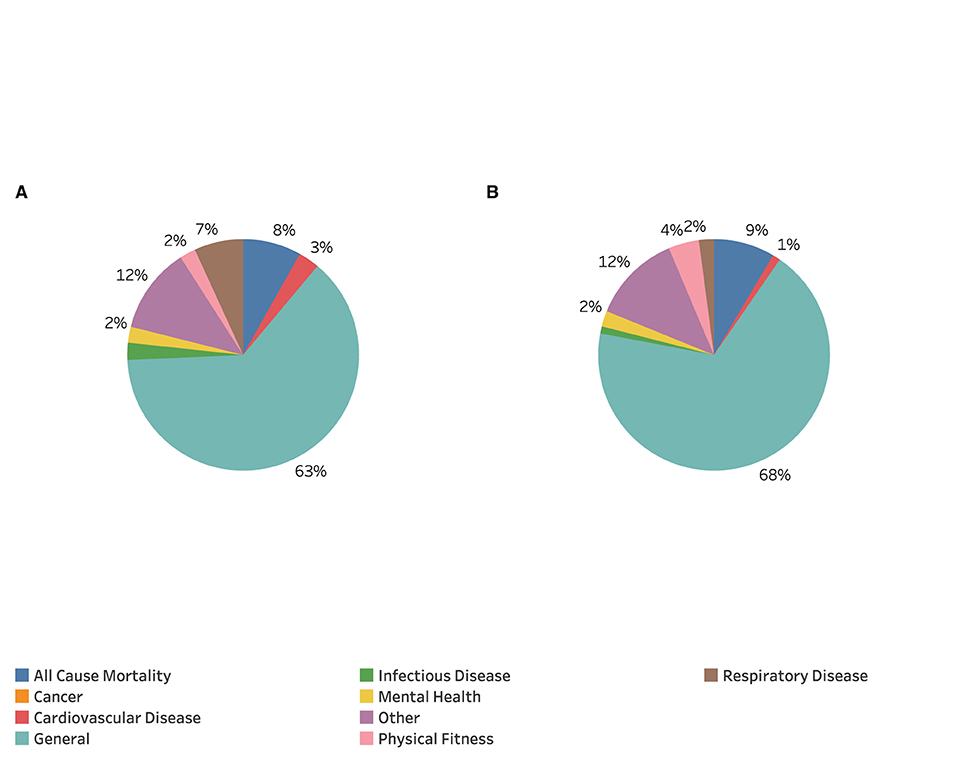
Figure 6. Percent of health references by sub-category across all included cities for (A) health effects of climate change and (B) health co-benefits of GHG mitigation actions.
Among the one-third of specifically defined health effect and health co-benefit coded references, references were ascribed to all-cause mortality (8 and 9% of total coded references for health effects and health co-benefits, respectively), respiratory disease (2 and 7%), physical fitness (2 and 4%), cardiovascular disease (1 and 3%), infectious disease (1 and 3%), and mental health (2% of total coded references for both health effects and health co-benefits). A substantial portion (12 and 13%) of total coded health effect and co-benefits references, respectively, did not fall into any sub-category and were captured in the “other” category. This category contained health endpoints related to noise, nutrition, diabetes, and food security.
Contextual Examples of Qualitative Coding
For additional context beyond the quantitative results described above, we provide representative examples for how exposure, equity, health effects, and health co-benefits were referenced in various CAPs. Within the exposure category, the Dakar CAP provided an example for how “air quality” was coded: “Average annual particulate matter (PM10) concentrations are often high and generally exceed the WHO (20 μg/m3) and the Senegalese standard NS05-062 (40 μg/m3).” The Johannesburg CAP went beyond the commonly used approach of comparing total pollutant levels to WHO guidelines and estimated the pollution reduction that would come from implementing the actions described in the CAP: “The actions included in the existing and planned scenario are projected to reduce the concentrations of PM2.5 generated within the city limits by 31% by 2050.” This quantitative estimation of how GHG mitigation actions would affect air quality in Johannesburg was aided by the pilot program involving C40 staff and international researchers, and was not common across other cities' CAPs. Green space was another exposure category referenced widely among cities. For example, Washington DC's CAP stated that “Sustainable DC 2.0 aims to protect and restore Washington DC's natural environment and to create more opportunities for residents to have better access to high quality green spaces such as trails and parks.” Buenos Aires' CAP similarly noted “Public green spaces have multiple functions and benefits, and are a crucial element in counteracting the impacts of climate change and promoting biodiversity. At the same time, they foster recreation and improve the health of those who live and work in the City.” Other cities that planned to expand green space as part of their CAPs also acknowledged the multiple societal benefits of planting trees and expanding access to parks and other types of green space.
As previously mentioned, many North American cities frequently referenced equity in their CAPs. For example, the Portland CAP stated that “Climate Equity ensures the just distribution of the benefits of climate protection efforts and alleviates unequal burdens created by climate change.” Another example of equity stems from Boston's CAP document, which described how “The social vulnerability analysis identified communities and assets especially at risk from the impacts of climate change, including people of color, low-income people, women, youth, disabled people, people with limited English proficiency and older residents.” Equity was also a significant consideration in Vancouver, where the CAP stated that “Vancouver is striving to respond to the climate crisis with ambitious carbon reduction policies and the equitable implementation of those policies. This requires ensuring that those facing the greatest impacts are deeply represented in program development and also ensuring that the benefits of our climate actions are felt by communities that have been hit hardest by social and economic injustices.” The above quotes are indicative of C40 member cities' interest in reducing the share of unequal climate-related burdens and illustrate the prioritization of equity and protection of vulnerable populations in climate planning.
In terms of health effects of climate change, most references to this topic were coded as “general,” meaning that they mentioned health consequences but did not include a specific health outcome. For example, the Barcelona CAP voiced concerns about health effects of climate change: “What is more, these changes seriously damage our health and affect our quality of life.” Stockholm's CAP reiterated a similar theme, affirming that a “warmer climate also increases the strain on health and the environment.” Melbourne's CAP also acknowledged that climate change is linked with exacerbated health conditions: “A 1.5°C rise in global average temperatures would have a severe impact on communities around the world due to loss of agriculture and sea-level rise. It would impact the health of people in Melbourne by exacerbating the urban heat island effect, increasing hospitalizations from asthma and other illnesses.” These quotations show that many C40 cities recognize the links between climate change and health, despite a general lack of specificity in defining associated health endpoints.
While health co-benefits of GHG mitigation were less frequently referenced compared with environmental exposures and equity on average, health co-benefits were mentioned often in several cities' CAPs, particularly Amsterdam and Copenhagen. For instance, the Amsterdam CAP associated more sustainable modes of transportation and air quality with a broadly characterized improvement to health, saying, “As well as a reduction in carbon dioxide (CO2) emissions, cleaner traffic will also improve the air quality, which is good for our health, will boost the quality of life and make our city a more attractive place in which to live and work.” The Copenhagen CAP coupled reductions in CO2 emissions with co-benefit reductions in noise pollution, stating, “In addition to CO2 reductions, these investments can improve the indoor climate and reduce traffic noise in apartments in Copenhagen.” These co-benefits illustrate the additional value of mitigating greenhouse gas emissions, not only for health, but for improved quality of life, safer commutes, cleaner recreational sites, and the stimulation of new economic opportunities. The range of co-benefits mentioned by member cities offers insight into how climate mitigation efforts can be structured to extend beyond a singular focus on emissions reductions to prioritize environmental quality, health, and equity.
Discussion
We reviewed 33 climate action plans in 27 C40 member cities and found a widely varying degree to which these CAPs referenced four topics: exposure to environmental health risks, equity, health effects of climate change, and health co-benefits of GHG mitigation actions. A majority of coded references related to exposure, followed by equity, health co-benefits, and lastly, health effects of climate action. We found substantial variation in the proportion of each exposure sub-category represented in each CAP, which may represent differing priorities, climates, and exposure sources amongst cities. Most exposure references were related to heat, air quality, disasters, green space, and physical activity. There were fewer references to vector- and water-borne disease which may be due to the many non-climatic drivers of these diseases, including globalization, economic development, sociodemographics, public health systems, and vector and pathogen characteristics. However, many of these drivers are compounded by climate change, which makes them crucial to address in climate action planning.
We did not observe strong patterns of regionality associated with exposure sub-categories that were referenced the most by cities in their CAPs. Even among cities within the same region, reference to exposures was not uniform. This lack of uniformity demonstrates that the climate action planning process, even for cities engaged in international city networks, such as C40 cities, could benefit from standardized criteria and approaches to assess the degree to which climate change could affect local environmental quality. Some similarities within regions were evident, potentially due to common regional characteristics, such as climate, governmental structures, and resources. European cities, for example, demonstrated a greater emphasis on green space/physical activity, whereas African cities focused more on disaster preparedness.
The wide variation between analyzed CAPs within our study indicates that CAPs may serve different purposes for different cities. Some cities might use them as detailed planning documents while others might use them more as public communications tools. While C40 provides some criteria and requirements for member cities to follow, there is no standardized format or purpose for CAPs. In addition, some cities may have more detailed documents to describe GHG mitigation plans that were not available on the C40 website or in English, and therefore not reviewed as part of our study. Resource inequity may also play a role; cities with more resources may have broader access to data and expertise that guide their CAP formation. However, longer CAP documents with more goals and benchmarks are not necessarily more thorough, achievable, or sustainable. Guiding criteria that are relevant and applicable for cities with diverse needs can provide a starting point for cities to use as frameworks for their climate action planning and potentially lead to more common approaches across cities.
In addition, cities could tailor stakeholder engagement to explicitly include discussion of exposure indicators at the earliest possible stages of risk assessment and planning processes (Hunt and Watkiss, 2011). Developing specific institutional responsibilities with regards to coordinated research efforts could more efficiently use funding and resources Cities like London and New York City, which host robust climate risk and adaptation assessments, were able to include insight from stakeholders early in their planning processes, which allowed them to preemptively, sustainably, and efficiently strengthen their assessments. In the future, guidance for cities on engaging health and environmental quality experts and practitioners could enhance the degree to which environmental exposures and health are considered in CAPs.
For health effects and co-benefits, most references in CAP documents considered health generally, with only about one-third of health-focused references relating to specific sub-categories, such as all-cause mortality, respiratory disease, cardiovascular disease, infectious disease, and mental health. Results of this analysis indicate that while environmental quality was commonly considered in CAPs, health effects of climate change and public health co-benefits of GHG mitigation were mentioned less frequently. This finding is consistent with a separate review of progress on and barriers to climate action in cities, which found that many important datasets (e.g., air quality and health) are not utilized or made available to cities (Negev et al., 2022). These datasets could be leveraged to make the case for ambitious action and that climate action efforts should incorporate public health teams (Bloomberg Associates, 2020). While several academic studies, reviews, and reports have concluded that climate mitigation and adaptation in cities are needed to meet national and international climate goals (Hsu et al., 2015, 2019, 2020; Watts, 2017; C40 Cities, 2022), few studies have systematically assessed the extent to which health is included in urban CAPs other than assessing adaptation, mitigation (Reckien et al., 2014; Kim and Grafakos, 2019; Pasimeni et al., 2019; Grafakos et al., 2020), and climate risk (Friel et al., 2011; Hunt and Watkiss, 2011).
Our analysis demonstrates that equity is commonly considered in urban CAPs, at least in this subset of C40 member cities, but could be addressed more quantitatively and holistically, including with a health inequity lens. Health inequality is at the root of many global challenges and equity must be centered in climate action planning to ensure just action for vulnerable populations (Bloomberg Associates, 2020). This may be achieved through intersectoral collaborative action to target the social conditions that cause inequities to persist. Dense populations and extensive resource consumption make cities a particularly important geographical area of focus for GHG mitigation, as climate vulnerability is high and immediate benefits of action would be experienced broadly. Cities are not static or homogeneous, thus health co-benefits and mitigation actions will vary based on the cities' own prioritizations. Furthermore, some cities could experience challenges implementing certain mitigation measures, according to local circumstances, such as urban structure, level of homelessness, and rate of violence and crime.
Our analysis has several limitations. First, publicly available CAPs are commonly just one component of each city's action plan, and it is possible that health was prioritized in documents that were outside the scope of this project. It is also possible that recent CAP updates after our document inclusion cutoff date were not captured in this analysis; GHG reduction targets, for instance, are subject to change over time. We partly addressed this by including multiple documents for individual cities when available (e.g., a general CAP and more detailed sector or policy-specific documents). However, alternate ways in which city governments considered health in their planning processes, including documents not made publicly available, may still have been missed since we included only CAPs published on C40's website. In the case of Buenos Aires, we excluded an air quality appendix which reported PM2.5 and associated health benefits of the GHG policies considered, leading to an undercounting of the number of exposure and health references for that city. Second, CAPs varied widely in page length and level of specificity and detail, indicating that they were likely used for different purposes for each city. For example, some cities may use their CAP as a public communication tool, employing a shorter and more graphical document, while others may use their CAPs as a policy planning tool utilizing a longer and more detailed document. Furthermore, certain CAPs such as Washington DC, Stockholm, Durban, and London were combined, which may limit comparability between cities with only one document. Despite obtaining all documents from the C40 Cities network, when comparing cities that had combined documents to those with one document, it is possible that our inclusion criteria were overly inclusive regarding what constitutes a CAP. Additionally, we limited our analyses to CAPs in English, which excluded a small subset of CAPs published only in other languages. Lastly, the timing of C40's CAP publication process coincided with the Coronavirus disease 2019 (COVID-19) pandemic. Health departments in some cities may not have had the capacity they otherwise would have to devote the personnel or funding necessary to the climate planning process, potentially limiting the inclusion of co-benefits in CAPs.
Strengths of our analysis include the use of a systematic approach to coding and the use of NVivo software, which contributed to a more objective methodology to analyze the role of health across multiple CAPs. Using multiple reviewers strengthened the analysis by allowing comparison between coded items and increasing the robustness of the coding structure. Lastly, our exclusive focus on CAPs within the C40 Cities network is a strength due to the consistent adherence of member cities to C40's CAP framework guidance (C40 Cities, 2020a). The framework offers the optional inclusion of health as one of the relevant co-benefits to GHG mitigation, which implies that C40 member cities may have more uniformity across plans and an increased likelihood to incorporate health as opposed to cities outside the C40 network. Our broad geographical coverage, including cities from all populated continents, was another strength of our analysis.
Conclusion
We found that public health co-benefits are mentioned less frequently than environmental exposures within urban CAPs, suggesting that the full impact chain from emissions to health consequences is not yet fully accounted for in decision-making related to GHG emission reductions in cities worldwide. Including these co-benefits can lead to more ambitious GHG emission reduction targets and more health-protective decisions about the types of actions planned to reduce GHG emissions. Future work should seek to identify barriers to further inclusion of these co-benefits and opportunities for facilitating enhanced connections between climate action planning and environmental and health priorities. Future research could also highlight the many pathways through which GHG mitigation actions would improve public health and ways to advance health equity within this space. Lastly, future research could further develop methods to quantitatively assess co-benefits using approaches that are appropriate for and accessible to multiple levels of governments around the world.
Data Availability Statement
The original contributions presented in the study are included in the article/supplementary material. Further inquiries can be directed to the corresponding author.
Author Contributions
SA conceptualized the project. DK and SM provided methodological guidance. AB, ZC, and SN provided contextual guidance. LJ, PK, MM, CO'D, and NP carried out the analysis and wrote the paper with SA and DA provided data. All authors reviewed and revised the manuscript. All authors contributed to the article and approved the submitted version.
Funding
This research was supported by Wellcome Trust Grant Number 216075/Z/19/Z. We appreciate valuable feedback from Rachel Huxley, Iyad Kheirbek, Gary Kleiman, Ines Lockhart, Patrick Kinney, Julian Marshall, and Chris Tessum, as well as helpful discussions with the broader Climate Action Planning-Air Quality Team supported by that grant.
Conflict of Interest
The authors declare that the research was conducted in the absence of any commercial or financial relationships that could be construed as a potential conflict of interest.
Publisher's Note
All claims expressed in this article are solely those of the authors and do not necessarily represent those of their affiliated organizations, or those of the publisher, the editors and the reviewers. Any product that may be evaluated in this article, or claim that may be made by its manufacturer, is not guaranteed or endorsed by the publisher.
Abbreviations
GHGs, Greenhouse Gases; CAPs, Climate Action Plans; PM2.5, Particulate Matter <2.5 Microns wide; WHO, World Health Organization; NDCs, Nationally Determined Contributions; ICLEI, International Council for Local Environmental Initiatives; GHS-SMOD, Global Human Settlement Model; GPC, Global Protocol for Community-scale; WRI, World Resources Institute; BAU, Business-as-Usual; tCO2e, Tons of Carbon Dioxide Equivalent; PM10, Particulate Matter <10 Microns wide; CO2, Carbon Dioxide; COVID-19, Coronavirus 2019.
References
Bloomberg Associates (2020). Accelerating Climate Action in Cities - Research Findings and Recommendations. Available online at: https://assets.bbhub.io/dotorg/sites/38/2021/06/Accelerating-Climate-Action-in-Cities.pdf (accessed November 19, 2021).
C40 Cities (2015). Portland Climate Action Plan. C40 Cities; 205AD. Available online at: https://cdn.locomotive.works/sites/5ab410c8a2f42204838f797e/content_entry5ab410faa2f42204838f7990/5ad0e40c74c4837def5d292e/files/CAP-2015_june30-2015_web.pdf?1565172676 (accessed January 13, 2021).
C40 Cities (2016a). Climate and Energy Strategy for Oslo. C40 Cities. Available online at: https://cdn.locomotive.works/sites/5ab410c8a2f42204838f797e/content_entry5c8ab5851647e100801756a3/5f522fb4484d5f00ac743e62/files/Climate_and_Energy_Strategy_for_Oslo.pdf?1599221695 (accessed January 13, 2021).
C40 Cities (2016b). Strategy for a Fossil-Fuel Free Stockholm by 2040. C40 Cities. Available online at: https://international.stockholm.se/globalassets/rapporter/strategy-for-a-fossil-fuel-free-stockholm-by-2040.pdf (accessed August 11, 2021).
C40 Cities (2018a). Barcelona Climate Plan 2018-2030. C40 Cities. Available online at: https://cdn.locomotive.works/sites/5ab410c8a2f42204838f797e/content_entry5c8ab5851647e100801756a3/5c8bf1b11647e10080175cb2/files/Bcn_Climate_Plan.pdf?1552675647 (accessed January 13, 2021).
C40 Cities (2018b). Zero Carbon London: A 1.5oC Compatible Plan. C40 Cities. Available online at: https://www.london.gov.uk/sites/default/files/1.5_action_plan_amended.pdf (accessed January 13, 2021).
C40 Cities (2018c). London Environment Strategy. C40 Cities. Available online at: https://www.london.gov.uk/what-we-do/environment/london-environment-strategy (accessed January 13, 2021).
C40 Cities (2018d). Paris Climate Action Plan Towards a Carbon Neutral City and 100% Renewable Energies. C40 Cities. Available online at: https://cdn.locomotive.works/sites/5ab410c8a2f42204838f797e/content_entry5ae2f905a2f4220ae645f026/5af7316614ad660b652531de/files/Paris_-_Paris_Climate_Action_Plan.pdf?1526890697 (accessed January 13, 2021).
C40 Cities (2018e). Stockholm City Plan. C40 Cities. Available online at: https://vaxer.stockholm/globalassets/tema/oversiktplan-ny_light/english_stockholm_city_plan.pdf (accessed August 11, 2021).
C40 Cities (2018f). Seattle Climate Action. C40 Cities. Available online at: https://cdn.locomotive.works/sites/5ab410c8a2f42204838f797e/content_entry5ab410faa2f42204838f7990/5b7542c3747820049bbe9b12/files/Seattle_CAP.pdf?1608043110 (accessed January 13, 2021).
C40 Cities (2019a). Durban Climate Action Plan 2019. C40 Cities. Available online at: https://cdn.locomotive.works/sites/5ab410c8a2f42204838f797e/content_entry5c8ab5851647e100801756a3/5e5e3f71469c8b00a735fbac/files/Climate_Action_Plan_web.pdf?1583234929 (accessed January 13, 2021).
C40 Cities (2019b). Amsterdam Climate Neutral 2050 Roadmap. C40 Cities. Available online at: https://cdn.locomotive.works/sites/5ab410c8a2f42204838f797e/content_entry5ab410faa2f42204838f7990/5f770c395322e900acafe90a/files/Amsterdam-Climate-Neutral-2050-Roadmap_12072019-1.pdf?1601639604 (accessed January 13, 2021).
C40 Cities (2019c). London Environment Strategy Implementation Plan. C40 Cities. Available online at: https://www.london.gov.uk/sites/default/files/implementation_plan.pdf (accessed January 13, 2021).
C40 Cities (2019d). City of Boston Climate Action Plan - 2019 Update. C40 Cities. Available online at: https://cdn.locomotive.works/sites/5ab410c8a2f42204838f797e/content_entry5ab410faa2f42204838f7990/5ad0b48674c4837def5d280c/files/Boston_CAP.pdf?1608041968 (accessed January 13, 2021).
C40 Cities (2019e). LA's Green New Deal. C40 Cities. Available online at: https://cdn.locomotive.works/sites/5ab410c8a2f42204838f797e/content_entry5ab410faa2f42204838f7990/5ab563eda2f4220acf45cff6/files/pLAn_2019_final.pdf?1558628720 (accessed January 13, 2021).
C40 Cities (2020a). Climate Action Planning Framework. C40 Cities. Available online at: https://cdn.locomotive.works/sites/5ab410c8a2f42204838f797e/pages/5ae2f92374c4837e195d0e00/files/20200324_C40_Climate_Action_Planning_Framework.pdf?1620380307 (accessed August 8, 2021)
C40 Cities (2020b). Accra Climate Action Plan - First Five-Year Plan (2020-2025). Available online at: https://cdn.locomotive.works/sites/5ab410c8a2f42204838f797e/content_entry5ab410faa2f42204838f7990/5ab5605ea2f4220acf45cfa6/files/Accra_Climate_Action_Plan.pdf?1603293785 (accessed January 12, 2021).
C40 Cities (2020c). Learning Journey Durban Climate Action Plan. Available online at: https://cdn.locomotive.works/sites/5ab410c8a2f42204838f797e/content_entry5c8ab5851647e100801756a3/5e5e3fd41b7bc200a71104a4/files/CAP_Learning_Journey.pdf?1583235028 (accessed January 13, 2021).
C40 Cities (2020d). Lagos Climate Action Plan Second Five Year Plan 2020 – 2025. C40 Cities. Available online at: https://cdn.locomotive.works/sites/5ab410c8a2f42204838f797e/content_entry5ab410faa2f42204838f7990/5ad0ab8e74c4837def5d27aa/files/C40_Lagos_Final_CAP.pdf?1626096978 (accessed August 11, 2021).
C40 Cities (2020e). Climate Change Mitigation Strategy to 2050 Melbourne Together for 1.5°C. C40 Cities. Available online at: https://cdn.locomotive.works/sites/5ab410c8a2f42204838f797e/content_entry5c8ab5851647e100801756a3/5c90d1436f5771007fddb296/files/climate-change-mitigation-strategy-2050.pdf?1557769876 (accessed January 13, 2021).
C40 Cities (2020f). Rotterdam Climate Action Plan. C40 Cities. Available online at: https://cdn.locomotive.works/sites/5ab410c8a2f42204838f797e/content_entry5ab410faa2f42204838f7990/5be174d6337f770010c1b69f/files/1.2.2_Rotterdam_Climate_Agreement_ENG.pdf?1601637912 (accessed January 13, 2021).
C40 Cities (2020g). Climate Ready DC. C40 Cities. Available online at: https://doee.dc.gov/sites/default/files/dc/sites/ddoe/service_content/attachments/CRDC-Report-FINAL-Web.pdf (accessed January 13, 2021).
C40 Cities (2020h). Houston Climate Action Plan. Available online at: https://cdn.locomotive.works/sites/5ab410c8a2f42204838f797e/content_entry5ab410faa2f42204838f7990/5b7e8c5a747820740c10f16c/files/Houston_CAP.pdf?1608042929 (accessed January 13, 2021).
C40 Cities (2020i). New York Inclusive Climate Action - In Practice. C40 Cities. Available online at: https://cdn.locomotive.works/sites/5ab410c8a2f42204838f797e/content_entry5c8ab5851647e100801756a3/5c8bf017c111dc00800cb04c/files/New_York_City_tackles_the_urban_heat_island_effect_in_its_most_vulnerable_communities.pdf?1552674839 (accessed January 13, 2021).
C40 Cities (2020j). City of Vancouver. C40 Cities. Available online at: https://cdn.locomotive.works/sites/5ab410c8a2f42204838f797e/content_entry5ab410faa2f42204838f7990/5ad0e45174c4837def5d2933/files/Vancouver_Climate_Action_Plan.pdf?1605709096 (accessed January 13, 2021).
C40 Cities (2020k). Climate Action Plan 2050 City of Buenos Aires. C40 Cities. Available online at: https://cdn.locomotive.works/sites/5ab410c8a2f42204838f797e/content_entry5c8ab5851647e100801756a3/60be2db4e5a4f200a691392e/files/PAC_2050_-_ENGLISH_.pdf?1623076753 (accessed August 11, 2021).
C40 Cities (2020l). Salvador Climate Action Plan. C40 Cities. Available online at: https://cdn.locomotive.works/sites/5ab410c8a2f42204838f797e/content_entry5c8ab5851647e100801756a3/60abe3e2795a8b00a674dd75/files/PMAMC_Ebook_ingles.pdf?1621877739 (accessed May 18, 2021).
C40 Cities (2021a). Territorial Climate Energy Plan of Dakar 2021-2025. C40 Cities. Available online at: https://cdn.locomotive.works/sites/5ab410c8a2f42204838f797e/content_entry5c8ab5851647e100801756a3/60dadeb05761d600a57c9345/files/C40_Dakar_English_Final.pdf?1624956592 (accessed August 11, 2021).
C40 Cities (2021b). City of Johannesburg Climate Action Plan. C40 Cities. Available online at: https://cdn.locomotive.works/sites/5ab410c8a2f42204838f797e/content_entry5ab410faa2f42204838f7990/5ab5614aa2f4220acf45cfb8/files/City_of_Johannesburg_-_CAP-lores-compressed.pdf?1623066563 (accessed August 11, 2021).
C40 Cities (2021c). Kuala Lumpur Climate Action Plan 2050. C40 Cities. Available online at: https://cdn.locomotive.works/sites/5ab410c8a2f42204838f797e/content_entry5ab410faa2f42204838f7990/5b4e04e374782004ac0c8ac2/files/C40_KLCAP2050_viewing-only-MR-single.pdf?1626096224 (accessed August 11, 2021).
C40 Cities (2021d). 2050 Seoul Climate Action Plan. C40 Cities. Available online at: https://cdn.locomotive.works/sites/5ab410c8a2f42204838f797e/content_entry5ab410faa2f42204838f7990/5b7fef43747820740c10fabd/files/2050_Seoul_Climate_Action_Plan_v1.pdf?1628511828 (accessed August 11, 2021).
C40 Cities (2021e). Philadelphia Climate Action Playbook. C40 Cities. Available online at: https://cdn.locomotive.works/sites/5ab410c8a2f42204838f797e/content_entry5c8ab5851647e100801756a3/60c07e29a1a32b00a676ab1f/files/Philadelphia-Climate-Action-Playbook.pdf?1623227945 (accessed August 11, 2021).
C40 Cities (2022) Latest Research. C40 Cities. Available online at: https://www.c40.org/research (accessed February 01, 2022).
C40 Cities Climate Leadership Group C40 Knowledge Hub (2021). Greenhouse Gas Emissions Interactive Dashboard. C40 Cities Climate Leadership Group, C40 Knowledge Hub. Available online at: https://www.c40knowledgehub.org/s/article/C40-cities-greenhouse-gas-emissions-interactive-dashboard?language=en_US (accessed September 17, 2021).
Castillo, M., Anenberg, S., Chafe, Z., Huxley, R., Johnson, L., Kheirbek, I., et al. (2021). Quantifying the health benefits of urban climate mitigation actions: current state of the epidemiological evidence and application in health impact assessments. Front. Sust. Cities. 3, 768227. doi: 10.3389/frsc.2021.768227
Climate Clean Air Coalition (2022). Increasing Ambition of NDCs. Climate and Clean Air Coalition. Available online at: https://www.ccacoalition.org/en/content/increasing-ambition-ndcs (accessed March 3, 2022).
CRDC (2018). DC Climate Adaptation Plan. Available online at: https://doee.dc.gov/sites/default/files/dc/sites/ddoe/service_content/attachments/CRDC-Report-FINAL-Web.pdf (accessed January 13, 2021).
Dawson, R. J. (2011). Potential pitfalls on the transition to more sustainable cities and how they might be avoided. Carbon Manag. 2, 175–188. doi: 10.4155/cmt.11.8
De Sherbinin, A., Schiller, A., and Pulsipher, A. (2007). The vulnerability of global cities to climate hazards. Environ. Urbaniz. 19, 39–64. doi: 10.1177/0956247807076725
Fong, W. K., Sotos, M., Doust, M., Schultz, S., Marques, A., Deng-Beck, C., et al. (2021). Global Protocol for Community-Scale Greenhouse Gas Inventories. Available online at: https://ghgprotocol.org/sites/default/files/standards/GPC_Full_MASTER_RW_v7.pdf (accessed September 15, 2021).
Friel, S., Hancock, T., Kjellstrom, T., McGranahan, G., Monge, P., and Roy, J. (2011). Urban health inequities and the added pressure of climate change: an action-oriented research Agenda. J. Urban Health. 88, 886–895. doi: 10.1007/s11524-011-9607-0
Grafakos, S., Viero, G., Reckien, D., Trigg, K., Viguie, V., Sudmant, A., et al. (2020). Integration of mitigation and adaptation in urban climate change action plans in Europe: a systematic assessment. Renew. Sustain. Energy Rev. 121, 109623. doi: 10.1016/j.rser.2019.109623
Hsu, A., Höhne, N., Kuramochi, T., Roelfsema, M., Weinfurter, A., Xie, Y., et al. (2019). A research roadmap for quantifying non-state and subnational climate mitigation action. Nature Clim. Change. 9, 11–17. doi: 10.1038/s41558-018-0338-z
Hsu, A., Moffat, A. S., Weinfurter, A. J., and Schwartz, J. D. (2015). Towards a new climate diplomacy. Nature Clim. Change. 5, 501–503. doi: 10.1038/nclimate2594
Hsu, A., Tan, J., Ng, Y. M., Toh, W., Vanda, R., and Goyal, N. (2020). Performance determinants show European cities are delivering on climate mitigation. Nature Clim. Change. 10, 1015–1022. doi: 10.1038/s41558-020-0879-9
Hunt, A., and Watkiss, P. (2011). Climate change impacts and adaptation in cities: a review of the literature. Clim. Change. 104, 13–49. doi: 10.1007/s10584-010-9975-6
Johnson, S., Haney, J., Cairone, L., Huskey, C., and Kheirbek, I. (2020). Assessing air quality and public health benefits of New York city's climate action plans. Environ. Sci. Technol. 54, 9804–9813. doi: 10.1021/acs.est.0c00694
Karlsson, M., Alfredsson, E., and Westling, N. (2020). Climate policy co-benefits: a review. Clim. Policy. 20, 292–316. doi: 10.1080/14693062.2020.1724070
Kim, H., and Grafakos, S. (2019). Which are the factors influencing the integration of mitigation and adaptation in climate change plans in Latin American cities? Environ. Res. Lett. 14, 105008. doi: 10.1088/1748-9326/ab2f4c
Markandya, A., Sampedro, J., Smith, S. J., Van Dingenen, R., Pizarro-Irizar, C., Arto, I., et al. (2018). Health co-benefits from air pollution and mitigation costs of the Paris Agreement: a modeling study. Lancet Planetary Health. 2, e126–e133. doi: 10.1016/S2542-5196(18)30029-9
Marshall, J. D., and Toffel, M. W. (2005). Framing the elusive concept of sustainability: a sustainability hierarchy. Environ. Sci. Technol. 39, 673–682. doi: 10.1021/es040394k
McCormick, S., Simmens, S. J., Glicksman, R. L., Paddock, L., Kim, D., Whited, B., et al. (2017). Science in litigation, the third branch of U.S. climate policy. Science. 357, 979–980. doi: 10.1126/science.aao0412
Mueller, N., Rojas-Rueda, D., Basagana, X., Cirach, M., and Cole-Hunter, T. (2017). Urban and transport planning related exposure and mortality a health impact assessment for cities. Environ. Health Perspect. 125, 89–96. doi: 10.1289/EHP220
Negev, M., Zea-Reyes, L., Caputo, L., Weinmayr, G., Potter, C., and de Nazelle, A. (2022). Barriers and enablers for integrating public health cobenefits in urban climate policy. Annu. Rev. Public Health. 43, annurev-publhealth-052020-010820. doi: 10.1146/annurev-publhealth-052020-010820
Pasimeni, M. R., Valente, D., Zurlini, G., and Petrosillo, I. (2019). The interplay between urban mitigation and adaptation strategies to face climate change in two European countries. Environ. Sci. Policy. 95, 20–27. doi: 10.1016/j.envsci.2019.02.002
Pesaresi, M., Florczyk, A., Schiavina, M., Melchiorri, M., and Maffenini, L. (2019). GHS-SMOD R2019A - GHS Settlement Layers, Updated and Refined REGIO Model 2014 in Application to GHS-BUILT R2018A and GHS-POP R2019A, Multitemporal (1975-1990-2000-2015). European Commission, Joint Research Centre (JRC). doi: 10.2905/42E8BE89-54FF-464E-BE7B-BF9E64DA5218
Reckien, D., Flacke, J., Dawson, R. J., Heidrich, O., Olazabal, M., Foley, A., et al. (2014). Climate change response in Europe: what's the reality? Analysis of adaptation and mitigation plans from 200 urban areas in 11 countries. Clim. Change. 122, 331–40. doi: 10.1007/s10584-013-0989-8
Scovronick, N., Budolfson, M., Dennig, F., Errickson, F., Fleurbaey, M., Peng, W., et al. (2019). The impact of human health co-benefits on evaluations of global climate policy. Nat. Commun. 10, 2095. doi: 10.1038/s41467-019-09499-x
Southerland, V. A., Brauer, M., Mohegh, A., Hammer, M. S., van Donkelaar, A., Martin, R. V., et al. (2022). Global urban temporal trends in fine particulate matter (PM2·5) and attributable health burdens: estimates from global datasets. Lancet Planetary Health. 6, e139–e146. doi: 10.1016/S2542-5196(21)00350-8
Tatem, A. J. (2017). WorldPop, open data for spatial demography. Sci. Data. 4, 170004. doi: 10.1038/sdata.2017.4
United Nations (2015). World Urbanization Prospects. United Nations, Department of Economic and Social Affairs. Available online at: https://population.un.org/wup/Publications (accessed February 01, 2022).
Watts, M. (2017). Cities spearhead climate action. Nature Clim. Change. 7, 537–538. doi: 10.1038/nclimate3358
WHO Climate Change and Health, Environment, Climate Change and Health (2019). WHO Health and Climate Change Survey Report. WHO Climate Change and Health, Environment, Climate Change and Health. Available online at: https://www.who.int/publications/i/item/who-health-and-climate-change-survey-report-tracking-global-progress (accessed March 3, 2022).
WHO Environment, Climate Change and Health (2020). WHO Review: Health in the Nationally Determined Contributions. WHO Environment, Climate Change and Health. Available online at: https://www.who.int/publications/i/item/who-review-health-in-the-ndcs (accessed March 3, 2022).
Wolkinger, B., Haas, W., Bechner, G., Weisz, U., Steininger, K., Hutter, H., et al. (2018). Evaluating health co-benefits of climate change mitigation in urban mobility. Int. J. Environ. Res. Public Health. 15, 880. doi: 10.3390/ijerph15050880
World Health Organization (2010). Why Urban Health Matters. World Health Organization. Available online at: https://apps.who.int/iris/bitstream/handle/10665/70230/WHO_WKC_WHD_2010.1_eng.pdf (accessed February 5, 2022)
World Health Organization (2021). The Health Argument for Climate Action. World Health Organization. Available online at: https://www.google.com/url?q=https://apps.who.int/iris/rest/bitstreams/1378263/retrieveandsa=Dandsource=docsandust=1648098509118304andusg=AOvVaw2EPu8ijgfrqmhli1Vvh44y" (accessed March 23 2022).
World Health Organization UN Habitat (2016). Global Report on Urban Health. World Health Organization UN Habitat. Available online at: https://apps.who.int/iris/bitstream/handle/10665/204715/9789241565271_eng.pdf (accessed February 5 2022).
Keywords: climate change, health, environmental health, environmental policy, air quality
Citation: Johnson L, Krisko P, Malik M, O'Donnell C, Pendleton N, Ahn D, Bizberg A, Chafe ZA, Kim D, McCormick S, Naidoo S and Anenberg SC (2022) Environmental, Health, and Equity Co-benefits in Urban Climate Action Plans: A Descriptive Analysis for 27 C40 Member Cities. Front. Sustain. Cities 4:869203. doi: 10.3389/frsc.2022.869203
Received: 04 February 2022; Accepted: 04 April 2022;
Published: 02 May 2022.
Edited by:
Sotiris Vardoulakis, Australian National University, AustraliaReviewed by:
Sujit Sikder, Leibniz Institute for Ecological Urban and Regional Development (IOER), GermanyHeran Zheng, Norwegian University of Science and Technology, Norway
Hanna-Andrea Rother, University of Cape Town, South Africa
Copyright © 2022 Johnson, Krisko, Malik, O'Donnell, Pendleton, Ahn, Bizberg, Chafe, Kim, McCormick, Naidoo and Anenberg. This is an open-access article distributed under the terms of the Creative Commons Attribution License (CC BY). The use, distribution or reproduction in other forums is permitted, provided the original author(s) and the copyright owner(s) are credited and that the original publication in this journal is cited, in accordance with accepted academic practice. No use, distribution or reproduction is permitted which does not comply with these terms.
*Correspondence: Susan C. Anenberg, c2FuZW5iZXJnQGd3dS5lZHU=
†These authors have contributed equally to this work