 M. Omar Nawaz1*
 Daven K. Henze1Susan C. Anenberg2
 Doyeon Y. Ahn2Daniel L. Goldberg2Christopher W. Tessum3
 Zoe A. Chafe4
- 1Department of Mechanical Engineering, University of Colorado Boulder, Boulder, CO, United States
- 2Department of Environmental and Occupational Health, Milken Institute School of Public Health, George Washington University, Washington, DC, United States
- 3Department of Civil and Environmental Engineering, University of Illinois Urbana-Champaign, Urbana, IL, United States
- 4C40 Cities Climate Leadership Group Inc., New York City, NY, United States
As the world becomes increasingly urbanized, growing populations are exposed to poor ambient air quality and at risk of the associated health outcomes. Urban air quality is affected both by local sources of air pollution and sources outside city borders. Policy-makers who develop air quality policies need to know whether it is most effective to focus on local policies or to spend resources fostering larger regional air quality management cooperation. Identifying the fraction of air pollution exposure from emissions as a function of distance from the city is a critical element of air quality management design. We estimate the health burden associated with exposure to fine particulate matter (PM2.5), ozone (O3), and nitrogen dioxide (NO2) from county-level anthropogenic sources in and around 14 US cities; this analysis is a test-bed to conduct future global analyses. We use adjoint sensitivities calculated from the chemical transport model GEOS-Chem, high resolution satellite-derived surface concentrations of PM2.5 and NO2, and health impact assessment methods. For the 70.2 million people living in these cities, we estimate that 27,740 PM2.5- and O3-related premature deaths and 126,600 NO2-related new asthma cases were attributable to air pollution exposure in 2011. Development within the GEOS-Chem adjoint framework enables sectoral attribution and policy analysis in addition to the rote assessment of impact. We find that 70% of deaths and nearly 100% of these asthma cases were attributable to anthropogenic emissions. There is great variability in the sources of the anthropogenically-related health impacts; within-urban emissions make up 5% in Austin to 56% in Los Angeles and Phoenix (median: 31%) of urban premature deaths and 18% in Austin to 82% in Los Angeles (median: 59.5%) of new asthma cases, with the remaining portions attributable to emissions from outside the urban area. For each city, we estimate the air quality related health benefits associated with the adoption of a vehicle-miles-traveled fee in that city and in multiple spatial regions surrounding the city. The findings suggest that the proportion of urban air pollution that is regional is greater for premature deaths than new asthma cases and for the eastern US than the western US.
1. Introduction
The United States (US) has become increasingly urbanized in recent years (Balk et al., 2018). Despite reductions in air pollutants such as fine particulate matter (PM2.5) (Southerland et al., 2022), ozone (O3) (Seltzer et al., 2020), and nitrogen dioxide (NO2) (Anenberg et al., 2022), urban populations are still exposed to poor air quality at levels above World Health Organization (WHO) guidelines (World Health Organization, 2016) in many parts of the country. Exposure to air pollution at unhealthy levels has been associated with a number of health outcomes including premature deaths (Jerrett et al., 2009; Burnett et al., 2014; Turner et al., 2016) and new pediatric asthma cases (Achakulwisut et al., 2019). For most chemical precursors of air pollutants, emission rates are greater in cities than in rural areas (Strosnider, 2017); however, the fraction of urban air pollution-related health impacts directly attributable to local urban emissions varies from city to city (Tessum et al., 2022). Variability in this “municipal” contribution to health impacts is driven by a number of factors (Tessum et al., 2022) including the city's size and location, differences in nearby (non-local) sources, and the overall magnitude of pollutant concentrations relative to health impact thresholds. The high degree of variability in municipal contributions to air pollution-related health impacts poses challenges for local policy-makers. By better understanding which local and regional sources have the most impact on urban health, and whether to prioritize local source control and/or larger regional cooperative action, policy-makers will be better equipped to design interventions that efficiently improve in-city air quality.
There are 14 cities in the US, and 97 globally, whose mayors are members of the C40 Cities Climate Leadership Group, a group engaged in action to confront climate change through local action (C40 Cities Climate Leadership Group, 2023) and more recently to improve urban air quality (Westmancoat, 2023). At the time of this study, 48 C40 cities (six in the US) have signed the Clean Air Accelerator agreement (Lopez et al., 2023). The signatory cities pledge to establish baseline air pollution levels, identify top sources of air pollution, and design ambitious actions to reduce the sources under their control within 5 years, all with the aim of achieving WHO air quality guidelines. The development of these policies can refer to previous work in the US in assessing the air pollution impacts of proposed actions. The US Environmental Protection Agency (EPA) developed the Travel Efficiency Assessment Method (TEAM) to assess the emission reduction benefits of actions that improve travel efficiency (US EPA O, 2020). In collaboration with the Capital Area Council of Governments (CAPCOG), a ten-county region in and around Austin, TX, the EPA estimated the emission impacts of travel efficiency improvements for Austin and the surrounding region in 2040.
To support city-level policy development to reduce air pollution emissions, it is valuable to relate emission reductions (on a policy-by-policy basis) with air quality and health impacts. However, the unique combination and large number of sources of air pollutant precursors in densely-populated regions introduce complexity in characterizing how any one source contributes to urban air pollution and the extent of urban air pollution directly attributable to urban emissions. This complexity, in turn, presents major challenges in assessing the effectiveness of proposed emission reductions policies that aim to target common sources of poor air quality. Source apportionments can be performed to address these policy needs by characterizing the influence of emission sources on air pollution in a receptor, e.g., a city. A number of approaches are used to conduct source apportionments including receptor-based mass transfer approaches, such as positive matrix factorization (Sturtz et al., 2014), source-based mass transfer approaches, such as model tagging (e.g., Goldberg et al., 2016), increment approaches (Kranenburg et al., 2013), and sensitivity analyses including both brute force/finite difference (McDuffie et al., 2021) and adjoint calculations (Nawaz et al., 2021). All of these approaches, in some way, make assumptions that simplify the complex non-linear processes involved in the formation of air pollution in order to characterize the relationships between air pollutants and the emissions of their chemical precursors. An effective source apportionment approach will balance simplifying assumptions, to maintain scientific validity in representing air pollutant formation and transport processes, while also considering computational tractability and applicability for policy-makers.
Many studies have performed source apportionments to characterize the influence of sources on air pollution in the US at different spatial scales. Considering national-scale PM2.5 concentrations, and their associated health impacts, one study (Thakrar et al., 2020) applied a reduced complexity model, InMAP, to PM2.5-related premature deaths in the US and found that emissions from industry (29%), transportation (29%), and agriculture (19%) were the leading sources. Another study (McDuffie et al., 2021), found that emissions from transportation, industry, energy, and “other fires” (including deforestation, boreal forest, peat, savannah, and temperate forest fires) were the largest contributors to PM−2.5 in the US. Regional and state-level source apportionments (Huang et al., 2019, 2022; Kotchenruther, 2020) using diverse approaches have been performed to characterize the sources of PM2.5. More studies have considered the sources of PM2.5 than O3 or NO2, as exposure to PM2.5 has a greater association with severe health effects and because the composition of PM2.5 can indicate source contributions making it more amenable to different source attribution methodologies; but, some source apportionments of US O3 have been performed both nationally (Pappin et al., 2015; Nopmongcol et al., 2017b; Dedoussi et al., 2020) and regionally (Collet et al., 2014; Goldberg et al., 2016; Nopmongcol et al., 2017a; Zawacki et al., 2018). In regional models, O3 formation conditions are identified as either NOx- or VOC-sensitive in grid boxes and any contribution is attributed to the limited species. Generally, transportation emissions, primarily of nitrogen oxides (NOx), have been found to be the dominant contributor to O3 concentrations at these different scales. Large-scale regional source apportionment studies of NO2 are rarer because no US urban area is in non-attainment of the EPA NAAQS for NO2 despite the substantial health burden of NO2 below the NAAQS in US cities (Anenberg et al., 2022).
Substantial work has been done to characterize sources of PM2.5, O3, and NO2 at the urban-scale. For example, we found in previous work (Nawaz et al., 2021) that vehicle emissions were among the greatest contributors to PM2.5-, O3-, and NO2-related health impacts in Washington, DC in 2011. While anthropogenically-contributed urban O3 is generally attributed in large part to transportation emissions of NOx (Anenberg et al., 2022), recent work has identified that the emissions of volatile chemical products are an underrepresented source (McDonald et al., 2018) specifically in Los Angeles but with implications for all cities. Urban NO2 is primarily associated with transportation emissions (Borge et al., 2014; Pepe et al., 2019; Nawaz et al., 2021) and is generally contributed to by emissions within or near cities (Wang et al., 2020) due to its short atmospheric lifetime (Seinfeld and Pandis, 2016). Many studies have also focused on assessing the effectiveness of enacted or proposed emission reduction scenarios, sometimes leveraging source apportionment approaches (Fann et al., 2012; Zhang et al., 2017; Yang et al., 2019). One study leveraged reduced form models to identify ZIP Code-level health impacts of city-wide policy scenarios including fleet electrification and congestion pricing and estimated reductions in PM2.5 concentrations resulting in health and monetary benefits (Shukla et al., 2022) that varied at the neighborhood scale. Another recent study identified changes in vehicle miles traveled by clean buses in New York City and noted reductions in annual concentrations of NO, NO2, and BC between 2009 and 2014 (Lovasi et al., 2022). A third study (Pan et al., 2023) used the CMAQ air quality model and BenMAP health impact assessment tool in the US to quantify the impacts of large-scale electric vehicle use by 2050 and estimated that thousands of premature deaths could be avoided across 30 metropolitan areas.
In this study, we apply our recently developed source apportionment framework (Nawaz et al., 2021) that leverages GEOS-Chem adjoint sensitivities, satellite-derived data, and current health impact assessment methods to the 14 C40 cities in the US; this analysis serves as a test-bed to conduct future analyses globally. We estimate the overall health impacts in each city from PM2.5, O3, and NO2 exposure and determine the fraction of pollution-related premature deaths attributable to anthropogenic emissions specifically. Additionally, we identify the dominant anthropogenic regional and sectoral emission sources that contribute to PM2.5- and O3-related premature deaths and to NO2-related new pediatric asthma cases in each of these 14 study cities and identify characteristics among cities with common sources. We then apply our adjoint sensitivities by combining them with hypothetical emission reductions from the aforementioned TEAM assessment to estimate air quality-related health benefits, in the form of deaths and asthma cases avoided. We consider the accrued benefits associated with progressively larger areas implementing a proposed vehicle miles traveled fee policy to identify the extent to which different cities and pollutants require cooperative regional action, compared to isolated local action, to address their air pollution-related health burden.
2. Materials and methods
In this study, we assess the accrued benefits associated with an increasing area of policy implementation by leveraging adjoint sensitivity calculations and health impact assessment methods. First, we conduct adjoint sensitivity calculations to perform source apportionments of air pollution-related premature deaths and new asthma cases in each of the 14 study cities. Then we estimate the air pollution-related health benefits, in the form of deaths and cases avoided, from proposed emission reductions associated with improvements in travel efficiency by combining these emissions reductions with the adjoint calculations. Both steps of this analysis largely follow the methodological framework described in our previous study (Nawaz et al., 2021). The focus of this section is to summarize the methodological approach while highlighting areas of our analysis that differ from this previous study; for more details on the methodology, we refer to this previous work.
2.1. Air quality modeling
The first step of our analysis is to simulate the formation of PM2.5, O3, and NO2 in the 14 study cities. To do this we perform a simulation using the chemical transport model, GEOS-Chem (Bey et al., 2001) version 35n of the adjoint (Henze et al., 2007) corresponding to version 10 of the standard forward model with additional updates to include formation processes of anthropogenic secondary organic aerosols (Nault et al., 2020). Throughout this work we will refer to the GEOS-Chem simulation of these air pollutants as the “forward model.” We conduct this simulation in the nested US domain at a resolution of 0.5° × 0.667° with 47 vertical layers. Our simulation is driven by GEOS-5 meteorological fields from the NASA Global Modeling and Assimilation Office (NASA, 2023). For all 14 cities we conduct 2-month simulations for each of the three pollutants for each month that contributes to the time-scales of the pollutant exposures we use in our health impact assessment discussed in section 2.4; overall we conduct 473 unique 2-month forward model simulations and adjoint calculations.
Our forward model configuration is thus similar to our previous work (Nawaz et al., 2021) with the following noteworthy difference. In addition to the standard NEI 2011v2.1 (US EPA O, 2015) emissions we have used previously, we now include emissions of volatile chemical products (McDonald et al., 2018) to more accurately simulate the formation of urban pollution, specifically of O3. In doing so we better characterize emissions of anthropogenic volatile organic compounds (VOCs) that impact PM2.5 and O3 formation.
2.2. Pollutant exposures and adjoint calculations
Once we complete the forward model simulations, we define the “response-functions” used in the adjoint calculation, for each of the 14 cities and three pollutants. For this analysis the response-functions are equivalent to “pollutant exposures” used in epidemiological studies to relate pollution exposure to health impacts and are consistent with the metric defined in the Global Burden of Disease (GBD) 2019 study (Murray et al., 2020). To calculate these exposures, we population-weight simulated pollutant concentrations, apply a mask to identify the city of interest, and, for PM2.5 and NO2, incorporate satellite-derived data. For the latter step, we characterize fine-scale spatial variability at a horizontal resolution of 0.01° × 0.01° by taking the ratio of the satellite-derived surface-level concentrations for PM2.5 (van Donkelaar et al., 2021) and for NO2 based on a previous study (Cooper et al., 2020) compared to the same satellite-derived products averaged to our model resolution. Additionally, for our PM2.5 calculation we apply a bias correction based on the ratio of the model simulated PM2.5 to the satellite-derived PM2.5 for 2011. To perform the population-weighting we use the Gridded Population of the World version 4 (GPWv4) product (Center for International Earth Science Information Network - CIESIN - Columbia University, 2017). In our previous study we applied a mask corresponding to the district boundaries of Washington, DC; in this work we have applied masks derived from the Global Human Settlement (GHS) Settlement Model Grid (SMOD) (Florczyk et al., 2019) dataset consistent with recent health impact assessments (Anenberg et al., 2022; Malashock et al., 2022; Southerland et al., 2022) to define the city boundaries for each of the 14 study cities. These masks define the city extent beyond the municipal boundaries and are more representative of the metropolitan area. Lastly, we have updated the satellite-derived product for PM2.5 from the older one (van Donkelaar et al., 2016) we used in our previous work to the most up-to-date dataset at the time of this analysis (van Donkelaar et al., 2021). This new product had an improved correlation with out-of-sample cross-validated observations (R2 = 0.99) compared to the older product (R2 = 0.81) based on evaluation in the study (van Donkelaar et al., 2021). We present gridded maps of the exposures at 0.01° × 0.01° resolution in Figure 1; we linearly interpolate the simulated O3 concentrations to this resolution from the coarse model resolution. These products agree well with ground level observations as evaluated in section 3.1. The exposure values used in the adjoint calculations are provided in Figure 1.
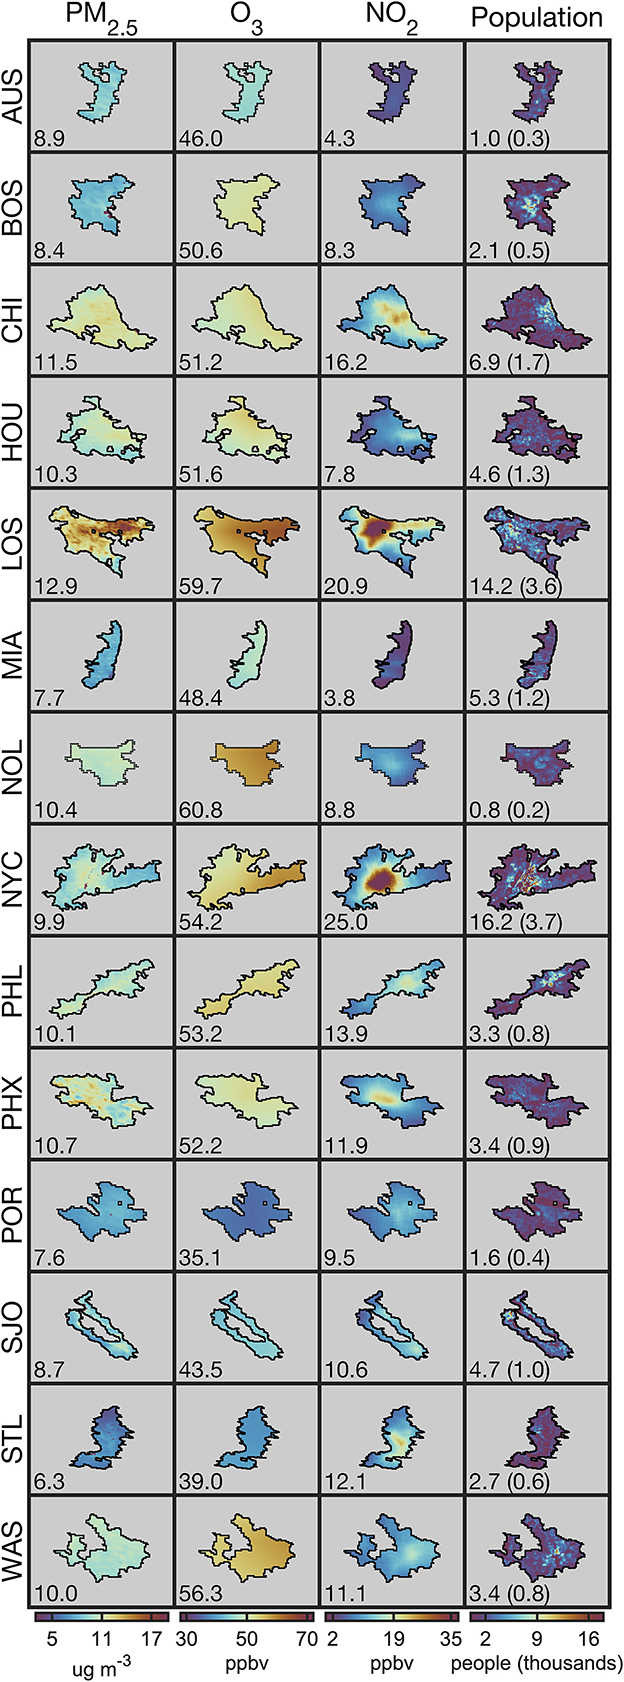
Figure 1. The exposures for all of the three pollutants, along with population data for each of the 14 study cities. Cities are labeled to the left of each row, and, for the first three columns, pollutants are labeled at the top of each column; a legend for the three letter abbreviations is included as part of Table 2. The mask files used are indicated by the black borders around the products. Numbers in the bottom left indicate the population-weighted concentrations or “pollutant exposures” for PM2.5, O3, and NO2 for the first three columns and the population in millions with the under 20 years old population in parenthesis for the last column.
After the exposure values (Figure 1) are calculated we conduct the adjoint calculation. During the adjoint simulation we calculate the sensitivities of these scalar exposures to emissions of their chemical precursors. For PM2.5, we consider sensitivities to emissions of black (BC) and organic carbon (OC), ammonia (NH3), NOx, sulfur dioxide (SO2), and VOCs. For O3, we consider sensitivities to emissions of NOx, VOCs, and carbon monoxide (CO). For NO2 we present sensitivities to emissions of NOx (sensitivities with respect to emissions of other species are calculated by default in the adjoint model, but are not significant, unsurprisingly, for NO2). Corresponding to the forward model simulations, we conduct 473 2-month adjoint calculations for 2011 and aggregate the monthly calculations to get 42 unique sets of adjoint sensitivities for each of the three pollutant exposures in each of the 14 study cities. These 2-month calculations are done in parallel for each month of the year for each city; the first month is included as a spin-up period and to assess the impact of emissions from the prior month on the formation of pollutants. The adjoint characterizes the sensitivity of pollutant exposures to emissions from precursor species for each day and model grid cell. We refer to our previous work (Nawaz et al., 2021) for explicit definitions of the exposures and adjoint sensitivity calculation.
For all 14 cities, we perform several 2-month adjoint calculations to capture the influence of emissions from the previous month on the current month's air pollution exposures. In Supplementary Table S1.1 we present the percentage of the total contributions that are captured when considering days prior to the current month. Based on the results across the 14 US cities, for O3, PM2.5, and NO2 we find that a 9-, 5-, and 1-day integration beyond the adjoint forcing window captures an average of 99.5, 99.7, and 99.7% of all contributions, respectively. These recommended integration windows are most appropriate for urban simulations. We note that simulations across larger spatial scales or for exposures with much lower pollutant concentrations will likely need more lag days than suggested here.
The adjoint model calculates the local-linear sensitivity of the exposures to emissions of its chemical precursors. This local-linear sensitivity characterizes the linear response of a pollutant with respect to a precursor species under the chemical conditions and emissions levels for which the forward model simulation was conducted. When applying these local-linear sensitivities to characterize changes in emissions that are notably different from this emissions magnitude, substantial uncertainty related to non-linear relationships can be incurred (Nawaz et al., 2023). To reduce the uncertainty introduced by these non-linear effects in the O3 adjoint calculation with respect to NOx, we apply a second-order contribution calculation derived from these local-linear sensitivities and from additional forward model simulations following the framework outlined in our previous work (Nawaz et al., 2023) for all other pollutant concentration emission relationships we only consider the local-linear sensitivities as the second-order effects are less pronounced; to elaborate, the response in NO2 concentrations is linearly related to NOx emissions and the response in PM2.5 concentrations is linearly related to primary carbonaceous aerosol emissions. For PM2.5, there are some second-order effects involved in the formation of secondary inorganic and organic aerosol; however, based on our previous analysis (Nawaz et al., 2021) these are less pronounced than the relationship between O3 and NOx.
2.3. Source apportionment calculation and emission scenario projection
Once we have calculated the adjoint sensitivities we can estimate the source contributions following the framework introduced in our previous work (Nawaz et al., 2021). In a general sense, we do so for the first order calculation as:
We calculate the exposure contribution dJ from a specific source s by multiplying the adjoint sensitivities associated with that source λs by the emissions associated with that source Es. Specifically, we consider adjoint sensitivities to emissions from unique days, grid cells, and precursor species and combine them with emissions from the corresponding days, grid cells and species; we can also further disaggregate emissions by sector to estimate sectoral contributions. The second order contribution calculation is described in our previous work (Nawaz et al., 2023).
We assess the pollutant exposure impacts of proposed emission reductions in 2040 relative to 2011 by adopting an approach similar to Equation 1. In this step of the analysis, we use the adjoint sensitivities corresponding to a unique source; however, instead of combining them with emissions from a specific source, we combine them with emissions from a proposed emission scenario perturbing emissions corresponding with the grid cells, days, and precursor species of the adjoint sensitivities:
A benefit of this approach is that we can consider proposed emission scenarios (ΔE) through variations of all of the sources we identified in the source apportionment calculation. In other words, we can consider emission changes corresponding to distinct grid cells, seasons, chemical precursor species, and emissions sectors. We consider a number of emission reductions associated with proposed travel efficiency improvements described in detail in the EPA TEAM analysis (US EPA O, 2020) that specifically target emissions from on-road light-duty vehicles at the annual time-scale (Table 1). We identify the health benefits associated with areas of policy implementation using concentric circles of different radii. We iteratively increase the circle radius, centered around a city, by a fixed amount and combine the adjoint sensitivities with emissions from all of the 0.1° × 0.1° that have center points within the circle. We combine the adjoint sensitivities with emissions from larger and larger spatial areas to estimate the accrued benefits of applying these proposed scenarios to larger areas of implementation.
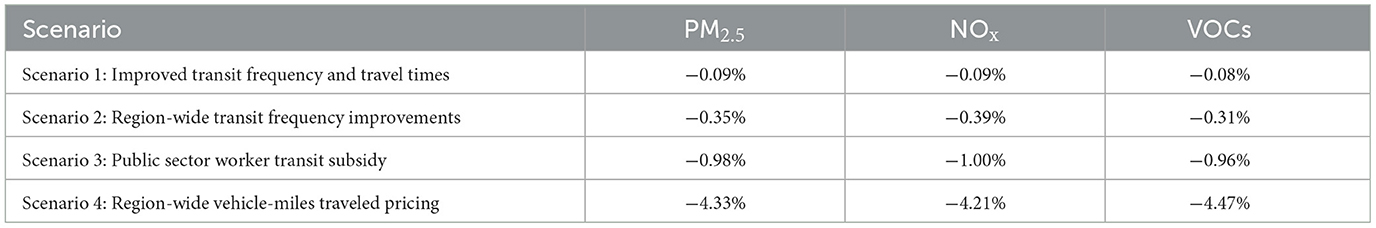
Table 1. Percent reductions in on-road light-duty vehicle emissions by 2040 compared to 2011 emissions of primary PM2.5, NOx, and VOCs associated with four proposed travel efficiency improvement plans in 2040 in the EPA TEAM analysis.
This approach is simple and makes two major simplifications that introduce uncertainty into our analysis: (1) we apply the percent emission reductions across all on-road vehicle emissions, including both light and heavy-duty vehicles; (2) these scenarios were developed specifically for Austin, TX so when we apply them to other cities we do not account for city-specific differences that could impact emission reductions including urban density, transit networks, sidewalks, and bike lanes. The first simplification is done because the on-road vehicle emissions used in our modeling set-up are not separated into light and heavy-duty vehicles; this likely leads to a high bias in our estimates of premature deaths avoided from the proposed scenarios. The second simplification is done because detailed EPA TEAM assessments have not been completed for most of the other study cities. We also note that the results that are presented in this work only consider the impact of the proposed travel efficiency improvement plans; we do not consider the greater reductions that have been or could be achieved from fleet turnover and current regulations, and vehicle electrification.
2.4. Health impact calculation
After calculating the contributions to pollution exposure from specific sources we assess the associated health impacts following the framework of our previous study (Nawaz et al., 2021) based on methods from the GBD 2019 study (Murray et al., 2020). For PM2.5, the GBD 2019 study provides exposure to relative risk (RR) look-up tables which relate PM2.5 exposure to the relative risk of premature death from six outcomes: ischemic heart disease, stroke, lung cancer, acute lower respiratory illness, type II diabetes, and chronic obstructive pulmonary disorder. We linearly interpolate between exposures and risks as they are provided at discrete intervals. For O3 and NO2, we apply the log-linear model used in previous works (Turner et al., 2016; Achakulwisut et al., 2019) to relate 6-month peak averaged MDA8 population-weighted O3 and annual averaged population-weighted NO2 to the relative risk of premature death from chronic obstructive pulmonary disorder and new pediatric asthma cases, respectively.
where X refers to the concentration above the counterfactual value and β is the concentration response factor; values are given in associated works for both pollutants (Achakulwisut et al., 2019; Murray et al., 2020). We use low-concentration thresholds of 37.6 ppbv and 2 ppbv for O3 and NO2, respectively, in line with our previous study (Nawaz et al., 2021).
To assess the overall health impacts of pollutant exposures we use population data at the urban level (Southerland et al., 2022) and apply age-stratifications from the state-level (Murray et al., 2020) as the relative risk exposure relationships for certain outcomes are age-dependent. For NO2 we use pediatric populations exclusively (Anenberg et al., 2022) and do not apply this age stratification. We use disease rates from the GBD 2019 study (Murray et al., 2020) at the state level; the city boundaries of Portland, New York City, Chicago, Philadelphia, and Washington, DC extend into multiple states, for these cities we use the state where most of the population resides in, noting that bordering states generally have similar disease rates in these cities. For Washington, DC we apply state values from Virginia. We estimate the health impacts associated with some relative risk exposure relationship as:
We perform this assessment for each relative-risk health outcome and each age bracket across all three pollutants.
To characterize the health impacts associated with a specific contribution or emission reduction we perform the health impact assessment framework described above twice: once using exposures at the baseline levels (Figure 1) and a second time by multiplying this baseline estimate by the fraction attributable to the specific source sector. The latter is calculated by taking the difference between the exposure and the contribution from the source sector, divided by the total exposure value. By differencing these two values we estimate the health impacts attributable to a source or the health benefits associated with an emission reduction. We apply relative changes in baseline mortality rates, age distribution, and population data from the GBD foresight project (IHME, 2018) to account for changes in demographics by 2040. We do not project asthma incidence rates as changes in incidence rates are not considered in the GBD foresight project.
3. Results
3.1. Evaluation of pollutant concentrations
We characterize uncertainty in our exposure estimates by performing an agreement assessment between ground-level observations from the US EPA Air Quality System (AQS) and the pollutant exposures. This comparison is done for 2011 at the exposure time-scales: annual averages of daily average concentrations for PM2.5 and NO2 and the 6-month peak average of the average maximum daily 8-h concentrations for O3. Observations from monitors that recorded fewer than 200 days for PM2.5 and NO2 and fewer than 100 days in the 6-month peak season for O3 are excluded from our assessment. Applying this filtering, we are left with observations from 319, 1283, and 370 unique monitors for PM2.5, O3, and NO2, respectively, which are located throughout the US and that cover most of the study cities. The exposures we compare against these observations are satellite-derived concentrations for PM2.5 (van Donkelaar et al., 2021) and NO2 (Nawaz et al., 2021), and GEOS-Chem simulated concentrations for O3. We characterize the agreement between the exposures and observations both throughout our domain and in the study cities specifically; to do so we consider the correlation (R2), normalized mean bias (NMB) calculated as the exposure values minus observations divided by observations, and the root mean square errors (Figure 2). Biases for individual cities for all three pollutants are presented in Supplementary Table S1.2.
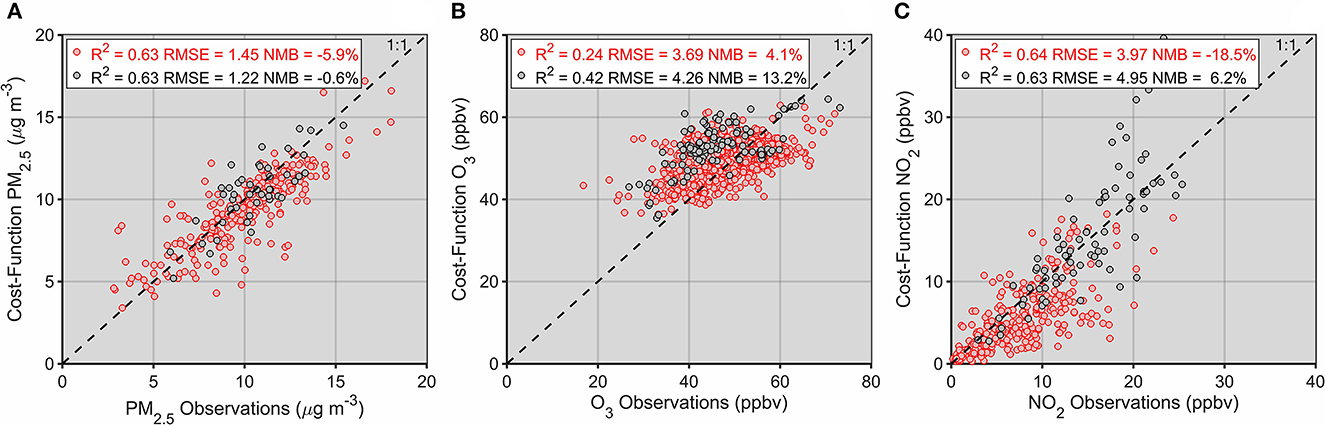
Figure 2. Evaluation of the exposures of PM2.5 (A), O3 (B), and NO2 (C) compared to US EPA AQS observations. Results for monitors across the entire domain are given in red while comparisons for only the study cities are given in gray.
Performance of the satellite-derived product used for PM2.5 (Figure 2A) is discussed in great detail at the global scale in its corresponding study. There were PM−2.5 monitors with sufficient days of observation located within all of the study cities, shown in Figure 1, excluding Austin. Across all monitors located in our study cities the satellite-derived product agrees well with observations, with a correlation of R2 = 0.63 and an NMB of −0.6%. When we compare satellite-derived concentrations in individual cities to monitors we find that NMB values range from −29.4% in Portland to +15.8% in Miami. The cities with the greatest agreement were New York and Washington, DC with NMB values of −1.3 and −2.4%, respectively. When comparing observations to the exposure values for PM2.5 in individual cities we note that monitor sparsity could impact our assessment. Some cities only have one or two ground-level monitors; if they are located near a major source, not resolved by our exposure estimate, we would expect the exposures to be biased low. This sparsity would have an even greater effect on the shorter-lived NO2; this is less of a consideration for O3 given its longer atmospheric lifetime.
The only pollutant exposure that we calculate exclusively using simulated concentrations is O3 (Figure 2B). Chemical transport model simulations of O−3 have been biased high (Canty et al., 2015; Travis et al., 2016) in general in the US, with among the largest high biases occurring in the south-eastern US. Due to the long atmospheric lifetime of O3 we anticipate that less local features would be captured in our simulated concentrations than for the other, shorter-lived pollutants. With concentrations spanning a smaller dynamic range than PM2.5 and NO2 we also expect worse correlation. In the study cities we find a correlation of R2 = 0.42 and bias of +13.2% for O3. Unlike for PM2.5, there were monitors with sufficient observations in all of our study cities; in these cities, biases ranged from −6.7% in Austin to +25.8% in Boston. Overall, the cities in which simulated O3 concentrations best agreed with observations were Austin and Portland with a +7.6% bias, and Phoenix with a −8.9% bias.
Of all three pollutants, the location of ground level monitors is the most important for NO2 due to its short-atmospheric lifetime. Although the satellite-derived approach we use to characterize fine-scale variability compares well against observations (Cooper et al., 2020, 2022; Nawaz et al., 2021) we note that this approach may be unable to capture smaller hotspots of NO2 concentrations (associated with road systems and point sources). Beyond the inability of our approach to capture fine-scale variability in the NO2 concentrations discussed above, the overall low bias could be attributable in part to overestimates of NO2 from chemiluminescent monitors (Lamsal et al., 2008) that attribute concentrations of other reactive nitrate species to NO2. Isolating our evaluation to just the study cities, excluding Austin and Seattle which had no monitors with sufficient observations, we find a correlation of R2 = 0.63 and a low bias of +6.2%. There is a high degree of variability in biases for NO2 at the city level that is likely attributable to the reasons given above: biases ranged from −63.4% in Boston to +19.4% in Portland. The cities in which the satellite-derived NO2 concentrations had the lowest biases compared to observations were Washington, DC with a bias of +0.3%, Chicago with a bias of +5.9%, and Phoenix with a bias of +8.2%.
3.2. Air quality health impacts in all US C40 cities
We next estimate the overall health impacts associated with air pollution exposure in all of our study cities (Table 2). Across these 14 cities, about 70.2 million people were exposed to air pollution in 2011; these exposures result in an estimated 24,380 PM2.5-related deaths, 3,350 O3-related deaths, and 126,600 NO2-related new pediatric asthma cases in that year.
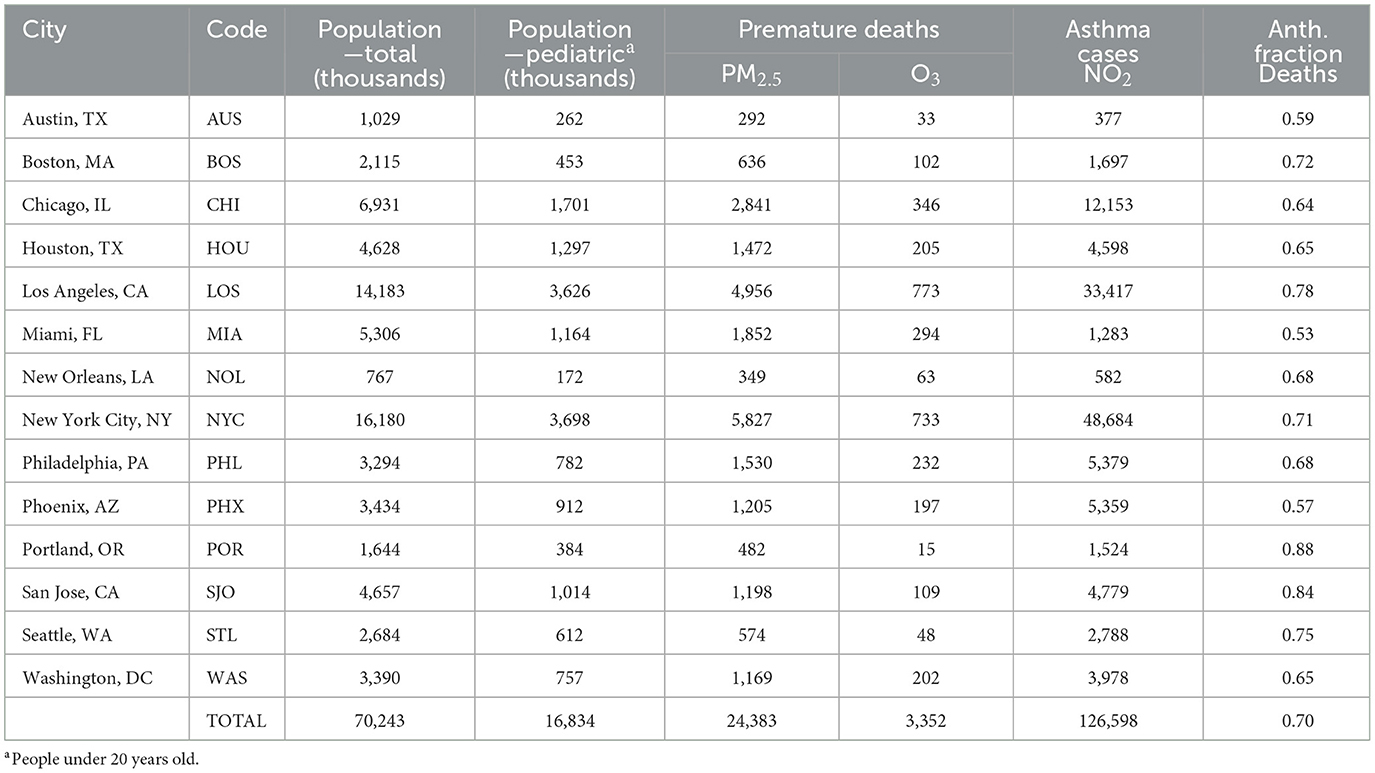
Table 2. Population, under 20 years old population, PM2.5- and O3-related premature deaths, NO2-related asthma cases, and the anthropogenic component of PM2.5- and O3-related premature deaths for each of the study cities.
For individual cities, PM2.5-related annual premature deaths ranged from 290 in Austin to 5,830 in New York City. Despite New York City having below average PM2.5 as compared to the other study cities (Figure 1), demographic characteristics like population number, the age distribution of population, and baseline disease rates led to it having the highest number of PM2.5-related premature deaths. Similar to how urban air pollution is not entirely dependent on urban emissions, air pollution health burdens are not entirely driven by exposure levels; it is important to consider differences in disease rates and population when comparing air pollution-related health impacts across cities. For example, Washington, DC and Philadelphia have similar PM2.5 exposures and populations; however, there are 1.3 times as many PM2.5-related premature deaths in the former due primarily to differences in baseline disease rates and age demographics. Additionally, Washington, DC and New York City have similar PM2.5 exposures but substantially different populations which leads to 5.0 times as many PM2.5-related premature deaths in New York City in 2011.
Premature deaths related to O3 exposure were always substantially smaller than those from PM2.5, consistent with previous health impact assessments (Cohen et al., 2017; Murray et al., 2020), due to a less severe relationship between exposure and relative risks (Burnett et al., 2014; Turner et al., 2016). Overall, O3-related deaths ranged from 20 in Portland to 770 in Los Angeles. We note that low O3 concentrations in Portland, Seattle, and to a lesser extent San Jose combined with a high degree of uncertainty in the health impact assessment could mean that the estimated O3-related premature deaths are not significantly above zero. Comparing PM2.5- and O3-related premature deaths in the two most populous of our study cities, there are more PM2.5-related deaths in New York City than Los Angeles, but the inverse is true for O3-related premature deaths; this is attributable in part to higher O3 exposure in Los Angeles (59.7) than New York City (54.2) despite the larger population of the latter.
For individual cities, asthma cases related to NO2 exposure vary substantially on a city-by-city basis, more so than PM2.5- and O3-related premature deaths. For example, comparing the health impacts in the city with the most premature deaths (New York City) to the city with the least (Austin), there were 129 times as many NO2-related asthma cases in New York City, but only 20 times as many PM2.5- and O3-related premature deaths; the latter is more consistent with the population ratio of these two cities of around 16. City-by-city variability in NO2 exposures is greater than for PM2.5 and O3 exposures and areas of low and high NO2 concentrations are generally aligned with areas of low and high population.
In the final column of Table 2, we present the anthropogenic fraction of PM2.5- and O3-related premature deaths in each of the study cities. This anthropogenic fraction represents the fraction of overall PM2.5- and O3-related premature deaths that are attributable to anthropogenic emissions. Across all cities, about 70% of PM2.5- and O3-related premature deaths are attributable to anthropogenic emissions, and this fraction is relatively consistent ranging from 53% in Miami to 88% in Portland. Across all of these cities a majority of air pollution-related health impacts are attributable to anthropogenic emissions. We do not include an anthropogenic fraction for NO2-related asthma cases because, on average, anthropogenic emissions of NOx contribute more NO2 exposure than actual levels in the cities. This result is due to the removal of NO2 by other chemical species, most notably reactions with hydroxyl radicals to form nitric acid, nighttime chemical reactions between NO2 and nitrates, and the formation of peroxyacetyl nitrate and alkyl nitrates (Seinfeld and Pandis, 2016). Overall, we estimate that anthropogenic emissions of NOx contribute on average 1.08 times the NO2 exposure levels, ranging between 0.94 in Austin and 1.18 in New Orleans with the values >1 indicating NO2 removal from other chemical species.
Across all of the study cities, the ratio of PM2.5-related premature deaths to overall PM2.5- and O3-related premature deaths, from both PM2.5 and O3 exposures, was consistent. Overall, about 88% of all PM2.5- and O3-related premature deaths were attributable to PM2.5 exposure ranging from 85% in New Orleans to 97% in Portland. As expected, due to the higher association between PM2.5 exposure and premature death than O3 exposure and premature death, PM2.5 exposure is responsible for most of the PM2.5- and O3-related premature deaths in all of these cities. Lastly, considering premature deaths and asthma cases per capita allows for additional insight into the extent to which pollutant exposures and disease rates drive overall health impacts. The city with the highest per capita premature deaths was New Orleans (0.54 deaths per 1,000 people) and the city with the lowest was Seattle (0.23). Although PM2.5 and O3 exposures are substantially larger in New Orleans than in Seattle they are only 1.7 and 1.6 times greater indicating that baseline disease rates and non-linearities in the relative risk exposure relationships play a key role in the per capita health impacts. For NO2, the highest per capita cases occurred in New York City (13.2 cases per 1,000 children) and the lowest per capita cases occurred in Miami (1.1).
3.3. Regional source apportionment of pollution-related health impacts
From our results in the previous section, we conclude that the health burdens associated with exposure to PM2.5, O3, and NO2 in our study cities are substantial and that a majority of these health burdens are attributable to anthropogenic emissions. Characterizing the regional influences of anthropogenic emissions on these air pollution-related health impacts is a useful step toward developing effective pollution mitigation policies. To address this, we estimate the regional contributions to urban PM2.5- and O3-related premature deaths and new asthma cases (Figure 3). For each city, we consider regional contributions at three levels. First, we consider the municipal contribution of the city, i.e., the extent to which emissions in a city contribute to air pollution-related health impacts in that city. Second, we consider contributions from all individual counties within the state the city is located in, excluding the municipal contribution; there is one exception, for Washington, DC we consider county-level contributions from Virginia. Lastly, we consider state-level contributions from the rest of North America, excluding prior city-level and state-level contributions. In breaking down contributions in this manner we not only characterize the extent to which emissions from a city, its state, and the rest of North America contribute to the air pollution-related health impacts in a city, but also consider the unique county-level and state-level contributions that make up these larger regional contributions.
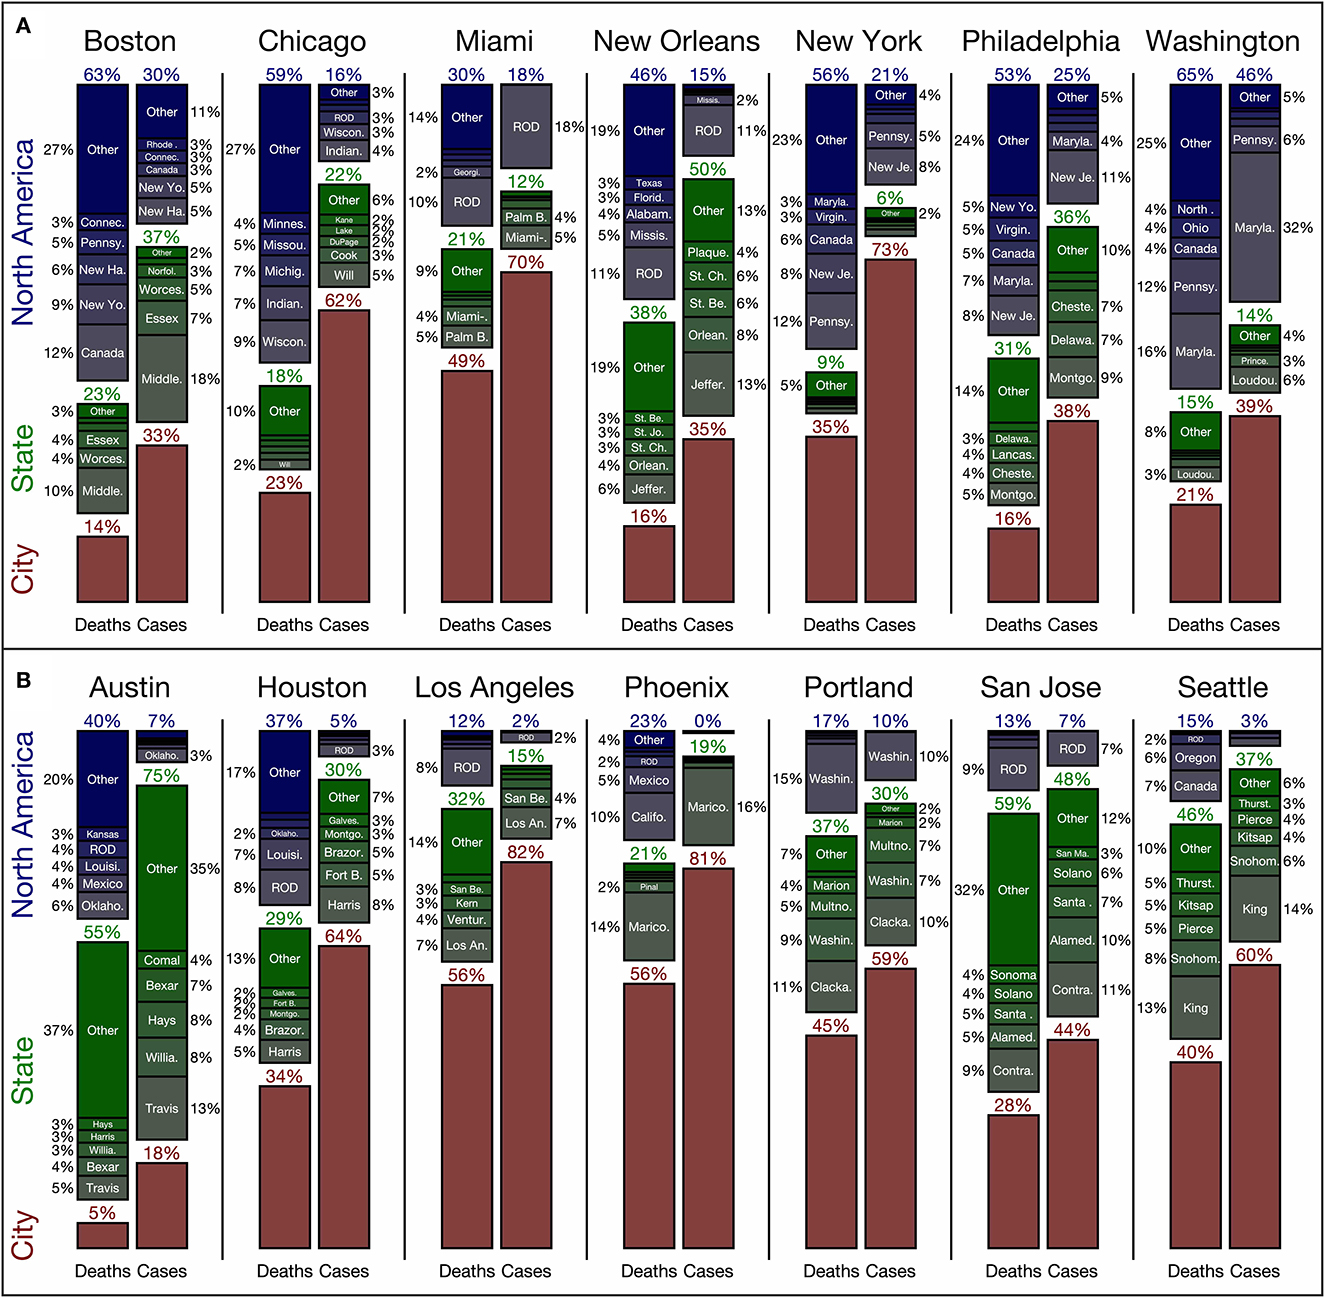
Figure 3. Regional contributions to air pollution-related health impacts in (A) the eastern and (B) the western US. We consider separate breakdowns for PM2.5- and O3-related premature deaths (left) and NO2-related new asthma cases (right) for each city. In red are municipal contributions; in green are contributions from the state the city is in, broken down by county; and in blue are contributions from the rest of North America broken down by state. We consider the top five county and state contributions; all other contributions for each category are labeled as “other.” Contributions <2% are not labeled. The term ROD refers to “rest-of-domain” and includes all emissions outside of the US, Mexico, and Canada, including shipping emissions within the nested US GEOS-Chem domain.
Focusing first on PM2.5- and O3-related premature deaths, we consider the impact of emissions from within each city on that city; this is the “municipal” contribution. The municipal contribution varies greatly from city-to-city. For example, in Austin only 5% of PM2.5- and O3-related premature deaths are attributable to emissions from Austin; however, in Los Angeles and Phoenix the municipal contribution makes up over half of all PM2.5- and O3-related premature deaths. While a number of factors influence this variability in the municipal contribution, perhaps the most important is the city size. On average, the four smallest cities (Boston, Portland, New Orleans, and Austin) had an average area of 1,257 km2 and an average municipal contribution of 20%. Contrasting this with the four largest cities (New York City, Houston, Chicago, and Los Angeles), which had an average area of 8,636 km2 and an average municipal contribution of 37%, it is clear that smaller cities contribute less to their own air pollution-related health burden than larger ones. Note that the combined local and state contributions in these small cities are generally similar to the combined local and state contribution in larger cities in the same region.
The second factor that influences variability in municipal contribution is one of the most important for determining the overall breakdown of city, state, and domain-level contributions to urban PM2.5- and O3-related premature deaths: the geographic location of the city. In the western US, municipal, state, and domain contributions to PM2.5- and O3-related premature deaths make up, on average, 38, 40, and 22%, respectively, compared to the Eastern US where, on average, they make up 25, 22, and 53%, respectively. This trend makes sense given there are more cities, greater population density, and more power plants in the Eastern US. In the Western US, where urban agglomerations are further apart from one another and downwind of fewer anthropogenic sources, combined municipal and state contributions play a much greater role of 78% compared to 47% in the Eastern US. Western US states are generally larger in land area than eastern US states, which also leads to greater state contributions. By grouping cities into smaller regional clusters, e.g., Boston, New York City, Philadelphia, and Washington, DC or Austin, Houston, and New Orleans, we find that for cities in these regional clusters, contributions from emissions outside of the states along with the combined municipal and state contributions are relatively similar. The emission sectors that drive differences across these regions are discussed in detail at the end of this section.
The focus of the prior two paragraphs has been on the factors driving the regional breakdown of PM2.5- and O3-related premature death contributions; turning our attention to the regional breakdown of NO2-related asthma cases, the importance of these factors is even greater. The four smallest cities (Boston, Portland, New Orleans, and Austin) have a municipal contribution to NO2-related asthma cases of 36% compared to the four largest cities (New York City, Houston, Chicago, and Los Angeles) with a municipal contribution of 70%. Similarly, regionality is important in determining the domain contribution: in the western US the domain contribution was, on average, 5% compared to the eastern US where it was, on average 24%. The clearest difference between the regional breakdown of NO2-related asthma cases compared to PM2.5- and O3-related premature deaths is the greater influence of sources near the city. As discussed previously, NO2 has a much shorter atmospheric lifetime than PM2.5 and O3 so municipal emissions will have an enhanced impact on NO2-related asthma cases compared to PM2.5- and O3-related premature deaths.
Another key characteristic that influences variability in the regional contributions to urban air pollution-related health impacts is the sectoral profiles of the emissions that most affect each city. We present the relative contributions from each sector regardless of location in Table 3; additionally, we present the relative sectoral contributions from the three spatial areas discussed in Figure 3 and Supplementary Tables S1.3–S1.5. We note that a majority of “other” emissions are attributable to the “surface” sector which includes a number of distinct sectors as discussed in our previous study (Nawaz et al., 2021) including non-EGU combustion, commercial cooking, gas stations, non-point industrial processing, solvents, waste disposal, and non-plume EGU and industrial emissions. County-level contributions of emissions from all sectors to PM2.5- and O3-related premature deaths and new asthma cases are available in the supporting information. In these county-level contributions we include lower and upper bound estimates from the health impact calculation.
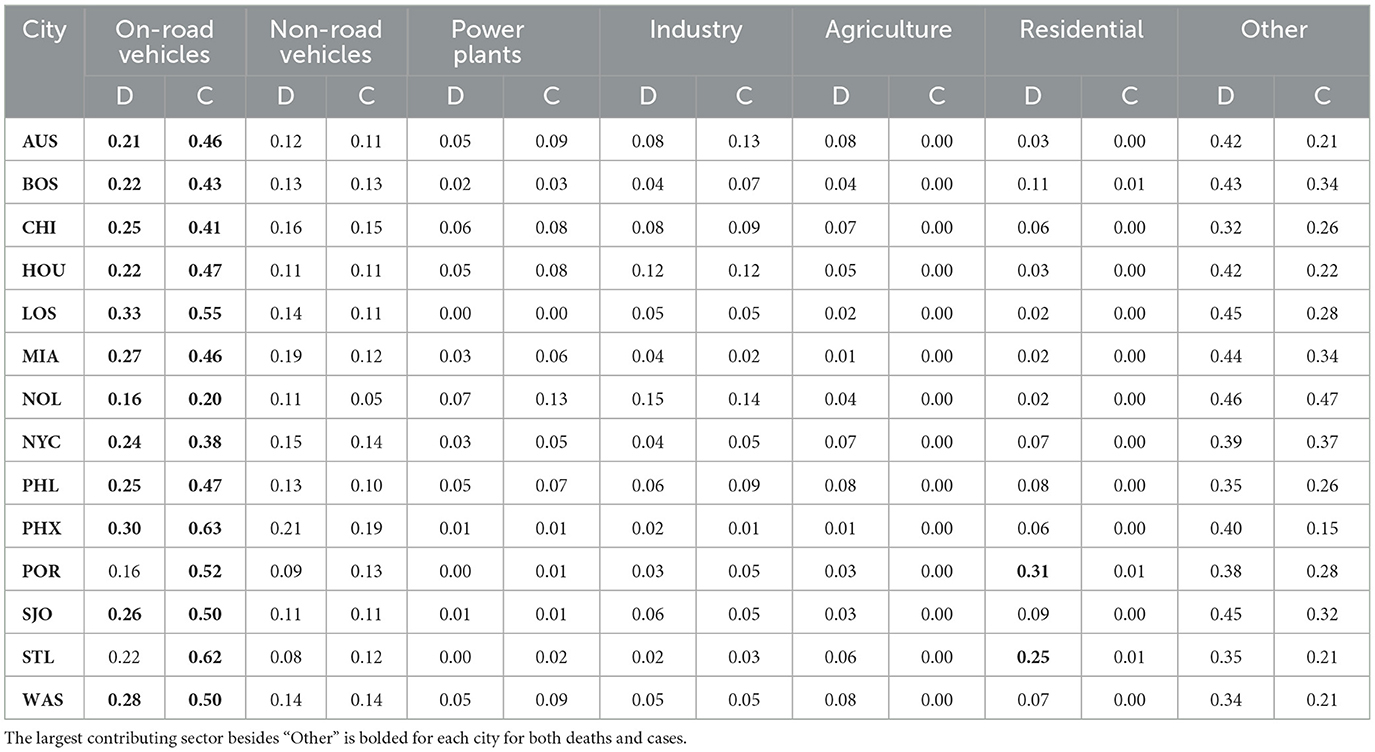
Table 3. Normalized sectoral contributions to PM2.5- and O3-related premature deaths (D) and NO2-related asthma cases (C) by the largest contributing sectors from emissions across the entire domain for all study cities.
Considering the results presented in Table 3, we compare the sectoral breakdowns of cities with the four largest municipal contributions of air pollution-related premature death (i.e., Los Angeles, Phoenix, Miami, and Portland) to the cities with the four smallest contributions (i.e., Austin, Boston, New Orleans, Philadelphia). Cities with more municipal contributions in general have large contributions from residential emissions (1.71 times cities with fewer municipal contributions), on-road vehicles (1.26), and non-road vehicles (1.18), but smaller contributions from power plants (0.21), agriculture (0.29), and industry (0.42). Emissions of primary carbonaceous aerosols associated with the residential sector persist for a much shorter time (Lund et al., 2018) than the precursors of secondary pollution. Subsequently, cities with proportionally more residential emissions should have a greater municipal contribution to their pollution. Emissions from on-road vehicles have been shown to have large per-mile impacts in urban areas (Choma et al., 2020, 2021) and both on-road and non-road vehicle emissions make up a large fraction of urban emissions of air pollutant precursors like NOx and CO (Gately et al., 2017). Emission sectors associated with the longer-lived secondary components of PM2.5 and with O3 generally have more influence on cities with small municipal contributions; for example, emissions of SO2 and NOx from power plants, NH3 from agriculture, and VOCs from industry contribute proportionally more to urban air pollution-related health impacts in cities with smaller municipal contributions.
Considering the results from Supplementary Tables S1.3–S1.5, we can characterize the relative influence of different sectors associated with different regional contributions. On-road vehicle emissions are an important contributor to urban air pollution-related premature deaths, regardless of where they are emitted; but they are especially important when emitted inside an urban boundary. On average, on-road vehicle emissions from the surrounding state and domain contribute to air pollution-related premature deaths proportionally less, 0.86 times and 0.71 times, respectively, than the municipal contribution of on-road emissions. For NO2-related asthma cases, state and municipal contributions made up a similar percentage; however, the contribution of on-road vehicle emissions from outside of the state was proportionally 0.60 times that of municipal on-road vehicle emissions contributions. On-road vehicle emissions of NOx from more distant locations have less influence on urban NO2-related asthma cases than other sectors. Another sector which becomes proportionally less influential outside of state boundaries is the residential sector; municipal residential emissions make up around 10% of local contributions while only contributing 5% of contributions outside of the state.
When comparing sectoral contributions by region, a few sectors contribute a larger proportion of the outside-of-state contributions than the municipal contributions: albeit, only minorly. Considering premature deaths, outside-of-state contributions from power plants, industry, and agriculture were 3, 6, and 5%, respectively compared to 2, 5, and 1% from within cities. This also is true for NO2-related asthma cases where outside of state contributions were 9 and 8% for power plants and industrial emissions compared to municipal contributions where these emissions made up 4 and 5%. Emissions from “other” sectors were also higher in out-of-state contributions at 47 and 45% compared to 41 and 27%; as discussed in our previous work (Nawaz et al., 2021), this other sector includes surface level emissions from power plants which could explain part of the proportionally larger contribution from other emissions outside of state.
3.4. Assessing the health benefits of emission reduction policies as a function of distance of implementation
Many actions intended to reduce urban air pollution are developed and implemented at the municipal level (Slovic et al., 2016). When developing pollution mitigation policies, local policy-makers must gauge the relative efficacy of their actions when conducted in isolation vs. in collaboration with the surrounding region. As presented in the previous section, several characteristics influence the efficacy of isolated municipal action to target air pollution-related health impacts; these include the pollutant of interest, city size, geographic location, and the sectoral sources of emissions. The framework presented in this section considers these city-specific characteristics and estimates the accrued health benefits, in the form of deaths and asthma cases avoided, that could be achieved from increasing areas implementing emission reduction policies (Table 2). In Table 4, we present the health benefits in 2040 that could be achieved by reducing transportation NOx emissions via exclusive municipal implementations of the four proposed policies in Table 1 relative to 2011 values, from the EPA TEAM assessment; we apply the same percentage emission reductions used in Austin to all 14 study cities for emissions of primary PM2.5, NOx, and VOCs.
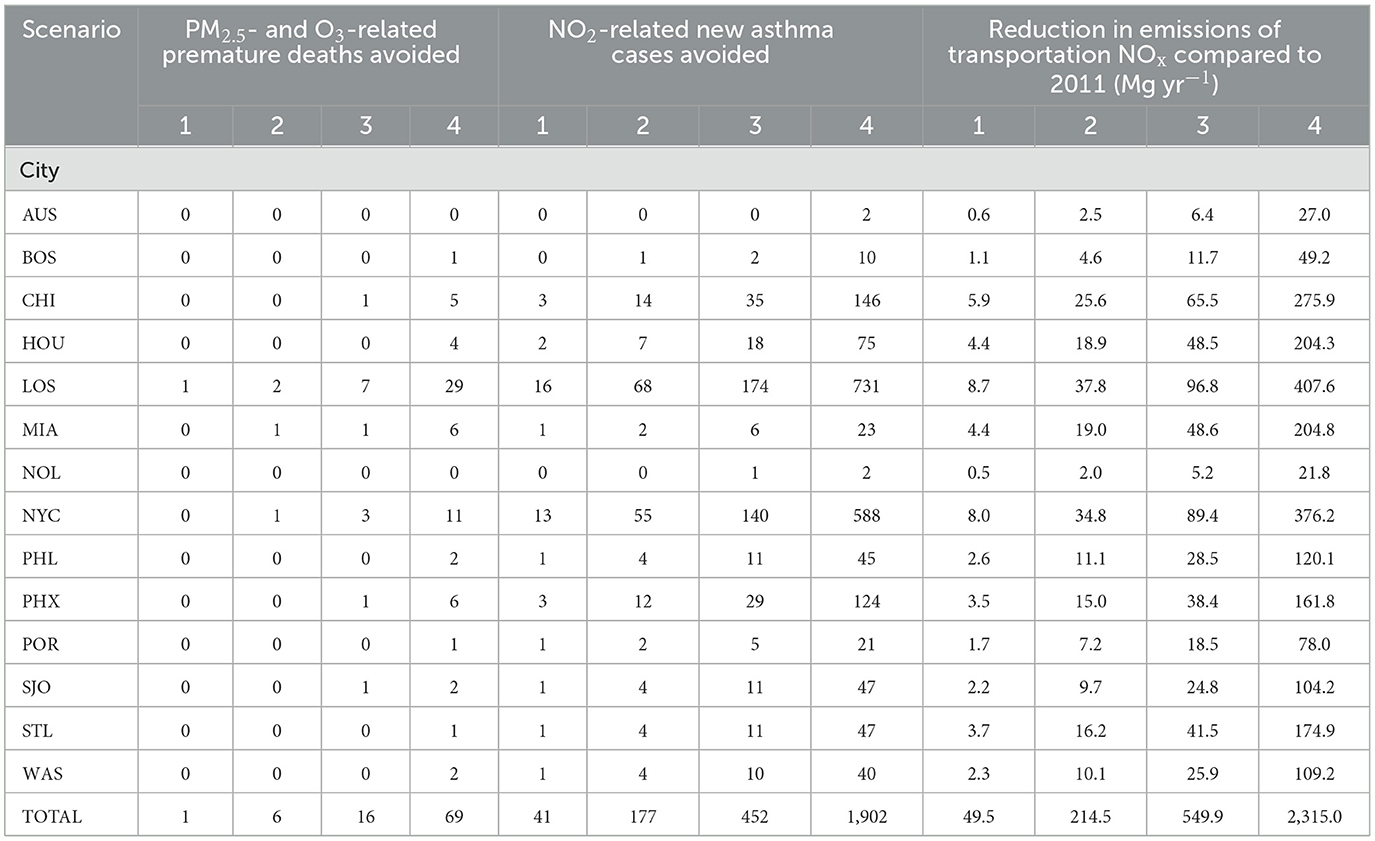
Table 4. Health benefits and emission reductions associated with four proposed emission reduction scenarios (see Table 1) for all 14 study cities if only each city implemented the policy.
Of all scenarios considered, scenario four, a vehicles miles traveled (VMT) fee, results in the most health benefits and also corresponds to the greatest emission reductions. The implementation of this scenario would lead to 70 deaths and 1,900 asthma cases avoided in 2040 across all 14 study cities from municipal action alone. In smaller cities that have proportionally smaller municipal contributions (Austin, Boston, and New Orleans), isolated municipal action results in negligible health impact avoidances of under one premature death and under ten new asthma cases per city. A majority of the avoided premature deaths and new asthma cases occur in the two most populous cities, Los Angeles and New York City, which both have substantial municipal contributions to their air pollution-related health impacts (Figure 3). While in some cities the health benefits of municipal implementation of this VMT fee are substantial (i.e., Los Angeles and New York City), in others very few health benefits are achieved through exclusive municipal action (i.e., Austin and New Orleans).
We estimate the additional health benefits that these cities would realize from cooperative regional action by applying the proposed emission reduction percentages (Table 1) to areas of increasing size for each city (Figure 4) considering only the most effective emission reduction scenario, the vehicle miles traveled fee. The adjoint framework developed in this and our past work (Nawaz et al., 2021) requires several initial chemical transport model simulations and calculations of adjoint sensitivities for each city. These adjoint sensitivities can then be applied to many different emission scenarios, like the aforementioned areas of increasing size, to rapidly assess the impact on pollution-related health impacts from these different emission reductions without a need to perform additional simulations. With these results, we can compare the efficacy of local action relative to cooperative regional action using health impacts avoided to characterize effectiveness and identify the distances at which 50% and 75% of the total health benefits are achieved. Overall, we estimate that implementation of the vehicle miles traveled fee across the entire nested US domain, as opposed to just the municipal implementation in Table 4, would avoid 168 premature deaths and 2,771 new asthma cases across the 14 cities. By removing the municipal contributions from these totals, we estimate that the health benefits associated with non-municipal action were 1.4 times and 0.5 times that of municipal action for premature deaths and asthma cases avoided, respectively.
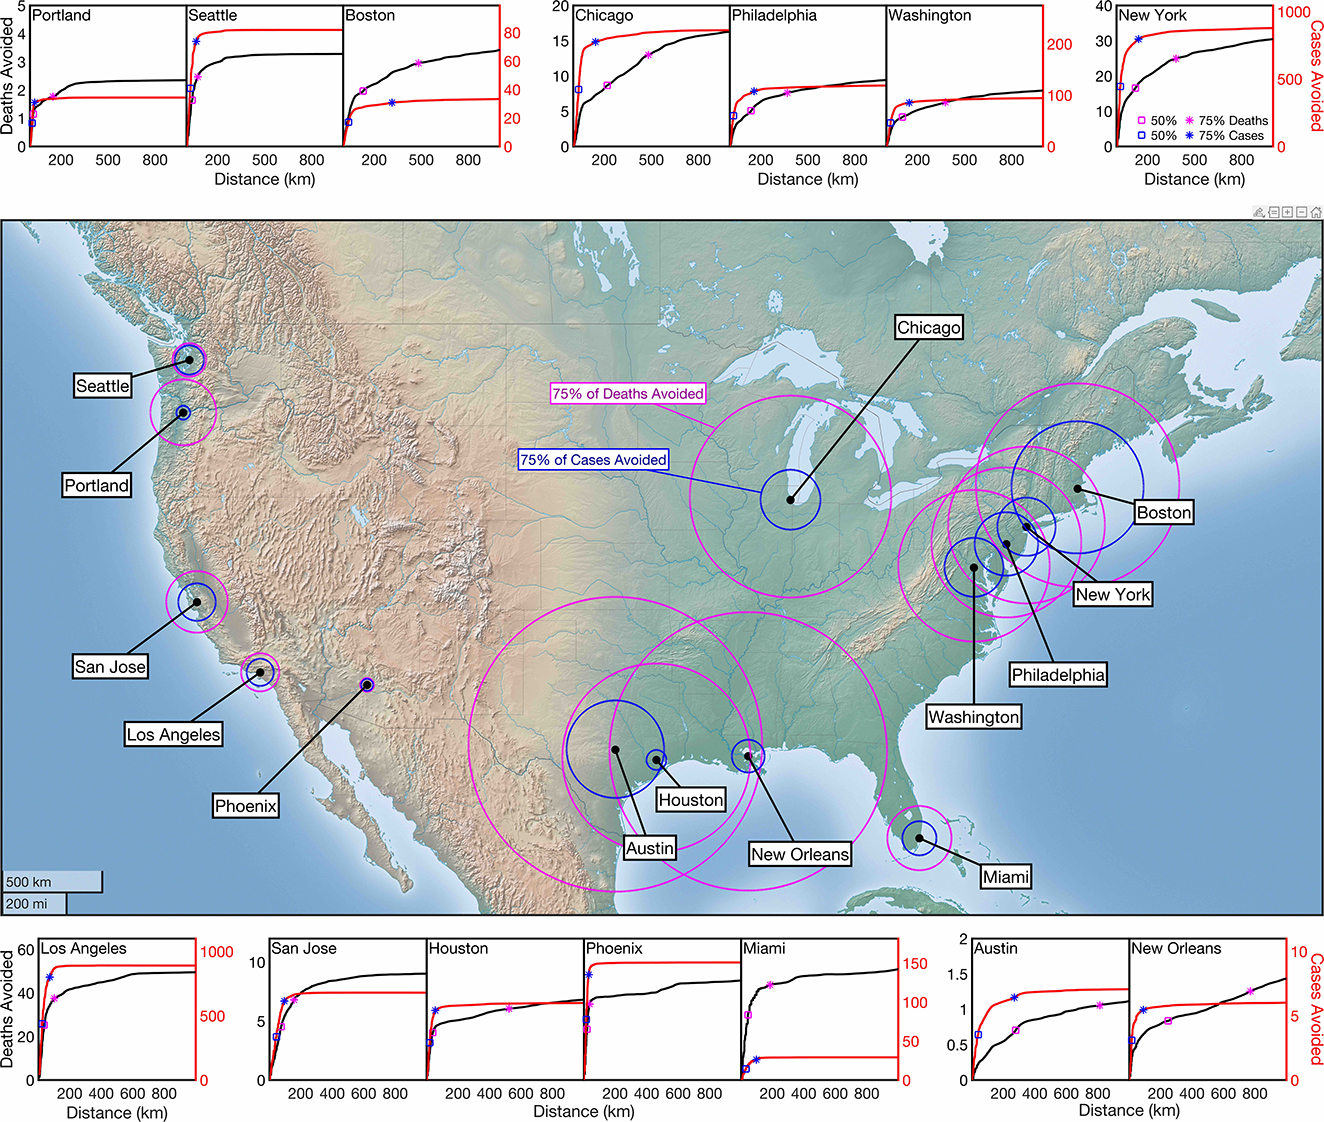
Figure 4. Cumulative PM2.5- and O3-related premature deaths (black) and NO2-related new asthma cases (red) avoided in 2040 from a proposed vehicle miles traveled fee. On the cumulative distribution plots, the distance at which 50% (square) and 75% (asterisk) are marked for both premature deaths (magenta) and new asthma cases (blue). On the map, the distances at which 75% of premature deaths (magenta) and 75% of new asthma cases (blue) are indicated.
Across all cities, a smaller area of implementation is needed to accrue a majority of NO2-related asthma cases avoided compared to PM2.5- and O3-related premature deaths. This is indicated by the sharper rise and earlier convergence of the asthma cumulative distribution functions compared to the premature death cumulative distribution functions (Figure 4). In general, cities in the western US (e.g., Los Angeles) accrue much more of their potential benefits from a smaller area of action than cities in the eastern US (e.g., New York City). In these cumulative distribution plots, we identify the distances at which 50 and 75% of benefits are achieved with square and asterisk markers, respectively. We note that smaller cities that are more dependent on regional action (Austin, Boston, and New Orleans) tend to require substantially greater regional cooperation to achieve these percentages of their potential health benefits compared to cities dominated more by municipal contributions like Los Angeles, Phoenix, and New York City.
In the center of Figure 4, we present a map of the 14 study cities along with the areas of implementation in which 75% of potential premature deaths, in magenta, and 75% of potential asthma cases, in blue, would be avoided. One of the most notable results in this figure is the distinct differences of the 75% regions for eastern and western US cities. In the eastern US, higher population density and a greater number of large cities subsequently mean that these cities would require greater cooperative action to reap the majority of benefits associated with the proposed vehicle miles traveled fee. There are two notable regions among the study cities that would require congruent action from neighboring cities in the same region to achieve 75% of potential health impacts. First, in the south-eastern US, Austin, Houston, and New Orleans would all depend on cooperative action to avoid 75% of premature deaths; additionally, Austin would require action from Houston to avoid 75% of new asthma cases; Austin and Houston are located in the same state and thus may face less roadblocks in fostering regional cooperation than other groups of cities. The second region includes the four study cities in the Northeast: Boston, New York City, Philadelphia, and Washington, DC. For each of these cities to avoid 75% of premature deaths they would require two of their neighboring cities to adopt the same proposed action and for each of these cities to avoid 75% of new asthma cases, outside of Washington, DC, they would require one of their neighboring study cities to implement the proposed action.
In general, the area of implementation needed to avoid 75% of asthma cases is much smaller than the area needed to avoid 75% of premature deaths; owing to this, exclusive municipal actions may have more success in targeting reductions in NO2-related asthma cases than premature deaths. By comparing the sizes of these areas of implementation we characterize how capable cities are in curbing their NO2-related health impacts compared to health impacts associated with the longer-lived PM2.5 and O3. In some cities, cooperation with only their own state agency is needed to achieve the 75% reduction, while in other cities, five or more state agencies need to cooperate together in order to achieve the same number of benefits within the city. Local action in New Orleans would be many times more effective in reducing NO2-related asthma cases than PM2.5- and O3-related premature deaths; in this city, the area in which 75% of NO2-related benefits are achieved is smaller than the area in which 50% of premature death benefits are achieved. Seattle is the exact opposite, the area of implementation needed to achieve 75% of the NO2-related asthma cases avoided is nearly identical in size to the area needed to achieve 75% of the PM2.5- and O3-related premature deaths avoided. Ultimately, the ability of a city to address its air pollution-related health burden is highly variable, dependent primarily on the geographic location of a city and the target pollutant.
4. Discussion and conclusions
We apply the source apportionment approach from our previous study (Nawaz et al., 2021) to 14 US cities in 2011 to characterize the regional contributions to air pollution-related health impacts and to assess the efficacy of emission mitigations applied to different areas of implementation. First, we characterize the sources of air pollution-related health impacts by region and sector. Second, we leverage our adjoint sensitivities to assess the health benefits associated with a vehicle-miles-traveled fee policy considering the additional benefits achieved from extra-municipal action. We estimate that exposure to PM2.5, O3, and NO2 across the 70.2 million individuals living in these 14 study cities contributed to 24,380 premature deaths, 3,350 premature deaths, and 126,600 asthma cases, respectively in 2011. Across all cities, about 70% of these premature deaths were attributable to pollution of anthropogenic origin. We find that there is substantial variability in the fraction of anthropogenic health impacts that is attributable to municipal emissions. About 5% in Austin to 56% in Los Angeles and Phoenix of premature deaths and between 18% in Austin and 82% in Los Angeles of new asthma cases are attributable to municipal emissions exclusively. Beyond this municipal contribution, many cities have large fractions of their air pollution-related health impacts attributable to emissions in nearby counties or states. While this variability is attributable to a combination of multiple factors, we find that city size, location with respect to sources, and sectoral sources are all among the most influential factors. When considering the impact of the emission reductions associated with the proposed vehicle miles traveled fee, we find that cities have greater control of their NO2-related health impacts than PM2.5- and O3-related premature deaths. Additionally, we find that regional cooperation is needed to achieve greater health benefits for cities in the eastern US than cities in the western US as previously evidenced by other assessments (Farrell and Keating, 2002; Day et al., 2019).
The results and conclusions of this study are subject to uncertainties from a number of different components of our analysis; while we briefly discuss key sources of uncertainty here, detailed analyses of uncertainties are discussed in our previous works (Nawaz et al., 2021, 2023). In our forward model and adjoint simulations, we do not include fugitive dust emissions; this likely leads to an underestimate of local contributions as this would be an additional source of primary PM2.5 that would most likely impact assessments in Western US cities. When performing our source apportionment and emission impact analysis, we combine adjoint sensitivities calculated at the 0.5° × 0.667° with emissions at the 0.1° × 0.1° resolution; the coarseness of the adjoint sensitivities means we fail to capture fine-scale peaks and valleys in sensitivities; this is a limitation of our approach that particularly affects NO2 which has sharp gradients at neighborhood scales within these large grid cells. While the pollutant concentration products we use for our exposures generally agree well with observations when considering bias and correlation, there are discrepancies which could lead to under or overestimates of pollution exposures in cities. These under or overestimates of pollution exposures would carry over to the health impact analysis as well. Lastly, we found in our previous work (Nawaz et al., 2021) that the health impact assessment is the largest source of uncertainty in our analysis due to the inherent uncertainty in the epidemiological studies that support the health impact calculation methods. In Supplementary material 2, 3, we present the lower and upper bounds health impacts of the county-level contributions.
With these limitations in mind, the results of our work have implications for policy-making and future urban source apportionment studies. To better characterize urban air pollution and its associated health impacts, it is beneficial for source apportionment studies and policies derived from them to consider the influence of sources directly outside of the city and its surrounding area; in some cities a majority of pollutants can be contributed from emissions originating outside of both the city and state. There is not a consistent fraction of pollution attributable to municipal emissions; the extent to which urban emissions contribute to urban pollution depends on a number of factors including size, population, location, and dominant regional sectors. Policies and actions exclusively targeting urban emissions are likely more effective in reducing NO2-related health impacts than PM2.5- and O3-related health impacts due to the shorter atmospheric lifetime of NO2. While regional cooperation in reducing air pollution should always be encouraged regardless of the location of a city, it is useful especially for cities in the eastern US for larger regions to cooperate to reduce the health burden from air pollutant exposures, primarily the premature deaths associated with exposure to PM2.5 and O3.
Data availability statement
The original contributions presented in the study are included in the article/Supplementary material, further inquiries can be directed to the corresponding author.
Author contributions
MN, DH, and SA contributed to conception and design of the study. CT compared results to other analysis. DA, DG, and ZC provided feedback on analysis and figures. MN organized the dataset, performed the evaluation and analysis, and generated the figures. MN and DH wrote the first draft of the manuscript. DA, DG, ZC, and CT wrote sections of the manuscript. All authors contributed to manuscript revision, read, and approved the submitted version.
Funding
The authors acknowledge funding from NASA grants NNX16AQ19G, 80NSSC19K0193, and 80NSSC20K0214.
Acknowledgments
The authors thank the helpful feedback from Gary Kleiman and Julian Marshall.
Conflict of interest
ZC was employed by C40 Cities Climate Leadership Group Inc.
The remaining authors declare that the research was conducted in the absence of any commercial or financial relationships that could be construed as a potential conflict of interest.
Publisher's note
All claims expressed in this article are solely those of the authors and do not necessarily represent those of their affiliated organizations, or those of the publisher, the editors and the reviewers. Any product that may be evaluated in this article, or claim that may be made by its manufacturer, is not guaranteed or endorsed by the publisher.
Supplementary material
The Supplementary Material for this article can be found online at: https://www.frontiersin.org/articles/10.3389/frsc.2023.1102493/full#supplementary-material
References
Achakulwisut, P., Brauer, M., Hystad, P., and Anenberg, S. C. (2019). Global, national, and urban burdens of paediatric asthma incidence attributable to ambient NO2 pollution: estimates from global datasets. Lancet Planet Health 3, e166–e178. doi: 10.1016/S2542-5196(19)30046-4
Anenberg, S. C., Mohegh, A., Goldberg, D. L., Kerr, G. H., Brauer, M., Burkart, K., et al. (2022). Long-term trends in urban NO2 concentrations and associated paediatric asthma incidence: estimates from global datasets. Lancet Planet Health 6, e49–e58. doi: 10.1016/S2542-5196(21)00255-2
Balk, D., Leyk, S., Jones, B., Montgomery, M. R., and Clark, A. (2018). Understanding urbanization: a study of census and satellite-derived urban classes in the United States, 1990-2010. PLoS ONE 13, e0208487. doi: 10.1371/journal.pone.0208487
Bey, I., Jacob, D. J., Yantosca, R. M., Logan, J. A., Field, B. D., Fiore, A. M., et al. (2001). Global modeling of tropospheric chemistry with assimilated meteorology: model description and evaluation. J. Geophys. Res. Atmos. 106, 23073–23095. doi: 10.1029/2001JD000807
Borge, R., de la Paz, D., Lumbreras, J., Pérez, J., and Vedrenne, M. (2014). Analysis of contributions to NO2 ambient air quality levels in Madrid City (Spain) through modeling implications for the development of policies and air quality monitoring. J. Geosci. Environ. Prot. 2, 6–11. doi: 10.4236/gep.2014.21002
Burnett, R. T., Pope, C. A., Ezzati, M., Olives, C., Lim, S. S., Mehta, S., et al. (2014). An integrated risk function for estimating the global burden of disease attributable to ambient fine particulate matter exposure. Environ. Health Perspect. 122, 397–403. doi: 10.1289/ehp.1307049
C40 Cities Climate Leadership Group. (2023). About C40. C40 Cities. Available online at: https://www.c40.org/about-c40/ (accessed July 4, 2022).
Canty, T. P., Hembeck, L., Vinciguerra, T. P., Anderson, D. C., Goldberg, D. L., Carpenter, S. F., et al. (2015). Ozone and NOx chemistry in the eastern US: evaluation of CMAQ/CB05 with satellite (OMI) data. Atmos. Chem. Phys. 15, 10965–10982. doi: 10.5194/acp-15-10965-2015
Center for International Earth Science Information Network - CIESIN - Columbia University (2017). Gridded Population of the World, Version 4 (GPWv4): Population Density, Revision 10. NASA Socioeconomic Data and Applications Center (SEDAC). doi: 10.7927/H4DZ068D
Choma, E. F., Evans, J. S., Gómez-Ibáñez, J. A., Di, Q., Schwartz, J. D., Hammitt, J. K., et al. (2021). Health benefits of decreases in on-road transportation emissions in the United States from 2008 to 2017. Proc. Natl. Acad. Sci. 118, e2107402118. doi: 10.1073/pnas.2107402118
Choma, E. F., Evans, J. S., Hammitt, J. K., Gómez-Ibáñez, J. A., and Spengler, J. D. (2020). Assessing the health impacts of electric vehicles through air pollution in the United States. Environ. Int. 144, 106015. doi: 10.1016/j.envint.2020.106015
Cohen, A. J., Brauer, M., Burnett, R., Anderson, H. R., Frostad, J., Estep, K., et al. (2017). Estimates and 25-year trends of the global burden of disease attributable to ambient air pollution: an analysis of data from the Global Burden of Diseases Study 2015. Lancet. 389, 1907–1918. doi: 10.1016/S0140-6736(17)30505-6
Collet, S., Minoura, H., Kidokoro, T., Sonoda, Y., Kinugasa, Y., Karamchandani, P., et al. (2014). Future year ozone source attribution modeling studies for the eastern and western United States. J. Air Waste Manag. Assoc. 64, 1174–1185. doi: 10.1080/10962247.2014.936629
Cooper, M. J., Martin, R. V., Hammer, M. S., Levelt, P. F., Veefkind, P., Lamsal, L. N., et al. (2022). Global fine-scale changes in ambient NO2 during COVID-19 lockdowns. Nature 601, 380–387. doi: 10.1038/s41586-021-04229-0
Cooper, M. J., Martin, R. V., McLinden, C. A., and Brook, J. R. (2020). Inferring ground-level nitrogen dioxide concentrations at fine spatial resolution applied to the TROPOMI satellite instrument. Environ. Res. Lett. 15, 104013. doi: 10.1088/1748-9326/aba3a5
Day, M., Pouliot, G., Hunt, S., Baker, K. R., Beardsley, M., Frost, G., et al. (2019). Reflecting on progress since the 2005 NARSTO emissions inventory report. J. Air Waste Manag. Assoc. 69, 1023–1048. doi: 10.1080/10962247.2019.1629363
Dedoussi, I. C., Eastham, S. D., Monier, E., and Barrett, S. R. H. (2020). Premature mortality related to United States cross-state air pollution. Nature 578, 261–265. doi: 10.1038/s41586-020-1983-8
Fann, N., Baker, K. R., and Fulcher, C. M. (2012). Characterizing the PM25-related health benefits of emission reductions for 17 industrial, area and mobile emission sectors across the US. Environ. Int. 49, 141–151. doi: 10.1016/j.envint.2012.08.017
Farrell, A. E., and Keating, T. J. (2002). Transboundary environmental assessment: lessons from OTAG. Environ. Sci. Technol. 36, 2537–2544. doi: 10.1021/es0106725
Florczyk, A. J, Corbane, C, Ehrlich, D, Freire, S, Kemper, T, and Maffenini, L. (2019). GHSL Data Package 2019, EUR 29788 EN. Luxembourg: Publications Office of the European Union. doi: 10.2760/290498
Gately, C. K., Hutyra, L. R., Peterson, S., and Sue Wing, I. (2017). Urban emissions hotspots: Quantifying vehicle congestion and air pollution using mobile phone GPS data. Environ. Pollut. 229, 496–504. doi: 10.1016/j.envpol.2017.05.091
Goldberg, D. L., Vinciguerra, T. P., Anderson, D. C., Hembeck, L., Canty, T. P., Ehrman, S. H., et al. (2016). CAMx ozone source attribution in the eastern United States using guidance from observations during DISCOVER-AQ Maryland. Geophys. Res. Lett. 43, 2249–2258. doi: 10.1002/2015GL067332
Henze, D. K., Hakami, A., and Seinfeld, J. H. (2007). Development of the adjoint of GEOS-Chem. Atmos. Chem. Phys. 7, 2413–2433. doi: 10.5194/acp-7-2413-2007
Huang, M., Ivey, C., Hu, Y., Holmes, H. A., and Strickland, M. J. (2019). Source apportionment of primary and secondary PM25: associations with pediatric respiratory disease emergency department visits in the US State of Georgia. Environ. Int. 133, 105167. doi: 10.1016/j.envint.2019.105167
Huang, R., Li, Z., Ivey, C. E., Zhai, X., Shi, G., Mulholland, J. A., et al. (2022). Application of an improved gas-constrained source apportionment method using data fused fields: a case study in North Carolina, USA. Atmos. Environ. 276, 119031. doi: 10.1016/j.atmosenv.2022.119031
IHME (2018). GBD Foresight Visualization. Seattle, WA: Institute for Health Metrics and Evaluation (IHME).
Jerrett, M., Burnett, R. T., Pope, C. A., Ito, K., Thurston, G., Krewski, D., et al. (2009). Long-term ozone exposure and mortality. N. Engl. J. Med. 360, 1085–1095. doi: 10.1056/NEJMoa0803894
Kotchenruther, R. A. (2020). Recent changes in winter PM2.5 contributions from wood smoke motor vehicles, and other sources in the Northwest US. Atmos. Environ. 237, 117724. doi: 10.1016/j.atmosenv.2020.117724
Kranenburg, R., Segers, A. J., Hendriks, C., and Schaap, M. (2013). Source apportionment using LOTOS-EUROS: module description and evaluation. Geosci. Model Dev. 6, 721–733. doi: 10.5194/gmd-6-721-2013
Lamsal, L. N., Martin, R. V., van Donkelaar, A., Steinbacher, M., Celarier, E. A., Bucsela, E., et al. (2008). Ground-level nitrogen dioxide concentrations inferred from the satellite-borne Ozone Monitoring Instrument. J. Geophys. Res Atmos. 113(D16). doi: 10.1029/2007JD009235
Lopez, E., Riano, D., Jakubek, M., Kheirbek, I., Sadouni, I., and Dixon, N. (2023). Clean Air Accelerator: How Cities are Cleaning the Air We Breathe. C40 Cities.
Lovasi, G. S., Treat, C. A., Fry, D., Shah, I., Clougherty, J. E., Berberian, A., et al. (2022). Clean fleets, different streets: evaluating the effect of New York City's clean bus program on changes to estimated ambient air pollution. J. Expo. Sci. Environ. Epidemiol. 1–7. doi: 10.1038/s41370-022-00454-5
Lund, M. T., Samset, B. H., Skeie, R. B., Watson-Parris, D., Katich, J. M., Schwarz, J. P., et al. (2018). Short Black Carbon lifetime inferred from a global set of aircraft observations. Npj Clim Atmos. Sci. 1, 1–8. doi: 10.1038/s41612-018-0040-x
Malashock, D. A., DeLang, M. N., Becker, J. S., Serre, M. L., West, J. J., Chang, K. L., et al. (2022). Estimates of ozone concentrations and attributable mortality in urban, peri-urban and rural areas worldwide in 2019. Environ. Res. Lett. 17, 054023. doi: 10.1088/1748-9326/ac66f3
McDonald, B. C., de Gouw, J. A., Gilman, J. B., Jathar, S. H., Akherati, A., Cappa, C. D., et al. (2018). Volatile chemical products emerging as largest petrochemical source of urban organic emissions. Science 359, 760–764. doi: 10.1126/science.aaq0524
McDuffie, E. E., Martin, R. V., Spadaro, J. V., Burnett, R., Smith, S. J., O'Rourke, P., et al. (2021). Source sector and fuel contributions to ambient PM25 and attributable mortality across multiple spatial scales. Nat. Commun. 12, 3594. doi: 10.1038/s41467-021-23853-y
Murray, C. J. L., Aravkin, A. Y., Zheng, P., Abbafati, C., Abbas, K. M., Abbasi-Kangevari, M., et al. (2020). Global burden of 87 risk factors in 204 countries and territories, 1990–2019: a systematic analysis for the Global Burden of Disease Study 2019. Lancet 396, 1223–1249. doi: 10.1016/S0140-6736(20)30752-2
NASA. (2023). Global Modeling and Assimilation Office. The GMAO Research Site. Available online at: https://gmao.gsfc.nasa.gov (accessed January 19, 2023).
Nault, B. A., Jo, D. S., McDonald, B. C., Campuzano-Jost, P., Day, D. A., Hu, W., et al. (2020). Anthropogenic secondary organic aerosols contribute substantially to air pollution mortality. Atmos. Chem. Phys. Discuss. 1–53. doi: 10.5194/acp-2020-914
Nawaz, M. O., Henze, D. K., Anenberg, S. C., Braun, C., Miller, J., and Pronk, E. (2023). A source apportionment and emission scenario assessment of PM2.5- and O3-related health impacts in G20 countries. GeoHealth. 7, e2022GH000713. doi: 10.1029/2022GH000713
Nawaz, M. O., Henze, D. K., Harkins, C., Cao, H., Nault, B., Jo, D., et al. (2021). Impacts of sectoral, regional, species, and day-specific emissions on air pollution and public health in Washington, DC. Elem. Sci. Anthr. 9, 00043. doi: 10.1525/elementa.2021.00043
Nopmongcol, U., Alvarez, Y., Jung, J., Grant, J., Kumar, N., Yarwood, G., et al. (2017a). Source contributions to United States ozone and particulate matter over five decades from 1970 to 2020. Atmos. Environ. 167, 116–128. doi: 10.1016/j.atmosenv.2017.08.009
Nopmongcol, U., Liu, Z., Stoeckenius, T., and Yarwood, G. (2017b). Modeling intercontinental transport of ozone in North America with CAMx for the Air Quality Model Evaluation International Initiative (AQMEII) Phase 3. Atmos. Chem. Phys. 17, 9931–9943. doi: 10.5194/acp-17-9931-2017
Pan, S., Yu, W., Fulton, L. M., Jung, J., Choi, Y., Gao, H. O., et al. (2023). Impacts of the large-scale use of passenger electric vehicles on public health in 30 U.S. metropolitan areas. Renew. Sustain. Energy Rev. 173, 113100. doi: 10.1016/j.rser.2022.113100
Pappin, A. J., Mesbah, S. M., Hakami, A., and Schott, S. (2015). Diminishing returns or compounding benefits of air pollution control? The case of NOx and ozone. Environ. Sci. Technol. 49, 9548–9556. doi: 10.1021/acs.est.5b00950
Pepe, N., Pirovano, G., Balzarini, A., Toppetti, A., Riva, G. M., Amato, F., et al. (2019). Enhanced CAMx source apportionment analysis at an urban receptor in Milan based on source categories and emission regions. Atmos. Environ X. 2, 100020. doi: 10.1016/j.aeaoa.2019.100020
Seinfeld, J. H., and Pandis, S. N. (2016). Atmospheric Chemistry and Physics: From Air Pollution to Climate Change. New York, NY: John Wiley and Sons.
Seltzer, K. M., Shindell, D. T., Kasibhatla, P., and Malley, C. S. (2020). Magnitude, trends, and impacts of ambient long-term ozone exposure in the United States from 2000 to 2015. Atmos. Chem Phys. 20, 1757–1775. doi: 10.5194/acp-20-1757-2020
Shukla, K., Seppanen, C., Naess, B., Chang, C., Cooley, D., Maier, A., et al. (2022). ZIP code-level estimation of air quality and health risk due to particulate matter pollution in New York City. Environ. Sci. Technol. 56, 7119–7130. doi: 10.1021/acs.est.1c07325
Slovic, A. D., de Oliveira, M. A., Biehl, J., and Ribeiro, H. (2016). How can urban policies improve air quality and help mitigate global climate change: a systematic mapping review. J. Urban Health Bull. N. Y. Acad. Med. 93, 73–95. doi: 10.1007/s11524-015-0007-8
Southerland, V. A., Brauer, M., Mohegh, A., Hammer, M. S., Donkelaar, A., van Martin, R. V., et al. (2022). Global urban temporal trends in fine particulate matter (PM2·5) and attributable health burdens: estimates from global datasets. Lancet Planet Health 6, e139–e146. doi: 10.1016/S2542-5196(21)00350-8
Strosnider, H. (2017). Rural and urban differences in air quality, 2008–2012, and community drinking water quality, 2010–2015 — united states. MMWR. Surveill. Summ. 66, 1–13. doi: 10.15585/mmwr.ss6613a1
Sturtz, T. M., Schichtel, B. A., and Larson, T. V. (2014). Coupling Chemical transport model source attributions with positive matrix factorization: application to two IMPROVE sites impacted by wildfires. Environ. Sci. Technol. 48, 11389–11396. doi: 10.1021/es502749r
Tessum, M. W., Anenberg, S. C., Chafe, Z. A., Henze, D. K., Kleiman, G., Kheirbek, I., et al. (2022). Sources of ambient PM25 exposure in 96 global cities. Atmos. Environ. 286, 119234. doi: 10.1016/j.atmosenv.2022.119234
Thakrar, S. K., Balasubramanian, S., Adams, P. J., Azevedo, I. M. L., Muller, N. Z., Pandis, S. N., et al. (2020). Reducing mortality from air pollution in the United States by targeting specific emission sources. Environ Sci Technol Lett. 7, 639–645. doi: 10.1021/acs.estlett.0c00424
Travis, K. R., Jacob, D. J., Fisher, J. A., Kim, P. S., Marais, E. A., Zhu, L., et al. (2016). Why do models overestimate surface ozone in the Southeast United States? Atmos. Chem. Phys. 16, 13561–13577. doi: 10.5194/acp-16-13561-2016
Turner, M. C., Jerrett, M., Pope, C. A., Krewski, D., Gapstur, S. M., Diver, W. R., et al. (2016). Long-term ozone exposure and mortality in a large prospective study. Am. J. Respir. Crit. Care Med. 193, 1134–1142. doi: 10.1164/rccm.201508-1633OC
US EPA O (2015). 2011 National Emissions Inventory (NEI) Data. Available online at: https://www.epa.gov/air-emissions-inventories/2011-national-emissions-inventory-nei-data (accessed April 17, 2022).
US EPA O (2020). Estimating Emission Reductions from Travel Efficiency Strategies. Available online at: https://www.epa.gov/state-and-localtransportation/estimating-emission-reductions-travel-efficiency-strategies (accessed April 17, 2022).
van Donkelaar, A., Hammer, M. S., Bindle, L., Brauer, M., Brook, J. R., Garay, M. J., et al. (2021). Monthly global estimates of fine particulate matter and their uncertainty. Environ. Sci. Technol. 55, 15287–15300. doi: 10.1021/acs.est.1c05309
van Donkelaar, A., Martin, R. V., Brauer, M., Hsu, N. C., Kahn, R. A., Levy, R. C., et al. (2016). Global estimates of fine particulate matter using a combined geophysical-statistical method with information from satellites, models, and monitors. Environ. Sci. Technol. 50, 3762–3772. doi: 10.1021/acs.est.5b05833
Wang, Y., Bechle, M. J., Kim, S. Y., Adams, P. J., Pandis, S. N., Pope, C. A., et al. (2020). Spatial decomposition analysis of NO2 and PM25 air pollution in the United States. Atmos Environ. 241, 117470. doi: 10.1016/j.atmosenv.2020.117470
Westmancoat, D. (2023). Air Quality. C40 Cities. Available online at: https://www.c40.org/what-we-do/scaling-up-climate-action/air-quality/ (accessed July 8, 2022).
World Health Organization. (2016). Global Urban Ambient Air Pollution Database. World Health Organization. Available online at: http://www.who.int/airpollution/data/cities-2016/en/ (accessed April 25, 2020).
Yang, P., Zhang, Y., Wang, K., Doraiswamy, P., and Cho, S. H. (2019). Health impacts and cost-benefit analyses of surface O3 and PM25 over the US under future climate and emission scenarios. Environ. Res. 178, 108687. doi: 10.1016/j.envres.2019.108687
Zawacki, M., Baker, K. R., Phillips, S., Davidson, K., and Wolfe, P. (2018). Mobile source contributions to ambient ozone and particulate matter in 2025. Atmos. Environ. 188, 129–141. doi: 10.1016/j.atmosenv.2018.04.057
Keywords: adjoint, air quality, source attribution, PM2.5, ozone, NO2, urban
Citation: Nawaz MO, Henze DK, Anenberg SC, Ahn DY, Goldberg DL, Tessum CW and Chafe ZA (2023) Sources of air pollution-related health impacts and benefits of radially applied transportation policies in 14 US cities. Front. Sustain. Cities 5:1102493. doi: 10.3389/frsc.2023.1102493
Received: 18 November 2022; Accepted: 31 January 2023;
Published: 16 February 2023.
Edited by:
Thomas Krafft, Medicine and Life Sciences, Maastricht University, NetherlandsReviewed by:
Komal Shukla, Environment and Climate Change Canada (ECCC), CanadaChristopher Nolte, United States Environmental Protection Agency (EPA), United States
Copyright © 2023 Nawaz, Henze, Anenberg, Ahn, Goldberg, Tessum and Chafe. This is an open-access article distributed under the terms of the Creative Commons Attribution License (CC BY). The use, distribution or reproduction in other forums is permitted, provided the original author(s) and the copyright owner(s) are credited and that the original publication in this journal is cited, in accordance with accepted academic practice. No use, distribution or reproduction is permitted which does not comply with these terms.
*Correspondence: M. Omar Nawaz,  bXVoYW1tYWQubmF3YXpAY29sb3JhZG8uZWR1