 Rui Li1*
 Mikhail V. Chester1,2,3,4
 Ariane Middel4,5,6
 Jennifer K. Vanos3
 Danae Hernandez-Cortes3,7
 Isaac Buo8David M. Hondula4,5
- 1School of Sustainable Engineering and Built Environment, Arizona State University, Tempe, AZ, United States
- 2Metis Center for Infrastructure and Sustainable Engineering, Arizona State University, Tempe, AZ, United States
- 3School of Sustainability, Arizona State University, Tempe, AZ, United States
- 4Global Institute of Sustainability and Innovation, Arizona State University, Tempe, AZ, United States
- 5School of Geographical Sciences and Urban Planning, Arizona State University, Tempe, AZ, United States
- 6School of Arts, Media and Engineering and School of Computing, Informatics, and Decision Systems Engineering, Arizona State University, Tempe, AZ, United States
- 7School for the Future of Innovation in Society, Arizona State University, Tempe, AZ, United States
- 8Department of Geography, University of Tartu, Tartu, Estonia
Urban heat exposure is an increasing health risk among urban dwellers. Many cities are considering accommodating active mobility, especially walking and biking, to reduce greenhouse gas emissions. However, promoting active mobility without proper planning and transportation infrastructure to combat extreme heat exposure may cause more heat-related morbidity and mortality, particularly in future with projected climate change. This study estimated the effectiveness of active trip heat exposure mitigation under built environment and travel behavior change. Simulations of the Phoenix metro region's 624,987 active trips were conducted using the activity-based travel model (ABM), mean radiant temperature (TMRT, net human radiation exposure), transportation network, and local climate zones. Two scenarios were designed to reduce traveler exposure: one that focuses on built environment change (making neighborhoods cooler) and the other on travel behavior (switching from shorter travel time but higher exposure routes to longer travel time but cooler routes) change. Travelers experienced TMRT heat exposure ranging from 29°C to 76°C (84°F to 168°F) without environmental or behavioral change. Active trip TMRT exposures were reduced by an average of 1.2–3.7°C when the built environment was changed from a hotter to cooler design. Behavioral changes cooled up to 10 times more trips than changes in built environment changes. The marginal benefit of cooling decreased as the number of cooled corridors transformed increased. When the most traveled 10 km of corridors were cooled, the marginal benefit affected over 1,000 trips/km. However, cooling all corridors results in marginal benefits as low as 1 trip/km. The results reveal that heavily traveled corridors should be prioritized with limited resources, and the best cooling results come from environment and travel behavior change together. The results show how to surgically invest in travel behavior and built environment change to most effectively protect active travelers.
1. Introduction
Heat exposure is an increasing health risk in many cities. Maricopa County, Arizona, a rapidly expanding region in the hot and arid Sonoran Desert of the Southwest United States, has been a harbinger of cities with changing climates. In 2021, there were 104 days over 38°C (100°F) and 22 days over 43°C (110°F) (NOAA, 2021). Maricopa County reported 339 heat-associated deaths in 2021, a 220% increase from 2011 (Maricopa County Public Health, 2021). Rising summer temperatures, extended heatwave durations, and increasing population density contribute to the region's increasing heat morbidity and mortality (Hajat and Kosatky, 2010; Eisenman et al., 2016; Perkins-Kirkpatrick and Gibson, 2017). Climate change is expected to increase urban heat, exacerbating heat-related risks to health and quality of life among urban dwellers.
Promoting active trips has been used as a tool to curb climate change and reduce urban heat. Many cities have recognized that accommodating active mobility is necessary to reduce urban-induced anthropogenic greenhouse gas (GHG) emissions, which drive global climate change (Maizlish et al., 2013; Bhat et al., 2022; Braun and Fraser, 2022). In addition to potentially reducing GHG, encouraging active mobility can produce co-benefits for residents by increasing physical activities and reducing chronic disease (de Nazelle et al., 2010). However, active travelers are directly exposed to the outdoor thermal environment and have higher physical exertion compared with drivers (Hoehne et al., 2018), which increases the likelihood of heat stress. Promoting walking and biking without proper planning and transportation infrastructure to combat extreme heat exposure may increase future heat-related morbidity and mortality.
Considerable research has proved the local cooling effects of heat mitigation strategies. Heat mitigation strategies, such as increases in greenspace (Tan et al., 2017; Aminipouri et al., 2019; Yin et al., 2022), reflective and permeable pavements (Qin and Hiller, 2014), and cool roofs (Middel et al., 2015), have been shown to improve outdoor thermal comfort by reducing the neighborhood air temperature (Tair) and environmental radiation. The heat mitigation strategies are carried out in areas with a high-heat vulnerability index or with high ambient temperature readings (Sun et al., 2021), and simulations show that pedestrians get thermal comfort from the application of these mitigation strategies in the local environment (Taleghani et al., 2016). Previous research has shown that corridors with high ambient temperatures do not necessarily correspond to where people travel the most (Li et al., 2023), and travelers can get some relief from the heat by rerouting their travel path to be longer but cooler (Middel et al., 2014). However, estimating the cooling benefits for active trips considering travel behavior, including travel time, mode, and route choice, is still a rare topic. As cities with limited budgets aim to redesign the built environment to reduce urban dwellers' heat exposure and encourage outdoor active trips, there are lingering questions about where to implement cooling strategies so that the most vulnerable trips receive the most significant benefit.
This study estimates the effectiveness of personal outdoor active trip heat exposure mitigation at the nexus of environmental temperature, travel behavior, and the urban built environment. The specific objectives of this article are to (1) determine whether changing the built environment toward low-temperature configurations can significantly reduce heat exposure for walking and biking travelers, (2) estimate whether changing the travel behavior—rerouting people to cooler corridors—can reduce their heat exposure, and (3) find the marginal cooling benefits of both built environment and travel behavior change. To achieve these objectives, simulations of the Phoenix metropolitan area's daily travel are conducted using a mesoscale travel behavior and exposure model (Icarus) to test how changing the built environment and behavior can reduce heat exposure.
2. Methodology
Three sets of simulations were designed for this study to assess heat mitigation effects—a baseline simulation, a simulation of a built environment change, and a simulation of travel behavior change (Figure 1). All simulations are conducted in Icarus, a personal daily heat exposure simulation platform that estimates exposure considering each individual's activity and travel schedule, transportation infrastructure, environmental temperature, and the indoor/outdoor environment (Li et al., 2023). Two scenarios are designed to test the cooling effects of changing the built environment and travel behavior. Local climate zones (LCZ), which describe the built environment by characterizing geometric and land-cover patterns (Stewart and Oke, 2012), are introduced to identify the roadways with lower temperatures in each cooling scenario. This section describes the tool, datasets, scenario configurations, and analysis used. We first introduce Icarus, the adjustments made to the platform, and the data selected for this study before introducing the simulation scenario configurations.
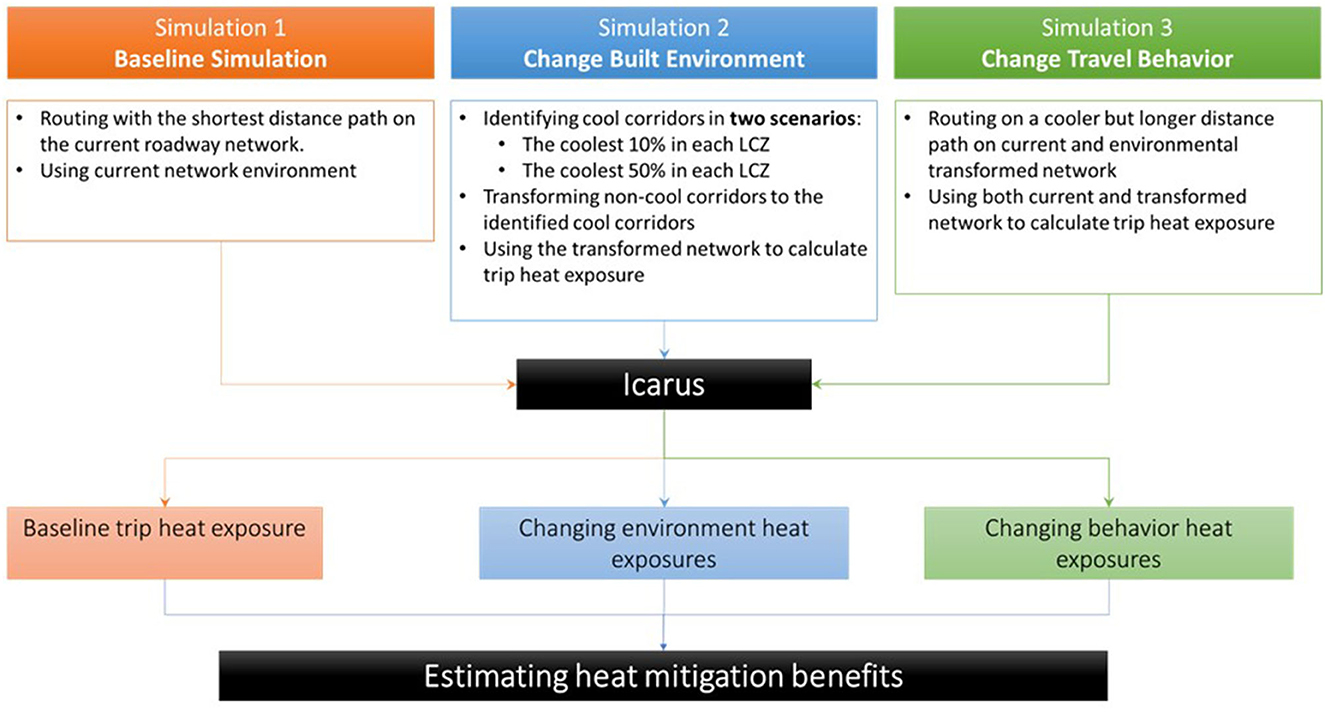
Figure 1. Simulations and scenarios.
2.1. Icarus model overview
The Icarus model is an environmentally augmented travel and activity simulation model developed to estimate people's heat exposure during a typical workday (Li et al., 2023). When data are inputted, Icarus first constructs a transportation network with the spatial–temporal temperature information and then extracts each person's daily travel and activity schedule in the simulation. Based on the travel schedule, Icarus routes trips in the transportation network. Then, personal heat exposures are calculated based on the environmental temperature (air and radiant) at the location where the activities and trips occur. The population-scale results describe population demographic, behavior, and infrastructure characteristics.
Icarus requires activity-based model (ABM) output from metropolitan planning organization travel models. First, the ABM data are used to describe travel-activity chains, agents, trips, and locations. The ABM data provide trip origins and destinations (O/D) described through either traffic or micro-analysis spatial zones (TAZ or MAZ). A MAZ or TAZ contains dozens to hundreds of buildings, and the routing of trips requires precise start and end locations. As such, a building parcel dataset, which provides the location and land-use information, is introduced to downscale the O/D from the TAZ or MAZ level to the parcel level. However, a transportation network dataset, which contains the location of the roadway and allowed travel mode, is used as the base for routing the trips. Environmental temperature datasets with spatial–temporal readings are needed to calculate the heat exposure. Icarus ingests various commonly used temperature measurements, such as air temperature, mean radiant temperature (TMRT), and wet-bulb globe temperature (WBGT). Air temperature quantifies exposure without considering wind, radiance, and humidity. TMRT measures temperature by considering the sum of all short- and long-wave radiations exposed to a human body (Lindberg et al., 2008; Middel and Krayenhoff, 2019). Finally, WBGT, which is widely used in heat stress indexes, includes the impacts of humidity and wind in addition to air temperature (Budd, 2008; OSHA, 2015).
2.2. Simulation configuration
Only outdoor trips are considered as this is when travelers directly interact with environmental heat, whereas in-vehicle trips are more likely to have an air-conditioning controlled temperature. TMRT is used to calculate personal heat exposure during these outdoor trips. Compared with air temperature and WBGT, TMRT more accurately describes the physiological impacts of heat that people experience in a hot, dry outdoor environment (Middel and Krayenhoff, 2019). Temperature-weighted pathfinding is then used to allow agents reroute to cooler corridors. With the origin (s), target (t), and the cost (wij) for each edge (i, j) in the network, the path choice follows (Equations 1–3),
where H is the time stamp. In this study, H ranges from 7 am to 8 pm with a 15-min time step, and Lij is the length of edge ij. A “comfort over distance” parameter a is introduced from the study by Middel et al. (2017) to control for the importance of thermal comfort in routing. This study sets a equal to 1 if the pathfinding considers thermal comfort, thus minimizing average TMRT exposure. Alternatively, a equals 0 if the pathfinding minimizes physical distance regardless of exposure. The shortest path is the collection of edges where xij equals 1. The heat exposure calculation considers the average TMRT a trip experiences along the route. Throughout the article, we use the term “heat exposure” to refer to the TMRT exposure of an individual. Finally, LCZs for the Phoenix metropolitan area are introduced to identify roadways with low or high TMRT in each climate zone. LCZs are areas with similar features, such as land surface cover and material, building structure, and population activity (Stewart and Oke, 2012). Each LCZ class describes either the built environment type or the land-cover type of the area (Wang et al., 2018). The data used in this study are detailed in the following sections.
2.2.1. Data
2.2.1.1. ABM and assessor parcel data
The Maricopa Association of Governments (MAG) (Vovsha et al., 2011) provided the ABM for a synthetic population of 3.8 million travelers and 18.6 million trips for Maricopa County, Arizona. In general, 13% (504,961) of the 3.8 million people in the ABM had walking or biking trips in their daily schedule. The ABM is generated from the 2010 National Household Travel Survey (Parsons Brinckerhoff, 2010). In the ABM, 93.61% (17.41 million) of the trips were in-vehicle, 5.6% (1.05 million) were walking, and 0.79% (148,541) were biking. The MAG ABM gives the activity location in the micro-analysis zone (MAZs).
The Maricopa County assessor database (Maricopa County Assessor's Office, 2018) is introduced to downscale the trip origin and destination from the MAZs to parcels. The assessor database provides detailed information regarding the location and function of each parcel. The parcels are tagged with the MAZ information by spatially joining fine-scale assessor data with the MAZ map. Icarus randomly assigns O/D, marked as MAZ in ABM, to parcels within the same MAZ.
2.2.1.2. Temperature data
Hourly 1-m resolution TMRT raster layers provided by Buo, Sagris, Jaagus and Middel (under review) are used to estimate exposures at fine scales during travel. As explained earlier, TMRT represents the total heat load on the human body (Middel and Krayenhoff, 2019). It is a critical parameter that controls the thermal comfort of humans and the human energy balance (Lindberg et al., 2008). The probability of humans suffering from heat stress is higher when TMRT at a location is higher than air temperature due to direct sun exposure. TMRT was simulated for 27 June 2012, and TMRT ranges from 29°C (84°F) to 85°C (185°F). The layers were modeled using the solar longwave environmental irradiance geometry (SOLWEIG) model proposed by Lindberg et al. (2008). The primary input for the model was digital surface models and meteorological forcing data from the Arizona Meteorological Network Encanto Park weather station (AZMet, 2022). The digital surface models were created using the triangulated irregular networks algorithm with high-resolution light detection and ranging (LiDAR) point cloud data from the United States Geological Services (USGS). SOLWEIG models radiation in six directions (up, down, and the four cardinal directions) according to the concepts established by Höppe (1992). The suitability of SOLWEIG to make TMRT estimations in complex urban configurations with acceptable accuracies for thermal comfort studies is well documented. TMRT values before sunrise and after sunset are assumed to be equal to air temperature extrapolated from Daymet (Thornton et al., 2016; Li et al., 2023). The air temperature on the simulation day ranged between 29°C (84°F) and 43°C (110°F).
2.2.1.3. Local climate zones data
A 100-m resolution local climate zones (LCZ) raster layer created by Wang et al. (2018) is used to characterize archetypical infrastructure designs and their effects on heat. Using the definition and surface property values of LCZs proposed by Stewart and Oke (2012), the Phoenix metropolitan area is classified into seven built environment type LCZs and seven land-cover type LCZs using Google Earth, Saga GIS, and Landsat eight scenes data (Wang et al., 2018). Built environment type LCZs identified in the Phoenix metropolitan area include LCZ 4 (open high rise), 5 (open midrise), 6 (open low rise), 7 (lightweight low rise), 8 (large low rise), 9 (sparsely built), and 10 (heavy industry). The land-cover type LCZs identified are A (dense trees), B (scattered trees), C (bush, scrub), D (low plants), E (bare rock or paved), F (bare soil or sand), and G (water). In general, 46.7% of the Phoenix metropolitan area is bare soil or sand (LCZ F), and 33.1% are open low-rise buildings (LCZ 6).
2.2.1.4. Street network
A roadway network of 32,047 km is extracted from OpenStreetMap (OpenStreetMap Contributors, 2015) and ingested in the simulation. The network consists of arterials, local roads, and bike and pedestrian trails.
2.2.2. Study area
This study focuses on 2,070 km2 (800 square miles) of the urbanized Phoenix metro region, a 6% area of the Phoenix metropolitan area (Figure 2). In general, 48% of the study area is open low-rise buildings (LCZ 6), 15% is large low-rise buildings (LCZ 8), and 27% is bare soil or sand (LCZ F) (Wang et al., 2018). The study area covers 54% (271,272) of the population who have walking or biking trips on their agenda, and 624,987 active trips are considered in the simulation. The simulation date is 27 June 2012, the same as the TMRT simulated date. Moreover, the simulation assumes the population and travel pattern remained the same in 2012, although the MAG ABM is based on the 2010 survey.

Figure 2. Study area (A) and the LCZs in the study area (B).
2.3. Simulations
Three simulations were conducted to assess heat mitigation effects—the baseline, built environment change, and travel behavior change. The baseline simulation profiles the current heat exposure and travel behavior, while the changing built environment and behavior simulations are considered to compare their heat reduction benefits. The baseline simulation captures heat exposure of active (walking and biking) trips as they prioritize the shortest travel distance. Two cooling scenarios are selected in the changing environment simulation to compare the different levels of heat mitigation intensities. Travelers can also reduce their heat exposure by changing their travel behavior and rerouting to a cooler path with some extra distance. The rerouting is achieved by applying the temperature-weighted shortest distance pathfinding algorithm.
2.3.1. Simulation 1—Baseline
The baseline simulation profiles the synthetic population's heat exposure and identifies where people travel in the current network. Icarus simulates travelers' heat exposure by extracting trips and their O/D from the MAG ABM and Maricopa County assessor database, then routing the shortest distance path of trips on the roadway network (Li et al., 2023). The TMRT and air temperature are parsed to the streets by spatially joining the temperature raster layers to the transportation network. The temperature on each street is a sequence of readings in 15-min intervals for a total of 24 h. Trip heat exposure is calculated as the average temperature along the path.
The baseline simulation represents the current environmental condition, and the calculated heat exposure results are used to compare the cooling effects in changing environments and travel behavior simulation. The shortest distance path generated in the baseline simulation is used to identify the network's link flow, which is the number of trips passing through a section of the roadway during the simulation day. The link flow is used to identify the corridors to cool down in the changing environment simulation.
2.3.2. Simulation 2—Built environment change
Simulation 2 assumes that neighborhoods can be converted to low-temperature configurations and calculates personal heat exposures after a proportion of the street-built environment changes. The high-resolution TMRT captures the heterogeneity of temperature within the street network. From the TMRT, LCZ, and roadway data, each corridor's temperature in the same LCZ is a statistical distribution at a given time. Built environment change embraces the following assumptions. First, roadways with high temperatures can be cooled down to the low-temperature corridors in the same LCZ. Second, when corridors are selected for cooling, their TMRT can be cooled to the mean TMRT of the low-temperature corridors in the same LCZ. Third, trips still chose the shortest distance path between the O/D.
The environmental change simulations first identify the cool corridors that are the roadway sections with the lowest TMRT in each LCZ. The LCZs are assigned to street sections by overlaying the LCZ raster layer over the transportation network. At the same time, the corridors average TMRT from 7 am to 8 pm when the TMRT is available is calculated. The reason to consider the average TMRT is that the temperature readings fluctuated during the day. Two scenarios are considered when choosing the low-temperature corridors in each LCZ to resemble different cooling levels. In scenario 1, the cool corridors are the coolest 10% of roadways in each LCZ. In scenario 2, roadways with the lowest 50% average TMRT are selected as cool corridors. The selection of cool corridors excludes outliers identified with the 1.5xIQR rule where a numerical fence was built by taking 1.5 times the interquartile range. The mean TMRT of the identified cool corridors subset is calculated and assumed to be the target temperature for non-cool corridors to achieve.
After identifying the cool corridors, the rest of the roadway network is evaluated for transformation. An incremental approach is used to transform the network from non-cool to cool. We only convert 1 km of the most traveled non-cool network in the first increment. In subsequent increments, we increase the length of non-cool corridor to perform the environmental change. All non-cool corridors used in the baseline simulation will have environmental change. The candidate non-cool roadways are chosen according to the link flow in the baseline simulation and prioritizing the most traveled links. The TMRT of selected non-cool corridors is converted to the target temperature calculated in the cool corridor identification process based on the LCZ. Trip heat exposure is then calculated using the updated TMRT.
2.3.3. Simulation 3—Travel behavior change
In a heterogeneous local heat environment, where the built environment could impact the street temperature, active travelers may choose a longer but cooler route to avoid excessive heat exposure. The behavior change is simulated by rerouting travelers on the temperature-weighted network. The simulation starts with creating a temperature-weighted network. The temperature used in the weighted network is the sum of TMRT from 7 am to 8 pm on each roadway. The rerouting process is carried out on the baseline simulation, and a section of the network is cooled every time. The heat exposure is calculated after each round of behavior-changing routing.
2.4. Cooling benefits analysis
The cooling benefits of environment and travel behavior change are measured by comparing population heat exposure among the three simulations. The number of cooled trips and the average temperature reduction are considered. Two more concepts are introduced to quantify the cooling benefit—the marginal benefit and the magnitude of cooling for the hottest 20% trips. The marginal benefits, which are used to evaluate the effectiveness of the infrastructure improvement, consider the number of trips that get cooled for every kilometer of the roadway network improvement. The marginal benefits are calculated as the change in the total number of trips cooled divided by the change in the length of the network cooled. High-temperature exposure is highly related to health risks, and the cooling benefits of high-heat exposure trips are important to consider. This study classifies the hottest 20% of trips in the baseline simulation as high exposure. The minimum temperature of the high-exposure trips is selected as the hottest trip threshold. The effectiveness of cooling down the current hottest trips in the changing environment and through travel behavior is checked by comparing the ratio of trips with heat exposure surpassing the hottest trip threshold.
3. Results
3.1. Baseline simulation and current build environment
Travelers were under high TMRT exposure in the baseline simulation. Trip heat exposure ranged from 29°C to 76°C (84°F to 168°F) with a median temperature of 61°C (142°F). The heat exposure represents the average TMRT traveler experienced during active outdoor trips. Most simulated active trips experienced high TMRT, and 20% were above 66.5°C (151°F). The reasons for high trip heat exposures were that the TMRT considered the environmental radiance, such as solar radiation, on the human body, and more trips happening during the daytime (Li et al., 2023) when solar radiation was high. The TMRT equaled air temperature as 29°C (84°F) after dusk and before dawn when there was no direct sunlight. The medium simulated walking and biking trip distances are 1.6 km (1 mile).
Considering the imbalance of usage within the network and across the LCZs, cooling down the most traveled corridors could benefit more people and trips. The active outdoor trips were concentrated in a small portion of the network. The 624,987 active trips utilized 62% (19,863 km) of roadway links. Only 10% (3,178 km) of the network had over 100 trips in the simulation. The busiest 200-m corridors in Tempe, where the Arizona State University Campus is located, had 7,000 to 7,700 trips per day. The selection of hot corridors considered roadway temperature and the network's usage in the baseline simulation. In scenario 1 (cooled to the coolest 10th percentile in the LCZ), 18,411 km of roadways were candidates for environmental change, as they have been visited at least once in baseline simulation and were not included in the cool corridor selections. In scenario 2 (cooled to the coolest 50th percentile in the LCZ), 10,409 km of the network were candidates for environmental change.
Roadways in the study area are mainly located in LCZs with buildings. The build-type LCZs, such as LCZ 6 (open low rise) and LCZ 8 (large low rise), account for 65% of the study region but have over 87% of the roadways in them (Table 1). The natural land-cover climate zones, such as LCZ F (bare soil or sand) and LCZ D (low plants), occupy 35% of the study region, but only 12% of roadways are identified in these LCZs (Table 1). This aligns with the trend of urbanization, where more roadways are built in the developed region with buildings. Compared with bare soil, sand, or sparsely built LCZs (LCZ F and LCZ 9), more trips happened on roadways in regions with midrise or low-rise buildings (LCZ 5, LCZ 6, and LCZ 8) or plants (LCZ D) (Table 1). Active travelers only used 5% of roadways in LCZ 9 and 29% of roadways in LCZ F, but they visited as much as 66% of networks in LCZ 6, 61% in LCZ D, 50% in LCZ 5, and 48% in LCZ 8.
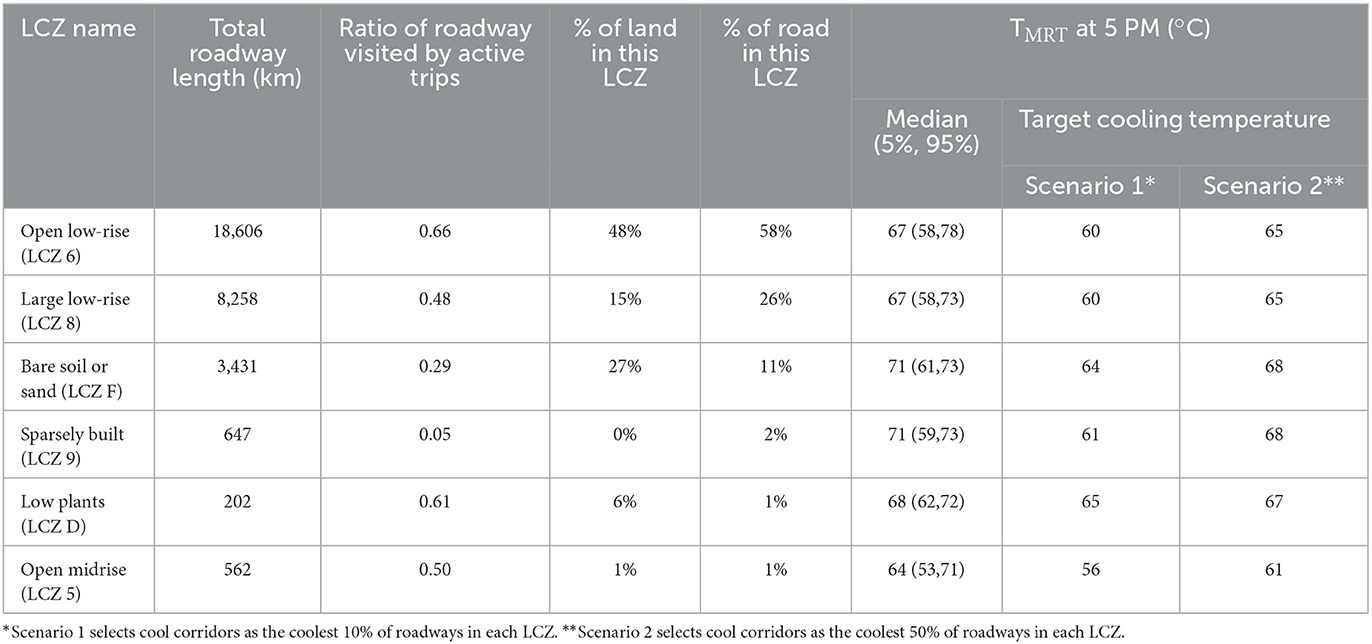
Table 1. Proportion of land, corridors, current, and target TMRT in each LCZ.
The TMRT in regions with middle- to low-rise buildings and plants (LCZ 5, LCZ 6, LCZ 8, and LCZ D) is lower than in regions with sparse buildings or bare soil (LCZ 9 and LCZ F) (Table 1). The TMRT was simulated with the shading from trees, buildings, and pavement environmental radiations. The higher shading ratio is linked to lower TMRT (Middel et al., 2021), and in LCZs with buildings present (5, 6, and 8), the shading from buildings or trees significantly reduces the local TMRT. The median TMRT value in these LCZs at the hottest time (5 PM) was 4 to 7°C cooler than LCZs with little vegetation and few buildings (F and 9). On the contrary, the LCZ with no buildings or sparse building present had a high median TMRT. Cool corridor selection was purely based on the statistics of TMRT in each LCZ, regardless of the usage of corridors in the baseline simulation. Cool corridors in scenario 1 (the coolest 10% corridors) had a lower TMRT compared with scenario 2 (the coolest 50% corridors). Since the TMRT value is related to environmental factors that impact the radiant, such as shading and pavement types, more efforts would be needed to cool the corridors from scenario 2 to scenario 1, such as increasing tree planting or permeable pavement.
3.2. The number of cooled trips
In the same cooling scenario, behavioral change cooled as much as 10 times more trips than built environment change and the best temperature reduction comes from changing both the environment and travel behavior. The behavioral change simulations, marked as the solid lines in Figure 3, supposed that the traveler detoured to a cooler temperature but longer distance path. Approximately 2–4% of the active trips got a temperature reduction from environment change when converting the most traveled 2 km in the network to cooler configurations (dashed lines in Figure 3). In general, 36–37% of trips got reduced exposure from changing behavior, and the average trip distance increased by 10.5 m on the 2 km cooled network (solid lines in Figure 3). However, the behavior change cooled a similar number of trips compared with environment change when cooled all corridors. Therefore, 76% of trips were cooled from environmental and behavior change in scenario 1 (blue dashed and solid lines in Figure 3). The length of corridors cooled significantly impacted the number of trips that got heat mitigation. As the total length of cooled corridors increased, the number of trips cooled increased (Figure 3). However, 70% of trips got cooled when changing all traveled roadways to scenario 2 (where corridors are cooled to the coolest 50th percentile in the LCZ). An additional 6% of trips had exposure reduction when all traveled roadways were converted to scenario 1 (cooled to the coolest 10th percentile in the LCZ).
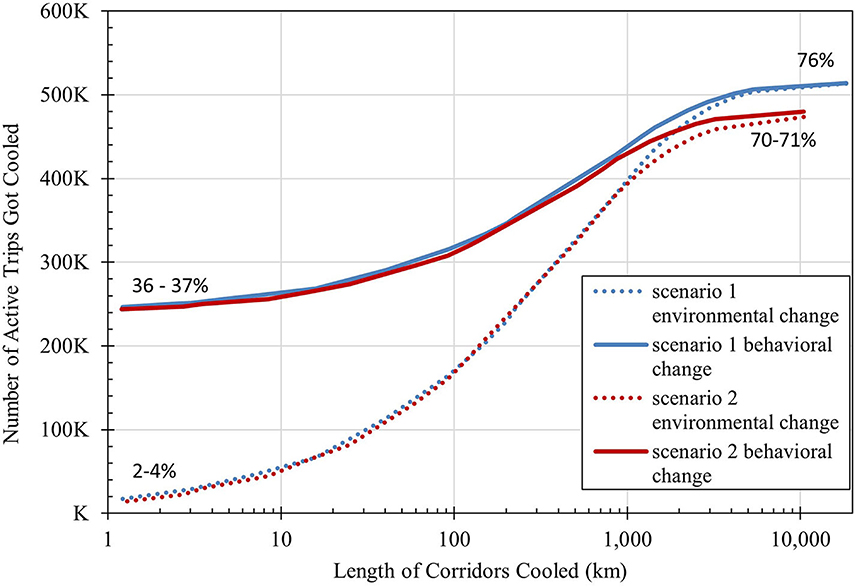
Figure 3. Number of active trips cooled by environmental and behavioral change. The x-axis represents the total length of the network selected to obtain environment change. The y-axis represents the total number of trips to obtain heat exposure mitigation. The blue lines represent the street's cooling condition in scenario 1 where the roadways' temperature is reduced to the lowest 10%. The red lines represent the street's cooling condition in scenario 2 where the roadways' temperature is reduced to the lowest 50%.
3.3. Trip temperature reduction
Under the same cooling scenario, the length of corridors cooled significantly impacts the heat exposure reduction. The average trip's heat exposure reduction was nearly zero when the most traveled 2 km roadways got cooled and travelers stayed on the shortest distance path. The heat exposure of active trips was reduced by 0.25°C when travelers were routed in the 2 km cooled network. The heat exposure reduction increased as more corridors got cooled. When all corridors were cooled, trips got an average of 3.7°C heat exposure reduction in scenario 1 and 1.2°C in scenario 2. The average heat exposure reduction was higher in behavior change simulations compared with environmental change simulations. In Figure 4, this is shown as the solid lines above the dashed lines in the same scenario.
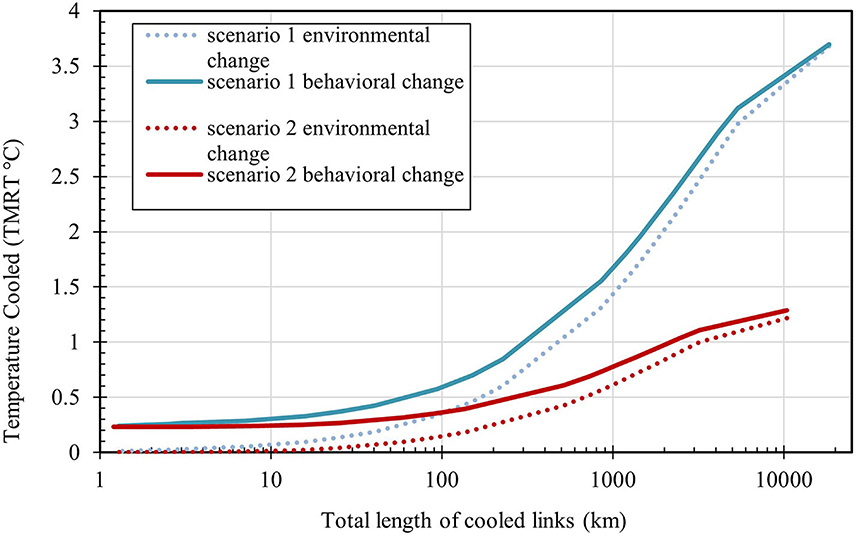
Figure 4. Average trips' heat exposure reduction by changing environment and travel behavior. The x-axis represents the total length of the network selected to get environment change. The y-axis represents the average temperature reduced for all trips. The blue lines represent the street's cooling condition in scenario 1 where the roadways' temperature is reduced to the lowest 10%. The red lines represent the street's cooling condition in scenario 2 where the roadways' temperature is reduced to the lowest 50%.
Comparing the two cooling scenarios, heat exposure reduction was more significant in scenario 1 than scenario 2, especially when the environment change was carried out over a long network distance. When all roadways cooled, trips' heat exposure was reduced in scenario 1 by three times more than in scenario 2. However, the behavioral change simulations in scenario 2 (red solid line in Figure 4) produced more heat exposure reduction compared to scenario 1 with the built environment changing (blue dashed line in Figure 4) when < 80 km of the network got shifted to a cooler environment.
3.4. Cooling benefits of behavioral change
The behavioral change simulations resulted in more benefits to active travelers than the environmental change when part of the network became cooler. Cooling down the network partially created low-temperature spots in the transportation system. These low-temperature corridors attracted agents who traveled on the nearby roadways in the baseline simulation to detour from their shortest path to get heat exposure mitigation. By examining the ratio of trips that got heat exposure mitigation from behavior change, 93–94% of these trips benefited from detouring the nearby cooler corridors when the 1 km network switched to a cooled environment (Figure 5). The dominant cooling benefits of behavior change were also demonstrated as their heat exposure mitigation curves (solid lines in Figures 2, 3) outperformed the environment change (dashed lines in Figures 2, 3) in the same scenarios when the network got partially cooled. The environmental temperature became homogenous in the same LCZ when all non-cool corridors were transformed according to the setting. At this point, only a tiny portion of trips (< 1%) was still rerouting across the LCZs, but most agents stopped detouring to the neighborhood corridors and stayed on the shortest distance route (Figure 4). This is demonstrated as the heat exposure mitigation from behavior change became close to the environment change in Figures 2, 3 when all non-cool corridors were transformed. Half of the cooled trips benefited from rerouting when 80 km of the network shifts to a cool environment (Figure 5).
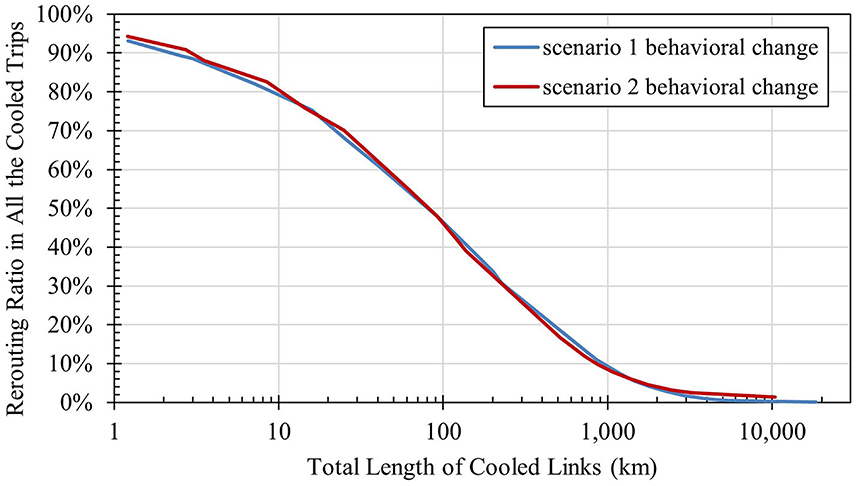
Figure 5. Ratio of trips cooled by rerouting under different cooled networks. The x-axis represents the total length of the network selected to get environment change. The y-axis represents the ratio of trips that get heat mitigation benefits from rerouting. The blue line represents the street cooling condition in scenario 1 where the roadways' temperature is reduced to the lowest 10%. The red line represents the street's cooling condition in scenario 2 where the roadways' temperature is reduced to the lowest 50%.
3.5. Marginal benefits from changing environment and behavior
The marginal benefit of changing the environment and travel behavior, shown in Figure 6, is the number of trips that cooled down for every kilometer of additional length of roadways transformed. The marginal benefit of the number of trips that got heat mitigation decreased as more of the network was cooled, revealing that limited resources might be prioritized on heavily traveled corridors. Over 1,000 to 10,000 trips got cooled for every kilometer of corridor environment change when < 10 km of corridors was converted to a cool environment (Figure 6). When the total length of cooled corridors was above 1,500 km, the marginal benefits quickly dropped to below 100 trips and got cooled per kilometer of corridors' environment change. Ultimately, the marginal benefit reached 1 trip/km when all corridors transformed into a cool environment. The diminished marginal benefit curves demonstrated that switching long-distance corridors to cool was not as effective as changing the most traveled portion of the network to cooler environment.
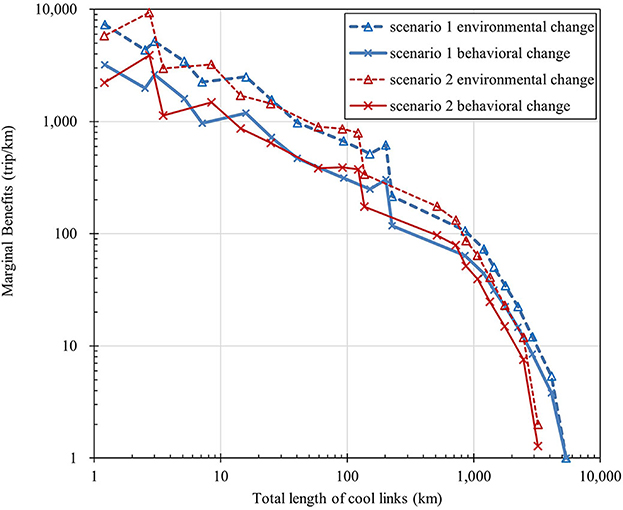
Figure 6. Marginal benefits of changing environment and travel behavior. The x-axis represents the total length of the network selected to get environment change. The y-axis represents the total number of trips to get heat exposure mitigation. The blue lines represent the street cooling condition in scenario 1 where the roadways' temperature is reduced to the lowest 10%. The red lines represent the street's cooling condition in scenario 2 where the roadways' temperature is reduced to the lowest 50%.
3.6. Heat exposure mitigation of very hot trips
The cooling effects were especially effective in reducing the heat exposure of the hottest 20% of trips. In total, 20% of active trips were exposed to 66.5–76°C (151–168°F) TMRT degrees in the baseline scenario. Changing the built environment and travel behavior reduced the ratio of very hot trips from 20% to 13% (Figure 7) in scenario 2. In scenario 1, where all non-cool corridors were converted, all trips' exposures were below 66.5°C (151°F). Combining rerouting with a cooled environment can create more opportunities for hot trips to get cooled under the high-exposure threshold (Figure 7). When the total length of corridors cooled down is less than 80 km, behavior change in scenario 2 was more effective in mitigating very hot exposures than just the environmental change in scenario 1.
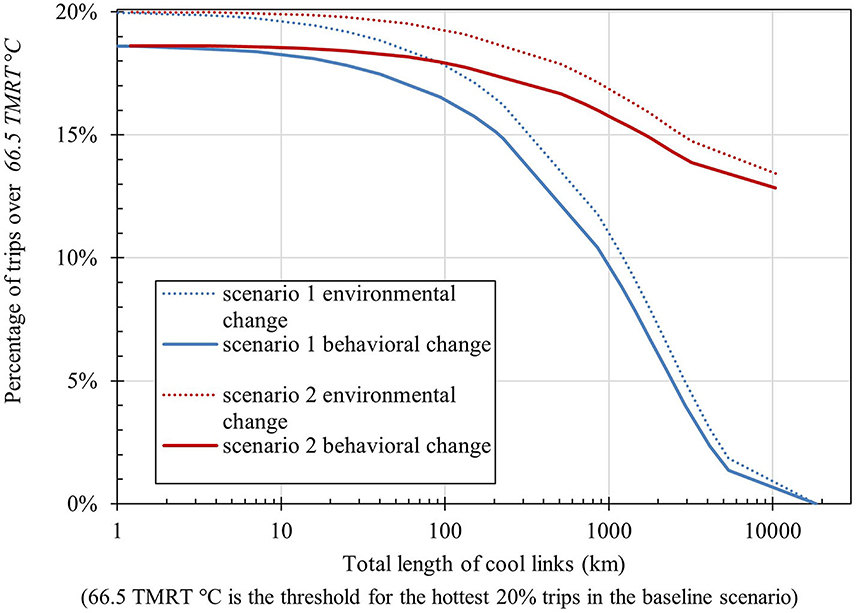
Figure 7. Cooling of the hottest 20% trips. Hottest trips are defined as heat exposure over 66.5°C. The y-axis represents the percentage of trips that have their heat exposure over 66.5°C. The blue lines represent the street's cooling condition in scenario 1 where the roadways' temperature is reduced to the lowest 10%. The red lines represent the street's cooling condition in scenario 2 where the roadways' temperature is reduced to the lowest 50%.
4. Discussions and conclusion
We developed a methodology to estimate personal heat exposure mitigation based on the combined heat-travel modeling for urban trips. Our approach is novel in that it combines the state-of-the-art mesoscale traffic model, TMRT estimations, urban land classifications, and land-use data to estimate personal heat exposure for entire populations. Personal heat exposure estimates, presented as the average TMRT a traveler experiences during the trip, can be used to derive the population-scale cooling benefits when joined with transportation network changes to a lower temperature built environment, or travelers' route to low-temperature corridors.
The results confirm prior efforts in personal heat exposure studies that individual-level heat exposure provides more precise insights into how people encounter heat conditions (Kuras et al., 2017; Hondula et al., 2021). Previously, population-level heat exposure studies focused on thermal temperatures and heat vulnerability indexes (Conlon et al., 2020; Sun et al., 2021), regardless of people and infrastructure interactions. The personal heat exposure analysis in this study found that the high thermal temperature lands, such as the sparse building (LCZ 9) and bare soil or sand (LCZ F), are less visited by travelers. Meanwhile, active trips utilized 48% to 66% of networks in LCZs with buildings (LCZ 5, LCZ 6, and LCZ 8) or plants (LCZ D), which also have a lower thermal temperature than LCZ 9 and LCZ F in the region. The personal heat exposure study also opens opportunities to compare the heat mitigation benefits of changing the built environment and travel behavior and suggests combining environmental with behavioral change to get the greatest heat mitigation benefits.
Despite the novelty, this research contains several limitations. Due to population growth, the 2010 ABM data used for the analysis underestimate the number of active trips and the cooling benefit from changing behavior and built environment. While the ABM estimated 3.8 million travelers in Maricopa County, the current population of Maricopa County has grown to 4.5 million in 2022 (United States Census Bureau, 2022). In addition, travel behavior shifts during the COVID-19 pandemic, such as more frequent active trips for pleasure (Matson et al., 2022), are not considered in this study. The personal heat exposure in the model only considers the temperature exposure and the heat stress from the environment but neglects individual strain. The personal heat strain results from the physiological responses to heat stress (ACGIH, 2019). Acclimation, clothing, gender, age, and health conditions affect heat strain (Glass et al., 2015; ACGIH, 2019). Considering such sociological matrices would be essential to understand people's resilience when facing heat hazards and could be incorporated into Icarus in future. Mechanistic models, which simulate human physiological and thermoregulation—considering individual activities, gender, race/ethnicity, and age—would be valuable tools for estimating personal heat strain (Glass et al., 2015). In addition to the limitations of the personal heat exposure model, the built environmental change simulations in this study only considered the simulated TMRT regardless of the configurations of the infrastructure, such as the ratio of trees, pavement types, and building types. Knowing the street configuration of the infrastructure would be useful to estimate the budget for transforming the corridors into a cooler environment and will be included in future research.
Active travel has been considered the most sustainable transportation mode and has been emphasized to shift travelers away from automobiles (Nahlik and Chester, 2014; Matute and Chester, 2015). Cities with heavy car dependence have significant potential to incentivize residents to shift to active trips (Kimball et al., 2013). However, the extreme heat during the summer in cities, such as Phoenix, limits people's willingness to go outdoors. In addition, traveling in extreme heat poses public health risks (Putnam et al., 2018). Cities in arid and hot areas have implemented heat exposure mitigation initiatives to combat the increasing heat-related illness and discomfort among residents (City of Mesa, 2014; Phoenix, 2021). Our results can provide critical information for cities to carry out heat mitigation plans.
Data availability statement
The raw data supporting the conclusions of this article will be made available by the authors, without undue reservation.
Author contributions
RL, MC, AM, JV, and DH: conceptualization. RL, MC, and AM: methodology. RL, AM, IB, and MC: data collection. RL: analysis. RL and IB: writing of the original draft. RL, MC, AM, JV, DH-C, and DH: writing, reviewing, and editing. All authors contributed to the article and approved the submitted version.
Funding
This research was funded by the National Science Foundation, award numbers 1635490 (A Simulation Platform to Enhance Infrastructure and Community Resilience to Extreme Heat Events) and CMMI-1942805 (CAREER: Human Thermal Exposure in Cities—Novel Sensing and Modeling to Build Heat-Resilience).
Acknowledgments
We would like to express our gratitude to MAG for providing the ABM data.
Conflict of interest
The authors declare that the research was conducted in the absence of any commercial or financial relationships that could be construed as a potential conflict of interest.
Publisher's note
All claims expressed in this article are solely those of the authors and do not necessarily represent those of their affiliated organizations, or those of the publisher, the editors and the reviewers. Any product that may be evaluated in this article, or claim that may be made by its manufacturer, is not guaranteed or endorsed by the publisher.
Author disclaimer
Any opinions, findings, and conclusion or recommendations expressed in this material are those of the authors and do not necessarily reflect the views of the sponsoring organizations.
References
ACGIH (2019). TLVs and BEIs: Based on the Documentation of the Threshold Limit Values for Chemical Substances and Physical Agents and Biological Exposure Indices. Cincinnati, OH: ACGIH.
Aminipouri, M., Knudby, A. J., Krayenhoff, E. S., Zickfeld, K., and Middel, A. (2019). Modelling the impact of increased street tree cover on mean radiant temperature across Vancouver's local climate zones. Urban For. Urban Green. 39, 9–17. doi: 10.1016/j.ufug.2019.01.016
AZMet (2022). State Weather Summary. Available online at: https://azmet.arizona.edu/azmet/data/00sum.htm (accessed December 14, 2022).
Bhat, T. H., Farzaneh, H., and Toosty, N. T. (2022). Co-benefit assessment of active transportation in delhi, estimating the willingness to use nonmotorized mode and near-roadway-avoided PM2.5 exposure. Int. J. Environ. Res. Public Health 19, Article 22. doi: 10.3390/ijerph192214974
Braun, R. A., and Fraser, M. P. (2022). extreme heat impacts on the viability of alternative transportation for reducing ozone pollution: a case study from Maricopa County, Arizona. Weather Clim Soc. 14, 905–917. doi: 10.1175/WCAS-D-21-0158.1
Budd, G. M. (2008). Wet-bulb globe temperature (WBGT)—its history and its limitations. J. Sci. Med. Sport 11, 20–32. doi: 10.1016/j.jsams.2007.07.003
Buo, I. N., Sagris, V., Jaagus, J., and Middel, A. (under review). High-resolution thermal exposure shade maps for cool corridor planning. Sustain. Cities Soc. in press.
City of Mesa (2014). Mesa 2040 General Plan. City of Mesa. Available online at: https://www.mesaaz.gov/home/showdocument?id=12298 (accessed November 2, 2022).
Conlon, K. C., Mallen, E., Gronlund, C. J., Berrocal, V. J., Larsen, L., O'neill, M. S., et al. (2020). Mapping human vulnerability to extreme heat: a critical assessment of heat vulnerability indices created using principal components analysis. Environ. Health Perspect. 128, 1–14. doi: 10.1289/EHP4030
de Nazelle, A., Morton, B. J., Jerrett, M., and Crawford-Brown, D. (2010). Short trips: an opportunity for reducing mobile-source emissions? Transp. Res. Part D Transp. Environ. 15, 451–457. doi: 10.1016/j.trd.2010.04.012
Eisenman, D. P., Wilhalme, H., Tseng, C.-H., Chester, M., English, P., Pincetl, S., et al. (2016). Heat death associations with the built environment, social vulnerability and their interactions with rising temperature. Health Place 41, 89–99. doi: 10.1016/j.healthplace.2016.08.007
Glass, K., Tait, P. W., Hanna, E. G., and Dear, K. (2015). Estimating risks of heat strain by age and sex: a population-level simulation model. Int. J. Environ. Res. Public Health 12, Article 5. doi: 10.3390/ijerph120505241
Hajat, S., and Kosatky, T. (2010). Heat-related mortality: a review and exploration of heterogeneity. J. Epidemiol. Commun. Health 64, 753–760. doi: 10.1136/jech.2009.087999
Hoehne, C. G., Hondula, D. M., Chester, M. V., Eisenman, D. P., Middel, A., Fraser, A. M., et al. (2018). Heat exposure during outdoor activities in the US varies significantly by city, demography, and activity. Health Place 54, 1–10. doi: 10.1016/j.healthplace.2018.08.014
Hondula, D. M., Kuras, E. R., Betzel, S., Drake, L., Eneboe, J., Kaml, M., et al. (2021). Novel metrics for relating personal heat exposure to social risk factors and outdoor ambient temperature. Environ. Int. 146, 106271. doi: 10.1016/j.envint.2020.106271
Höppe, P. (1992). Ein neues Verfahren zur Bestimmung der mittleren Strahlungstemperatur im Freien [a new method to determine the mean radiation temperature outdoors]. Wetter Und Leben 44, 147–151.
Kimball, M., Chester, M., Gino, C., and Reyna, J. (2013). Assessing the potential for reducing life-cycle environmental impacts through transit-oriented development infill along existing light rail in Phoenix. J. Plan. Educ. Res. 33, 395–410. doi: 10.1177/0739456X13507485
Kuras, E. R., Richardson, M. B., Calkins, M. M., Ebi, K. L., Hess, J. J., Kintziger, K. W., et al. (2017). Opportunities and challenges for personal heat exposure research. Environ. Health Perspect. 125, 085001. doi: 10.1289/EHP556
Li, R., Chester, M. V., Hondula, D. M., Middel, A., Vanos, J. K., and Watkins, L. (2023). Repurposing mesoscale traffic models for insights into traveler heat exposure. Transp. Res. Part D Transp. Environ. 114, 103548. doi: 10.1016/j.trd.2022.103548
Lindberg, F., Holmer, B., and Thorsson, S. (2008). SOLWEIG 1.0—Modelling spatial variations of 3D radiant fluxes and mean radiant temperature in complex urban settings. Int. J. Biometeorol. 52, 697–713. doi: 10.1007/s00484-008-0162-7
Maizlish, N., Woodcock, J., Co, S., Ostro, B., Fanai, A., and Fairley, D. (2013). Health cobenefits and transportation-related reductions in greenhouse gas emissions in the San Francisco Bay Area. Am. J. Public Health 103, 703–709. doi: 10.2105/AJPH.2012.300939
Maricopa County Assessor's Office (2018). Maricopa County Parcel Data. Available online at: https://maps.mcassessor.maricopa.gov/ (accessed April 8, 2022).
Maricopa County Public Health (2021). Heat-Associated Death in Maricopa County, AZ. Maricopa County: Maricopa County Public Health
Matson, G., McElroy, S., Lee, Y., and Circella, G. (2022). Longitudinal analysis of COVID-19 impacts on mobility: an early snapshot of the emerging changes in travel behavior. Transp. Res. Rec. 2022, 03611981221090241. doi: 10.1177/03611981221090241
Matute, J. M., and Chester, M. V. (2015). Cost-effectiveness of reductions in greenhouse gas emissions from High-Speed Rail and urban transportation projects in California. Transp. Res. D Transp. Environ. 40, 104–113. doi: 10.1016/j.trd.2015.08.008
Middel, A., AlKhaled, S., Schneider, F. A., Hagen, B., and Coseo, P. (2021). 50 Grades of Shade. Bull. Am. Meteorol. Soc. 102, E1805–E1820. doi: 10.1175/BAMS-D-20-0193.1
Middel, A., Chhetri, N., and Quay, R. (2015). Urban forestry and cool roofs: assessment of heat mitigation strategies in Phoenix residential neighborhoods. Urban For. Urban Greening 14, 178–186. doi: 10.1016/j.ufug.2014.09.010
Middel, A., Häb, K., Brazel, A. J., Martin, C. A., and Guhathakurta, S. (2014). Impact of urban form and design on mid-afternoon microclimate in Phoenix Local Climate Zones. Landsc. Urban Plan. 122, 16–28. doi: 10.1016/j.landurbplan.2013.11.004
Middel, A., and Krayenhoff, E. S. (2019). Micrometeorological determinants of pedestrian thermal exposure during record-breaking heat in Tempe, Arizona: Introducing the MaRTy observational platform. Sci. Total Environ. 687, 137–151. doi: 10.1016/j.scitotenv.2019.06.085
Middel, A., Lukasczyk, J., and Maciejewski, R. (2017). Sky view factors from synthetic fisheye photos for thermal comfort routing—a case study in Phoenix, Arizona. Urban Plan. 2, 19–30. doi: 10.17645/up.v2i1.855
Nahlik, M. J., and Chester, M. V. (2014). Transit-oriented smart growth can reduce life-cycle environmental impacts and household costs in Los Angeles. Transp. Policy 35, 21–30. doi: 10.1016/j.tranpol.2014.05.004
NOAA (2021). 2021 Climate Year in Review for Phoenix, Yuma, and El Centro. National Weather Service; NOAA's National Weather Service. Available online at: https://www.weather.gov/psr/yearinreview2021 (accessed November 30, 2022).
OpenStreetMap Contributors (2015). Planet Dump Retrieved From https://planet.osm.org/. OpenStreetMap. Available online at: https://www.openstreetmap.org/
OSHA (2015). OSHATechnical Manual (OTM)—Section III: Chapter 4 Occupational Safety and Health Administration. Available online at: https://www.osha.gov/otm/section-3-health-hazards/chapter-4
Parsons Brinckerhoff, A. (2010). Design and Development Plan for the MAG CT-RAMP Activity-Based Model (ABM). Arizona: Maricopa Association of Governments.
Perkins-Kirkpatrick, S. E., and Gibson, P. B. (2017). Changes in regional heatwave characteristics as a function of increasing global temperature. Sci. Rep. 7, Article 1. doi: 10.1038/s41598-017-12520-2
Putnam, H., Hondula, D. M., Urban, A., Berisha, V., Iñiguez, P., and Roach, M. (2018). It's not the heat, it's the vulnerability: attribution of the 2016 spike in heat-associated deaths in Maricopa County, Arizona. Environ. Res. Lett. 13:1–10. doi: 10.1088/1748-9326/aadb44
Qin, Y., and Hiller, J. E. (2014). Understanding pavement-surface energy balance and its implications on cool pavement development. Energy Build. 85, 389–399. doi: 10.1016/j.enbuild.2014.09.076
Stewart, I. D., and Oke, T. R. (2012). Local climate zones for urban temperature studies. Bull. Am. Meteorol. Soc. 93, 1879–1900. doi: 10.1175/BAMS-D-11-00019.1
Sun, Q., Macleod, T., Both, A., Hurley, J., Butt, A., and Amati, M. (2021). A human-centred assessment framework to prioritise heat mitigation efforts for active travel at city scale. Sci. Total Environ. 763, 143033–143033. doi: 10.1016/j.scitotenv.2020.143033
Taleghani, M., Sailor, D., and Ban-Weiss, G. A. (2016). Micrometeorological simulations to predict the impacts of heat mitigation strategies on pedestrian thermal comfort in a Los Angeles neighborhood. Environ. Res. Lett. 11, 024003. doi: 10.1088/1748-9326/11/2/024003
Tan, Z., Lau, K. K. L., and Ng, E. (2017). Planning strategies for roadside tree planting and outdoor comfort enhancement in subtropical high-density urban areas. Build. Environ. 120, 93–109. doi: 10.1016/j.buildenv.2017.05.017
Thornton, P. E., Thornton, M. M., and Vose, R. S. (2016). Daymet: Annual Tile Summary Cross-Validation Statistics for North America, Version 3. Available online at: https://daac.ornl.gov/cgi-bin/dsviewer.pl?ds_id=1348 (accessed March 3, 2021).
United States Census Bureau (2022). U.S. Census Bureau QuickFacts: Maricopa County, Arizona. Available omline at: https://www.census.gov/quickfacts/maricopacountyarizona (accessed January 31, 2023).
Vovsha, P., Freedman, J., Livshits, V., and Sun, W. (2011). Design features of activity-based models in practice coordinated travel–regional activity modeling platform. Transp. Res. Record J. Transp. Res. 300, 19–27. doi: 10.3141/2254-03
Wang, C., Middel, A., Myint, S. W., Kaplan, S., Brazel, A. J., and Lukasczyk, J. (2018). Assessing local climate zones in arid cities: the case of Phoenix, Arizona and Las Vegas, Nevada. ISPRS J. Photogram. Remote Sens. 141, 59–71. doi: 10.1016/j.isprsjprs.2018.04.009
Keywords: personal heat exposure, heat mitigation, active transportation, urban, climate
Citation: Li R, Chester MV, Middel A, Vanos JK, Hernandez-Cortes D, Buo I and Hondula DM (2023) Effectiveness of travel behavior and infrastructure change to mitigate heat exposure. Front. Sustain. Cities 5:1129388. doi: 10.3389/frsc.2023.1129388
Received: 21 December 2022; Accepted: 08 February 2023;
Published: 09 March 2023.
Edited by:
Yang Zhou, Shenzhen University, ChinaReviewed by:
Augusta Williams, Upstate Medical University, United StatesJinxin Zhu, Sun Yat-sen University, China
Copyright © 2023 Li, Chester, Middel, Vanos, Hernandez-Cortes, Buo and Hondula. This is an open-access article distributed under the terms of the Creative Commons Attribution License (CC BY). The use, distribution or reproduction in other forums is permitted, provided the original author(s) and the copyright owner(s) are credited and that the original publication in this journal is cited, in accordance with accepted academic practice. No use, distribution or reproduction is permitted which does not comply with these terms.
*Correspondence: Rui Li, cnVpbGkxMUBhc3UuZWR1