 James A. Lian
 Arin Khare
 Kai Vernooy1
- 1Niskayuna Central School District, Niskayuna, NY, United States
- 2Department of Computer Science, Rensselaer Polytechnic Institute, Troy, NY, United States
As policymakers look for solutions to mitigate the growing housing crisis and sustainable urban development, upzoning is becoming an increasingly popular tool. By altering a community's zoning code to allow for denser development, advocates hope to increase housing capacity and affordability. However, upzoning's effects on urban life, which we define as encompassing housing, greenspace, demographics, and transportation, remains unclear. Existing research primarily consists of isolated studies on each of these aspects' relationship with land use. In this study, we develop a holistic path analysis model by joining 2002–2010 lot-level and aggregating them with 2010–2018 tract-level datasets within NYC, investigating the impacts of upzoning on urban life as a whole. Unlike existing research, this model considers the delayed effects of upzoning by longitudinally separating upzoning from the dependent variables to elucidate the correlation of upzoning with different aspects of urban life. An imagery-based approach was used to more accurately measure greenspace, and a complex path analysis using densification as the main intermediate variable with significance thresholds was applied, enabling satisfactory model fit while preserving only significant connections between land-use and urban life. We find a positive correlation between densification and upzoning, through which upzoning is positively associated with increased home values and urban greening. However, no associations are identified between upzoning with rent prices, racial gentrification and transportation patterns. These results suggest that 2002–2010 upzoning in NYC does not fully realize its goals of increasing housing capacity and affordability. The comprehensive analysis of the impact of upzoning on broader aspects of urban life discussed in this study will be beneficial for future policy making and urban planning.
1. Introduction
As the housing crisis intensifies, researchers, policymakers, and residents alike are searching for new solutions. The rising price of housing as well as persistent suburbanism are contributing to new economic pressures and inequality throughout the American economy (Winke, 2021). At the same time, a continued demand for urban living spaces is shifting the paradigm amongst urban planners, with concepts such as transit-oriented development uniting public transport and land use regulation (Atkinson-Palombo, 2010; Barbour et al., 2020). Upzoning, specifically a type of land use change, allows developers to build denser buildings by increasing theoretical residential capacity, with the hope of creating more supply in the housing industry and lowering prices (Nzau and Trillo, 2019; Dong, 2020). In the 2000s and 2010s, upzoning accelerated and major cities such as Seattle, Portland, and Chicago began to adopt the practice, with the specific goal of promoting urban density and alleviating the housing crisis (Freemark, 2020; Kim, 2020; Dong, 2021). In addition, multiple Californian state initiatives have attempted to relax zoning regulations and promote construction (Dougherty, 2020). In New York City specifically, from 2002 through 2010 Mayor Bloomberg rezoned over one fifth of the city (excluding park land), with upzoning accounting for a significant proportion of rezoning activity (Armstrong et al., 2010; Laskow, 2014).
However, upzoning's effectiveness at both lowering housing prices and increasing housing construction is still unclear, and there is a general debate over whether or not upzoning is an effective policy to alleviate the housing crisis and create more affordable housing (Rodríguez-Pose and Storper, 2019). Tenant advocates argue that upzoning can lead to increased land prices because landlords will be able to sell their property for more due to the increased development potential, resulting in harmful redevelopment. On the other hand, others believe that upzoning will allow for greater population densities, alleviate price pressures, and spur housing construction (Davis, 2021).
Upzoning and associated densification (the increase in density of people living in urban areas) may also significantly impact urban life, leading to greater public transit use and more greenspace (Kim and Li, 2021; Jahrl et al., 2022). However, there is currently no comprehensive study to examine the potential impacts of upzoning on transportation, city demographics, and greenspace. In addition, much of the existing literature related to land use considers upzoning and its effects during the same time period (to be discussed in the background section). This paper studies these relationships between upzoning and descriptive metrics of transit use, greenspace, and densification by connecting upzoning data from one time period to dependent variables from a subsequent time period. This accounts for natural delay between zoning changes and physical/social changes within a neighborhood. The objective of this paper is to build a comprehensive model uniting the land use, transportation, and greenspace dimensions of urban planning in a single framework and longitudinally evaluate how upzoning from 2002 to 2010 affected urban life in NYC.
2. Background
Research on the impact of upzoning on urban life has so far been split into many different areas, of which we specifically focus on housing, gentrification, transportation, and greenspace. Some studies directly focus on the effects of upzoning on housing construction and prices, as well as specific demographic effects. Freemark (2020) analyzed the effects of upzoning reforms surrounding transit stations in Chicago during 2013/2015 on the census-tract level and found that upzoning was associated with increased housing prices, but no significant increase in housing construction in the following five-year period. Greenaway et al. (2020) and Kuhlmann (2021) found a similar increase in housing prices for upzoned areas of Minneapolis and Auckland, respectively. However, others find positive associations between the restrictiveness of zoning regulations and the price of housing, particularly in highly demanded areas such as San Francisco (Glaeser and Gyourko, 2003; Kok et al., 2014), while some studies find an increase in housing supply associated with upzoning (Kashian et al., 2020; Dong, 2021).
Gentrification is a process where new development pushes out existing residents in favor of younger, whiter, wealthier, and more educated immigrants (Davis, 2021), and has been found to be positively associated with lower distances to central business districts as well as low homeownership (Freeman and Cai, 2015). Within NYC, there has been a significant history of gentrification, particularly from the 1970s onwards (Sutton, 2020). With regards to upzoning, several studies show a positive connection between upzoning and increase in the proportion of the white population, a barometer for gentrification (Aravena et al., 2020; Davis, 2021).
In addition, research on the connection between land use (though not necessarily upzoning) and urban transportation habits is also multifaceted. In Phoenix, Atkinson-Palombo (2010) found a two-way association between transit use and upzoning. In southern California, Kim and Li (2021) found that upzoning was associated with general urban densification, while exploring the impacts of both upzoning and densification on transit capacity. By employing a structural equation model (SEM), Kim and Li found that areas marked for future transit development were more likely to be upzoned, while upzoned areas were more likely to be marked for future transit development. Densification has also been linked to increased public transit use and decreased vehicular carbon emissions (Jones and Kammen, 2014; Choi and Zhang, 2017), but in some cases only up to a threshold (Zhang et al., 2021). Additionally, Merlin et al. (2021) suggested that transit can only be accurately examined when considering both transit accessibility and transit ridership, and by determining a positive relationship between transit accessibility and transit ridership.
Some studies also link upzoning and zoning regulation changes to the changes in urban greenspace. Within NYC, increases in residential capacity from 2003 to 2007 have been found to be disproportionately further from parks (Been et al., 2010). Hsiao-Tung (2011) employed a SEM model using confirmatory factor analysis, determining the “green plot ratio” (the plant-coverage percentage of a lot, determined through satellite imagery) to be the most important factor in determining the value of the nearby urban “eco-community”, which is considered as an important vision for urban development in Taiwan. Zoning can also have significant positive effects on urban greenspace (Hill et al., 2009). Within the wider literature, urban greenspace has been found to have several positive effects on the community, including better mental and physical health (Kaczynski and Henderson, 2007; Braubach et al., 2017; Cox et al., 2017).
Some papers focus on the causes of upzoning. Gabbe (2018), for example, used a logistic regression to analyze how a series of neighborhood and lot level characteristics influenced the probability that lots in Los Angeles were upzoned between 2002 and 2014, finding that non-residential, low-density lots were more likely to be upzoned. In Durham, NC, Whittemore (2017) found that before the mid-1980s, communities of color were more likely to be commercially or industrially upzoned, reflecting biases within upzoning decisions that were later corrected.
In sum, many of the individual links between upzoning and various sectors of urban life have been explored. However, a unified model is lacking in the existing research to examine the coupled effects of upzoning on transportation, greenspace, and city demographics. Also, the lack of a broader focus might lead to important connections and mediated relationships being ignored. By aggregating these links into a single model, a full picture of urban life can be developed, which could be beneficial to improve the efficacy of upzoning and understand its impacts, which is essential for effective land usage and future urban planning.
This study seeks to answer several questions regarding the effects of upzoning on urban life. Firstly, we evaluate whether upzoning succeeds at increasing densification and housing affordability. In addition, we examine how upzoning and its relationship with demographics and transportation patterns shifts within an integrated urban model. Finally, we determine whether upzoning leads to decreased greenspace, as a result of increased densification.
3. Methods
Descriptive statistics for all variables are presented in Table 1.
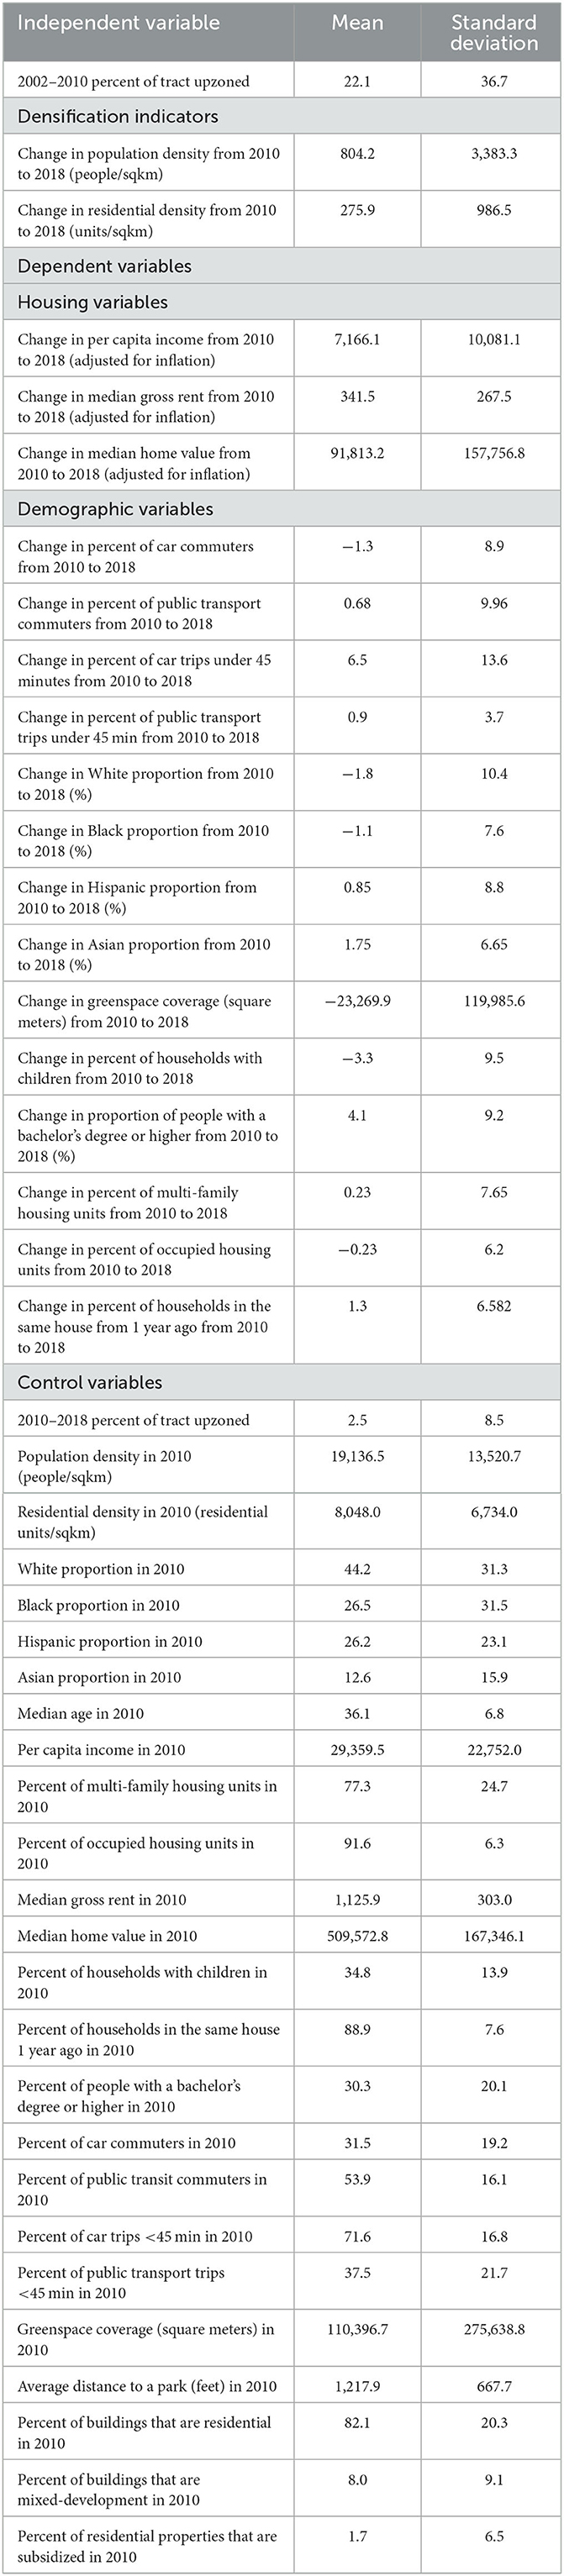
Table 1. Descriptive statistics for all (tract-level) variables used in path analysis model. Statistics are calculated with the 2,119 NYC tracts used in the model.
3.1. Land use data
This study integrates both tax lot (individual property) level and census tract (small, relatively permanent statistical subdivision of a county) level data in order to link upzoning to tract level urban metrics, such as greenspace, demographics and transportation. The use of census-tract level data allows for quantification at the neighborhood level, while remaining small enough to provide a large sample size for the model, with a total of 2,119 tracts with non-zero population considered (out of a total of 2,160 tracts in NYC) (Figure 1).
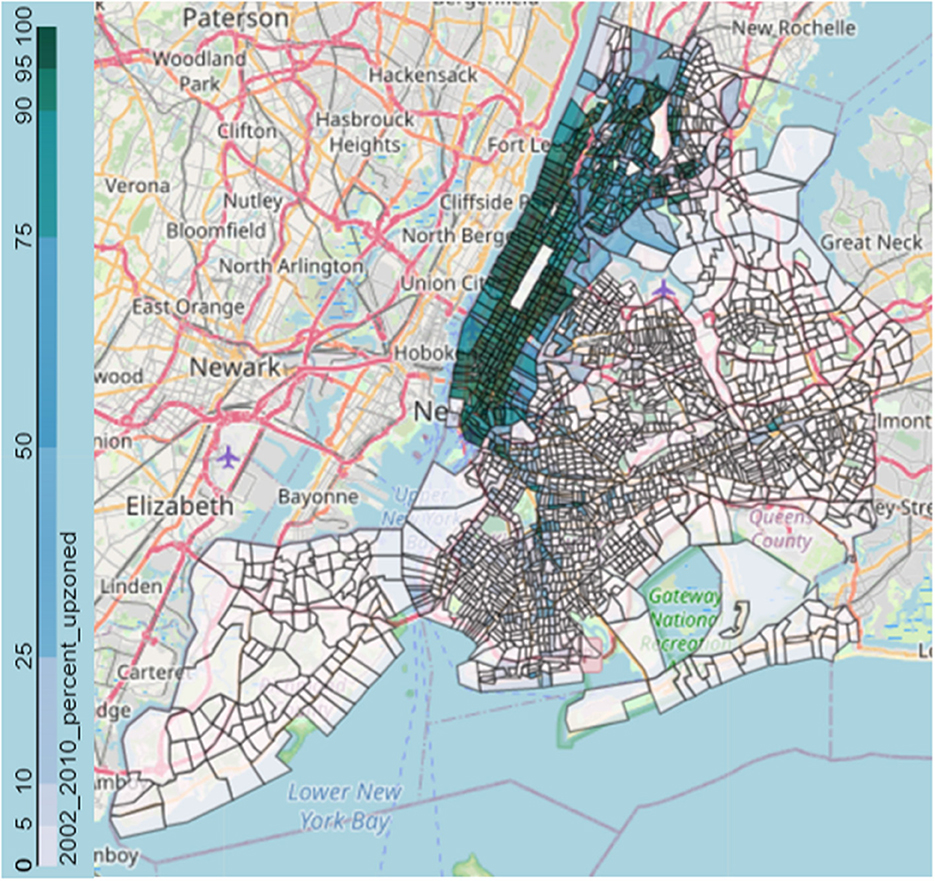
Figure 1. A map of 2002–2010 upzoning within New York City shows its concentration within Manhattan, the Bronx, and corridors throughout Brooklyn. Most tracts were either not upzoned at all or mostly upzoned (figure should be in color online).
Following Been et al. (2010) and Davis (2021), a lot is defined to be upzoned if it undergoes a 10% increase in maximum residential development capacity. In NYC, this is primarily done through the mechanism of floor area ratio (FAR), which is defined by the ratio of the maximum residential development capacity of a lot to its size (Barr and Cohen, 2014). In order to calculate the maximum residential development capacity, this study used the Primary Land Use Tax Lot Output (PLUTO) database (NYC Department of City Planning, 2002/2010). The maximum 2002 residential development capacity for every lot was obtained by using 2002 PLUTO data and multiplying the FAR by the lot size for each lot in NYC. The same calculations were applied to the 2010 and 2018 PLUTO data sets, allowing for the identification of whether and when lots were upzoned. After spatially matching lots to census tracts, values were computed for the primary variable of interest, the proportion of lots within each census tract which were upzoned between 2002 and 2010. In order to differentiate the effects of upzoning between 2002 and 2010 and upzoning between 2010 and 2018, the proportion of lots upzoned from 2010 to 2018 is preserved as a control in the path analysis model. This enables the model to quantify and compare the effects of upzoning on varying time scales as well as control for the effects of upzoning happening simultaneously vs. before the study period.
Using PLUTO, this study also collected two lot classification metrics—whether a lot was classified as residential in 2010 and whether it was classified as mixed-development (residential and commercial uses within the same lot) in 2010, both of which were then aggregated to the census tract level as proportions. These serve as important indicators of how the land in the census tract is being used, and mixed-development buildings have been shown to relate to the demographic makeup of a tract—for example in Chicago (Freemark, 2018). Including these metrics accounts for the possible differences between heavily residential and heavily non-residential census tracts, as well as between census tracts with a significant number of mixed-development lots and those without a significant number (Shen and Sun, 2020).
The NYU Furman Center holds a database of subsidized lots in NYC, which are lots containing residential properties that receive housing subsidies, such as rent aid and public housing. Using unique Borough-Block-Lot (BBL) identifiers, this study matched these data of lots subsidized in 2010 to the NYC PLUTO data, which was then combined at the census tract level. From this we create a variable measuring the proportion of subsidized lots within a census tract, with the reasoning that residing in a subsidized property might make residents less likely to move out, slowing redevelopment (Davis, 2021).
3.2. Demographic data
Most neighborhood information was collected at the census-tract level. One of the datasets the U.S. Census releases every year is the American Community Survey (ACS), which offers highly detailed demographic, economic, social, housing, and transportation data by census tract (US Census Bureau, 2010/2018a, 2010/2018b, 2010/2018c, 2010/2018d, 2010/2018e). This study employed the five-year ACS for 2010 and 2018, i.e. data collected over the period 2006–2010 and 2014–2018. Because the study period is significantly longer than the ACS data collection period, this avoids any associations caused by data overlapping in the 2010 and 2018 ACS datasets. For each of the collected metrics, two variables were created—a control variable using the 2010 ACS data and a difference (delta) dependent variable using the change between 2010 and 2018 ACS data.
Since one of the key arguments of upzoning proponents is that upzoning increases population density without gentrifying (pushing out disproportionately non-white, older, uneducated, poorer residents) neighborhoods (Dougherty, 2020), metrics collected include the population density and racial makeup of each census tract, education levels, as well as the median age, the latter two of which serve as proxies for gentrification (Operti et al., 2022).
In order to analyze the economic impacts of upzoning, this study utilized the ACS economic and housing datasets. Median per capita income is used as a measure of economic status. In addition, median gross rent and median home value within each tract were collected from the ACS housing dataset in order to analyze housing prices, for both renters and homeowners. Considering the housing makeup of a tract, this study also used the proportion of lots which were multi-family as opposed to single family housing. Additionally, data were collected for the proportion of housing units in a tract which are occupied and the proportion of households which were in the same house a year ago, both of which indicate the relative housing stability and community maturity of the tract (Rohe and Stewart, 1996). Lastly, this study tracks the proportion of households which are families and have a bachelor's degree or higher, both of which shed light on the social character of a tract.
3.3. Transportation data
Using data from the ACS, this study also aims to capture several dimensions of transportation within NYC, particularly the accessibility and actual use of transit modes. To do so, we use the proportion of workers who use public transit to get to work within each census tract as a proxy for public transit use. In order to measure transit accessibility, we calculated the proportion of workers using public transit with trips to work under 45 min, the threshold which best explains transit use (Wu et al., 2019). Analogous metrics are used for the proportion of commuters using cars and proportion of car commuters with trips under 45 min, allowing for comparison between the two transport modes.
3.4. Greenspace data
The observed variables for greenspace were calculated using NYC's biannual orthoimagery survey, specifically the 2010 and 2018 surveys, as well as public parks data from PLUTO. To find park proximity, the closest park to each lot is determined using the distance between the centroids of the lot and parks. These measurements are used to calculate the average distance to a park within a tract. Full greenspace data can be found in Appendix A.
In addition, a previous study by Braubach et al. (2017) found that the benefits of urban greenspace were not constrained to just public parks but rather were created by all forms of urban nature, including roadside trees. Since no currently available numerical data exists for a comprehensive analysis of all NYC greenspace, we directly generate these data using orthotiles at 6-inch resolution. We first geotagged images, enabling geographic association with Census tracts. We then employ a modified version of the existing vegetation index ExG, used to detect vegetation from overhead imagery. ExG uses the formula 2 * G—R—B, with G, R, and B being normalized intensities from 0 to 1 for the green, red, and blue light bands, respectively (Woebbecke et al., 1995; Torres-Sánchez et al., 2014; Yun et al., 2016). At the same time, NIR light is incredibly effective at separating vegetation from non-vegetation, making it commonplace in spectral band imaging (Xue and Su, 2017). Since our orthoimagery also contains a near-infrared band, we substitute near-infrared light in place of green light. Taking this into account, parks and true greenspace were differentiated from other green objects using a vegetation index = 2 * NIR—R—B, with NIR, R, and B being raw intensities from 0 to 255 for the near-infrared, red, and blue light bands, respectively. Rather than normalizing values to create a continuous scale from −1 to 1, this index was thresholded at a value of 45 to create a binary mask of greenspace coverage, where an index >45 indicates greenspace. This binary mask was applied to every orthotile in NYC, and each tile clipped to census tracts. The pixels in the mask identified as greenspace were converted to their area in square meters, establishing the greenspace area for each tract (Figure 2). This method includes some red roofs, which is a known issue with vegetation indices (Zhang et al., 2010; Neyns and Canters, 2022). The variables collected from our various data sources were integrated into a unified dataset, which can be found in Appendix B.
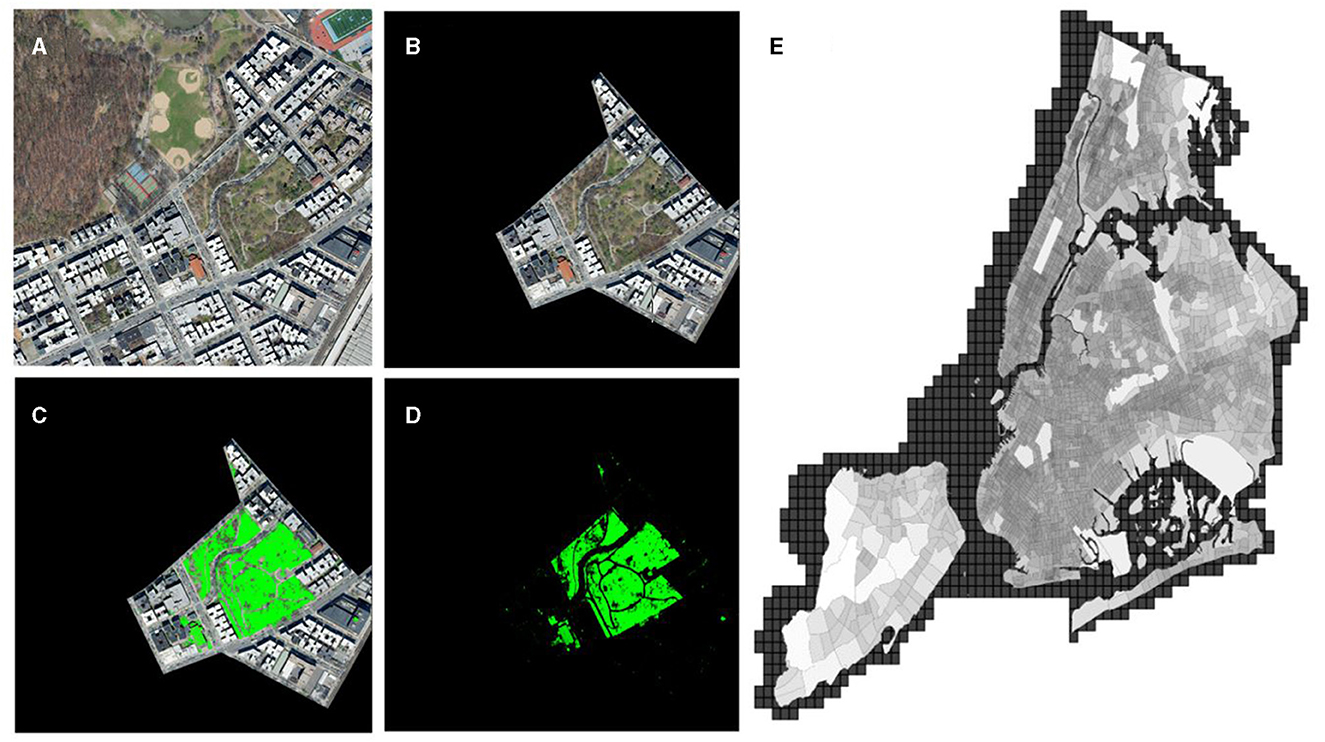
Figure 2. (A) A NYC orthotile; (B) the tile is cropped to a tract; (C) sufficiently green areas are identified in the image; (D) the isolated green pixels are summed and converted to square meters to calculate a greenspace coverage score; and (E) logarithmic visualization of 2018 greenspace, with lighter areas representing more greenspace. The background shows the size of tiles compared to the city as a whole (All images should be colored online).
3.5. Path analysis model
Since each dimension of city planning interacts with every other dimension, urban planners must consider how the effects of interventions on one specific dimension of the city will affect every other dimension. To do so, a model which can fully capture the interrelated effects and relationships between variables is required. We use path analysis (Figure 3), which is a statistical technique used to estimate an entire system of relationships between variables, allowing the analysis of variable associations such as two-way connectors, as well as direct and mediated effects (Hamilton, 2017). This was conducted with Python, using the Python package semopy (Meshcheryakov, 2020).
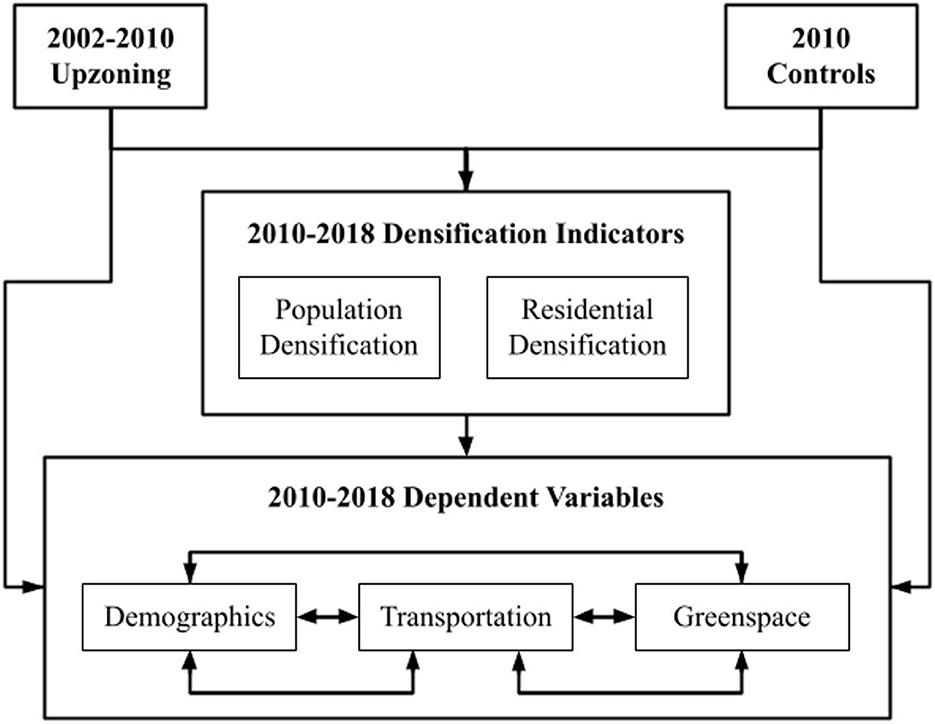
Figure 3. A diagram of the proposed model. An arrow indicates regressions from one variable into other variables. Regressions exist within the dependent variables, but not between the densification indicators or control variables (see Table 1).
The complexity of the proposed model necessitates a novel filtering strategy for its development. Development began with an initial skeletal model, which aims to model existing relationships found in upzoning literature, such as between upzoning and densification (Kim and Li, 2021), as well as from the densification indicators to dependent variables. Following existing research on the immediate effects of upzoning, upzoning is also connected directly to several dependent economic variables such as housing prices (Freemark, 2020). Then, linear regressions were conducted between dependent variables to other dependent variables, and from controls to dependent variables, and those with a p-value more significant than 0.3 were added to the skeletal model. This captures loosely connected parts of urban life which may or not become significant as the model is developed. After the initial model's performance was then evaluated for goodness of fit with maximum likelihood, a method for determining parameters of a statistical model. Three rounds of filtering were applied, wherein initially significant linear regressions estimated within the model that had become statistically insignificant or were not large enough were removed. The first round removed highly insignificant relationships with a threshold of p >0.9, with further rounds of filtering removing progressively more significant relationships with thresholds of p >0.4, >0.075, and >0.05. At each round of filtering, the model was refitted, gradually improving parsimony until all connections were significant at p < 0.05. All significance thresholds for the filtering process, though nonstandard, were tuned to optimize performance and maximize the number of significant connections, enabling satisfactory model fit with RMSEA < 0.06, AGFI > 0.9, and CFI approaching 0.95 (Fan et al., 1999; Hu and Bentler, 1999). As a result of the increased number of parameters, the chi-squared metric performed worse compared to the aforementioned fit metrics though this matches known behavior with regards to path analysis (Hooper et al., 2008). Through all rounds of filtering, a cut-off of 0.001 was used in deciding if the magnitude of a relationship was large enough to preserve. Every connection is significant at p=0.05, with nearly all significant at p = 0.01. Fit statistics are shown in Table 2.
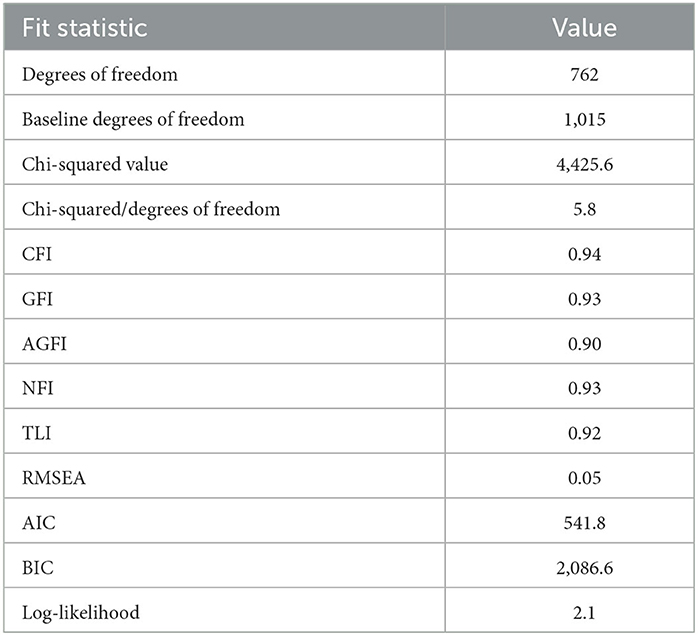
Table 2. Information for the model using the filtering strategy.
After fitting the model, we calculate the total effects of variables on one another using a depth-first search algorithm for finding all possible simple paths between two vertices in a directed graph. In order to focus on the most useful direct and mediated connections, this study limits the maximum search depth of links in a path to two. A complete overview of model coefficients, connections, standard errors, and p-values can be found in Appendix C. A summary of all direct and indirect paths can be found in Appendix D.
4. Results
Table 3 summarizes the key impacts of the 2002–2010 upzoning in the NYC on different aspects of urban life, from which several key features can be identified. First, a significant (p < 0.001) positive correlation is identified between 2002 and 2010 upzoning and change in population density (population densification). For every 1% increase in the percent of upzoned lots, population densification tends to increase by 14.1 people per square kilometer. For a completely upzoned tract, this translates to an additional bonus of 7.4% of the average 2010 tract population density over the average tract.
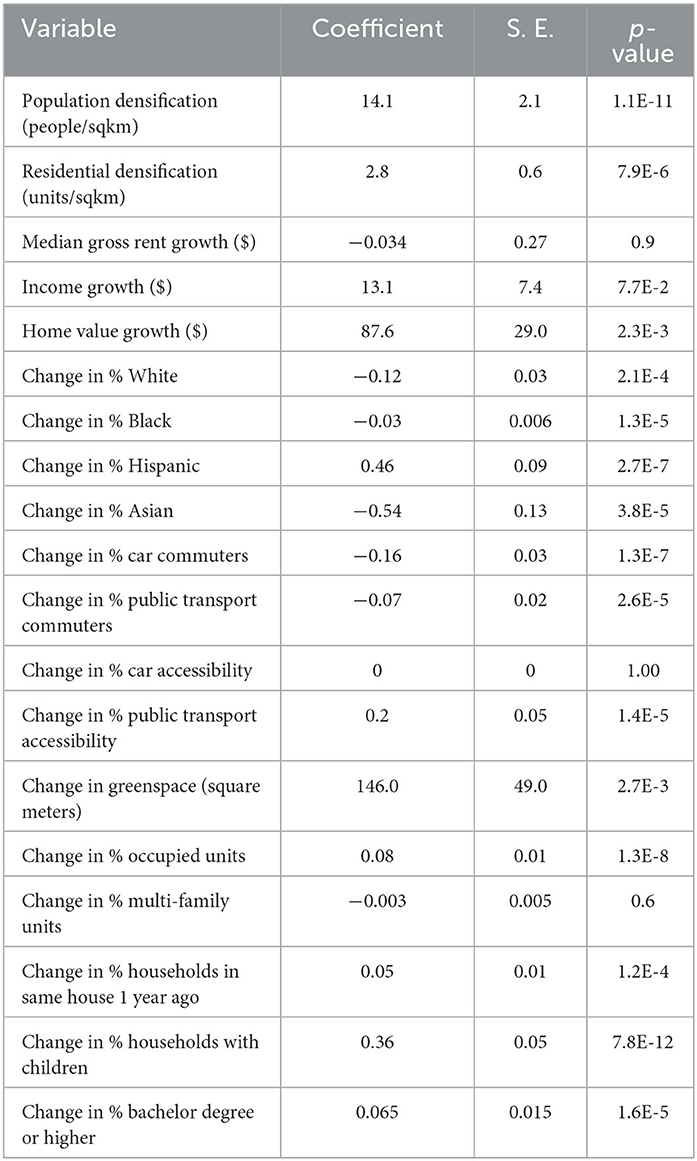
Table 3. Impacts of the 2002–2010 upzoning on all dependent variables of urban life and their statistics.
Second, our model finds that the 2002–2010 upzoning is positively associated (p < 0.001) with increases in residential densification, with an increase of 1% more upzoned lots associated with 2.8 more residential units per square kilometer. A fully upzoned tract would see, on average, an additional increase of 3.5% of the average 2010 residential unit density. Notably, 2010–2018 upzoning also has a significant (p < 0.01) positive effect on residential densification, but has no significant effect on population densification. This suggests that population densification is a downstream effect of residential densification, and takes time to occur.
At the same time, other non-upzoning factors play significant roles in affecting both population and residential densification. For example, an increased percentage of both occupied housing units and median age in the control set of 2010 data was associated (p < 0.01) with significant decreases in densification, while each $1 increase in median rent in 2010 was associated with, on average, 0.58 fewer people and 0.24 less residential units added per square kilometer. This suggests that, regardless of upzoning, the relative availability and affordability of living in a community has significant consequences for the extent to which it densifies. In addition, an increase in the percentage of both car and public transport commuters in 2010 is associated (p < 0.001) with increases in both types of densification, but public transportation is associated with more densification, suggesting that the use of public transit vs. cars is a differentiating factor in attracting new density.
However, the model finds no association between upzoning and median gross rent growth between 2010 and 2018, as the negative direct association between upzoning and rent growth is canceled out by a variety of positive associations mediated through other variables such as changes in the population density, income, and proportion of households that are families. This is highly surprising as downward pressure on rents is one of upzoning's main goals, and yet the model finds that the links between upzoning and any effect on rent growth are small in magnitude. The impact of community maturity seems to be more impactful on rents—for every 1% increase in the percentage of households living in the same house in 2010, median rent increases by $11.4, and by $18.6 for each additional percentage point gained from 2010 and 2018. At the same time, there exists a strong positive association (p < 0.01) between 2002 and 2010 upzoning and median home values, with an additional increase in home value of $88 for every percent of a tract upzoned, of which $74 is mediated by population densification.
An increase in upzoning of 1% is associated (p < 0.001) with a significant decrease in the proportion of white residents of 0.11 pp (percentage points), which is mediated through an increase in community maturity. In addition, upzoning is also associated with divergent effects for the proportions of minorities within a census tract, with each percent increase in upzoned lots in a tract associated (p < 0.001) with decreasing the proportion of Asian residents in a tract by 0.5 pp but increasing the proportion of Hispanic residents in a tract by 0.5 pp while having little effect on the proportion of black residents.
Upzoning also has significant impacts on transportation in NYC. Our model suggests that upzoning is associated (p < 0.001) with a decrease of 0.15 pp fewer car commuters for every 1% of lots upzoned, and a decrease of 0.07 pp fewer public transport commuters. In effect, a completely upzoned tract would have both a more negative change in car use, as well as a slightly less negative change in public transport use compared to the average tract. Additionally, our model finds that 2002–2010 upzoning is associated (p < 0.001) with an increase in public transit accessibility (as measured by the percentage of trips under 45 min) of 0.2 pp for every 1% of a tract upzoned, but has no significant impact on car accessibility. Other factors that impact transit include the percent of multi-family units in 2010, which is positively associated (p < 0.01) with increased public transit accessibility but not with changes in car accessibility, and the change in multi-family units from 2010 and 2018, with a 1% increase in the proportion of multi-family units resulting in 0.6 pp of public transit use and −0.5 pp of car use.
Lastly, our model shows that 2002–2010 upzoning had a strong association (p < 0.001) with urban greening (change in greenspace), with each additional percent of a tract upzoned adding an average of 146 square meters of greenspace. In addition, urban greening is positively associated with the percent of units which were residential in 2010, with an average increase of 261 square meters per additional percentage of residential units. Our model finds that distance to a park in 2010 was negatively associated (p < 0.01) with urban greening, while the amount of greenspace in 2010 was positively associated with urban greening.
5. Discussion
5.1. The impact of 2002–2010 upzoning on urban life
Table 4 summarizes the significant non-upzoning correlations with different aspects of urban life highlighted in this study. The positive correlation between 2002 and 2010 upzoning and median home values can be attributed to the paths mediated by population densification and increased income, both of which have a significant, positive association with home value. This provides some evidence that upzoning does lead to appreciation in home values, corroborating existing research (Freemark, 2020; Kuhlmann, 2021). This increase could be the result of increased development potential, leading to land speculation (Davis, 2021).
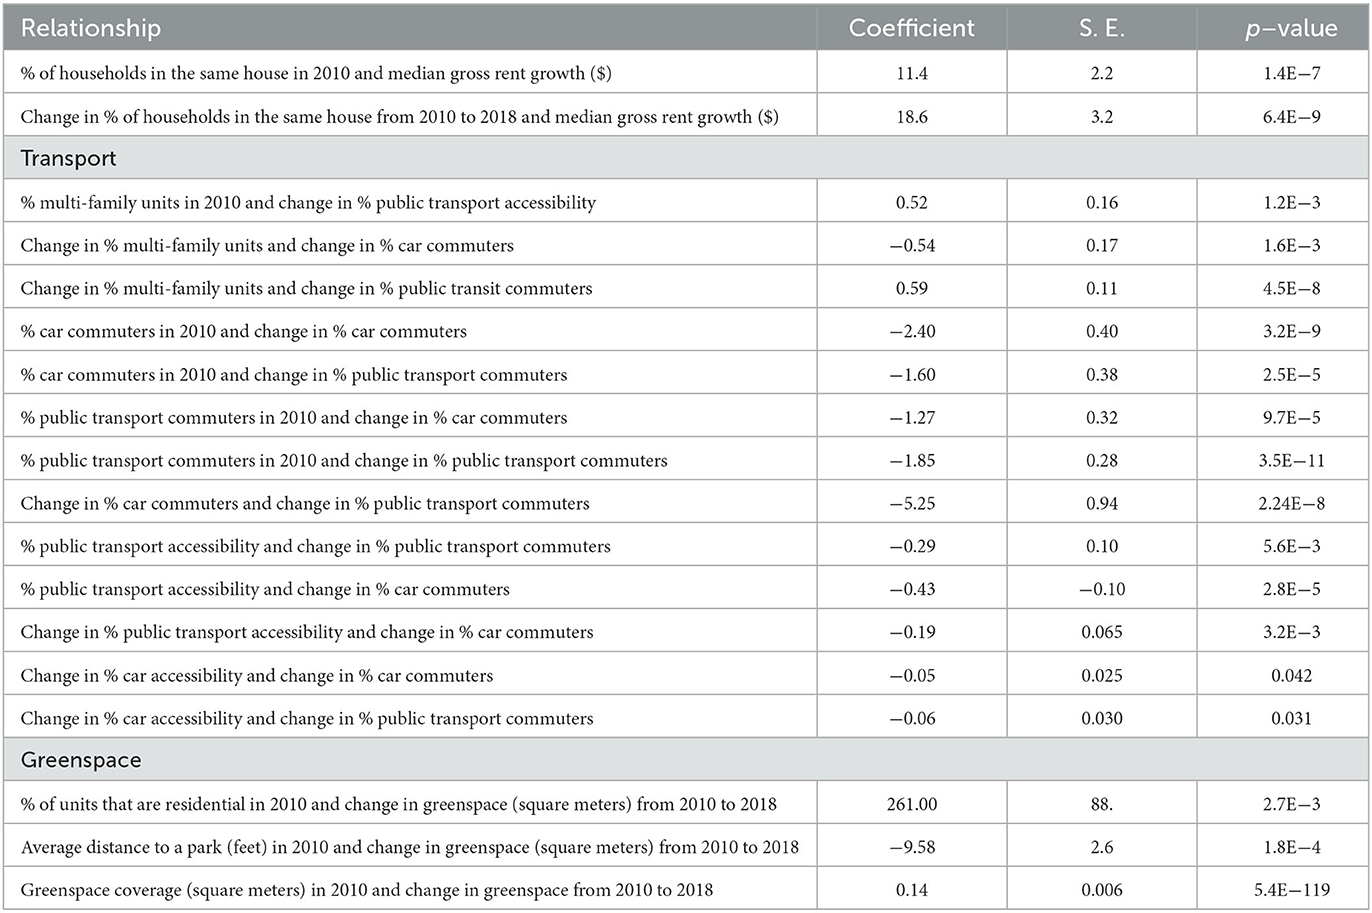
Table 4. Significant non-upzoning relationships highlighted by this study.
Although previous studies (Aravena et al., 2020) have found a positive association between upzoning and the proportion of white residents within a tract in 2010, our model finds the opposite effect when analyzing the change in the proportion of white residents from 2010 and 2018. This mixed picture challenges the demographic effects purported by anti-gentrification activists who believe upzoning will lead to an influx of disproportionately white immigrants. Instead, changing racial makeup was found to be heavily influenced by the racial makeup of tracts in 2010, which may reflect differences between the diverse communities of NYC.
While decreasing car use and dependency certainly aligns with the intentions of upzoning advocates, the decrease in public transportation use with upzoning is notable, especially when compared to the effect of change in the proportion of multi-family units to benefit public transit use at the expense of car use. This could reflect shifts to other transport modes, such as biking and walking, that this study does not capture. In addition, transportation-related control variables play an important role in changing transit patterns. Tracts with more car and public transportation use in 2010 had relatively less car and public transportation use from 2010 and 2018, while an increase in car use was associated with a decrease in public transportation use.
Interestingly, higher public transport accessibility in 2010 (as measured by the percentage of trips which were under 45 min) was associated with a decrease in public transport use, but an even stronger decrease in car use, while there was no relationship between car accessibility in 2010 and changes in transport patterns. Looking at changes in accessibility from 2010 and 2018, an increased change in public transport accessibility was associated with a simultaneous decrease in car use, while increased change in car accessibility was associated with smaller, simultaneous decreases in both public transport and car use. The significant relationships between accessibility and use agree with the conclusions of Merlin et al. (2021), which suggests that both dimensions are necessary to consider. Note that the divergent effects of accessibility on transportation patterns may be due to the differences between the two modes of transport, which warrants further research.
While urban greening is positively associated with upzoning, it is not related to densification, suggesting that increases in greenspaces are occurring in conjunction as a result of deliberate city policy or naturally due to increased municipal attention. Urban greening is also affected by existing greenspace in 2010 and residential proportion, while being negatively associated with the distance to a park. This suggests that urban greening is biased toward areas which already had significant amounts of greenspace and access to parks, which could reflect the flexibility or ease of adding new greenspace in already green areas. This builds on previous research on inequalities between different types of zoned land uses (Mincey et al., 2013). Although the greenspace estimation method ExG detects some red roofs, this results in a negligible overestimation of real greenspace, with little effect on the relationships involving urban greening.
While the NYC 2002–2010 upzoning was successful at achieving some of the goals intended by upzoning advocates, there were important exceptions, particularly with regards to public transport use, rents, and housing prices. In addition, densification is demonstrated in several instances to be a mediating variable in relationships involving upzoning. However, upzoning was often not the most impactful factor in modeling the changes in urban life. The impacts of upzoning are balanced by other existing and more durable factors, showing that upzoning alone may not be able to achieve the full results hoped for.
That being said, upzoning is just one of a plethora of tools available to urban planners. Even as upzonings in the 2000s are being evaluated for their success, new urban planning paradigms are continuing to take hold. With further study, the full effects of upzoning can be revealed in greater detail, allowing urban planners to use upzoning as effectively as possible.
5.2. Analysis of the model development
The effectiveness of the filtering strategy for developing a complex model shows its viability as a tool for path analysis. By thresholding on significance of connection and magnitude of connection, only the most useful and impactful connections can be preserved, helping to narrow the focus for analysis. The ability to set different thresholds at each level of filtering allows a wide range of approaches to tuning the size, parsimony, and model fit of the filtered model. In addition, sensitivity analyses conducted showed that the specific filtering thresholds had negligible effects on the estimated slope coefficients of connections, showing the robustness of the filtering method and allowing for more flexibility as to adjusting model complexity. Despite the holistic model's unprecedented size, it was in the range of acceptable models, satisfying several key cutoffs, such as the RMSEA, described by Hu and Bentler (1999).
However, employing a large number of variables creates a new set of issues which are not entirely mitigated by the filtering strategy. For example, the sheer complexity of the model creates nearly 2000 direct, indirect, and total paths, from which only those relevant to upzoning and most important to urban life were presented. Another unresolved problem is the existence of increasingly lengthy indirect paths, as tens or hundreds of unique paths begin to accumulate in the total coefficient. As paths stringing together four, five, or more variables begin to be considered, they lose meaning and interpretability. This problem was avoided by limiting the maximum path length of considered connections to just direct or indirect paths with a mediator variable, but future research into evaluating the significance of longer paths is necessary to gain a full understanding of complex path models.
More importantly, the proposed model succeeds at integrating various dimensions of urban life, many of which could not be included in previous research focusing on upzoning. This opens the way for a wider application of path analysis to analyze an entire system, such as NYC urban life, rather than specific subsections such as transportation (Kim and Li, 2021), housing (Freemark, 2020) or environment (Choi and Zhang, 2017). As more areas and more variables capturing urban life are incorporated into a holistic model, better fitting and comprehensive models are likely to offer even greater insights into cross-dimension connections. By considering how different parts of urban life affect each other, urban planners will gain more detailed and accurate information concerning city policy, enabling more knowledgeable decision-making.
With regards to this study, several limitations exist which may restrict the interpretation of its findings. One limitation is the time interval between the measuring of upzoning and the measuring of our dependent variables. A longer time period would enable the analysis of longer-term effects, and perhaps more complex relationships between time periods provide further insight into the implications of upzoning. However, many large metropolitan areas such as Minneapolis, Chicago, New York City, and Seattle have only begun enacting major upzoning legislation during the mid-to-late 2000s (Kim, 2020), limiting our study to the span of roughly two decades.
In addition, this study does not take into account other land use policies, nor does it differentiate between city-initiated and private-initiated upzonings, which breaks with much of the existing upzoning research (Been et al., 2014; Davis, 2021). This could lead to overlooking possible divergent effects between different types of upzonings, which may have impacts on zoning's effectiveness. More research is also required to understand how upzoning interacts with other parts of zoning codes, such as transit zones, limited height districts, minimum parking and setback requirements, and their effects on urban life.
A final limitation arises with the fact that this paper only investigates relationships found in NYC. This means that our conclusions may be specific to cities with characteristics similar to those of NYC, such as high density or developed transit systems (Loo et al., 2010). In addition, much of the upzoning occurring in 2002–2010 was concentrated within Manhattan and transit corridors, which means our results may be more heavily influenced by uniquely urban census tracts. Future research may include replication of our methods across different cities and densities, in order to more confidently make generalized conclusions about upzoning and provide more compelling arguments in support of policy recommendations.
6. Conclusions
In this study, we performed a systematic investigation of the impacts of upzoning on urban life. A holistic model was developed utilizing a path analysis approach to connect 2002–2010 upzoning and control variables to 2010–2018 dependent variables. Our results show that upzoning has mixed effects. Upzoning was associated with increased densification, greenspace, and public transit accessibility, but not increased proportion of white residents, raising doubts on connections to racial gentrification. At the same time, it also increased home values with no effect on rents, suggesting that upzoning could be negatively impacting on affordability in a community. It was also associated with a negative absolute impact on transit use, which raises questions about how upzoning and transportation can be effectively paired to avoid this in the future. These advances could enable planners to use upzoning more effectively and build upon the mixed effects of NYC's experiment in upzoning in order to truly improve all parts of urban life.
Data availability statement
The original contributions presented in the study are included in the article/Supplementary material, further inquiries can be directed to the corresponding author.
Author contributions
Conceptualization, methodology, and formal analysis: JL. Software, investigation, and writing—review and editing: JL, AK, and KV. Data curation: JL and AK. All authors contributed to the article and approved the submitted version.
Acknowledgments
We would like to thank Laura Favata for her project oversight and guidance, which substantially improved this paper.
Conflict of interest
The authors declare that the research was conducted in the absence of any commercial or financial relationships that could be construed as a potential conflict of interest.
Publisher's note
All claims expressed in this article are solely those of the authors and do not necessarily represent those of their affiliated organizations, or those of the publisher, the editors and the reviewers. Any product that may be evaluated in this article, or claim that may be made by its manufacturer, is not guaranteed or endorsed by the publisher.
Supplementary material
The Supplementary Material for this article can be found online at: https://www.frontiersin.org/articles/10.3389/frsc.2023.1149753/full#supplementary-material
Appendix A. Raw park distance statistics for 2010, 2014, 2018, and greenspace data for 2010 and 2018 on a census tract level.
Appendix B. Raw data covering zoning, demographic, housing, economic, social, transportation, and greenspace variables for NYC 2002–2018 on a census tract level.
Appendix C. Complete list of model coefficients, connections, standard errors, and p-values.
Appendix D. Complete list of all direct and indirect paths as well as their combined effects, with standard errors and p-values calculated.
References
Aravena, I., Lopatina, A., Nazarian, A., Rose, D., and Yao, Y. (2020). Zoned Out? Examining the Effect of Upzoning on Neighborhood Demographic Trends: A Fixed Effects Analysis. New York: New York University. Available online at: https://www.thewagnerreview.org/wp-content/uploads/2020/05/Team-1_Final-Version_v2.pdf
Armstrong, A., Been, V., Madar, J., and McDonnnell, S. (2010). How Have Recent Rezonings Affected the City's Ability to Grow? New York: NYU Furman Center. Available online at: https://furmancenter.org/files/publications/Rezonings_Furman_Center_Policy_Brief_March_2010.pdf
Atkinson-Palombo, C. (2010). Comparing the capitalisation benefits of light-rail transit and overlay zoning for single-family houses and condos by neighbourhood type in metropolitan Phoenix, Arizona. Urban Stud. 47, 2409–2426. doi: 10.1177/0042098009357963
Barbour, E., Grover, S., and Lamoureaux, Y. (2020). Planning and Policymaking for Transit-Oriented Development, Transit, and Active Transport in California Cities. Davis, CA: UC Davis.
Barr, J., and Cohen, J. P. (2014). The floor area ratio gradient: New York City, 1890–2009. Reg. Sci. Urban Econ. 48, 110–119. doi: 10.1016/j.regsciurbeco.2014.03.004
Been, V., Madar, J., and McDonnell, S. (2010). How do New York City's recent rezonings align with its goals for park accessibility? Cities Environ. 3, 6. doi: 10.15365/cate.3162010
Been, V., Madar, J., and McDonnell, S. (2014). Urban land-use regulation: are homevoters overtaking the growth machine? J. Empir. Leg. Stud. 11, 227–265. doi: 10.1111/jels.12040
Braubach, M., Egorov, A., Mudu, P., Wolf, T., Ward, T. C., and Martuzzi, M. (2017). Effects of urban green space on environmental health. Equity Resili. 2017, 187–205. doi: 10.1007/978-3-319-56091-5_11
Choi, K., and Zhang, M. (2017). The net effects of the built environment on household vehicle emissions: a case study of Austin, TX. Transp. Res. D: Transp. Environ. 50, 254–268. doi: 10.1016/j.trd.2016.10.036
Cox, D. T. C., Shanahan, D. F., Hudson, H. L., Plummer, K. E., Siriwardena, G. M., Fuller, R. A., et al. (2017). Doses of neighborhood nature: the benefits for mental health of living with nature. Bioscience 67, 147–155. doi: 10.1093/biosci/biw173
Davis, J. (2021). How do upzonings impact neighborhood demographic change? Examining the link between land use policy and gentrification in New York City. Land Use Policy 103, 105347. doi: 10.1016/j.landusepol.2021.105347
Dong, H. (2020). Higher density development for lower cost housing? understanding the multifamily housing market and the role of density in multifamily home prices. J. Plann. Educ. Res. doi: 10.1177/0739456X20912829
Dong, H. (2021). Exploring the impacts of zoning and upzoning on housing development: a quasi-experimental analysis at the parcel level. J. Plan. Educ. Res. 2021, 0739456X2199072. doi: 10.1177/0739456X21990728
Dougherty, C. (2020). California, Mired in a Housing Crisis, Rejects an Effort to Ease it, New York Times, Economy. Available online at: https://www.nytimes.com/2020/01/30/business/economy/sb50-california-housing.html
Fan, X., Thompson, B., and Wang, L. (1999). Effects of sample size, estimation methods, and model specification on structural equation modeling fit indexes. Struct. Equ. Modeling. 6, 56–83. doi: 10.1080/10705519909540119
Freeman, L., and Cai, T. (2015). White entry into black neighborhoods: advent of a new era? Ann. Am. Acad. Political Soc. Sci. 660, 302–318. doi: 10.1177/0002716215578425
Freemark, Y. (2018). Challenges in the creation of mixed-use affordable housing: measuring and explaining its limited prevalence. Hous. Policy Debate 28, 1004–1021. doi: 10.1080/10511482.2018.1506813
Freemark, Y. (2020). Upzoning Chicago: impacts of a zoning reform on property values and housing construction. Urban Affairs Rev. 56, 758–789. doi: 10.1177/1078087418824672
Gabbe, C. J. (2018). Residential zoning and near-roadway air pollution: an analysis of Los Angeles. Sustainable Cities Soc. 2018, S2210670717304456. doi: 10.1016/j.scs.2018.07.020
Glaeser, E., and Gyourko, J. (2003). The Impact of Building Restrictions on Housing Affordability, Economic Policy Review. New York: Federal Reserve Bank of New York, 21–39.
Greenaway, R. M., Pacheco, G., and Sorensen, K. (2020). The effect of upzoning on house prices and redevelopment premiums in Auckland, New Zealand. Urban Stud. 2020, 0042098020940602. doi: 10.2139/ssrn.3532027
Hamilton, M. (2017). Sage Encyclopedia of Communication Research Methods. Newbury Park: SAGE Publications, Inc.
Hill, E., Dorfman, J., and Kramer, K. (2009). Evaluating the impact of government land use policies on tree canopy coverage. Land Use Policy 27, 407–414. doi: 10.1016/j.landusepol.2009.05.007
Hooper, D., Coughlan, J., and Mullen, M. (2008). Structural equation modeling: guidelines for determining model fit. Electron. J. Bus. Res. Methods 6, 53–60. doi: 10.21427/D7CF7R
Hsiao-Tung, C. Existing zoning analysis for eco-community using structural equation model. Procedia Eng. 21(2011) 948–956. doi: 10.1016/j.proeng.2011.11.2099
Hu, L.-t., and Bentler, P. M. (1999). Cutoff criteria for fit indexes in covariance structure analysis: Conventional criteria versus new alternatives. Struct. Equ. Modeling 6, 1–55. doi: 10.1080/10705519909540118
Jahrl, I., Ejderyan, O., and Cavin, J. S. (2022). Community gardens as a response to the contradictions of sustainable urban policy: insights from the Swiss cities of Zurich and Lausanne. Front. Sustainable Food Syst. 6, 902684. doi: 10.3389/fsufs.2022.902684
Jones, C., and Kammen, D. M. (2014). Spatial distribution of U.S. household carbon footprints reveals suburbanization undermines greenhouse gas benefits of urban population density. Environm. Sci. Technol. 48, 895–902. doi: 10.1021/es4034364
Kaczynski, A. T., and Henderson, K. A. (2007). Environmental correlates of physical activity: a review of evidence about parks and recreation. Leis. Sci. 29, 315–354. doi: 10.1080/01490400701394865
Kashian, R., Tittle, R., and Cliff, S. (2020). The impact of density rezoning in a small. J. Real Estate Finance Econ. 61, 275–287. doi: 10.1007/s11146-019-09738-4
Kim, J. H., and Li, X. (2021). Building more housing near transit: –a spatial analysis of residential densification dynamics, Transport Policy 114, 15–24. doi: 10.1016/j.tranpol.2021.08.018
Kim, M. (2020). Upzoning and value capture: How U.S. local governments use land use regulation power to create and capture value from real estate developments. Land Use Policy 95, 104624. doi: 10.1016/j.landusepol.2020.104624
Kok, N., Monkkonen, P., and Quigley, J. M. (2014). Land use regulations and the value of land and housing: an intra-metropolitan analysis. J. Urban Econ. 81, 136–148. doi: 10.1016/j.jue.2014.03.004
Kuhlmann, D. (2021). Upzoning and single-family housing prices, J. Am. Planning Assoc. 87, 383–395. doi: 10.1080/01944363.2020.1852101
Laskow, S. (2014). “The quiet, massive rezoning of New York,” in Politico. Available online at: https://www.politico.com/states/new-york/city-hall/story/2014/02/the-quiet-massive-rezoning-of-new-york-078398
Loo, B. P. Y., Chen, C., and Chan, E. T. H. (2010). Rail-based transit-oriented development: Lessons from New York City and Hong Kong. Landscape Urban Plan. 97, 202–212. doi: 10.1016/j.landurbplan.2010.06.002
Merlin, L. A., Singer, M., and Levine, J. (2021). Influences on transit ridership and transit accessibility in US urban areas. Transport. Res. Part A: Policy Pract. 150, 63–73. doi: 10.1016/j.tra.2021.04.014
Meshcheryakov, G. (2020). semopy: A python package for structural equation modeling. Struct. Equ. Modeling. 27, 952–963. doi: 10.1080/10705511.2019.1704289
Mincey, S. K., Schmitt-Harsh, M., and Thurau, R. (2013). Zoning, land use, and urban tree canopy cover: the importance of scale. Urban Forest. Urban Green. 12, 191–199. doi: 10.1016/j.ufug.2012.12.005
Neyns, R., and Canters, F. (2022). Mapping of urban vegetation with high-resolution remote sensing: a review. Remote Sens. 14, 1031. doi: 10.3390/rs14041031
NYC Department of City Planning (2002/2010). Primary Land Use Tax Lot Output. Available online at: https://www1.nyc.gov/site/planning/data-maps/open-data/dwn-pluto-mappluto.page
Nzau, B., and Trillo, C. (2019). Harnessing the real estate market for equitable affordable housing provision through land value capture: insights from San Francisco City, California. Sustainability. 11, 3649. doi: 10.3390/su11133649
Operti, F. G., Moreira, A. A., Reis, S. D. S., et al. (2022). Dynamics of racial residential, segregation and gentrification in New York City. Front. Phys. 9, 777761. doi: 10.3389/fphy.2021.777761
Rodríguez-Pose, A., and Storper, M. (2019). Housing, urban growth and inequalities: The limits to deregulation and upzoning in reducing economic and spatial inequality. Urban Stud. 2019, 004209801985945. doi: 10.1177/0042098019859458
Rohe, W. M., and Stewart, L. S. (1996). Homeownership and neighborhood stability. Housing Policy Debate. 7, 37–81. doi: 10.1080/10511482.1996.9521213
Shen, Q., and Sun, F. (2020). What Makes Mixed-Use Development Economically Desirable? Lincoln Institute of Land Policy. Available online at: https://www.lincolninst.edu/sites/default/files/pubfiles/shen_wp20qs1.pdf
Sutton, S. (2020). Gentrification and the increasing significance of racial transition in New York City 1970–2010. Urban Affairs Rev. 56, 65–95. doi: 10.1177/1078087418771224
Torres-Sánchez, J., Peña, J. M., de Castro, A. I., and López-Granados, F. (2014). Multi-temporal mapping of the vegetation fraction in early-season wheat fields using images from UAV. Comp. Electron. Agricult. 103, 104–113. doi: 10.1016/j.compag.2014.02.009
US Census Bureau (2010/2018a). Demographic and Housing Estimates, 2006-2010/2014-2018 American Community Survey. Available online at: https://data.census.gov/cedsci/table?q=DP05&g=0500000US36005%241400000,36047%241400000,36061%241400000,36081%241400000,36085%241400000&tid=ACSDP5Y2010.DP05
US Census Bureau (2010/2018b). Means of Transportation to Work by Selected Characteristics, 2006-2010/2014-2018 American Community Survey. Available online at: https://data.census.gov/cedsci/table?q=S0802&g=0500000US36005%241400000,36047%241400000,36061%241400000,36081%241400000,36085%241400000
US Census Bureau (2010/2018c). Selected Economic Characteristics, 2006-2010/2014-2018 American Community Survey. Available online at: https://data.census.gov/cedsci/table?q=DP03&g=0500000US36005%241400000,36047%241400000,36061%241400000,36081%241400000,36085%241400000
US Census Bureau (2010/2018d). Selected Housing Characteristics, 2006-2010/2014-2018 American Community Survey. Available online at: https://data.census.gov/cedsci/table?q=DP04&g=0500000US36005%241400000,36047%241400000,36061%241400000,36081%241400000,36085%241400000
US Census Bureau (2010/2018e). Selected Social Characteristics in the United States, 2006-2010/2014-2018 American Community Survey. Available online at: https://data.census.gov/cedsci/table?q=DP02&g=0500000US36005%241400000,36047%241400000,36061%241400000,36081%241400000,36085%241400000
Whittemore, A. H. (2017). Racial and class bias in zoning: rezonings involving heavy commercial and industrial land use in Durham (NC), 1945–2014. J. Am. Planning Assoc. 83, 235–248. doi: 10.1080/01944363.2017.1320949
Winke, T. (2021). Housing affordability sets us apart: the effect of rising housing prices on relocation behaviour. Urban Stud. 58, 2389–2404. doi: 10.1177/0042098020943482
Woebbecke, D. M., Meyer, G. E., Von Bargen, K., and Mortensen, D. A. (1995). Color indices for weed identification under various soil, residue, and lighting conditions. Trans. ASAE. 38(1), 259–269. doi: 10.13031/2013.27838
Wu, H., Levinson, D., and Sarkar, S. (2019). How transit scaling shapes cities. Nat. Sustainab. 2, 1142–1148. doi: 10.1038/s41893-019-0427-7
Xue, J., and Su, B. (2017). Significant remote sensing vegetation indices: a review of developments and applications. J. Sens. 2017, 1–17. doi: 10.1155/2017/1353691
Yun, H. S., Park, S. H., Kim, H.-J., Lee, W. D., Lee, K. D., Hong, S. Y., et al. (2016). Use of unmanned aerial vehicle for multi-temporal monitoring of soybean vegetation fraction. J. Biosyst. Eng. 41, 126–137. doi: 10.5307/JBE.2016.41.2.126
Zhang, W., Lu, D., Chen, Y., and Liu, C. (2021). Land use densification revisited: Nonlinear mediation relationships with car ownership and use. Transp. Res. Part D. 98, 102985. doi: 10.1016/j.trd.2021.102985
Keywords: path analysis, land use, greenspace, densification, transportation, housing
Citation: Lian JA, Khare A and Vernooy K (2023) In the zone: the effects of 2002–2010 upzoning on urban life in New York City. Front. Sustain. Cities 5:1149753. doi: 10.3389/frsc.2023.1149753
Received: 23 January 2023; Accepted: 05 September 2023;
Published: 29 September 2023.
Edited by:
Victor L. Barradas, National Autonomous University of Mexico, MexicoReviewed by:
Manuel Esperon-Rodriguez, Western Sydney University, AustraliaChristine Haaland, Swedish University of Agricultural Sciences, Sweden
Copyright © 2023 Lian, Khare and Vernooy. This is an open-access article distributed under the terms of the Creative Commons Attribution License (CC BY). The use, distribution or reproduction in other forums is permitted, provided the original author(s) and the copyright owner(s) are credited and that the original publication in this journal is cited, in accordance with accepted academic practice. No use, distribution or reproduction is permitted which does not comply with these terms.
*Correspondence: James A. Lian, amFtZXNhbnhpbmxpYW5AZ21haWwuY29t