Statistical Analysis of Simulated Spaceborne Thermodynamics Lidar Measurements in the Planetary Boundary Layer
- 1Howard University, Washington, DC, United States
- 2University of Basilicata, Potenza, Italy
- 3University of Hohenheim, Stuttgart, Germany
The performance of a spaceborne Raman lidar offering measurements of water vapor, temperature, aerosol backscatter and extinction is assessed statistically by use of a lidar simulator and a global model to provide inputs for simulation. The candidate thermodynamics lidar system is envisioned to make use of a sun-synchronous, dawn/dusk orbit. Cloud-free atmospheric profiles simulated by the NASA/GSFC GEOS model for the orbit of the CALIPSO satellite on 15 July 2009 were used as input to a previously validated lidar simulator where GEOS profiles that satisfy the solar zenith angle restrictions of the dawn/dusk orbit, and are located within the Planetary Boundary Layer as defined by the GEOS model, were selected for the statistical analysis. To assess the performance of the simulated thermodynamics lidar system, measurement goals were established by considering the WMO Observing Systems Capability Analysis and Review (OSCAR) requirements for Numerical Weather Prediction. The efforts of Di Girolamo et al., 2018 established the theoretical basis for the current work and discussed many of the technological considerations for a spaceborne thermodynamics lidar. The work presented here was performed during 2017–2018 under the auspices of the NASA/GSFC Planetary Boundary Layer Science Task Group and expanded on previous efforts by considerably increasing the statistical robustness of the performance simulations and extending the statistics to include those of aerosol backscatter and extinction measurements. Further work that is currently being conducted includes Observing Systems Simulation Experiments to assess the impact of a thermodynamics lidar on global forecast improvement.
1 Introduction
The National Academy of Science (NAS) in the 2018 Decadal Survey (NAS, National Academies of Sciences, Engineering, and Medicine, 2018) identified the Planetary Boundary Layer (PBL) as a key targeted observable and specified lidar as one of the prime technologies for measuring it. There are many reasons for the identified high importance of the PBL within the Decadal Survey. Accurate, high spatial and temporal resolution observations in the PBL of temperature and water vapor, referred to as thermodynamic profiles, are essential for improving weather forecasting (Crook, 1996; Dierer et al., 2009) and model re-analysis (Bengtsson et al., 2004). Furthermore, these measurements are also important for understanding land-surface interactions and thus parameterizations of those processes and others in regional climate models (Warrach-Sagi et al., 2013; Kotlarski et al., 2014). Wulfmeyer et al., 2015 demonstrated that global scale measurements of thermodynamics profiles within the PBL would have a significant impact on our understanding of the Earth’s systems. In response to the NAS findings in the Decadal Survey and in support of European Space Agency initiatives, Di Girolamo et al., 2018 (DiG2018) simulated the measurement capability of a spaceborne thermodynamics lidar utilizing a sun-synchronous dawn/dusk orbit. They studied the performance of the lidar system using US Standard, Tropical, mid-latitude Winter and Summer atmospheres and considered attenuation by clouds. Here we use the NASA/GSFC GEOS model to provide a large number of cloud-free input profiles permitting a statistical analysis of the measurement capability of the thermodynamics lidar system, first studied in DiG2018, within the PBL.
The work reported here occurred during the period 2017–2018 under the auspices of the NASA/GSFC PBL Science Task Group. It is part of an on-going effort, led by the Universities of Basilicata and Hohenheim, focused on determining the utility of spaceborne thermodynamics lidar in improving short term weather forecasting and other predictive parameters. The goal of the overall activity is to use simulated thermodynamics lidar profiling as demonstrated here in Observation Systems Simulation Experiments (OSSE) to assess the impact of the spaceborne lidar system.
The paper is structured as follows. In part 2 we review the methods, pertinent equations and datasets used in the study. In part 3 we provide visual displays of the performance of the spaceborne lidar for measuring temperature, water vapor and aerosols under both day and night, cloud-free, conditions. Then a selection of profiles is made consistent with a dawn/dusk orbit. Using that orbit, the performance of the lidar system within the PBL is analyzed statistically. Part 4 concludes the paper with a discussion of the results here and looks toward the additional work involving OSSEs that fully considers the influence of clouds and is currently in progress.
2 Methods and Techniques
Raman lidar has been used for several decades for a wide variety of studies including that of water vapor profiling in the lower atmosphere (Melfi and Whiteman, 1985, Goldsmith et al., 1998; Whiteman, 2003a; Whiteman, 2003b), temperature profiling in the convective boundary layer (Behrendt et al., 2015), aerosol backscatter and extinction for studying aerosol hygroscopic growth (Ferrare et al., 1998a; Ferrare et al., 1998b; Veselovskii et al., 2009). The lidar technique makes use of a laser transmitter, telescope receiver, wavelength selection optics and sophisticated data acquisition electronics to acquire profiles of atmospheric constituents with high temporal and spatial resolution and has been extensively discussed previously (e.g., Weitkamp, 2005). The Raman lidar makes use of an inelastic scattering process, first discovered by C. V. Raman and K. S. Krishnan in 1928 (Raman, 1928; Raman and Krishnan, 1928), that exploits molecular vibrational or rotational transitions and spectroscopic techniques in order to identify different atmospheric molecules such as water vapor, nitrogen, oxygen, carbon dioxide, etc.
Much has been written previously about the use of Raman lidar for a wide variety of atmospheric studies so we will refer readers to the references cited above for further background and the equations that give the lidar signal as a function of range. For the purposes of the lidar simulations performed here we will briefly detail the important equations to illustrate which quantities must be simulated in order to assess the measurement performance of the lidar system. The Raman lidar as studied here collects four lidar signals: the water vapor vibrational Raman signal, PH2O(z), two rotational Raman signals from high- and low-quantum number transitions, PloJ(z) and PHiJ(z), and the direct backscatter signal at λ0,
2.1 Calculation of Temperature, Water Vapor Mixing Ratio, Aerosol Backscatter and Extinction
The direct calculation of atmospheric temperature is obtained from the rotational Raman backscattered signals through the expression (Behrendt and Reichardt, 2000):
where Q(z) = PHiJ(z)/PLoJ(z) and PLoJ(z) and PHiJ(z) are the low (LoJ) and high (HiJ) quantum number rotational Raman backscatter signals at wavelengths λLoJ and λHiJ, respectively, received from altitude z in the anti-Stokes branch of the rotational Raman spectrum, and α and β are two calibration constants. The spectral locations of λLoJ and λHiJ were identified through a sensitivity analysis that accounted for various atmospheric and instrumental parameters such as the signal-to-background ratio, the filter bandwidths and filter shapes, and the temperature range of interest (Hammann and Behrendt, 2015). For the present system, λLoJ and λHiJ were identified with the purpose of optimizing daytime measurement performance in the convective PBL and were found to be λLoJ = 354.36 nm and λHiJ = 353.29 nm.
The direct calculation of the water vapor mixing ratio, w, is obtained from Raman backscattered signals through the following equation (Whiteman et al., 1992)
where PH2O(z) is the water vapor vibrational Raman lidar signal at wavelength λH2O, while Pref(z) is a nearly temperature-independent reference signal obtained through a linear combination of the two temperature sensitive rotational Raman lidar signals PLoJ(z) and PHiJ(z) at the two nearby wavelengths λLoJ and λHiJ, K is a calibration constant (Whiteman et al., 1992; Whiteman, 2003b; Di Girolamo et al., 2018), ΔT(z) is the differential transmission term accounting for the different atmospheric transmission by molecules and aerosols at λH2O and λHiJ,LoJ.
The vertical profile of the particle backscattering coefficient
where
where
Thus, the simulation of the performance of the candidate Raman lidar is accomplished by numerically evaluating the equations above, along with their corresponding uncertainty equations, to generate synthetic signals due to backscattered radiation at the laser wavelength (354.7 nm), vibrational Raman scattering from water vapor (407.5 nm), rotational Raman scattering from HiJ (353.29 nm) and LoJ (354.36 nm) channels. The methods used to simulate these signals will now be discussed.
2.2 Raman Water Vapor Lidar Model and Previous use, Comparison With Di Girolamo et al
The Raman lidar simulator that was used here has been used extensively for simulations of lidar measurements of water vapor from both airborne (Whiteman et al., 2001) and ground-based (Whiteman et al., 2010) platforms and is an implementation of the lidar equation, (Measures, 1984) that carries physical units through the entire simulation chain including for background skylight. The model was also recently upgraded to perform simulations of spaceborne measurements of aerosol backscatter and extinction (Whiteman et al., 2018). To support the studies here, that model was extended further to include simulations of lidar signals from rotational Raman scattering. Prior to the work described here, comparisons were made between the water vapor and temperature profile simulations of this revised model and those in DiG2018 and excellent agreement between the models was found.
DiG2018 used four standard atmospheres (US Standard-1976, Tropical, Mid-Latitude Summer and Mid-Latitude Winter) to perform their study of spaceborne thermodynamics lidar performance. Here we make use of a 24-h orbit simulation performed by the NASA/GSFC GEOS model (Rienecker et al., 2008) to provide a large number of simulated lidar profiles under a range of geographic and climate conditions.
2.3 GEOS Dataset and 3+2 Simulations
The atmospheric profiles of water vapor, temperature, aerosols and atmospheric density that were used as input to the lidar simulator were provided by the NASA/GSFC GEOS model (Rienecker et al., 2008) for a 24-h orbit of the CALIPSO platform on 15 July 2009. A 10-s temporal resolution was used in the simulations resulting in 8,640 profiles with horizontal resolution of approximately 80 km. This is the same simulation dataset that was used in Whiteman et al., 2018 for simulating spaceborne measurements of aerosol backscatter and extinction. Skylight irradiance values were provided along with the GEOS simulations by the VLIDORT (Vector LInearized Discrete Ordinate Radiative Transfer) radiative transfer model (Spurr, 2006).
2.4 Thermodynamics Spaceborne Lidar Specifications
The spaceborne platform that is simulated here is the same as studied in DiG2018. It consists of a 4 m diameter telescope, 100 Hz laser with 2.5 J per pulse at 354.7 nm. The optical receiver uses a field of view of 25 µrad and collects and processes signals from water vapor Raman backscatter (407.5 nm), Rayleigh-Mie backscatter (354.7 nm), HiJ and LoJ rotational Raman backscatter (353.29, 354.36 nm, respectively). The orbit considered has an altitude of 450 km and is sun-synchronous such that the solar zenith angle (SZA) always exceeds 65°. This orbit was selected to avoid the high solar background associated with brighter parts of the day. DiG2018 studied 4 standard atmosphere scenarios and concluded that the candidate thermodynamics lidar system is able to perform day- and night-time atmospheric water vapor mixing ratio and temperature measurements in cloud-free conditions with an accuracy fulfilling observational requirements for NWP. Many more details of the spaceborne lidar are contained in DiG2018, to which the authors refer the reader, and thus will not be repeated here.
Here we extend the work of DiG2018 by considering a 24-h simulation of atmospheric profiles along the CALIPSO orbit of 15 July 2009 provided by the NASA/GSFC GEOS model. Only clear sky scenarios are considered here. DiG2018 considered the influence of clouds and found that NWP and climate research observational requirements can be met above and below thin cirrus clouds with optical depths of 0.3. The more detailed OSSE work currently being performed will consider the full influence of clouds on forecast improvement.
2.4.1 Orbit and Skylight Considerations, Selection From the GEOS Dataset
As mentioned above, a dawn/dusk orbit for which the solar zenith angle is always greater than 65° was simulated in DiG2018. The range of SZA experienced during the dawn/dusk orbit varies by time of the year and by latitude as can be seen on the left side of Figure 1 which is reproduced from DiG2018. The CALIPSO platform follows the A-train orbit and thus covers SZAs that are as small as ∼20°. To assess the performance of the thermodynamics lidar for a dawn/dusk orbit, therefore, a selection from the full 24-h CALIPSO simulation that is consistent with the dawn/dusk orbits was performed. That selection is shown on the right side of Figure 1 with the selected {latitude, SZA} pairs being shown in yellow. This selection yielded 2,117 profiles out of the total 8,640 profiles contained in the 24-h CALIPSO orbit simulation and resulted in latitudes between
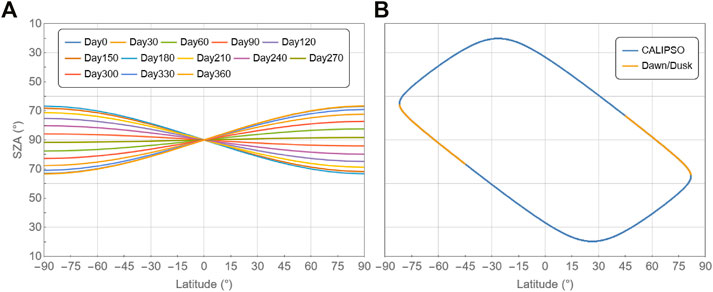
FIGURE 1. (A) Solar zenith angle as a function of latitude and Julian day of the year for the dawn/dusk orbit envisioned for the thermodynamics lidar. (B) SZA vs latitude for the CALIPSO orbit of 15 July 2009 (blue and orange) with the selection of the portion of the orbit characterized by SZA values corresponding to the dawn/dusk orbit shown (orange).
2.5 Performance Metrics
To assess the performance of the simulated thermodynamics lidar system, measurement metrics were established by considering the WMO Observing Systems Capability Analysis and Review (WMO Oscar, 2021) requirements for Global NWP and are listed in Table 1. OSCAR is the official repository of requirements for observation of physical variables in support of World Meteorological Programs. In the OSCAR database of atmospheric parameters, different measurement requirements are identified as “threshold”, “goal”, or “breakthrough” where “threshold” specifies the minimum requirement to be met to ensure that data are useful. As described in the OSCAR documentation, the “goal” is an ideal requirement above which further improvements are not necessary. The “breakthrough” is an intermediate level between “threshold” and “goal” which, if achieved, would result in a significant improvement for the targeted application. The breakthrough level may be considered as optimum, from a cost-benefit point of view, when planning or designing observing systems (WMO Oscar, 2021). For characterizing the performance of the spaceborne thermodynamics lidar measurements of temperature and water vapor (specific humidity), we will consider the OSCAR “breakthrough” requirements for global Numerical Weather Prediction (NWP) which are listed in Table 1. The OSCAR requirements for measurements of aerosol backscatter and extinction are not well-defined so we will consider metrics for those quantities that are similar to spatial and temporal resolution of airborne measurements of aerosol backscatter and extinction (Whiteman et al., 2010). The 2,117 profiles that are consistent with a dawn/dusk orbit will be assessed for their measurement performance based on the metrics specified in Table 1. Prior to presenting that statistical analysis, however, a visual illustration of simulated lidar performance within the PBL will be presented next.
3 Results
To give a visual impression of what the measurements of the thermodynamics lidar system studied here would be like for the full CALISO orbit, Figure 2 presents comparisons of approximately 1.25 h (out of the full 24-h orbit) of the GEOS input and lidar simulations of temperature, water vapor, aerosol backscatter and aerosol extinction under cloud-free conditions. On the left side of Figure 2 is shown the GEOS model inputs for temperature, water vapor mixing ratio, aerosol backscatter and extinction. On the right side of the figure are shown the corresponding lidar simulations. The orbit path that was simulated by the GEOS model is shown in Figure 3. The general fidelity of all measurements is evident from these visual displays with the comparisons of temperature and aerosol backscatter being the most impressive. There is, however, significant degradation in the water vapor measurements during full daylight conditions. The portion of the dataset with the sun above the local horizon is shown with a yellow line in the upper left of the lidar simulations. Degradation in the water vapor measurement capability during the daytime is the main motivator for the dawn/dusk orbit that was selected for the thermodynamics lidar analyzed here.
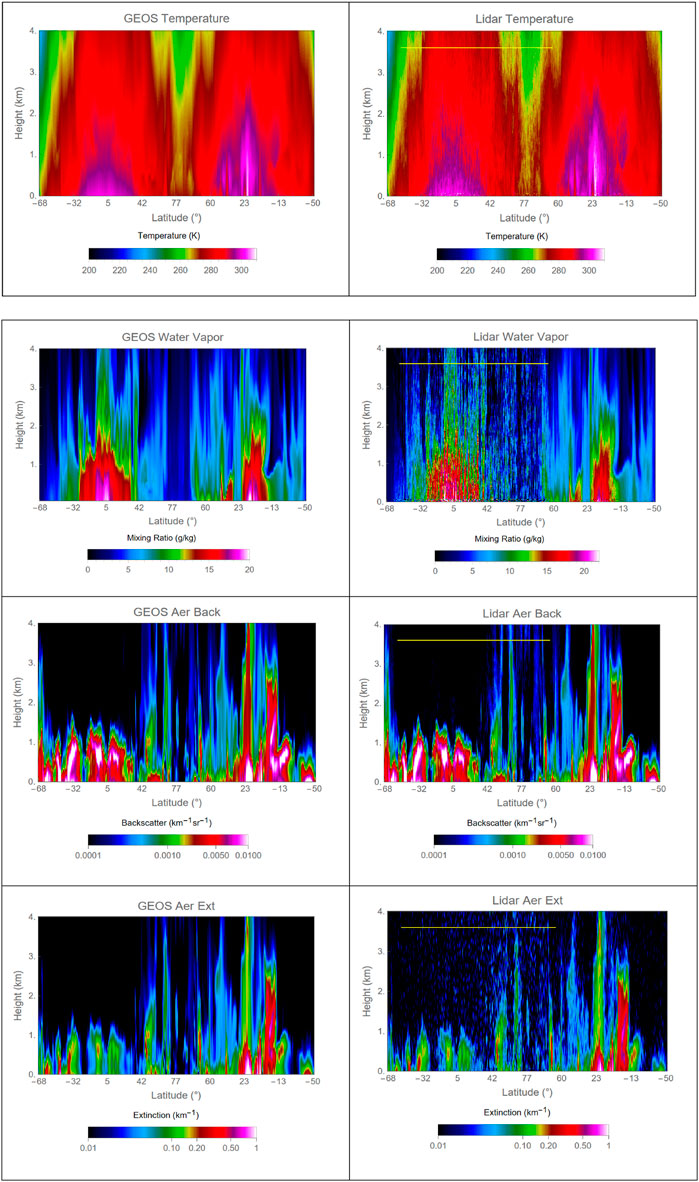
FIGURE 2. Comparison of GEOS input and lidar simulations for approximately 1.25 h of the 24 h CALISPO orbit. The plots extend to an altitude of 4 km consistent with the focus on lidar performance within the PBL. The portion of the image where the sun is above the horizon is shown with a yellow line in the upper left of the lidar images. See text for further details.
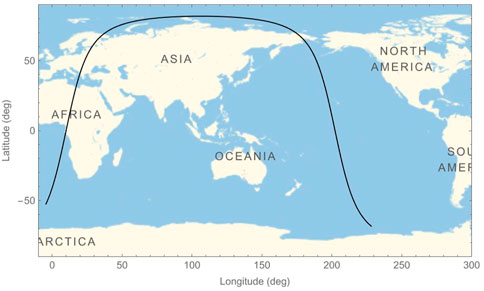
FIGURE 3. Orbital path of the GEOS and lidar simulations shown in Figure 2.
3.1 Selection From the Full CALIPSO Orbit
Now we consider example profiles from the population selected according to the dawn/dusk criteria illustrated in Figure 1 which will be used to quantify the performance of the thermodynamics lidar according to the performance metrics shown in Table 1. Figure 4 presents the temperature, water vapor mixing ratio, aerosol backscatter and extinction profiles for a location over south-central Russia when the solar zenith angle was approximately 96°. Both GEOS input and lidar simulated profiles are shown. All lidar simulations use a 10-s average. The lidar simulated temperature and water vapor profiles (top of Figure 4) are both presented with their base resolution of 30 m vertical resolution as well as averaged to 1,000 m as needed for the statistical assessment based on the OSCAR performance metrics shown in Table 1. The simulated lidar aerosol backscatter and extinction profiles (bottom) are displayed with the 30 m and 250 m vertical resolutions, respectively, that are indicated in Table 1. The lidar simulations represent well the GEOS inputs although the random fluctuations due to both skylight background and counting statistics are evident. We will now study the statistics of the 4 quantities shown in Figure 4 using the selected population that approximates the dawn/dusk orbit shown in Figure 1.
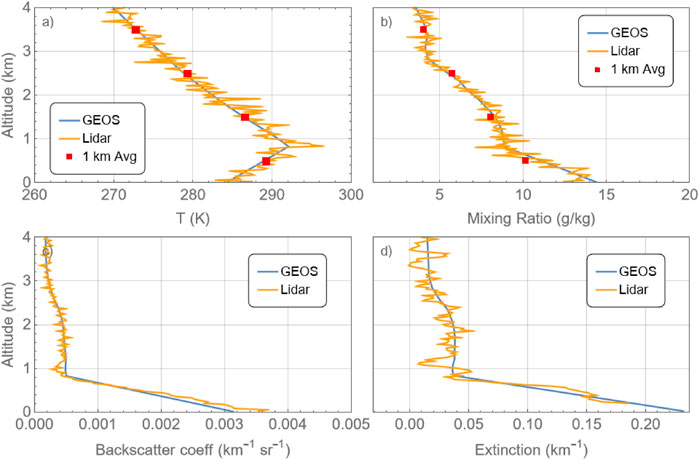
FIGURE 4. Temperature (A), water vapor (B), aerosol backscatter (C) and aerosol extinction (D) profile comparisons of GEOS inputs and lidar simulation. The temperature and water vapor profiles are displayed both at base resolution (30 m, 80 km) and averaged to 1,000 m per the OSCAR breakthrough metrics shown in Table 1. The aerosol backscatter and extinction profiles are displayed with the 30 m and 250 m vertical resolutions, respectively, that are indicated in Table 1.
3.2 Temperature Statistics
Figure 5 presents the analysis of temperature uncertainty statistics using the uncertainty formulation shown in Equation 5 (Behrendt and Reichardt, 2000; Di Girolamo et al., 2004).
where all terms have been previously defined except
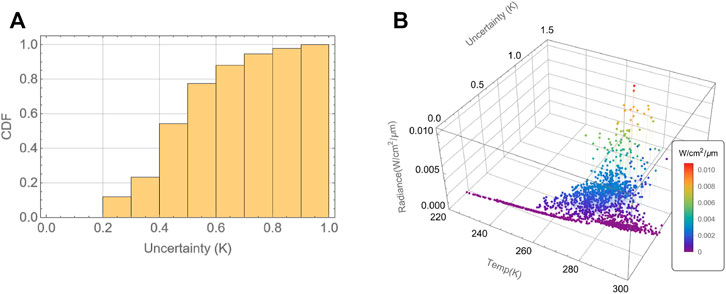
FIGURE 5. (A) Cumulative Distribution Function for the PBL temperature uncertainty, (B) temperature uncertainty as a function of background radiance.
3.3 Water Vapor Statistics
Figure 6 presents an analysis of the mixing ratio uncertainty for the measurements selected that are consistent with a dawn/dusk orbit and that occurred within the PBL as identified by the GEOS model. The formulation for the water vapor mixing ratio uncertainty (Whiteman, 2003a; Whiteman, 2003b, DiG2018) that will be used is given in Equation 6
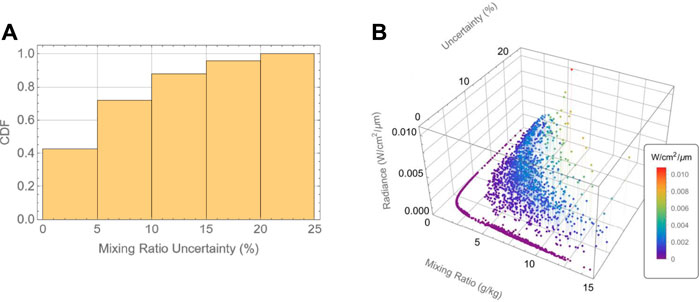
FIGURE 6. (A) Cumulative Distribution Function for the PBL water vapor mixing ratio simulations. (B) water vapor mixing ratio uncertainty as a function of background radiance.
Considering the OSCAR threshold requirements of 1,000 m vertical resolution and 50 km horizontal resolution, Figure 6A indicates that 42% of the measurements meet the OSCAR requirement of 5% uncertainty, while 72% of the measurements have random uncertainty less than 10% and essentially all of the selected measurements have uncertainties less than 25%. These results are for a selection of cases restricted to the latitude range of 45.0–81.8°, as mentioned previously. Figure 6B illustrates the effect of higher background radiance levels on the mixing ratio measurements. There is a consistent increase in the uncertainty of the measurement when either the mixing ratio decreases or the radiance value increases as expected from Equation 6. As in the discussion relating to Equation 5, sun positions increasingly above the horizon are the main contributors to increasing background radiance values.
3.4 Aerosol Backscatter and Extinction Statistics
The equations used to assess the uncertainty of aerosol backscatter and extinction may be found in DiG2018 and are not repeated here. Figure 7 presents the cumulative probability distributions for uncertainties in aerosol backscatter 1) and aerosol extinction 2) using the set of 2,117 selected profiles. The results indicate that, using the performance metrics listed in Table 1 of 50 km horizontal and 30 m vertical resolution, the aerosol backscatter uncertainties always remain less than 1% easily exceeding the performance metric of 5%. This result is statistical confirmation of the high fidelity simulations shown in Figure 2. Using the corresponding metrics for aerosol extinction of 80 km horizontal and 250 m vertical resolution, 42% of the measurements are performed with uncertainties of 20% or less.

FIGURE 7. Cumulative Distribution Function for the uncertainty in PBL aerosol backscatter coefficient (A) and aerosol extinction (B) simulations.
4 Discussion
The performance of a spaceborne thermodynamics Raman lidar for measuring temperature, water vapor and aerosols is studied here using a set of metrics derived from the OSCAR database, for temperature and water vapor, as well as previous lidar performance metrics for aerosol backscatter and extinction. We use a selected set of profiles within the PBL from a simulated CALIPSO orbit performed by the NASA/GSFC GEOS model. The selection resulted in measurement simulations with solar zenith angles of 65° or greater being included thus making the sky background conditions consistent with the assumed dawn/dusk orbit of the thermodynamics orbit. However, as noted earlier, this selection of profiles included only latitudes between 45 and 81.8° thus systematically excluding the moist tropical and sub-tropical boundary layer environments. Note, though, that the full range of longitudes is included in the selection. The proper simulation of the thermodynamics lidar for a dawn/dusk orbit is in progress thus we only estimate here the influence of this mid-high latitude selection bias on the statistical performance of the lidar system.
To first order, we assume that the mid-high latitude selection bias has no effect on the temperature statistics since a wide range of temperatures is included in the selected profiles. We speculate that there is likely a small effect on the aerosol backscatter and extinction statistics due to the mid-high latitude selection. Some of the most polluted regimes are systematically excluded due to the current selection and these areas might be measured with improved statistics. We do not consider this effect to be large, however, thus we speculate that 50% or more of the extinction measurements could be made with uncertainties of less than 20% if the full set of latitudes had been included. The aerosol backscatter statistics will likely improve as well. However, they already well exceed the measurement metrics shown in Table 1 indicating that the thermodynamics lidar studied here will be sensitive to even very light aerosol scattering globally.
The measurement parameter that is most affected by the mid-high latitude bias is certainly water vapor mixing ratio. The mean mixing ratio of the selected cases is less than 5 g/kg and only 5% of the selected cases have mixing ratios that exceed 10 g/kg while in the tropics mixing ratios in the boundary layer can exceed 20 g/kg. The water vapor signal received by the lidar is directly proportional to the water vapor concentration thus one can expect that measurements in the tropics could result in signals on average 3–4 times larger than the mean signals studied here. Equation 6 shows the square root relationship of the overall uncertainty and the
Summarizing the performance of the thermodynamics lidar with respect to the performance metrics shown in Table 1 after considering the influence of the mid-high latitude bias in the case selection, we find that for the cloud-free conditions within the planetary boundary layer considered here:
1) Temperature: 100% the measurements will be sampled with uncertainties of less than 1 K
2) Water vapor mixing ratio: we estimate that more than 50% of the measurements, perhaps much more, will possess uncertainties less than 5% and that more than 80% of the measurements will possess uncertainties of less than 10%
3) Aerosol backscatter coefficient: 100% of the measurements will possess uncertainties less than 1% easily exceeding the performance metric of 5% uncertainty for this parameter
4) Aerosol extinction coefficient: we estimate that more than 50% of the measurements will possess random uncertainties of less than 20%
As already stated, the rigorous assessment of the uncertainties of the thermodynamics for a full dawn/dusk orbit including the effects of clouds is in progress. However, the very positive performance metrics demonstrated here by the thermodynamics lidar system indicates that having such measurements on a global scale could strongly impact models used for weather forecasting, calibration of space-borne passive remote sensing systems and for convective scale data assimilation studies. Improvement in these areas implies that the thermodynamics lidar could thus greatly increase our understanding of and ability to predict the Earth’s water and energy cycles.
Data Availability Statement
The original contributions presented in the study are included in the article/Supplementary Material, further inquiries can be directed to the corresponding author.
Author Contributions
DW was the first author and performed the numerical simulations of the thermodynamics lidar as well as the analysis of its statistical performance. PD and NF performed simulations of profiles to compare with those generated by the model of DW in order to check and validate both models. AB consulted in all areas of the effort but particularly in the area of temperature profile measurements by lidar. VW consulted in all areas of the effort but particularly in the application of the measurements to global studies.
Funding
The effort reported here was supported by the NASA/GSFC Planetary Boundary Layer Science Task Group led by Dr. Joseph Santanello.
Conflict of Interest
The authors declare that the research was conducted in the absence of any commercial or financial relationships that could be construed as a potential conflict of interest.
Publisher’s Note
All claims expressed in this article are solely those of the authors and do not necessarily represent those of their affiliated organizations, or those of the publisher, the editors and the reviewers. Any product that may be evaluated in this article, or claim that may be made by its manufacturer, is not guaranteed or endorsed by the publisher.
Acknowledgments
Special thanks to Dr. Arlindo Da Silva, Dr. Peter Colarco and Dr. Virginie Buchard of NASA/Goddard Space Flight Center for the continuing collaboration in the use of the GEOS model for instrument simulation studies.
References
Ansmann, A., Riebesell, M., and Weitkamp, C. (1990). Measurement of Atmospheric Aerosol Extinction Profiles with a Raman Lidar. Opt. Lett. 15, 746–748. doi:10.1364/ol.15.000746
Ansmann, A., Wandinger, U., Riebesell, M., Weitkamp, C., and Michaelis, W. (1992). Independent Measurement of Extinction and Backscatter Profiles in Cirrus Clouds by Using a Combined Raman Elastic-Backscatter Lidar. Appl. Opt. 31, 7113–7131. doi:10.1364/ao.31.007113
Behrendt, A., and Reichardt, J. (2000). Atmospheric Temperature Profiling in the Presence of Clouds with a Pure Rotational Raman Lidar by Use of an Interference-Filter-Based Polychromator. Appl. Opt. 39, 1372–1378. doi:10.1364/ao.39.001372
Behrendt, A., Wulfmeyer, V., Hammann, E., Muppa, S. K., and Pal, S. (2015). Profiles of Second- to Fourth-Order Moments of Turbulent Temperature Fluctuations in the Convective Boundary Layer: First Measurements with Rotational Raman Lidar. Atmos. Chem. Phys. 15, 5485–5500. doi:10.5194/acp-15-5485-2015
Bengtsson, L., Hodges, K. I., and Hagemann, S. (2004). Sensitivity of the ERA40 Reanalysis to the Observing System: Determination of the Global Atmospheric Circulation From Reduced Observations. Tellus Ser. A: Dyn. Meterol. Oceanogr. 56 (5), 456–471.
Crook, N. A. (1996). Sensitivity of Moist Convection Forced by Boundary Layer Processes to Low-Level Thermodynamic Fields. Mon. Wea. Rev. 124, 1767–1785. doi:10.1175/1520-0493(1996)124<1767:somcfb>2.0.co;2
Di Girolamo, P., Behrendt, A., and Wulfmeyer, V. (2018). Space-borne Profiling of Atmospheric Thermodynamic Variables with Raman Lidar: Performance Simulations. Opt. Express 267, 8125–8161. doi:10.1364/oe.26.008125
Di Girolamo, P., Marchese, R., Whiteman, D. N., and Demoz, B. B. (2004). Rotational Raman Lidar Measurements of Atmospheric Temperature in the UV. Geophys. Res. Lett. 31, L01106. doi:10.1029/2003GL018342
Di Girolamo, P., Behrend, A., and Wulfmeyer, V. (2006). Spaceborne Profiling of Atmospheric Temperature and Particle Extinction with Pure Rotational Raman Lidar and of Relative Humidity in Combination with Differential Absorption Lidar: Performance Simulations. Appl. Opt. 45 (11), 2474–2494.
Dierer, S., Arpagaus, M., Seifert, A., Avgoustoglou, E., Dumitrache, R., Grazzini, F., et al. (2009). Deficiencies in Quantitative Precipitation Forecasts: Sensitivity Studies Using the COSMO Model. Meteorol. Z. 18, 631–645. doi:10.1127/0941-2948/2009/0420
Ferrare, R. A., Melfi, S. H., Whiteman, D. N., Evans, K. D., and Kaufman, M. Y. J. (1998b). Raman Lidar Measurements of Aerosol Extinction and Backscattering: 2. Derivation of Aerosol Real Refractive index, Single-Scattering Albedo, and Humidification Factor Using Raman Lidar and Aircraft Size Distribution Measurements. J. Geophys. Res. 103 (D16), 19673–19689. doi:10.1029/98jd01647
Ferrare, R. A., Melfi, S. H., Whiteman, D. N., Evans, K. D., and Leifer, R. (1998a). Raman Lidar Measurements of Aerosol Extinction and Backscattering: 1. Methods and Comparisons. J. Geophys. Res. 103 (D16), 19663–19672. doi:10.1029/98jd01646
Goldsmith, J. E. M., Blair, F. H., Bisson, S. E., and Turner, D. D. (1998). Turn-key Raman Lidar for Profiling Atmospheric Water Vapor, Clouds, and Aerosols. Appl. Opt. 37, 4979–4990. doi:10.1364/ao.37.004979
Hammann, E., and Behrendt, A. (2015). Parametrization of Optimum Filter Passbands for Rotational Raman Temperature Measurements. Opt. Express 23, 30767–30782. doi:10.1364/oe.23.030767
Kotlarski, S., Keuler, K., Christensen, O. B., Colette, A., Déqué, M., Gobiet, A., et al. (2014). Regional Climate Modeling on European Scales: A Joint Standard Evaluation of the EURO-CORDEX RCM Ensemble. Geosci. Model. Dev. 7, 1297–1333. doi:10.5194/gmd-7-1297-2014
Measures, R. M. (1984). Laser Remote Sensing Fundamentals and Applications. Wiley-Interscience, 510.
Melfi, S. H., and Whiteman, D. (1985). Observation of Lower-Atmospheric Moisture Structure and its Evolution Using a Raman Lidar. Bull. Amer. Meteorol. Soc. 66, 1288–1292. doi:10.1175/1520-0477(1985)066<1288:oolams>2.0.co;2
NAS, National Academies of Sciences, Engineering, and Medicine (2018). Thriving on Our Changing Planet: A Decadal Strategy for Earth Observation from Space. Washington, DC: The National Academies Press. doi:10.17226/24938
Raman, C. V. (1928). A Change of Wave-Length in Light Scattering. Nature 121 (3051), 619. doi:10.1038/121619b0
Raman, C. V., and Krishnan, K. S. (1928). The Optical Analogue of the Compton Effect. Nature 121 (3053), 711. doi:10.1038/121711a0
Rienecker, M., Suarez, M., Todling, R., Bacmeister, J., Takacs, L., Liu, H.-C., et al. (2008). The GEOS-5 Data Assimilation System–Documentation of Version 5.0.1, 5.1.0, and 5.2.0. NASA Tech. Rep. Ser. Glob. Model. Data Assimilation 27, 1–118.
Sherlock, V., Hauchecorne, A., and Lenoble, J. (1999). Methodology for the Independent Calibration of Raman Backscatter Water-Vapor Lidar Systems. Appl. Opt. 38, 5816–5837. doi:10.1364/ao.38.005816
Spurr, R. J. D. (2006). VLIDORT: A Linearized Pseudo-Spherical Vector Discrete Ordinate Radiative Transfer Code for Forward Model and Retrieval Studies in Multilayer Multiple Scattering media. J. Quantitative Spectrosc. Radiative Transfer 102 (2), 316–342. doi:10.1016/j.jqsrt.2006.05.005
Veselovskii, I., Whiteman, D. N., Kolgotin, A., Andrews, E., and Korenskii, M. (2009). Retrieval of Aerosol Physical Properties under Varying Relative Humidity Conditions. J. Atmos. Ocean. Tech. 1543–1557. doi:10.1175/2009JTECHA1254.1
Warrach-Sagi, K., Schwitalla, T., Wulfmeyer, V., and Bauer, H.-S. (2013). Evaluation of a Climate Simulation in Europe Based on the WRF-NOAH Model System: Precipitation in Germany. Clim. Dyn. 41, 755–774. doi:10.1007/s00382-013-1727-7
Weitkamp, C. (2005). “Lidar, Range-Resolved Optical Remote Sensing of the Atmosphere,” in Lidar, Range-Resolved Optical Remote Sensing of the Atmosphere. Editor C Weitkamp (Berlin: Springer), 102. doi:10.1007/b106786
Whiteman, D. N. (2003b). Examination of the Traditional Raman Lidar Technique. II. Evaluating the Ratios for Water Vapor and Aerosols. Appl. Opt. 42 (No. 15), 2593–2608. doi:10.1364/ao.42.002593
Whiteman, D. N., Schwemmer, G., Berkoff, T., Plotkin, H., Ramos-Izquierdo, L., and Pappalardo, G. (2001). Performance Modeling of an Airborne Raman Water-Vapor Lidar. Appl. Opt. 40 (3), 375–390. doi:10.1364/ao.40.000375
Whiteman, D. N. (2003a). Examination of the Traditional Raman Lidar Technique I Evaluating the Temperature-Dependent Lidar Equations. Appl. Opt. 42, 2571–2592. doi:10.1364/ao.42.002571
Whiteman, D. N., Melfi, S. H., and Ferrare, R. A. (1992). Raman Lidar System for the Measurement of Water Vapor and Aerosols in the Earth's Atmosphere. Appl. Opt. 31, 3068–3082. doi:10.1364/ao.31.003068
Whiteman, D. N., Pérez-Ramírez, D., Veselovskii, I., Colarco, P., and Buchard, V. (2018). Retrievals of Aerosol Microphysics from Simulations of Spaceborne Multiwavelength Lidar Measurements. J. Quantitative Spectrosc. Radiative Transfer 205, 27–39. Available at: http://www.sciencedirect.com/science/article/pii/S0022407317306398. doi:10.1016/j.jqsrt.2017.09.009
Whiteman, D. N., Rush, K., Rabenhorst, S., Welch, W., Cadirola, M., McIntire, G., et al. (2010). Airborne and Ground-Based Measurements Using a High-Performance Raman Lidar. J. Atmos. Oceanic Technol. 27, 1781–1801. doi:10.1175/2010JTECHA1391.1
WMO Oscar (2021). OSCAR - Observing Systems Capability Analysis and Review Tool. Available at: https://community.wmo.int/oscar (Accessed 4 11, 2021).
Wulfmeyer, V., Hardesty, R. M., Turner, D. D., Behrendt, A., Cadeddu, M. P., Di Girolamo, P., et al. (2015). A Review of the Remote Sensing of Lower Tropospheric Thermodynamic Profiles and its Indispensable Role for the Understanding and the Simulation of Water and Energy Cycles. Rev. Geophys. 53, 819–895. doi:10.1002/2014rg000476
Keywords: lidar, spaceborne, thermodynamic profiles, Raman, weather prediction
Citation: Whiteman DN, Di Girolamo P, Behrendt A, Wulfmeyer V and Franco N (2022) Statistical Analysis of Simulated Spaceborne Thermodynamics Lidar Measurements in the Planetary Boundary Layer. Front. Remote Sens. 3:810032. doi: 10.3389/frsen.2022.810032
Received: 05 November 2021; Accepted: 14 February 2022;
Published: 14 March 2022.
Edited by:
Daniel Perez Ramirez, University of Granada, SpainReviewed by:
Amin Nehrir, National Aeronautics and Space Administration, United StatesIgor Veselovskii, Prokhorov General Physics Institute (RAS), Russia
Copyright © 2022 Whiteman, Di Girolamo, Behrendt, Wulfmeyer and Franco. This is an open-access article distributed under the terms of the Creative Commons Attribution License (CC BY). The use, distribution or reproduction in other forums is permitted, provided the original author(s) and the copyright owner(s) are credited and that the original publication in this journal is cited, in accordance with accepted academic practice. No use, distribution or reproduction is permitted which does not comply with these terms.
*Correspondence: David N. Whiteman, dnwhiteman@gmail.com
 David N. Whiteman
 Paolo Di Girolamo
 Andreas Behrendt3
  Noemi Franco