Autonomous Shipborne In Situ Reflectance Data in Optically Complex Coastal Waters: A Case Study of the Salish Sea, Canada
- Department of Geography, University of Victoria, Victoria, BC, Canada
Present limitations on using satellite imagery to derive accurate chlorophyll concentrations and phytoplankton functional types arise from insufficient in situ measurements to validate the satellite reflectance, Rrs0+. We installed a set of hyperspectral radiometers with autonomous solar tracking capability, collectively named SAS Solar Tracker (Satlantic Inc./Sea-Bird), on top of a commercial ferry, to measure the in situ reflectance as the ferry crosses the Salish Sea, Canada. We describe the SAS Solar Tracker installation procedure, which enables a clear view of the sea surface and minimizes the interference caused by the ship superstructure. Corrections for residual ship superstructure perturbations and non-nadir-viewing geometry are applied during data processing to ensure optimal data quality. It is found that the ship superstructure perturbation correction decreased the overall Rrs0+ by 0.00055 sr−1, based on a black-pixel assumption for the infrared band of the lowest acquired turbid water. The BRDF correction using the inherent optical properties approach lowered the spectral signal by ∼5–10%, depending on the wavelength. Data quality was evaluated according to a quality assurance method considering spectral shape similarity, and ∼92% of the acquired reflectance data matched well against the global database, indicating high quality.
1 Introduction
Ocean color satellite sensors are a practical approach for large-scale synoptic monitoring of aquatic environments by providing bio-optical variables such as chlorophyll concentration (a direct proxy for phytoplankton biomass) and inherent optical properties (Sathyendranath et al., 2017; Werdell et al., 2018; Groom et al., 2019). However, proper vicarious calibration (space sensor calibration) and atmospheric correction of top-of-atmosphere measured radiance (LTOA) are required to retrieve accurate water-leaving radiance (Lw) and, consequently, remote sensing reflectance (Rrs0+) and biogeochemical products (Zibordi et al., 2015a; 2015b). For space sensor calibration, Fiducial Reference Measurements (FRMs), which come with uncertainty budgets including those for sensors calibration and high-quality protocols for data acquisition, are ultimately required (Ruddick et al., 2019). Long-term international programs providing FRMs are, for example, the Marine Optical Buoy (MOBY), the Buoy for the Acquisition of a Long-Term Optical Time Series (Bouée pour L’acquisition de Séries Optiques à Long Terme, BOUSSOLE), the NASA bio-Optical Algorithm Data set (NOMAD), the Ocean Reflectance Models (ORM), and the Ocean Color component of the Aerosol Robotic Network (AERONET-OC). Generally, these programs have provided a range of 46–241 high-quality matchups over 3–7 years for vicarious calibration of various ocean color satellites (Zibordi et al., 2015b). For addressing the atmospheric signal from LTOA, high-quality in situ radiometric data are also required for the development and validation of optimal atmospheric correction models (Ruddick et al., 2006; Ahmad et al., 2010; Müller et al., 2015; Carswell et al., 2017; Zibordi et al., 2018; Giannini et al., 2021). Atmospherically-corrected Lw and Rrs0+ are generally validated in comparison with in situ matchups acquired with radiometers installed on moored buoys (e.g., Antoine et al., 2008), stationary platforms (e.g., Zibordi et al., 2006, 2009; Vansteenwegen et al., 2019; Tilstone et al., 2020; Vanhellemont and Ruddick 2021), and mobile platforms such as research vessels and ship of opportunities (e.g., Simis and Olsson, 2013; Brando et al., 2016; Carswell et al., 2017; Ottaviani et al., 2018; Tilstone et al., 2020; Giannini et al., 2021). Among mobile platforms, deploying sensors aboard research vessels is the most common approach and requires different levels of human interaction to provide optimal geometry for data acquisition. For instance, Ruddick et al. (2006), Carswell et al. (2017), Phillips and Costa (2017), and Tilstone et al. (2020) adjusted the geometry as required according to the Sun and vessel position. Hooker et al. (2012), Simis and Olsson (2013), Brando et al. (2016), and Ottaviani et al. (2018) deployed instead radiometers with the autonomous capability of defining optimal geometry based on real-time Sun position and ship orientation.
Within the scope of autonomous measurements from stationary and mobile platforms, predefined optimal geometry of acquisition, flagging of non-optimal environmental conditions, data correction for the effects of Sun glint and skylight contributions, and structure interferences are the most important to obtain high-quality Rrs0+ measurements (Hooker and Morel, 2003; Zibordi et al., 2006; Zibordi et al., 2009; Simis and Olsson, 2013; Zibordi et al., 2015a; Ottaviani et al., 2018). First, maintaining optimal viewing geometry is a considerable challenge in shipborne reflectance measurement as the ship and the Sun are constantly moving. The general ideal geometry of acquisition, as recommended in the literature, is as follows: a viewing zenith angle (θv) of the upwelling radiance sensor (Lt) of 40o and a viewing azimuth angle (φv) between the sensors and the Sun of 90 o < φv < 135 o (ideally 135 o) to minimize Sun glint (Mobley, 1999; Simis and Olsson, 2013). At the same time, the sensors should be deployed to avoid the effect of ship shadow, sea spray, and minimize ship superstructure perturbation (Mobley, 1999; Hooker and Morel, 2003; Ottaviani et al., 2018). Second, the instantaneous cloud cover conditions affect the spectral (ir)radiance distributions from the Sun and sky, thus resulting in variation in measurements of sky radiance and in the sky glint contribution to the upwelling radiance (Mobley, 1999; Ruddick et al., 2006). Therefore, clear sky conditions are ideal for high-quality measurements. As such, meteorological flags need to be applied. Finally, the presence of a fixed platform or the research vessel itself modifies the radiance field, since the platform shadow or multiple reflections between the superstructure and the water can fall into the sensor’s field of view (Hooker and Morel, 2003).
Here, we provide a framework for the acquisition, processing, and quality control of above-water remote sensing reflectance acquired with the SAS Solar Tracker (Satlantic Inc./Sea-Bird, denoted as SAS-ST). This autonomous sensor is installed aboard a ship of opportunity, the Queen of Oak Bay (QoOB) ferry, which crosses multiple times each day the Salish Sea off the west coast of Canada. The data processing included screening via meteorological flags, reflected sky radiance correction, superstructure signal correction, and BRDF corrections, followed by quality control of Rrs0+ based on method by Wei et al. (2016). The defined framework was based on published protocols (Mobley, 1999; Hooker and Morel, 2003; Simis and Olsson, 2013), and adapted for acquiring high-quality Rrs0+ measurements according to the local conditions. The purpose of these measurements is to provide matchups for validation of satellite-derived atmospheric corrected Rrs0+, and the development of regional hyperspectral-based bio-optical models for deriving biogeochemical products (e.g., phytoplankton functional types). Off the west coast of Canada, the number of available matchups is restricted due to the limited research vessel trips, required labor on the ships of opportunity to manually adjust the radiometer’s geometry (Komick et al., 2009; Carswell et al., 2017) and the frequent cloud coverage (Hilborn and Costa, 2018). Therefore, the successful operation of the autonomous SAS-ST is very desirable in this area. The methodology presented here is adaptable to other regions of the world lacking in situ reflectance data, and provides a step forward to complement a network of fixed platforms above-water sensors such as AERONET-OC (Zibordi et al., 2009) and WATERHYPERNET (Vanhellemont and Ruddick, 2021).
2 Materials and Methods
2.1 Study Area
The Salish Sea is an estuarine system in the southwest of Canada, extending about 200 km in length by 30 km in width with an average depth of 150 m (Figure 1A). It is composed of the Strait of Georgia (SoG), the Puget Sound, and the Juan de Fuca Strait, and it is connected to the Pacific Ocean via the Juan de Fuca Strait in the South and the Johnstone Strait in the North. Since the northern passage is very constricted, most of the water exchange between the Salish Sea and the Pacific waters flows through the southern passage (Masson, 2002; Pawlowicz et al., 2019). A vital feature of the SoG is the significant freshwater inputs from the Fraser River (Johannessen et al., 2003; Yunker and Macdonald, 2003), which drive southward estuarine circulation, and the corresponding river plume extends into and occasionally entirely across the central and southern SoG (Li et al., 2000; Halverson and Pawlowicz, 2008, 2011; Pawlowicz et al., 2017, 2019). The river plume has a high concentration of total suspended matter (TSM) and colored dissolved organic matter (CDOM) due to its terrestrial origin, which produces optically complex waters with the highest light attenuation, particularly in the spring and summer times (Loos and Costa, 2010). The discharge of the Fraser River typically peaks with a freshet in mid-June following snowpack melt (Masson, 2002; Masson, 2006).
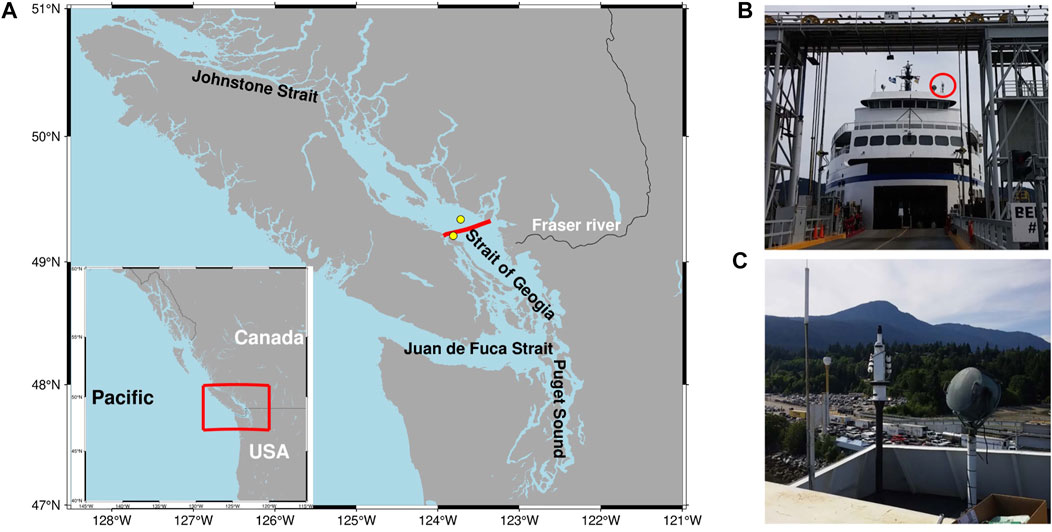
FIGURE 1. (A) The Salish Sea study area. The red line indicates the track of QoOB. Two yellow dots are Entrance Island (49.21 N, 123.81 W) and Halibut Bank (49.34 N, 123.72 W) for local wind measurement. (B) The SAS-ST is installed on the deck of QoOB (red circle) at a total height of 19 m above the water surface. (C) The SAS-ST is mounted on top of a custom-fabricated pedestal, and the base of the pedestal is bolted to a welded stand.
Biologically, the Salish Sea typically has maximum diatom-dominated spring blooms followed by weaker fall bloom events (Allen and Wolfe, 2013). The timing of the spring phytoplankton bloom varies interannually and is mediated by light availability due to cloud cover, wind dynamics, and timing of spring freshwater outflow (Collins et al., 2009; Masson and Peña, 2009; Allen and Wolfe, 2013; Phillips and Costa, 2017; Suchy et al., 2019). The second most abundant phytoplankton group in this region is dinoflagellates, peaking in the summer and early fall (Pospelova et al., 2010). Calcifying phytoplankton, such as coccolithophore (Emiliania huxleyi), uncommon within the SoG (Haigh et al., 2015), were observed to flourish in July and August of 2016 when SAS-ST acquired data for the research presented here. With the high particulate discharge from the Fraser River, the Salish Sea is thus an optically dynamic coastal system (Loos and Costa, 2010).
2.2 Dataset
Here, we describe the installation of the SAS-ST on QoOB and data acquisition and processing. Biogeochemical data from BC FerryBox, which automatically measures a series of environmental oceanographic parameters, aided in the ferry’s perturbation correction approach and the characterization of the water spectral types.
2.2.1 SAS Solar Tracker Installation and Acquisition Geometry
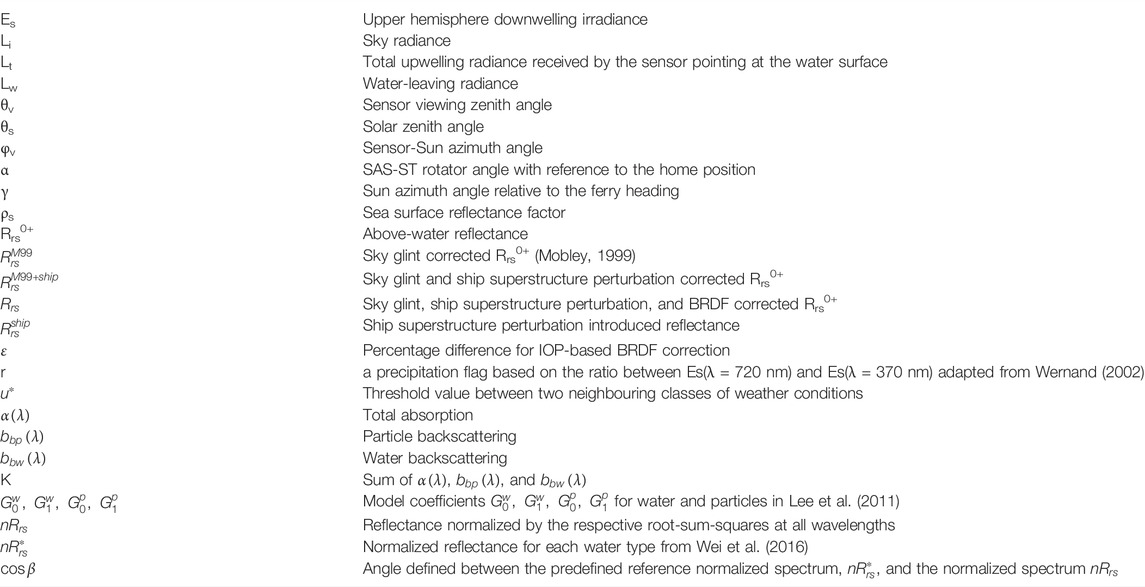
The SAS-ST was installed on a commercial ferry, BC Ferries QoOB, about 139 m long and 27 m wide. The ferry sails at approximately 20 knots (10.3 m/s) from Departure Bay, Nanaimo, to Horseshoe Bay, West Vancouver, BC, totaling a distance of about 55 km (Figure 1A). The SAS-ST is mounted 19 m above the water surface on top of a custom-fabricated pedestal designed by Ocean Networks Canada (ONC), and the base of the pedestal is bolted to a welded stand (Figures 1B,C). The SAS-ST is equipped with a drive unit as a base and thus has the advantage of solar tracking capability, which permits autonomous operation to maintain optimal viewing geometry (Satlantic, 2016). The SAS-ST consists of two hyperspectral radiometers to measure sea surface total upwelling radiance, Lt(λ) and sky radiance, Li(λ), with a 3° half-angle field of view (FOV) and a third sensor to measure the upper hemisphere downwelling irradiance, Es(λ) (Figure 2A). For an overview of symbols used in this paper see Table 1. These sensors perform automated measurements up to a frequency of 3Hz and automatically adjust their integration time to the instantaneously measured light intensity (Satlantic, 2016; Tilstone et al., 2020). In addition to the three radiometers and the drive unit, a GPS receiver and a junction box (including power and communication components) are mounted onto the SAS-ST system. The true ship heading data are acquired by a Hemisphere Vector GPS sensor installed by ONC beside SAS-ST, and process signals from two GPS antennas to determine the true ship heading. These data are fed into the SAS-ST’s acquisition module housed in the junction box. The auxiliary GPS was required because the metal structure of the ferry causes the internal SAS-ST GPS’s heading measurement to lack the necessary accuracy. The SAS-ST serial data stream and auxiliary GPS heading measurement are sent to a serial-to-Ethernet converter, served on the ONC local area network (LAN) on a transmission control protocol (TCP) port. Mounted in the ONC telemetry box is a small computer that runs a driver developed on a Linux operating system. It has Ethernet connectivity and collects SAS-ST data from the LAN, stores the data, and sends them to ONC’s server onshore. This setup allows data to be downloaded in near real-time directly from ONC’s Oceans 2.0 portal (https://data.oceannetworks.ca/DataSearch).
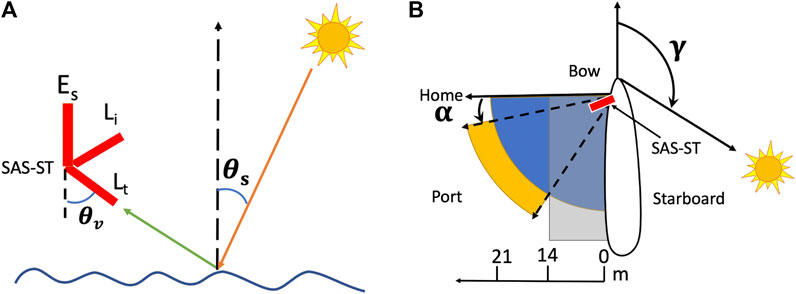
FIGURE 2. (A) SAS-ST geometry of acquisition. Red bars are the three radiometers with θv = 50°. The solar zenith angle θs is about 30° at the time of data acquisition in spring and summer. (B) Position of SAS-ST regarding the ferry and Sun. The red bar indicates the SAS-ST, blue indicates water, the orange stripe indicates the Lt footprint, and the gray area indicates ship shadow as far as 14 m from the ship wall. γ is 90°–140°, and α is -15° to -50° in this research. Note that the ferry is not at scale.
To avoid the effects of Sun glint and reduce ship shadow and ship superstructure influence, the Lt(λ) and Li(λ) sensors were positioned at a fixed viewing zenith angle, θv = 50o, and programmed to maintain a sensor-Sun azimuth φv = 120 ± 5°, following Hooker and Morel (2003) (Figure 2A). The value of θv was adapted from the optimal guidelines to keep the FOV of the Lt sensor further away from the ferry and avoid ship shadow, while φv was chosen around 120°, roughly the median of 90°–135°, to allow the drive unit to operate within a range of angles. These parameters are programmed as part of the “deployment setup” (see Supplementary Appendix A, Section 1) before the system starts acquiring data and can be changed as needed. To attain the optimal geometric conditions, the ferry run from 12:50 to 14:30 local time was designated for data acquisition during spring and summer.
The preset φv is maintained using the autonomous stepper motor platform that triggers the required positioning according to the ship heading and the Sun azimuth. The geometric setup was planned for the ferry run that approximately coincides with the time of imagery acquisition by several operational ocean color satellites. First, for the optimal time of data acquisition (12:50 to 14:30 LT), the Sun azimuth angle relative to the ferry heading, indicated as γ in Figure 2B, changed within the 90°–140° range, with the Sun always at starboard. This is important because the port side, where the SAS-ST was installed, was not directly illuminated by the Sun, so that the ship reflections in the region where the
2.2.2 SAS Solar Tracker Data Processing
This section explains the data calibration and the meteorological flags used to preprocess the raw SAS-ST data. After the calibration and the application of the screening flags, data were subjected to sky and Sun glint, ship perturbation, and BRDF corrections.
2.2.2.1 Calibration and Flags
An application with batch-mode capability, PySciDON (Python Scientific Framework for Development of Ocean Network application; Vandenberg et al., 2017), was developed by our research group to apply the calibration files to the raw data stream for each sensor. The software accounts for the rotator angle and Sun azimuth angle flag, time and wavelength interpolation, longitude or time binning, meteorological flags, Mobley’s wind-based ρs factor correction (Mobley, 1999), and the correction for the ship superstructure perturbation. This application also provides band simulations for Sentinel-3 and MODIS-Aqua (not used in this paper) and general statistical tools, including mean, median, and standard deviation for the specified binning mode. Sensors were freshly calibrated before deployment (and optics were cleaned bi-weekly during deployment), and the calibration files from Satlantic Inc. provide descriptions of the format of the raw data files. More details can be found in Vandenberg et al. (2017) and Satlantic Inc.’s Instrument File Standard document (Satlantic, 2011).
2.2.2.2 Meteorological Flags
The definition of meteorological flags followed the recommendations by Wernand (2002) to address unfavorable measurement circumstances such as low light, dusk and dawn, and precipitation. The author defined a precipitation flag based on the ratio (denoted as r) between Es (λ = 940 nm) and Es (λ = 370 nm) to infer the influence of Mie scattering by raindrops at 370 nm and absorption by H2O at 940 nm (Eismann, 2012). This part of the spectra is beyond the SAS-ST’s spectral range (350–798 nm); therefore, the precipitation flag uses 720 nm, which is also an absorption band of water vapor (Eismann, 2012), as also suggested by Wernand (2002). The low-light and dawn/dusk flags were also adjusted to the wavelength range of the SAS-ST. The meteorological flags were therefore specified as follows:
Flag 1, Es (λ = 480 nm) > 2
Flag 2, Es (λ = 470 nm)/Es (λ = 680 nm) > 1: masking spectra acquired at dawn/dusk.
Flag 3, r = Es (λ = 720 nm)/Es (λ = 370 nm): value defined according to predefined threshold masking spectra affected by rainfall and high humidity.
The definition of Flag 3 took into consideration approximately 35,000 in situ Es spectra acquired with the SAS-ST system at different meteorological conditions between 12:50 and 14:30 LT from 18 June to 13 July 2016. All the measured in situ spectra were averaged every 1 min, resulting in about 1,400 averaged spectra. Humidity data at 1 min intervals were acquired with an RM Young Temperature RH probe installed on the ferry. Additionally, a camera was installed horizontally on top of the SAS-ST supporting frame, to acquire sky photos with a similar viewing geometry to the Es sensor. Weather conditions were determined based on the visual evaluation of 1,400 sky photos, which were organized into four classes: rainy, overcast, variable clouds (corresponding to 100%, 75%, and 50% cloudy conditions), and clear sky (corresponding to ≤25% cloudy and clear sky conditions).
To address Flag 3, Es and humidity data measured simultaneously were associated with the four weather classes. With this dataset, a discriminant analysis (Gao, 2005) was applied to r (N = 1,400) to determine the threshold value between two neighboring classes of weather conditions (denoted as
where
2.2.2.3 Deriving Rrs0+
Different approaches are available to derive Rrs0+, each with a certain level of complexity. For instance, Ruddick et al. (2006) suggested considering the spectral shape of the Rrs0+ for moderately to highly turbid waters. Simis and Olsson (2013) developed the “fingerprint method” to minimize the atmospheric gas absorption features in the reflectance spectrum by optimizing the sky radiance contribution to the water radiance signal. Gege (2014) and Groetsch et al. (2017) put forward a three-component reflectance model, which considers a spectrally resolved offset to correct for residual Sun and sky glint. This method generally performs best with local IOPs measurements, which cannot always be applied to the water conditions of our study area. Here, the remote sensing reflectance (denoted as
where the numerator represents the water-leaving radiance,
2.2.2.4 Ship Superstructure Perturbation Correction
The ship superstructure influences the above-water radiometry by introducing a signal to the radiance field measured by the sea viewing sensor. Here, we considered that the ship wall was always under non-sunlit conditions, which minimizes any superstructure reflection onto the water. Furthermore, any data acquired at rotator angles lower than −50° (less than 14 m from the ship wall) are removed from further analysis due to possible measurements of shadowed waters. Hooker and Morel (2003) assumed that the reflection of a white ship’s superstructure onto the water (denoted
At any wavelength, the reflectance corrected for the sky and ship perturbation contributions, denoted
Substituting for
where
2.2.2.5 BRDF Correction
To minimize the non-isotropic distribution of the water-leaving radiances in optically complex waters, a BRDF correction was applied following the inherent optical properties approach proposed by Lee et al. (2011). We developed a Python version of the code, adapted from the IDL version developed by Talone et al. (2018). The approach considers a two-step process: first, the quasi-analytical algorithm (QAA) method (Lee et al., 2002; Lee et al., 2011) is applied to
where k is the summation of
2.2.2.6 Water Type Clustering and Data Quality Evaluation
Optical water type clustering methods can generally be grouped into two categories. The first category focuses on the spectral magnitude of Rrs, such as in Le et al. (2011), Moore et al. (2009, 2014), and Jackson et al. (2017). The second category considers the spectral shape of Rrs for optical water type clustering. For example, Wei et al. (2016) (hereafter referred to as W16) compared the target spectral shape to a database composed of various global waters, divided into 23 water types including clear blue oceanic waters (type 1) and yellowish sediment-laden waters (higher types). W16 has been proven effective in categorizing various water types and can also be used to evaluate the quality of independent above-water spectra (Barnes et al., 2019; Cui et al., 2020), and it is therefore also used in this research. As it focuses on the spectral shape of Rrs rather than its magnitude, this shape-based classification method minimizes the effect of Rrs magnitude on water type clustering. The subsequent quality assurance also follows the method developed by W16:
Step 1. After applying the corrections for sky glint, ship perturbation and BRDF effects on Rrs0+, the final reflectance is denoted
Step 2. Each OLCI
where i = 1, … ,7 indicates each specific band. Each spectrum was assigned to one of W16’s water types by calculating the “spectral angle,” cos β, between the predefined reference spectrum,
Step 3. A quality score is computed as the ratio of the number of wavelengths in
2.2.3 FerryBox Ancillary Data
Ancillary data were collected with a FerryBox system measuring salinity (PSU) with a SeaBird SBE45 thermosalinograph, Chl-a concentration (ug l−1) with a WET Labs ECO Triplet fluorometer, and CDOM fluorescence (ppb) and turbidity (NTU) with a WET Labs ECO Triplet BBFL2 scattering fluorescence sensor. Data processing details, including biofouling correction of the sensors and quenching correction for Chl-a measurements, are reported in Travers-Smith et al. (2021).
3 Results
3.1 Meteorological Flags
Flags 1 and 2 are defined in Section 2.2.2.2. The mean (

TABLE 2. Mean, standard deviation, and the r = Es (λ = 720 nm)/Es (λ = 370 nm) range between the four weather condition groups.
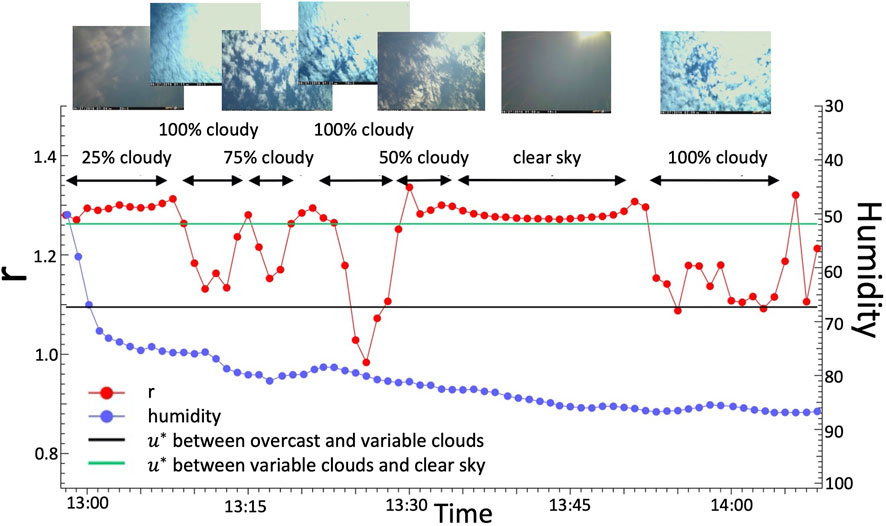
FIGURE 3. Plot of humidity and r = Es (λ = 720 nm)/Es (λ = 370 nm) for 27 June 2016 which experienced different cloudy conditions. The sky images above correspond to sky conditions at a specific time. The duration of the specific sky condition is indicated by the black arrow lines.
3.2 Rrs0+ Calculation
SAS-ST data collected in the longitude range (123.936°W, 123.348°W) were divided into 49 bins (0.012° longitude step), each corresponding to ∼900 m on the ground, which approximates a 3 Sentinel-3A OLCI pixel window as used in Giannini et al. (2021). For the sky glint correction (
Sites 8 to 32 on 6 July 2016 provided data over the waters with the lowest turbidity (turbidity <2.0 NTU, i.e., <0.5 mg/L), and the

FIGURE 4. (A) Violin plot of L3a resolution
The IOPs-based BRDF correction was applied to generate the final reflectance,
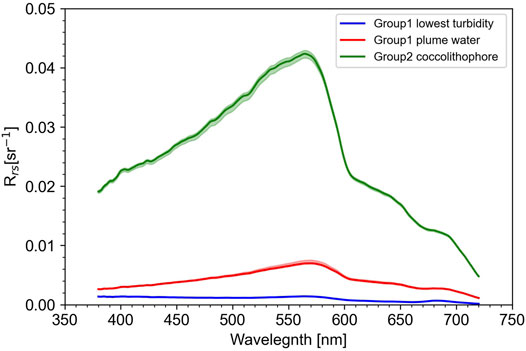
FIGURE 5. Representative

FIGURE 6. Joyplot for Groups 1 (non-coccolithophore bloom conditions) and 2 (coccolithophore bloom conditions) of BRDF correction percentage difference
Noticeably,
3.3 Quality Check and Optical Water Type Clustering
For Group 1 (N = 513), 92% of the
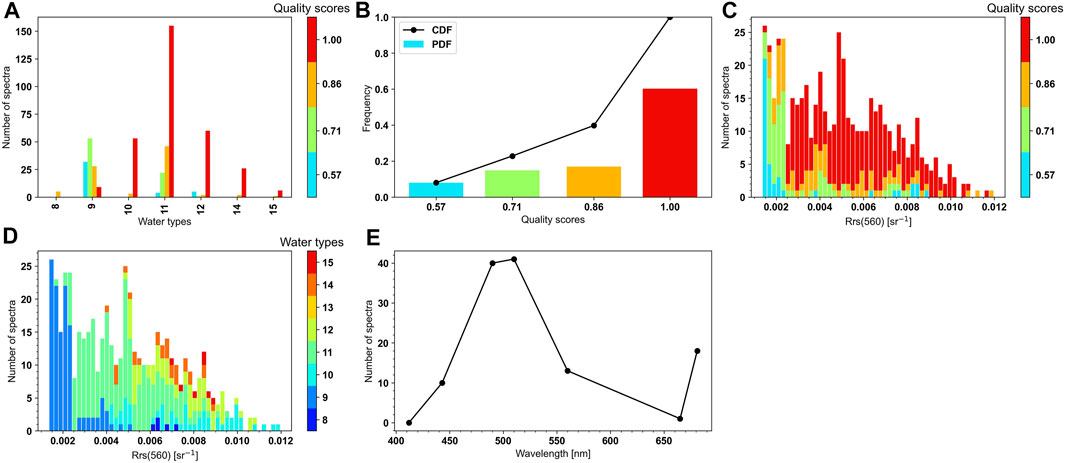
FIGURE 7. Quality assurance results for Group 1. (A) Bar plot of the number of points at each water type and each quality score. (B) Frequency plot of each quality score. PDF represents the probability density function, and CDF represents the cumulative distribution function. (C) Histogram of
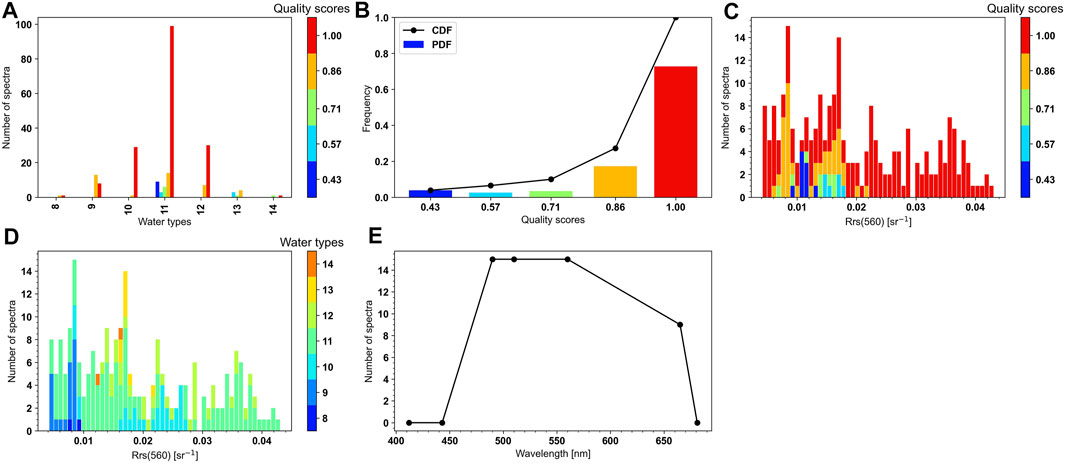
FIGURE 8. Quality assurance results for Group 2. (A) Bar plot of the number of points at each water type and each quality score. (B) Frequency plot of each quality score. (C) Histogram of
For each group and water type, the Rrs varied in magnitude but presented a similar shape (Figures 9, 10). The
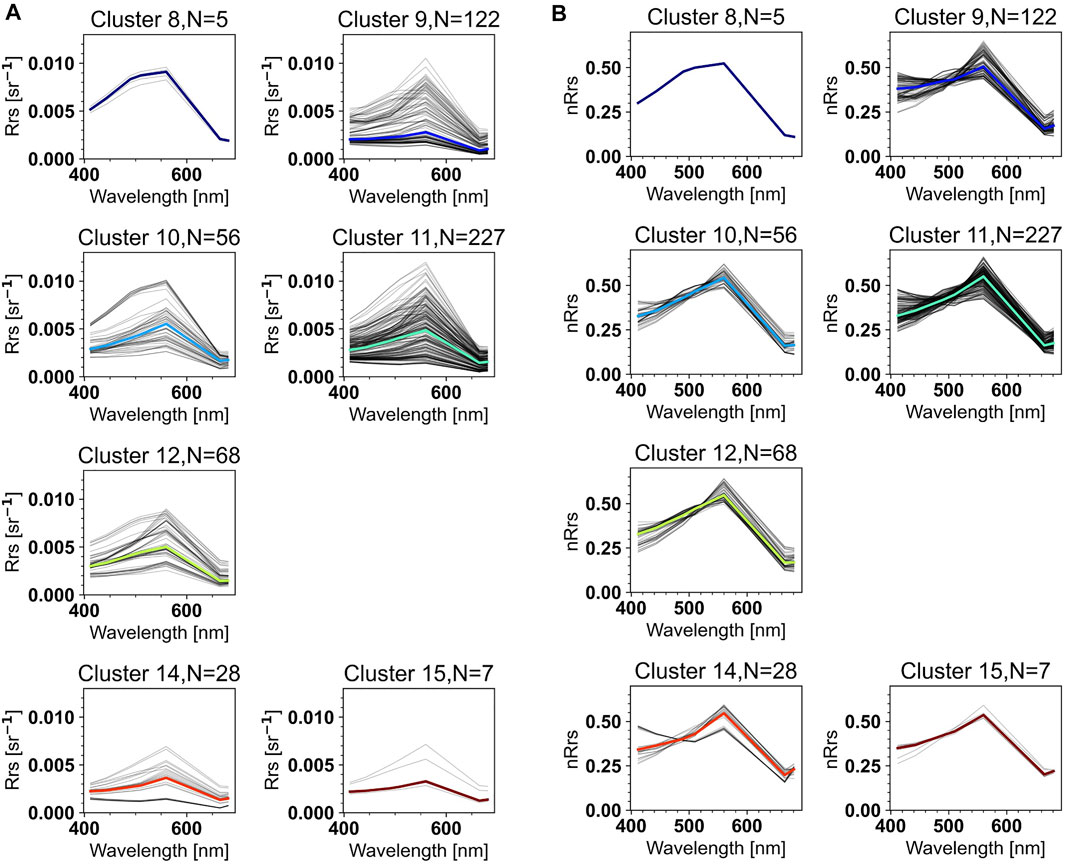
FIGURE 9. Plots of SAS-ST reflectance
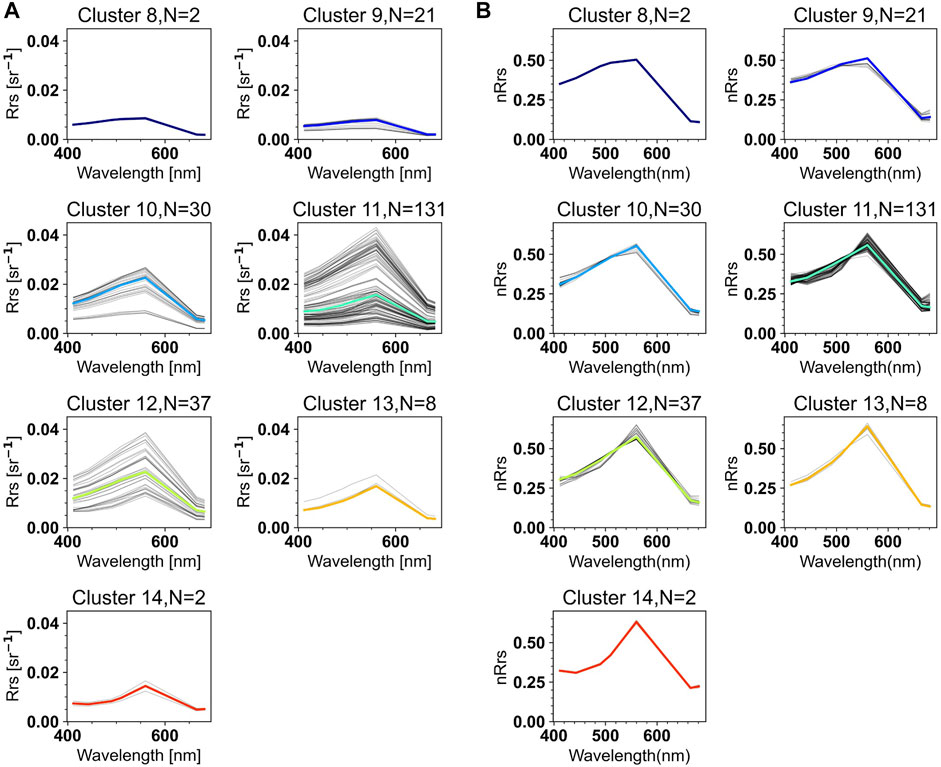
FIGURE 10. Plots of SAS-ST reflectance
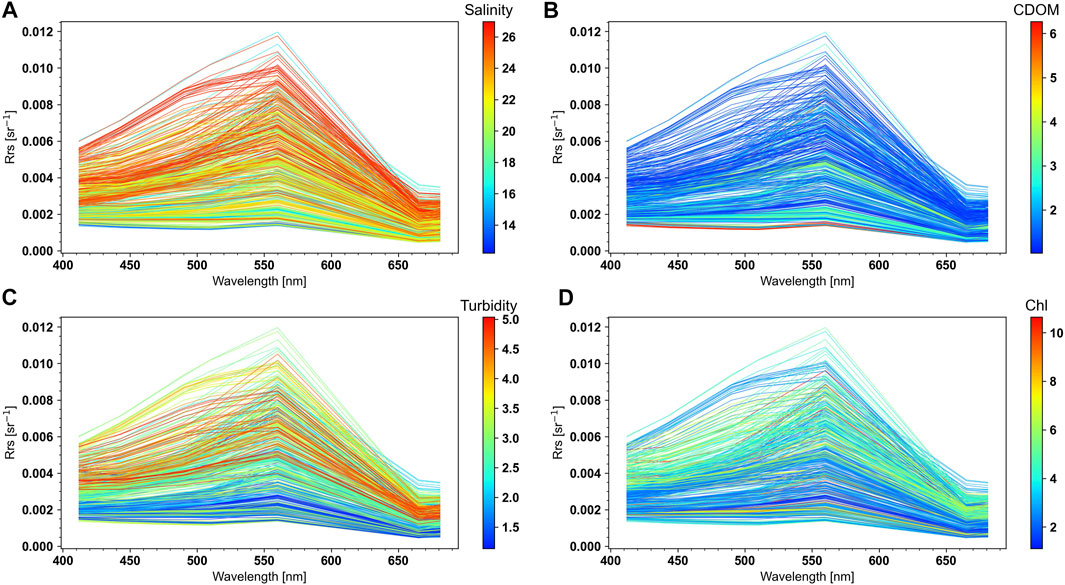
FIGURE 11. Reflectance
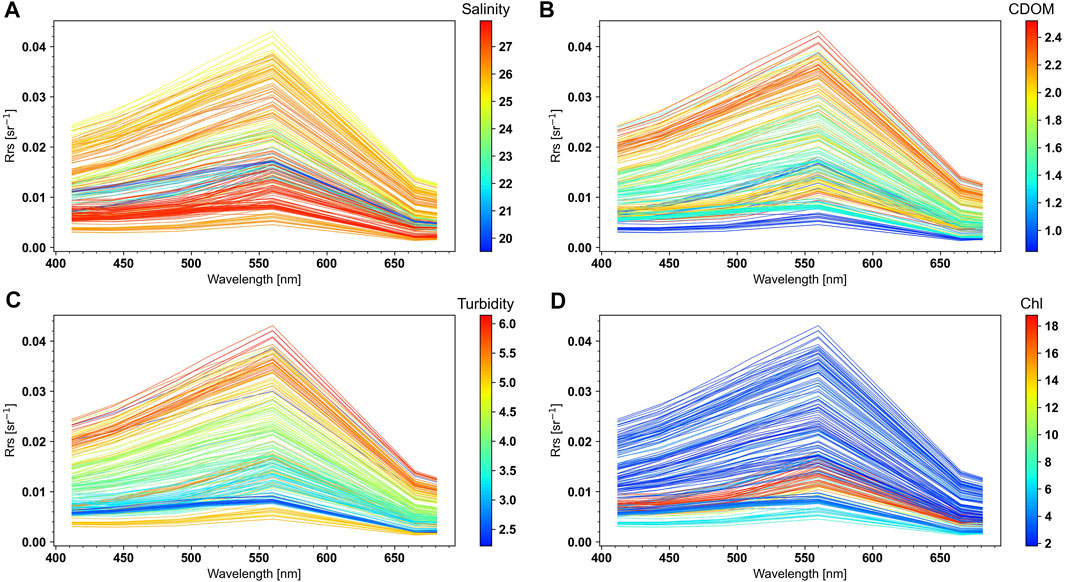
FIGURE 12. Reflectance
4 Discussion
Our results show that optimizing the geometry of data acquisition, filtering data acquired under unstable illumination conditions (e.g., dawn/dusk, cloudy, and rainy), and correcting for skylight radiance, ship superstructure, and BRDF effects, allowed for Rrs0+ data retrieval with high quality when compared with the W16 quality assurance dataset.
The first consideration for optimal data quality is the geometry of data acquisition (Mobley, 1999; Hooker and Morel, 2003; Zibordi et al., 2006; Simis and Olsson, 2013; Garaba et al., 2015; Brando et al., 2016; Vansteenwegen et al., 2019; Tilstone et al., 2020). Here, with optimal configuration, the spectral measurements were acquired on the non-sunlit side of the ferry to minimize the reflected ferry signal on the above-water radiance measurements (Hooker and Morel, 2003), and at an adapted sensor viewing zenith angle to avoid ship superstructure shadows and an optimal sensor-Sun azimuth angle to minimize the skylight radiance signal on the above-water radiance measurements (Mobley, 1999). Various skylight radiance correction approaches are available (e.g., Mobley, 1999; Ruddick et al., 2006; Lee et al., 2010; Groetsch et al., 2017) requiring different complexity of input data to successfully correct for skylight radiance. For instance, the method suggested by Gege (2014) and Groetsch et al. (2017) applies a three-component model, in which using optimized local IOPs, to correct for the residual Sun and sky glint signal on the above-water measurement. We tested (analysis not shown here) this approach with a small set of IOPs measurements collected concomitant to some of the SAS-ST data, and the results were similar to those obtained with the method by Mobley (1999). Although Mobley’s method is commonly used, the ρs factor is not wavelength-dependent, resulting in higher uncertainties for longer wavelengths (Lee et al., 2010). Still, for similar geometry and environmental conditions (wind speed <13.0 m/s and clear skies), Garaba and Zielinski (2013) showed that Mobley’s method performed similarly to three other approaches, with the advantage of ensuring non-negative Rrs0+ retrievals in the near-infrared. Also, uncertainties in the wind speed impact the ρs factor, especially in the blue bands (Mobley, 1999).
The ship-specific superstructure correction factor
A correct evaluation of the dependence of the measured signal on the viewing geometry and the bidirectional effects (Morel and Gentili, 1996; Morel et al., 2002; Zibordi et al., 2009; Lee et al., 2011) is important for validating satellite-based retrieved reflectance or water radiance (Zibordi et al., 2009; Talone et al., 2018) and comparing above-water radiometric data acquired under different geometric conditions (Wei et al., 2016). Here, a BRDF correction was required because the data quality was evaluated against the W16 global Rrs0+ database, composed of reflectance measurements acquired with a nadir viewing geometry. The BRDF correction was found to decrease Rrs0+ in this research by ∼5–10%, as also found by Talone et al. (2018).
The final evaluation of Rrs0+ is preferentially performed against in situ measurements of below-water Rrs and/or measurements collected with various instruments at the same location (e.g., Hooker et al., 2002; Lee et al., 2010; Zibordi, 2016; Tilstone et al., 2020). However, collecting below-water Rrs is not possible with our measurement setup. Instead, our
The evaluation of
Although our protocols for Rrs0+ measurements with the SAS-ST followed rigorous criteria for data acquisition and processing, there is still a level of data variability and uncertainty that it is difficult to account for (Ruddick et al., 2019; Vabson et al., 2019; Tilstone et al., 2020; Alikas et al., 2020). These uncertainties may also explain the 8% of acquired spectra with lower quality (QA <0.71). Recent evaluations of international field-based radiometers (Tilstone et al., 2020), including similar Satlantic HyperOCR radiometers as those used here, indicated that the inaccuracies in downwelling-irradiance measurements resulted in the largest
5 Conclusion
Validation of ocean color satellite Rrs retrievals requires a large number of high-quality Rrs0+ matchups (Müller et al., 2015; Werdell et al., 2018; Valente et al., 2019). However, the availability of such matchups is often limited due to the difficulty of acquiring high-quality data over large spatial and temporal domains (Tilstone et al., 2020). These constraints are reported for many study regions (e.g., Valente et al., 2019; Tilstone et al., 2020, Giannini et al., 2021), and it is specifically an issue along the west coast of Canada (Komick et al., 2009; Carswell et al., 2017; Hilborn and Costa, 2018; Giannini et al., 2021). Autonomous radiometers mounted on fixed towers, such as AERONET-OC (Zibordi et al., 2006, 2009) and the newest WATERHYPERNET hyperspectral network (Vansteenwegen et al., 2019; Vanhellemont and Ruddick, 2021), can also provide a large number of high-quality matchups. Another option is to utilize mobile platforms such as ships. We presented the protocols to deploy the SAS-ST instrument on a commercial ferry, together with the evaluation of the large volume of high-quality Rrs data acquired along the coastal waters of BC, Canada. The summary of our results and recommendations is as follows:
1. The application of meteorological flags in PySciDON successfully identified 98.5% of the spectra as acquired under clear sky conditions. The remaining 1.5% of Es spectra were manually inspected.
2. The ship-specific superstructure perturbation signal amounted to
3. The correction for the BRDF effects lowers Rrs0+ by ∼5–10%, allowing for proper comparison among Rrs0+ measurements from the literature and matchups used to validate satellite retrievals.
4. Quality evaluation showed overall high scores: ∼92% of Group 1 and 94% of Group 2 are associated with a score>=0.71, implying that the data can be used for validation of atmospheric corrected satellite-retrieved Rrs.
The methodology presented here is adaptable to other ships, to enable surveys of different water types and complement fixed platforms such as AERONET-OC (Zibordi et al., 2009) and WATERHYPERNET (Vanhellemont and Ruddick 2021). Further work will focus on providing the error budget based on estimates of the uncertainty contribution from the sensor’s calibration, data processing, and environmental variability, essential for FRMs (Zibordi et al., 2015b; Vabson et al., 2019; Tilstone et al., 2020; Alikas et al., 2020).
Data Availability Statement
The original contributions presented in the study are included in the article/Supplementary Materials, further inquiries can be directed to the corresponding author.
Author Contributions
The PhD candidate ZW was responsible for data collection and analysis and manuscript writing. MC was responsible for project conceptualization, results, discussions, and significant reviews in the manuscript.
Funding
ZW was supported by a Pacific Salmon Foundation/MITACS Fellowship. Fieldwork support through Ocean Networks Canada. MC was supported through funds from the NSERC NCE MEOPAR (Marine Environmental Observation, Prediction and Response Network), the Canadian Space Agency (FAST 18FAVICB09), the Canada Foundation for Innovation (CFI), and the NSERC Discovery Grant, Canada.
Conflict of Interest
The authors declare that the research was conducted in the absence of any commercial or financial relationships that could be construed as a potential conflict of interest.
Publisher’s Note
All claims expressed in this article are solely those of the authors and do not necessarily represent those of their affiliated organizations, or those of the publisher, the editors, and the reviewers. Any product that may be evaluated in this article, or claim that may be made by its manufacturer, is not guaranteed or endorsed by the publisher.
Acknowledgments
We are thankful to the BC Ferries crew for logistical support during the installation of sensors and Ocean Networks Canada for technical support with the installation and maintenance of sensors.
Supplementary Material
The Supplementary Material for this article can be found online at: https://www.frontiersin.org/articles/10.3389/frsen.2022.867570/full#supplementary-material
References
Ahmad, Z., Franz, B. A., McClain, C. R., Kwiatkowska, E. J., Werdell, J., Shettle, E. P., et al. (2010). New Aerosol Models for the Retrieval of Aerosol Optical Thickness and Normalized Water-Leaving Radiances from the SeaWiFS and MODIS Sensors over Coastal Regions and Open Oceans. Appl. Opt. 49, 5545–5560. doi:10.1364/AO.49.005545
Alikas, K., Ansko, I., Vabson, V., Ansper, A., Kangro, K., Uudeberg, K., et al. (2020). Consistency of Radiometric Satellite Data over Lakes and Coastal Waters with Local Field Measurements. Remote Sens. 12, 616. doi:10.3390/rs12040616
Allen, S. E., and Wolfe, M. A. (2013). Hindcast of the Timing of the Spring Phytoplankton Bloom in the Strait of Georgia, 1968-2010. Prog. Oceanogr. 115, 6–13. doi:10.1016/j.pocean.2013.05.026
Antoine, D., Guevel, P., Desté, J.-F., Bécu, G., Louis, F., Scott, A. J., et al. (2008). The “BOUSSOLE” Buoy-A New Transparent-To-Swell Taut Mooring Dedicated to Marine Optics: Design, Tests, and Performance at Sea. J. Atmos. Ocean. Technol. 25, 968–989. doi:10.1175/2007JTECHO563.1
Barnes, B. B., Cannizzaro, J. P., English, D. C., and Hu, C. (2019). Validation of VIIRS and MODIS Reflectance Data in Coastal and Oceanic Waters: An Assessment of Methods. Remote Sens. Environ. 220, 110–123. doi:10.1016/j.rse.2018.10.034
Brando, V., Lovell, J., King, E., Boadle, D., Scott, R., and Schroeder, T. (2016). The Potential of Autonomous Ship-Borne Hyperspectral Radiometers for the Validation of Ocean Color Radiometry Data. Remote Sens. 8, 150. doi:10.3390/rs8020150
Carswell, T., Costa, M., Young, E., Komick, N., Gower, J., and Sweeting, R. (2017). Evaluation of MODIS-Aqua Atmospheric Correction and Chlorophyll Products of Western North American Coastal Waters Based on 13 Years of Data. Remote Sens. 9, 1063–1124. doi:10.3390/rs9101063
Cazzaniga, I., Zibordi, G., and Mélin, F. (2021). Spectral Variations of the Remote Sensing Reflectance During Coccolithophore Blooms in the Western Black Sea. Remote Sens. Environ. 264, 112607. doi:10.1016/j.rse.2021.112607
Collins, A. K., Allen, S. E., and Pawlowicz, R. (2009). The Role of Wind in Determining the Timing of the Spring Bloom in the Strait of Georgia. Can. J. Fish. Aquat. Sci. 66, 1597–1616. doi:10.1139/F09-071
Cui, T. W., Zhang, J., Wang, K., Wei, J. W., Mu, B., Ma, Y., et al. (2020). Remote Sensing of Chlorophyll a Concentration in Turbid Coastal Waters Based on a Global Optical Water Classification System. ISPRS J. Photogrammetry Remote Sens. 163, 187–201. doi:10.1016/j.isprsjprs.2020.02.017
Environment and Climate Change Canada (2021a). Environment and Climate Change Canada. Available at: https://climate.weather.gc.ca/climate_data/hourly_data_e.html?hlyRange=1994-02-01%7C2019-01-29&dlyRange=1992-05-01%7C2019-01-29&mlyRange=1992-05-01%7C2006-07-01&StationID=29411&Prov=BC&urlExtension=_e.html&searchType=stnName&optLimit=yearRange&StartYear=1840&EndYear=2019&selRowPerPage=25&Line=1&searchMethod=contains&txtStationName=entrance+island&timeframe=1&Year=2016&Month=7&Day=5# (Accessed November, 2021).
Environment and Climate Change Canada (2021b). Available at: https://isdm.gc.ca/isdm-gdsi/waves-vagues/data-donnees/data-donnees-eng.asp?medsid=C46146 (Accessed November, 2021).
European Space Agency (2021). European Space Agency. Available at: https://sentinel.esa.int/web/sentinel/technical-guides/sentinel-3-olci/olci-instrument/spectral-response-function-data> (Accessed November, 2021).
Gao, H. X. (2005). Applied Mutivariable Statistic. Beijing, China: Peking University Publication House.
Garaba, S. P., Voß, D., Wollschläger, J., and Zielinski, O. (2015). Modern Approaches to Shipborne Ocean Color Remote Sensing. Appl. Opt. 54, 3602. doi:10.1364/ao.54.003602
Garaba, S. P., and Zielinski, O. (2013). Methods in Reducing Surface Reflected Glint for Shipborne Above-Water Remote Sensing. JEOSRP 8. doi:10.2971/jeos.2013.13058
Gege, P. (2014). WASI-2D: A Software Tool for Regionally Optimized Analysis of Imaging Spectrometer Data from Deep and Shallow Waters. Comput. Geosciences 62, 208–215. doi:10.1016/j.cageo.2013.07.022
Giannini, F., Hunt, B. P. V., Jacoby, D., and Costa, M. (2021). Performance of OLCI Sentinel-3A Satellite in the Northeast Pacific Coastal Waters. Remote Sens. Environ. 256, 112317. doi:10.1016/j.rse.2021.112317
Groetsch, P. M. M., Gege, P., Simis, S. G. H., Eleveld, M. A., and Peters, S. W. M. (2017). Validation of a Spectral Correction Procedure for Sun and Sky Reflections in Above-Water Reflectance Measurements. Opt. Express 25, A742. doi:10.1364/oe.25.00a742
Groom, S., Sathyendranath, S., Ban, Y., Bernard, S., Brewin, R., Brotas, V., et al. (2019). Satellite Ocean Colour: Current Status and Future Perspective. Front. Mar. Sci. 6. doi:10.3389/fmars.2019.00485
Haigh, R., Ianson, D., Holt, C. A., Neate, H. E., and Edwards, A. M. (2015). Effects of Ocean Acidification on Temperate Coastal Marine Ecosystems and Fisheries in the Northeast Pacific. PLoS ONE 10, e0117533–46. doi:10.1371/journal.pone.0117533
Halverson, M. J., and Pawlowicz, R. (2008). Estuarine Forcing of a River Plume by River Flow and Tides. J. Geophys. Res. 113. doi:10.1029/2008JC004844
Halverson, M., and Pawlowicz, R. (2011). Entrainment and Flushing Time in the Fraser River Estuary and Plume from a Steady Salt Balance Analysis. J. Geophys. Res. 116. doi:10.1029/2010JC006793
Hilborn, A., and Costa, M. (2018). Applications of DINEOF to Satellite-Derived Chlorophyll-A from a Productive Coastal Region. Remote Sens. 10, 1449–1513. doi:10.3390/rs10091449
Hlaing, S., Harmel, T., Gilerson, A., Foster, R., Weidemann, A., and Arnone, R. (2013). Evaluation of the VIIRS Ocean Color Monitoring Performance in Coastal Regions. Remote Sens. Environ. 139, 398–414. doi:10.1016/j.rse.2013.08.013
Hooker, S. B., Bernhard, G., Morrow, J. H., Booth, C. R., Comer, T., Lind, R. N., et al. (2012). Optical Sensors for Planetary Radiant Energy (OSPREy): Calibration and Validation of Current and Next-Generation NASA Missions. NASA Tech. Memo. 2011-215872. Greenbelt, Maryland: NASA Goddard Space Flight Center.
Hooker, S. B., Lazin, G., Zibordi, G., and Mclean, S. (2002). An Evaluation of Above- and In-Water Methods for Determining Water-Leaving Radiances. J. Atmos. Ocean. Technol. 19, 486–515. doi:10.1175/1520-0426(2002)019<0486:aeoaai>2.0.co;2
Hooker, S. B., and Morel, A. (2003). Platform and Environmental Effects on Above-Water Determinations of Water-Leaving Radiances. J. Atmos. Ocean. Technol. 20, 187–205. doi:10.1175/1520-0426(2003)020<0187:paeeoa>2.0.co;2
Ianson, D., Alllen, S., Gower, J., Paul, C., and Varela, D. (2018). Rogue Coccolithophore Bloom in the Strait of Georgia in 2016: Investigating Cause and Biogeochemical Consequences. Halifax: COMS.
Jackson, T., Sathyendranath, S., and Mélin, F. (2017). An Improved Optical Classification Scheme for the Ocean Colour Essential Climate Variable and its Applications. Remote Sens. Environ. 203, 152–161. doi:10.1016/j.rse.2017.03.036
Johannessen, S. C., Macdonald, R. W., and Paton, D. W. (2003). A Sediment and Organic Carbon Budget for the Greater Strait of Georgia. Estuar. Coast. Shelf Sci. 56, 845–860. doi:10.1016/S0272-7714(02)00303-7
Komick, N. M., Costa, M. P. F., and Gower, J. (2009). Bio-Optical Algorithm Evaluation for MODIS for Western Canada Coastal Waters: An Exploratory Approach Using In Situ Reflectance. Remote Sens. Environ. 113, 794–804. doi:10.1016/j.rse.2008.12.005
Kruse, F. A., Lefkoff, A. B., Boardman, J. W., Heidebrecht, K. B., Shapiro, A. T., Barloon, P. J., et al. (1993). The Spectral Image Processing System (SIPS)-Interactive Visualization and Analysis of Imaging Spectrometer Data. Remote Sens. Environ. 44, 145–163. doi:10.1016/0034-4257(93)90013-N
Le, C., Li, Y., Zha, Y., Sun, D., Huang, C., and Zhang, H. (2011). Remote Estimation of Chlorophyll a in Optically Complex Waters Based on Optical Classification. Remote Sens. Environ. 115, 725–737. doi:10.1016/j.rse.2010.10.014
Lee, Z., Ahn, Y.-H., Mobley, C., and Arnone, R. (2010). Removal of Surface-Reflected Light for the Measurement of Remote-Sensing Reflectance from an Above-Surface Platform. Opt. Express 18, 26313. doi:10.1364/oe.18.026313
Lee, Z., Carder, K. L., and Arnone, R. A. (2002). Deriving Inherent Optical Properties from Water Color: A Multiband Quasi-Analytical Algorithm for Optically Deep Waters. Appl. Opt. 41, 5755. doi:10.1364/ao.41.005755
Lee, Z. P., Du, K., Voss, K. J., Zibordi, G., Lubac, B., Arnone, R., et al. (2011). An Inherent-Optical-Property-Centered Approach to Correct the Angular Effects in Water-Leaving Radiance. Appl. Opt. 50, 3155–3167. doi:10.1364/AO.50.003155
Li, M., Gargett, A., and Denman, K. (2000). What Determines Seasonal and Interannual Variability of Phytoplankton and Zooplankton in Strongly Estuarine Systems? Estuar. Coast. Shelf Sci. 50, 467–488. doi:10.1006/ecss.2000.0593
Loos, E. A., and Costa, M. (2010). Inherent Optical Properties and Optical Mass Classification of the Waters of the Strait of Georgia, British Columbia, Canada. Prog. Oceanogr. 87, 144–156. doi:10.1016/j.pocean.2010.09.004
Masson, D. (2002). Deep Water Renewal in the Strait of Georgia. Estuar. Coast. Shelf Sci. 54, 115–126. doi:10.1006/ecss.2001.0833
Masson, D., and Peña, A. (2009). Chlorophyll Distribution in a Temperate Estuary: The Strait of Georgia and Juan de Fuca Strait. Estuar. Coast. Shelf Sci. 82, 19–28. doi:10.1016/j.ecss.2008.12.022
Masson, D. (2006). Seasonal Water Mass Analysis for the Straits of Juan de Fuca and Georgia. Atmosphere-Ocean 44, 1–15. doi:10.3137/ao.440101
Mobley, C. D. (1999). Estimation of the Remote-Sensing Reflectance from Above-Surface Measurements. Appl. Opt. 38, 7442–7455. doi:10.1364/AO.38.007442
Moore, T. S., Campbell, J. W., and Dowell, M. D. (2009). A Class-Based Approach to Characterizing and Mapping the Uncertainty of the MODIS Ocean Chlorophyll Product. Remote Sens. Environ. 113, 2424–2430. doi:10.1016/j.rse.2009.07.016
Moore, T. S., Dowell, M. D., Bradt, S., and Ruiz Verdu, A. (2014). An Optical Water Type Framework for Selecting and Blending Retrievals from Bio-Optical Algorithms in Lakes and Coastal Waters. Remote Sens. Environ. 143, 97–111. doi:10.1016/j.rse.2013.11.021
Moore, T. S., Dowell, M. D., and Franz, B. A. (2012). Detection of Coccolithophore Blooms in Ocean Color Satellite Imagery: A Generalized Approach for Use with Multiple Sensors. Remote Sens. Environ. 117, 249–263. doi:10.1016/j.rse.2011.10.001
Morel, A., Antoine, D., and Gentili, B. (2002). Bidirectional Reflectance of Oceanic Waters: Accounting for Raman Emission and Varying Particle Scattering Phase Function. Appl. Opt. 41, 6289. doi:10.1364/ao.41.006289
Morel, A., and Bricaud, A. (1981). Theoretical Results Concerning Light Absorption in a Discrete Medium, and Application to Specific Absorption of Phytoplankton. Deep Sea Res. Part A, Oceanogr. Res. Pap. 28, 1375–1393. doi:10.1016/0198-0149(81)90039-X
Morel, A., and Gentili, B. (1996). Diffuse Reflectance of Oceanic Waters III Implication of Bidirectionality for the Remote-Sensing Problem. Appl. Opt. 35, 4850. doi:10.1364/ao.35.004850
Müller, D., Krasemann, H., Brewin, R. J. W., Brockmann, C., Deschamps, P. Y., and Doerffer, R. (2015). The Ocean Colour Climate Change Initiative: I. A Methodology for Assessing Atmospheric Correction Processors Based on In-Situ Measurements. Remote Sens. Environ. 162, 242–256. doi:10.1016/j.rse.2013.11.026
Neukermans, G., and Fournier, G. (2018). Optical Modeling of Spectral Backscattering and Remote Sensing Reflectance from Emiliania Huxleyi Blooms. Front. Mar. Sci. 5, 1–20. doi:10.3389/fmars.2018.00146
Ottaviani, M., Foster, R., Gilerson, A., Ibrahim, A., Carrizo, C., El-Habashi, A., et al. (2018). Airborne and Shipborne Polarimetric Measurements Over Open Ocean and Coastal Waters: Intercomparisons and Implications for Spaceborne Observations. Remote Sens. Environ. 206, 375–390. doi:10.1016/j.rse.2017.12.015
Pawlowicz, R., di Costanzo, R., Halverson, M., Devred, E., and Johannessen, S. (2017). Advection, Surface Area, and Sediment Load of the Fraser River Plume Under Variable Wind and River Forcing. Atmosphere-Ocean 55, 293–313. doi:10.1080/07055900.2017.1389689
Pawlowicz, R., Hannah, C., and Rosenberger, A. (2019). Lagrangian Observations of Estuarine Residence Times, Dispersion, and Trapping in the Salish Sea. Estuar. Coast. Shelf Sci. 225, 106246. doi:10.1016/j.ecss.2019.106246
Phillips, S. R., and Costa, M. (2017). Spatial-Temporal Bio-Optical Classification of Dynamic Semi-Estuarine Waters in Western North America. Estuar. Coast. Shelf Sci. 199, 35–48. doi:10.1016/j.ecss.2017.09.029
Pospelova, V., Esenkulova, S., Johannessen, S. C., O'Brien, M. C., and Macdonald, R. W. (2010). Organic-Walled Dinoflagellate Cyst Production, Composition and Flux from 1996 to 1998 in the Central Strait of Georgia (BC, Canada): A Sediment Trap Study. Mar. Micropaleontol. 75, 17–37. doi:10.1016/j.marmicro.2010.02.003
Rosenfield, G. H., and Fitzpatrick-Lins, K. (1984). In Analysis of A Classification Error Matrix Using Categorical Data Techniques. Editor ND Sioux Falls (USA: IEEE).
Ruddick, K. G., De Cauwer, V., Park, Y.-J., and Moore, G. (2006). Seaborne Measurements of Near Infrared Water-Leaving Reflectance: The Similarity Spectrum for Turbid Waters. Limnol. Oceanogr. 51, 1167–1179. doi:10.4319/lo.2006.51.2.1167
Ruddick, K. G., Voss, K., Boss, E., Castagna, A., Frouin, R., Gilerson, A., et al. (2019). A Review of Protocols for Fiducial Reference Measurements of WaterLeaving Radiance for Validation of Satellite Remote-Sensing Data Over Water. Remote Sens. 11, 2198. doi:10.3390/rs11192198
Sathyendranath, S., Brewin, R. J. W., Jackson, T., Mélin, F., and Platt, T. (2017). Ocean-Colour Products for Climate-Change Studies: What Are Their Ideal Characteristics? Remote Sens. Environ. 203, 125–138. doi:10.1016/j.rse.2017.04.017
Simis, S. G. H., and Olsson, J. (2013). Unattended Processing of Shipborne Hyperspectral Reflectance Measurements. Remote Sens. Environ. 135, 202–212. doi:10.1016/j.rse.2013.04.001
Suchy, K. D., le Baron, N., Hilborn, A., Perry, R. I., and Costa, M. (2019). Influence of Environmental Drivers on Spatio-Temporal Dynamics of Satellite-Derived Chlorophyll a in the Strait of Georgia. Prog. Oceanogr. 176, 102134. doi:10.1016/j.pocean.2019.102134
Talone, M., Zibordi, G., and Lee, Z. (2018). Correction for the Non-Nadir Viewing Geometry of AERONET-OC Above Water Radiometry Data: an Estimate of Uncertainties. Opt. Express 26, A541. doi:10.1364/oe.26.00a541
Talone, M., and Zibordi, G. (2019). Spectral Assessment of Deployment Platform Perturbations in Above-Water Radiometry. Opt. Express 27, A878. doi:10.1364/oe.27.00a878
Tilstone, G., Dall’Olmo, G., Hieronymi, M., Ruddick, K., Beck, M., Ligi, M., et al. (2020). Field Intercomparison of Radiometer Measurements for Ocean Colour Validation. Remote Sens. 12, 1587. doi:10.3390/rs12101587
Travers-Smith, H., Giannini, F., Sastri, A. R., and Costa, M. (2021). Validation of Non-Photochemical Quenching Corrections for Chlorophyll-A Measurements Aboard Ships of Opportunity. Front. Mar. Sci. 8, 1–15. doi:10.3389/fmars.2021.686750
Vabson, V., Kuusk, J., Ansko, I., Vendt, R., Alikas, K., Ruddick, K., et al. (2019). Field Intercomparison of Radiometers Used for Satellite Validation in the 400-900 Nm Range. Remote Sens. 11, 1129. doi:10.3390/rs11091129
Valente, A., Sathyendranath, S., Brotas, V., Groom, S., Grant, M., Taberner, M., et al. (2019). A Compilation of Global Bio-Optical In Situ Data for Ocean-Colour Satellite Applications - Version Two. Earth Syst. Sci. Data 11, 1037–1068. doi:10.5194/essd-11-1037-2019
Vandenberg, N., Costa, M., Coady, Y., and Agbaje, T. (2017). “PySciDON: A Python Scientific Framework for Development of Ocean Network Applications,” in 2017 IEEE Pacific Rim Conference on Communications, Computers and Signal Processing, PACRIM, Victoria, BC, Canada, 21-23 Aug. 2017. doi:10.1109/PACRIM.2017.8121926
Vanhellemont, Q., and Ruddick, K. (2021). Atmospheric Correction of Sentinel-3/OLCI Data for Mapping of Suspended Particulate Matter and Chlorophyll-A Concentration in Belgian Turbid Coastal Waters. Remote Sens. Environ. 256, 112284. doi:10.1016/j.rse.2021.112284
Vansteenwegen, D., Ruddick, K., Cattrijsse, A., Vanhellemont, Q., and Beck, M. (2019). The Pan-And-Tilt Hyperspectral Radiometer System (PANTHYR) for Autonomous Satellite Validation Measurements-Prototype Design and Testing. Remote Sens. 11, 1360. doi:10.3390/rs11111360
Wei, J., Lee, Z., and Shang, S. (2016). A System to Measure the Data Quality of Spectral Remote Sensing Reflectance of Aquatic Environments. J. Geophys. Res. Oceans 121, 8189–8207. doi:10.1002/2016JC012126
Wei, J., Yu, X., Lee, Z., Wang, M., and Jiang, L. (2020). Improving Low-Quality Satellite Remote Sensing Reflectance at Blue Bands over Coastal and Inland Waters. Remote Sens. Environ. 250, 112029. doi:10.1016/j.rse.2020.112029
Werdell, P. J., McKinna, L. I. W., Boss, E., Ackleson, S. G., Craig, S. E., Gregg, W. W., et al. (2018). An Overview of Approaches and Challenges for Retrieving Marine Inherent Optical Properties from Ocean Color Remote Sensing. Prog. Oceanogr. 160, 186–212. doi:10.1016/j.pocean.2018.01.001
Wernand, M. R. (2002). Guidelines for (Ship-Borne) Auto-Monitoring of Coastal and Ocean Colour. Oceanographic Society. Proceedings of Ocean Optics XVI, Santa-Fe, NM, USA, November 18-22, 2002.
Yunker, M. B., and Macdonald, R. W. (2003). Alkane and PAH Depositional History, Sources and Fluxes in Sediments from the Fraser River Basin and Strait of Georgia, Canada. Org. Geochem. 34, 1429–1454. doi:10.1016/S0146-6380(03)00136-0
Zibordi, G. (2016). Experimental Evaluation of Theoretical Sea Surface Reflectance Factors Relevant to Above-Water Radiometry. Opt. Express 24, A446. doi:10.1364/oe.24.00a446
Zibordi, G., Melin, F., and Berthon, J.-F. (2018). A Regional Assessment of OLCI Data Products. IEEE Geosci. Remote Sens. Lett. 15, 1490–1494. doi:10.1109/LGRS.2018.2849329
Zibordi, G., Mélin, F., Berthon, J.-F., Holben, B., Slutsker, I., Giles, D., et al. (2009). AERONET-OC: A Network for the Validation of Ocean Color Primary Products. J. Atmos. Ocean. Technol. 26, 1634–1651. doi:10.1175/2009JTECHO654.1
Zibordi, G., Mélin, F., Berthon, J.-F., and Talone, M. (2015a). In Situ Autonomous Optical Radiometry Measurements for Satellite Ocean Color Validation in the Western Black Sea. Ocean. Sci. 11, 275–286. doi:10.5194/os-11-275-2015
Zibordi, G., Mélin, F., Voss, K. J., Johnson, B. C., Franz, B. A., Kwiatkowska, E., et al. (2015b). System Vicarious Calibration for Ocean Color Climate Change Applications: Requirements for In Situ Data. Remote Sens. Environ. 159, 361–369. doi:10.1016/j.rse.2014.12.015
Keywords: SAS Solar Tracker, ship superstructure perturbation correction, BRDF correction, data quality evaluation, reflectance
Citation: Wang Z and Costa M (2022) Autonomous Shipborne In Situ Reflectance Data in Optically Complex Coastal Waters: A Case Study of the Salish Sea, Canada. Front. Remote Sens. 3:867570. doi: 10.3389/frsen.2022.867570
Received: 01 February 2022; Accepted: 19 April 2022;
Published: 30 June 2022.
Edited by:
Lian Feng, Southern University of Science and Technology, ChinaReviewed by:
Peter Gege, German Aerospace Center (DLR), GermanyMatteo Ottaviani, National Aeronautics and Space Administration (NASA), United States
Copyright © 2022 Wang and Costa. This is an open-access article distributed under the terms of the Creative Commons Attribution License (CC BY). The use, distribution or reproduction in other forums is permitted, provided the original author(s) and the copyright owner(s) are credited and that the original publication in this journal is cited, in accordance with accepted academic practice. No use, distribution or reproduction is permitted which does not comply with these terms.
*Correspondence: Ziwei Wang, ziweiwang@uvic.ca
 Ziwei Wang
 Maycira Costa